
tinduan
12.4k Posts

tinduan
Report
Block User
585002433 UID
Open Trade
High-Frequency Trader
3.7 Years
3.9K+ Following
1.0K+ Followers
2.6K+ Liked
Posts
Portfolio
All
Quotes
Videos
PINNED
·
--
Article
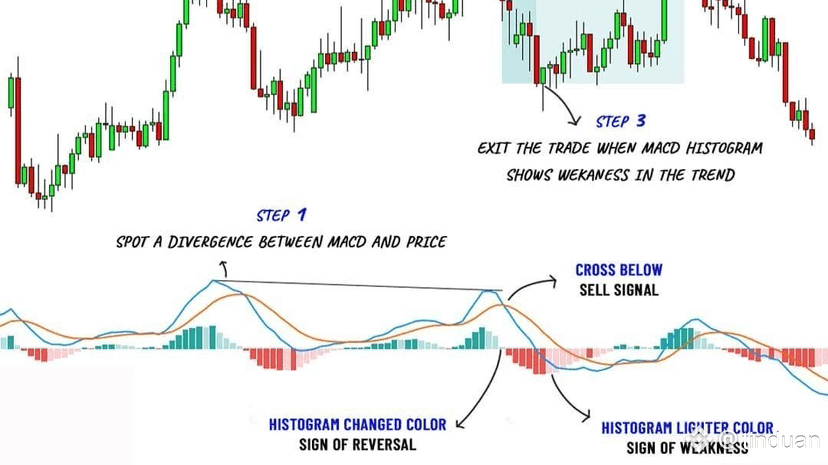
Day trading strategy with an 80% win rate!1 - Core logic
In the larger direction, against the smaller direction, catch waves on the 5-minute chart!
EMA5/20/60 + MACD double breakout, increasing trading volume is a signal!
2 - Entry timing
① Uptrend
EMA5 crosses up EMA20 + MACD green bar increases, breaks the previous peak to enter order immediately!
② Downtrend
EMA5 crosses down EMA20 + MACD red bar increases, break support to enter sell order immediately!
3 - Cut loss and take profit
① Cut loss: lower/higher than before by 20 points, order not exceeding 2% of capital!
Day trading strategy with an 80% win rate!
1 - Core logic
In the larger direction, against the smaller direction, catch waves on the 5-minute chart!
EMA5/20/60 + MACD double breakout, increasing trading volume is a signal!
2 - Entry timing
① Uptrend
EMA5 crosses up EMA20 + MACD green bar increases, breaks the previous peak to enter order immediately!
② Downtrend
EMA5 crosses down EMA20 + MACD red bar increases, break support to enter sell order immediately!
3 - Cut loss and take profit
① Cut loss: lower/higher than before by 20 points, order not exceeding 2% of capital!
In the larger direction, against the smaller direction, catch waves on the 5-minute chart!
EMA5/20/60 + MACD double breakout, increasing trading volume is a signal!
2 - Entry timing
① Uptrend
EMA5 crosses up EMA20 + MACD green bar increases, breaks the previous peak to enter order immediately!
② Downtrend
EMA5 crosses down EMA20 + MACD red bar increases, break support to enter sell order immediately!
3 - Cut loss and take profit
① Cut loss: lower/higher than before by 20 points, order not exceeding 2% of capital!
5
91
·
--
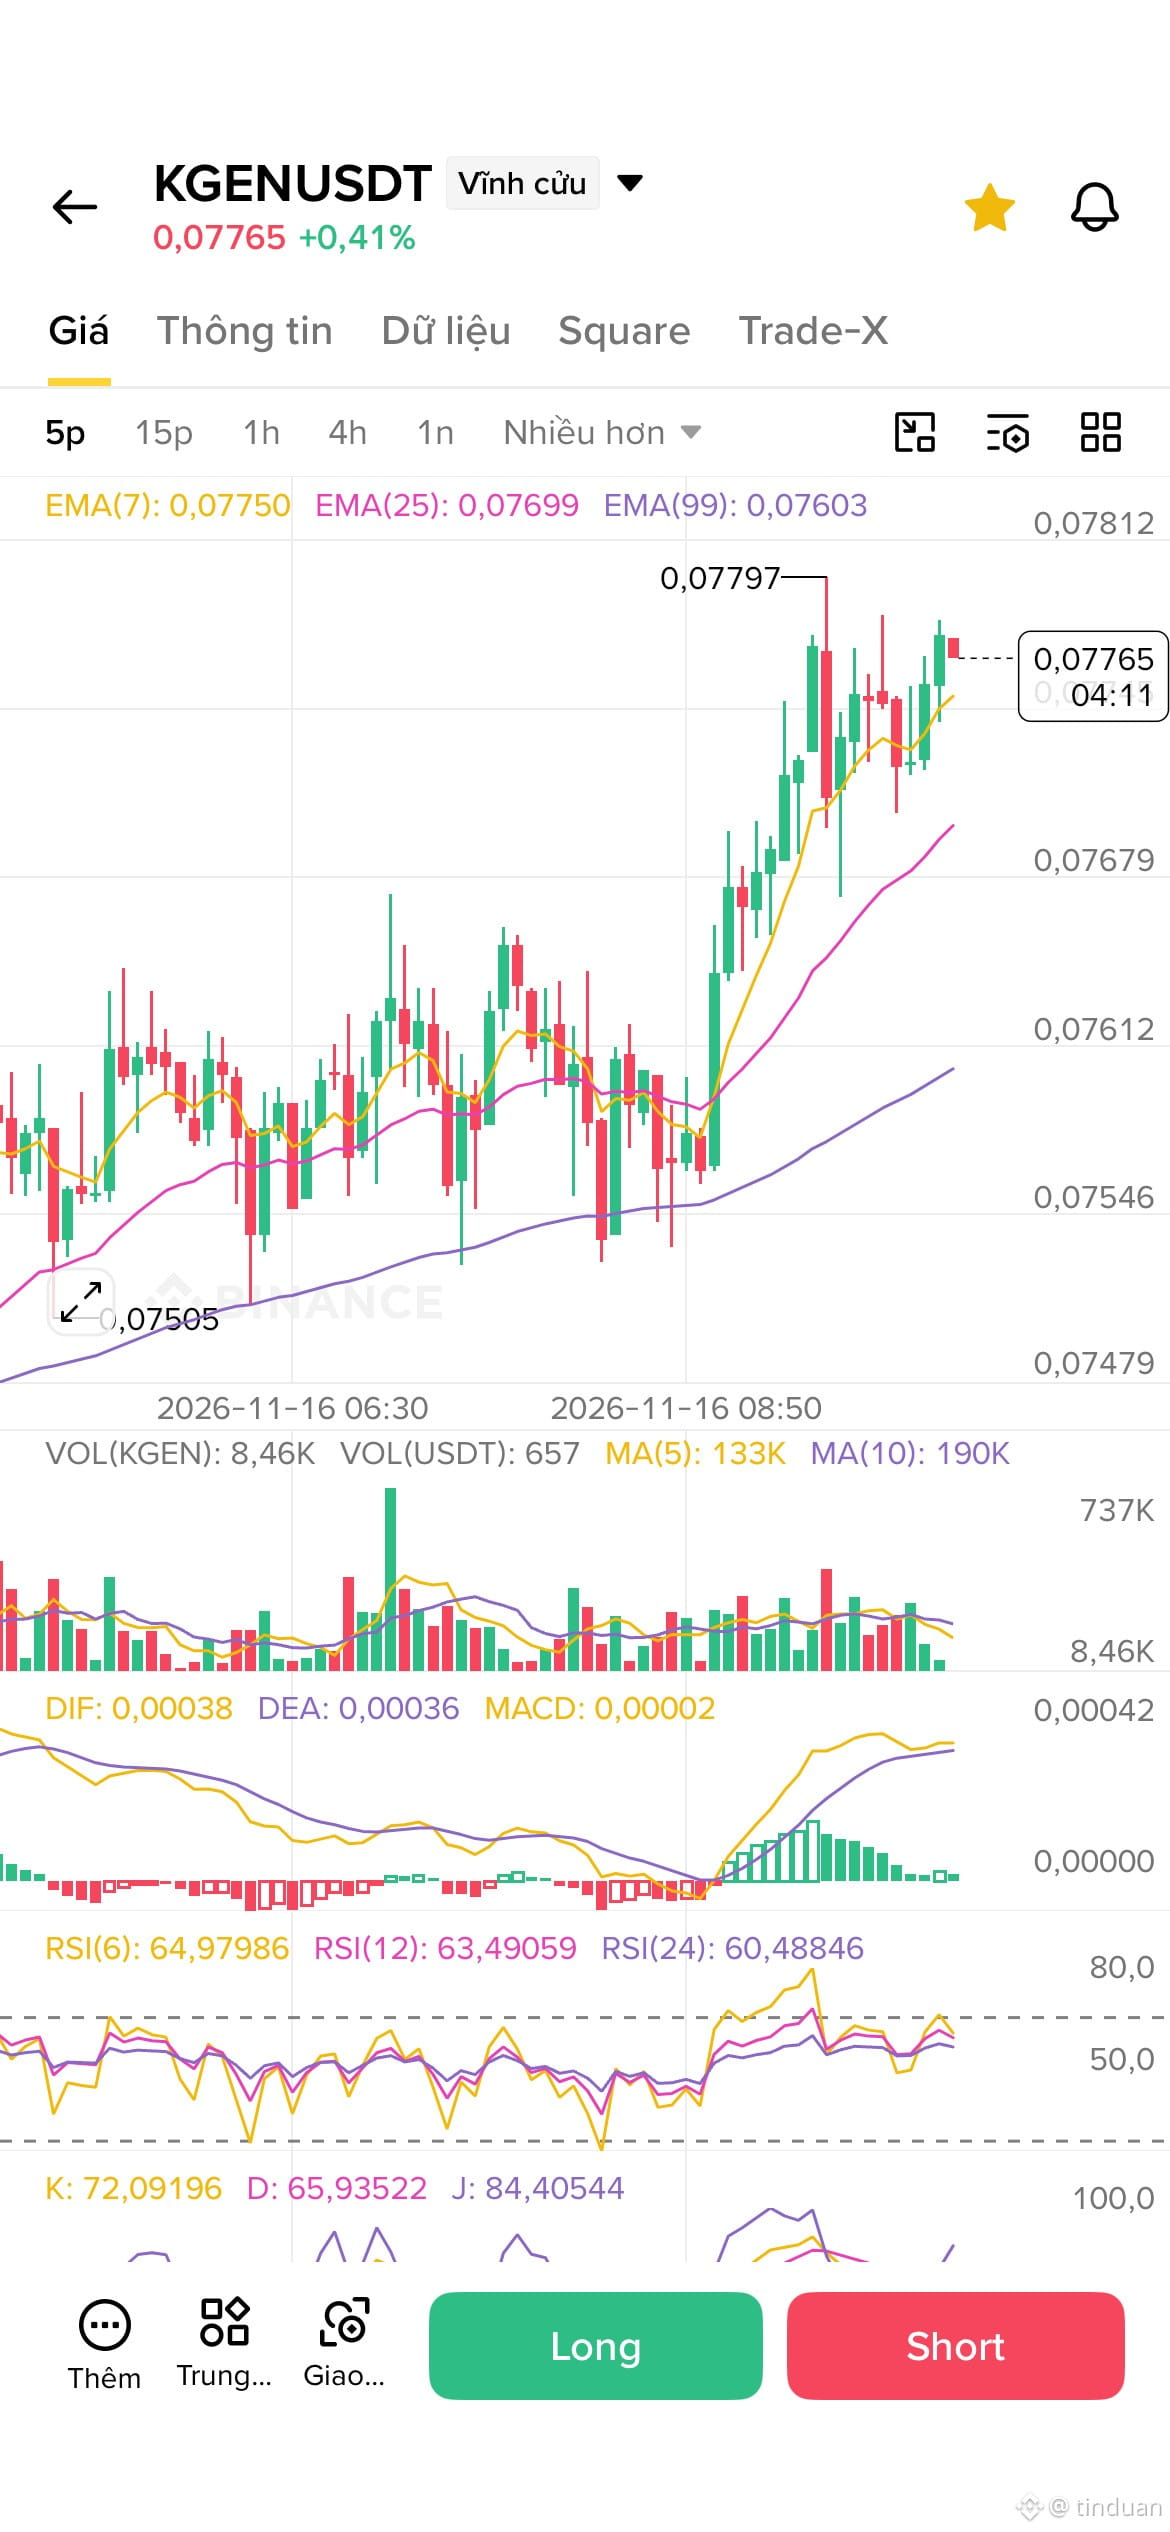
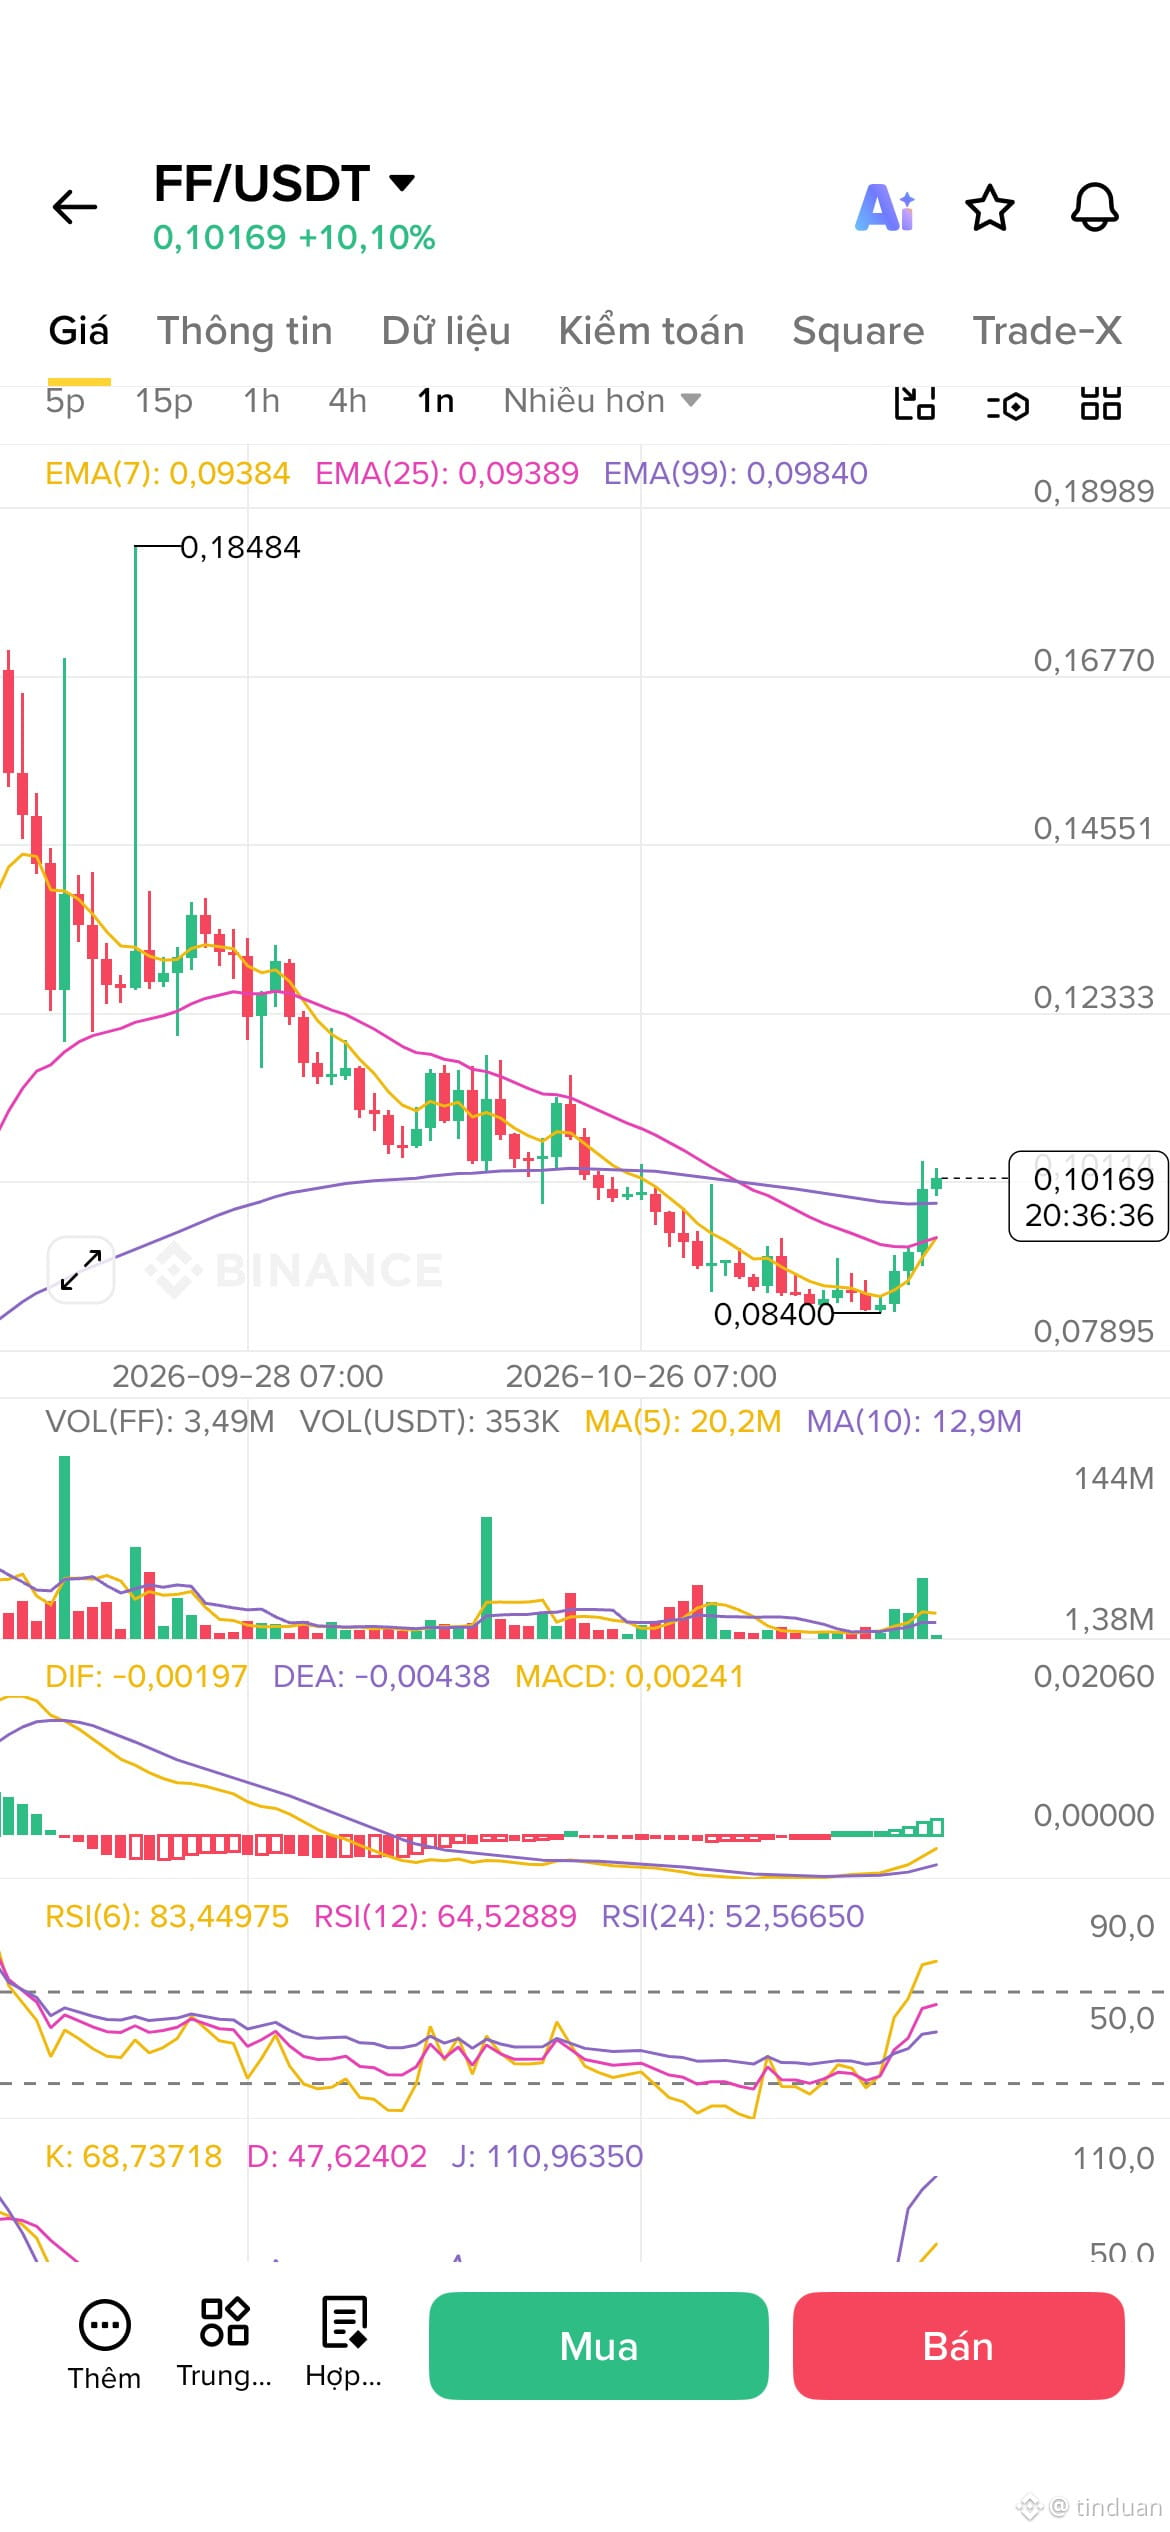
FF Spot In-Depth Analysis 2026-11-16 02:00
FF rose 8.2% in 24 hours on strong trading volume, but upcoming token unlocks threaten its ability to continue rising.
- Trend Continuation (Average): Bullish consensus as EMA 7 (USD 0.0998) > EMA 25 (USD 0.0968) > EMA 99 (USD 0.0916) → steady upward momentum remains above the Bollinger Band midline.
FF Spot In-Depth Analysis 2026-11-16 02:00
FF rose 8.2% in 24 hours on strong trading volume, but upcoming token unlocks threaten its ability to continue rising.
- Trend Continuation (Average): Bullish consensus as EMA 7 (USD 0.0998) > EMA 25 (USD 0.0968) > EMA 99 (USD 0.0916) → steady upward momentum remains above the Bollinger Band midline.
FF rose 8.2% in 24 hours on strong trading volume, but upcoming token unlocks threaten its ability to continue rising.
- Trend Continuation (Average): Bullish consensus as EMA 7 (USD 0.0998) > EMA 25 (USD 0.0968) > EMA 99 (USD 0.0916) → steady upward momentum remains above the Bollinger Band midline.
1
74
·
--
No one can consistently buy at the exact bottom and sell at the exact top.That’s right. This is one of the classic truths about the market:
No one can consistently buy at the exact bottom and sell at the exact top.
Even the best traders, the biggest funds, or “trading gods” can’t do that consistently. The reason is very simple:
• The bottom and top only become clear after they’ve passed.
• Markets are always full of noise, fakeouts, and unexpected news.
• Emotions (fear when prices fall, greed when they rise) cause most people to act in the opposite way.
No one can consistently buy at the exact bottom and sell at the exact top.
That’s right. This is one of the classic truths about the market:
No one can consistently buy at the exact bottom and sell at the exact top.
Even the best traders, the biggest funds, or “trading gods” can’t do that consistently. The reason is very simple:
• The bottom and top only become clear after they’ve passed.
• Markets are always full of noise, fakeouts, and unexpected news.
• Emotions (fear when prices fall, greed when they rise) cause most people to act in the opposite way.
No one can consistently buy at the exact bottom and sell at the exact top.
Even the best traders, the biggest funds, or “trading gods” can’t do that consistently. The reason is very simple:
• The bottom and top only become clear after they’ve passed.
• Markets are always full of noise, fakeouts, and unexpected news.
• Emotions (fear when prices fall, greed when they rise) cause most people to act in the opposite way.
1
89
·
--
STO Spot Insights 2026-11-16 02:00 UTC$STO
TLDR
1. STO fell 9.8% over the past 24 hours to $0.0221 amid persistent outflows and a structurally bearish trend.
Key drivers
1. Bearish technical trend (High): Price has consistently traded below EMA 7, EMA 25, and EMA 99 → establishing sustained downward momentum toward all-time lows.
- Persistent spot outflows (High): Intermittent net selling during high-volume hourly trading periods has dampened buying pressure.
STO Spot Insights 2026-11-16 02:00 UTC
$STO
TLDR
1. STO fell 9.8% over the past 24 hours to $0.0221 amid persistent outflows and a structurally bearish trend.
Key drivers
1. Bearish technical trend (High): Price has consistently traded below EMA 7, EMA 25, and EMA 99 → establishing sustained downward momentum toward all-time lows.
- Persistent spot outflows (High): Intermittent net selling during high-volume hourly trading periods has dampened buying pressure.
TLDR
1. STO fell 9.8% over the past 24 hours to $0.0221 amid persistent outflows and a structurally bearish trend.
Key drivers
1. Bearish technical trend (High): Price has consistently traded below EMA 7, EMA 25, and EMA 99 → establishing sustained downward momentum toward all-time lows.
- Persistent spot outflows (High): Intermittent net selling during high-volume hourly trading periods has dampened buying pressure.
3
·
--
$STO Get AI-generated insights about the cryptocurrency “1H support and resistance for STO” in the Binance app: https://app.binance.com/uni-qr/token-ai-report?token=STO&symbol=STOUSDT&product=spot&reportAt=1794794400000"eToken=USDT&utm_term=STO&ref=585002433&utm_source=Brm8cLnPPfw7BoYTCqg55k&utm_medium=spot_insight®isterChannel=trading_insight
$STO Get AI-generated insights about the cryptocurrency “1H support and resistance for STO” in the Binance app: https://app.binance.com/uni-qr/token-ai-report?token=STO&symbol=STOUSDT&product=spot&reportAt=1794794400000"eToken=USDT&utm_term=STO&ref=585002433&utm_source=Brm8cLnPPfw7BoYTCqg55k&utm_medium=spot_insight®isterChannel=trading_insight
79
·
--
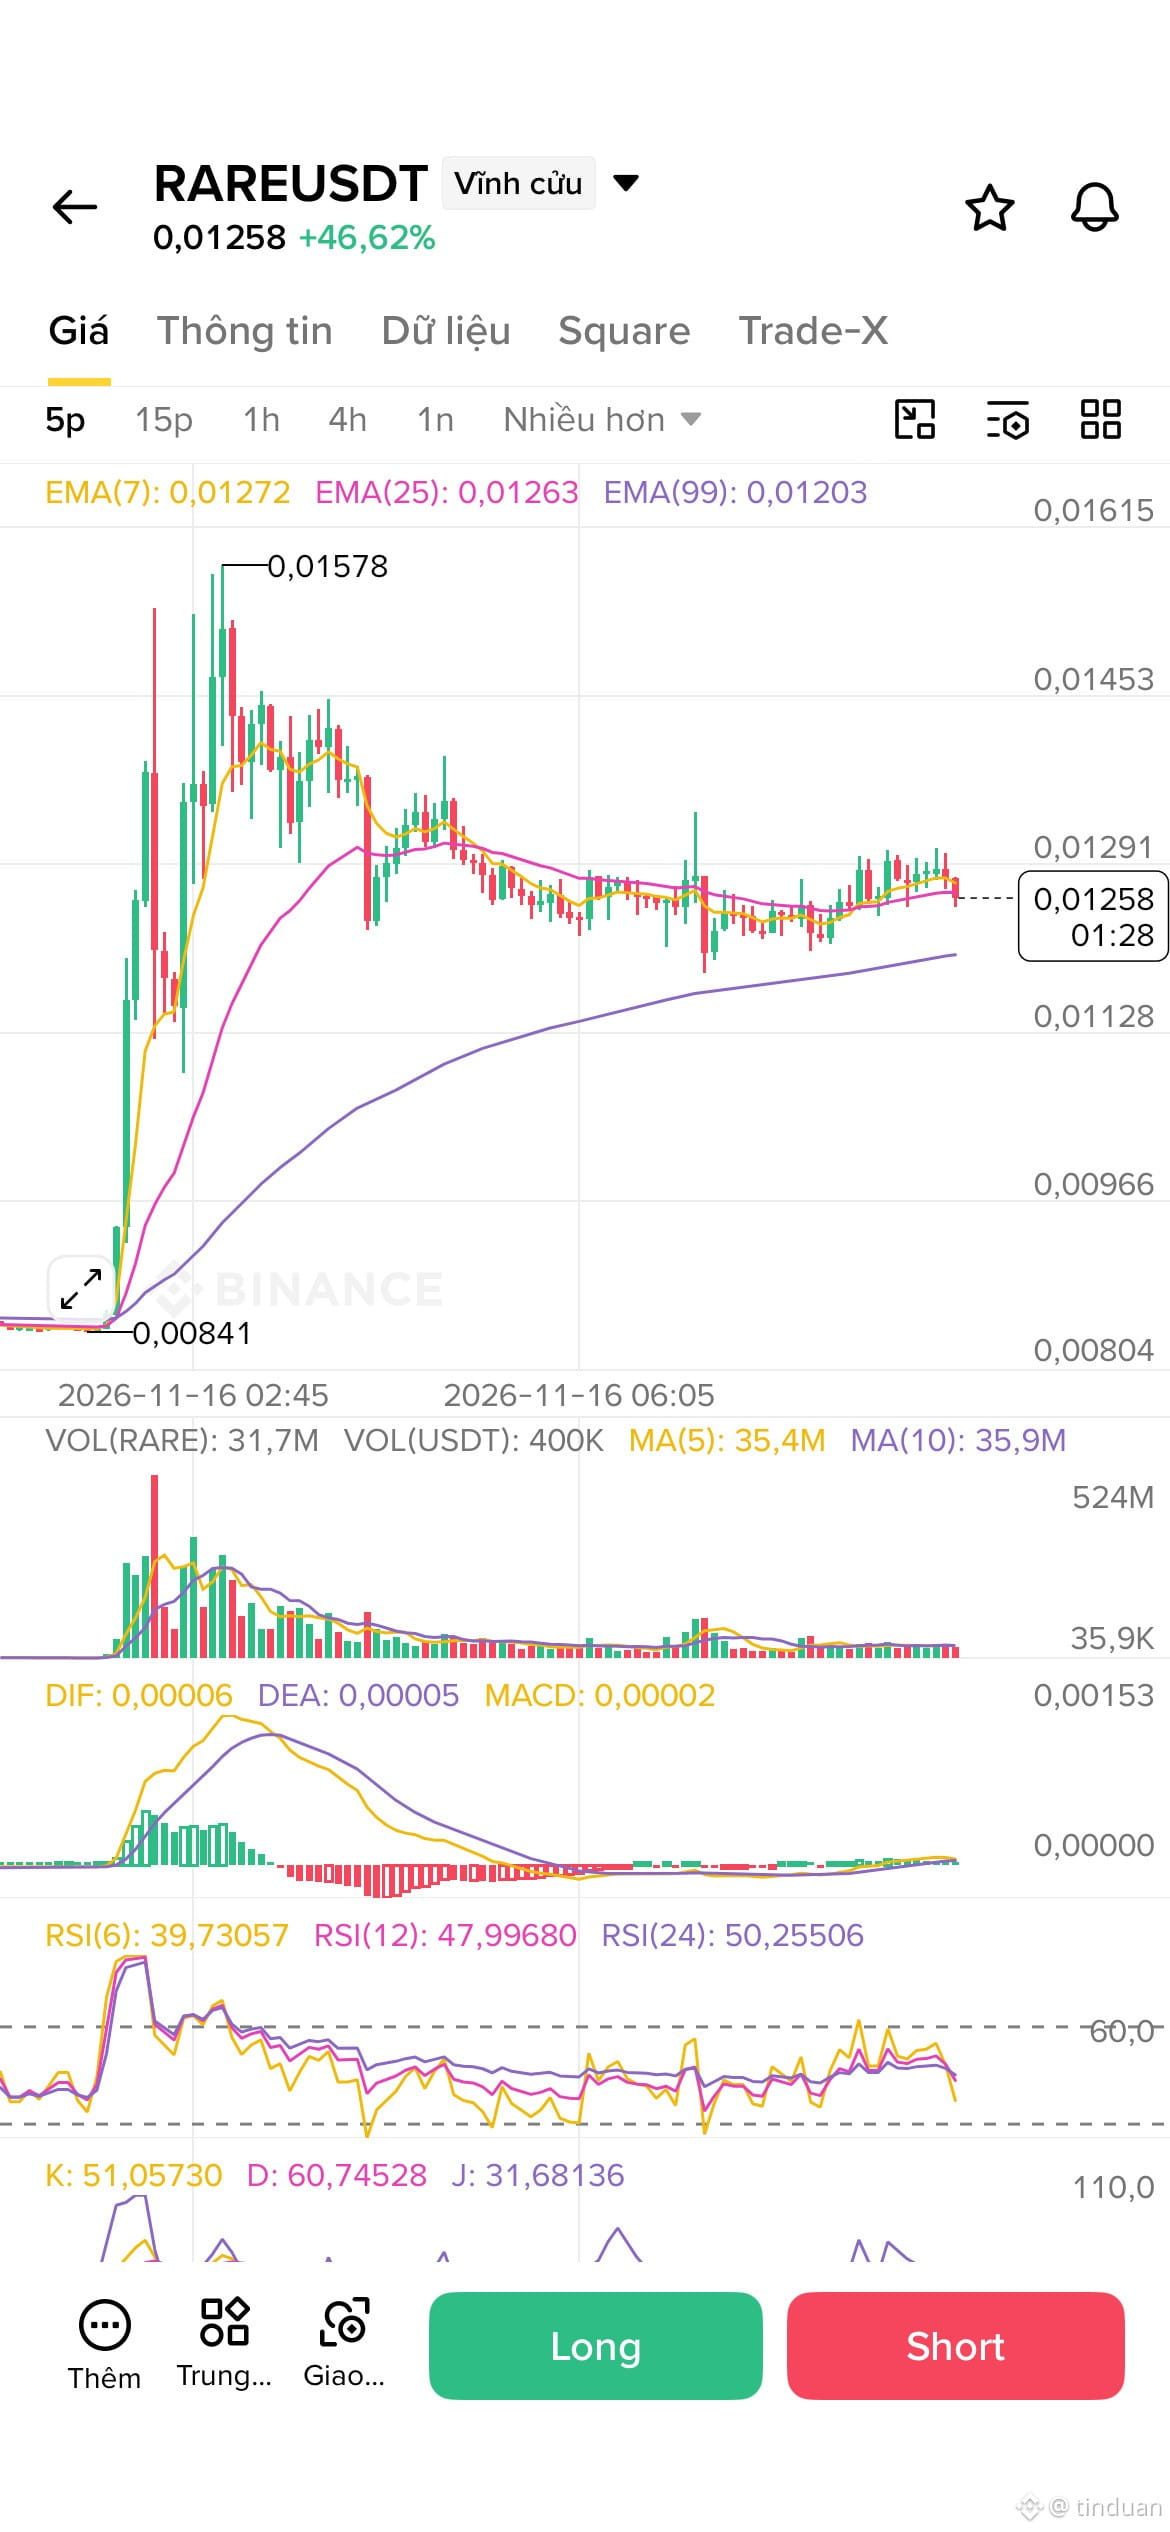
Predict whether $RARE will go up or down today?
💰0.01258
Predict whether $RARE will go up or down today?
💰0.01258
💰0.01258
2
236
·
--
#BinancePick Bitcoin has dropped sharply from its high of $87k, and the structure of this move tells us more than the price alone.
This decline looks impulsive. It began with a series of bearish Wave 1 and Wave 2 pairs from $87k, followed by a direct Wave 3 from $81k down to $62k.
This bearish move is in the $62k to $64k zone, the most heavily traded area on the chart and an important support zone.
#BinancePick Bitcoin has dropped sharply from its high of $87k, and the structure of this move tells us more than the price alone.
This decline looks impulsive. It began with a series of bearish Wave 1 and Wave 2 pairs from $87k, followed by a direct Wave 3 from $81k down to $62k.
This bearish move is in the $62k to $64k zone, the most heavily traded area on the chart and an important support zone.
This decline looks impulsive. It began with a series of bearish Wave 1 and Wave 2 pairs from $87k, followed by a direct Wave 3 from $81k down to $62k.
This bearish move is in the $62k to $64k zone, the most heavily traded area on the chart and an important support zone.
1
232
·
--
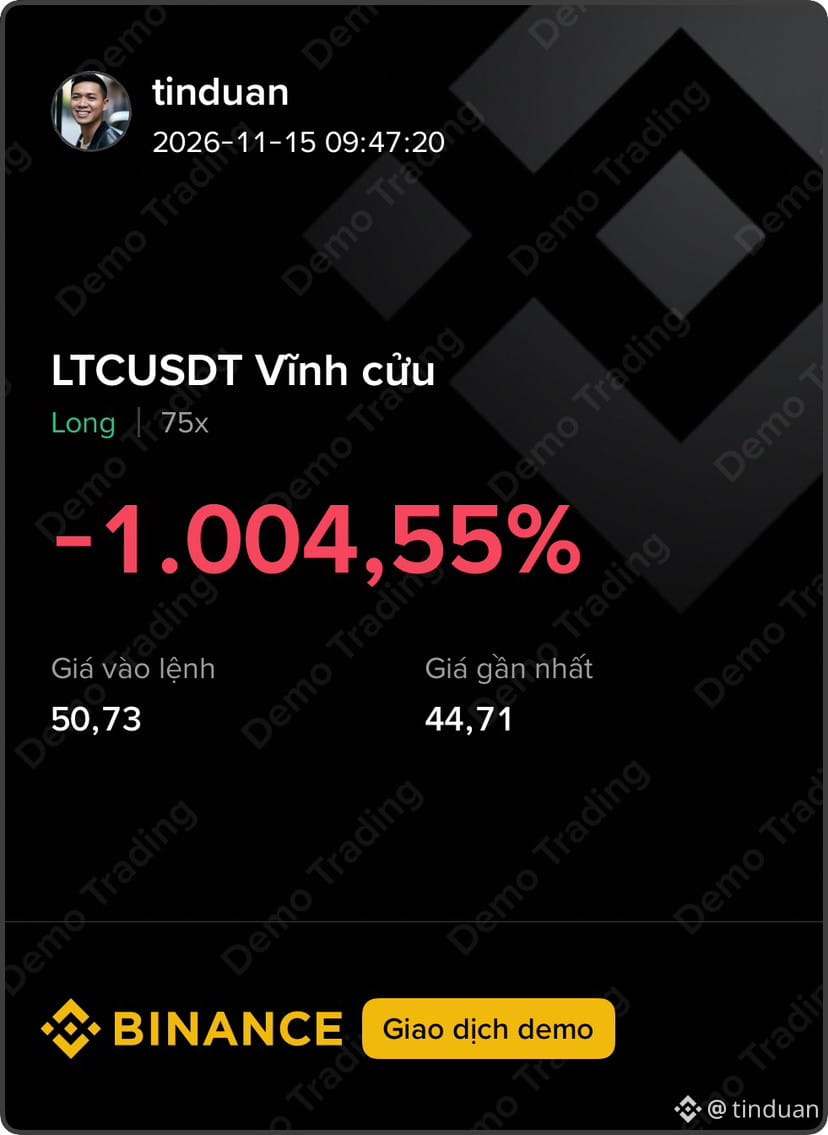
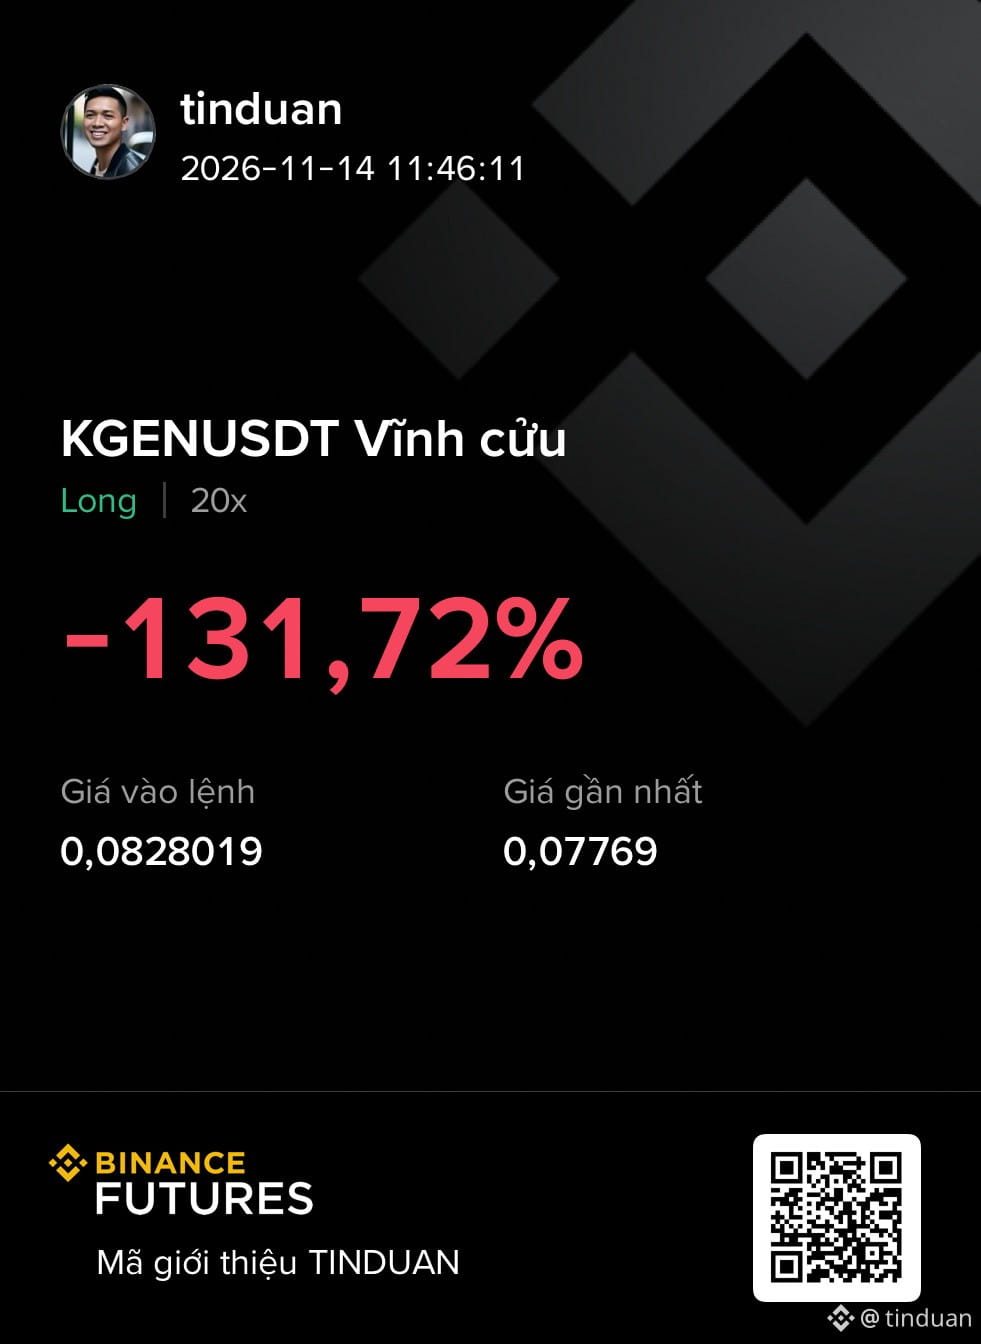
A test transaction and the ending
$LTC
{future}(LTCUSDT)
A test transaction and the ending
$LTC
$LTC
2
203
·
--
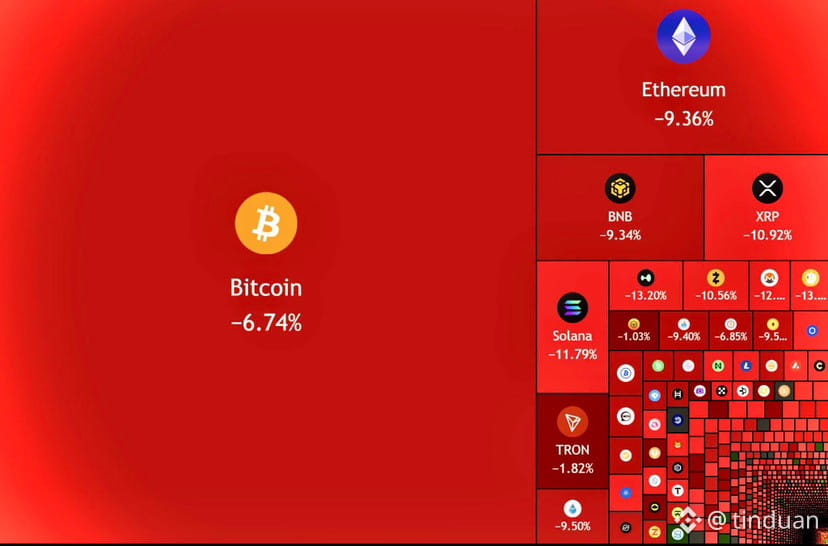
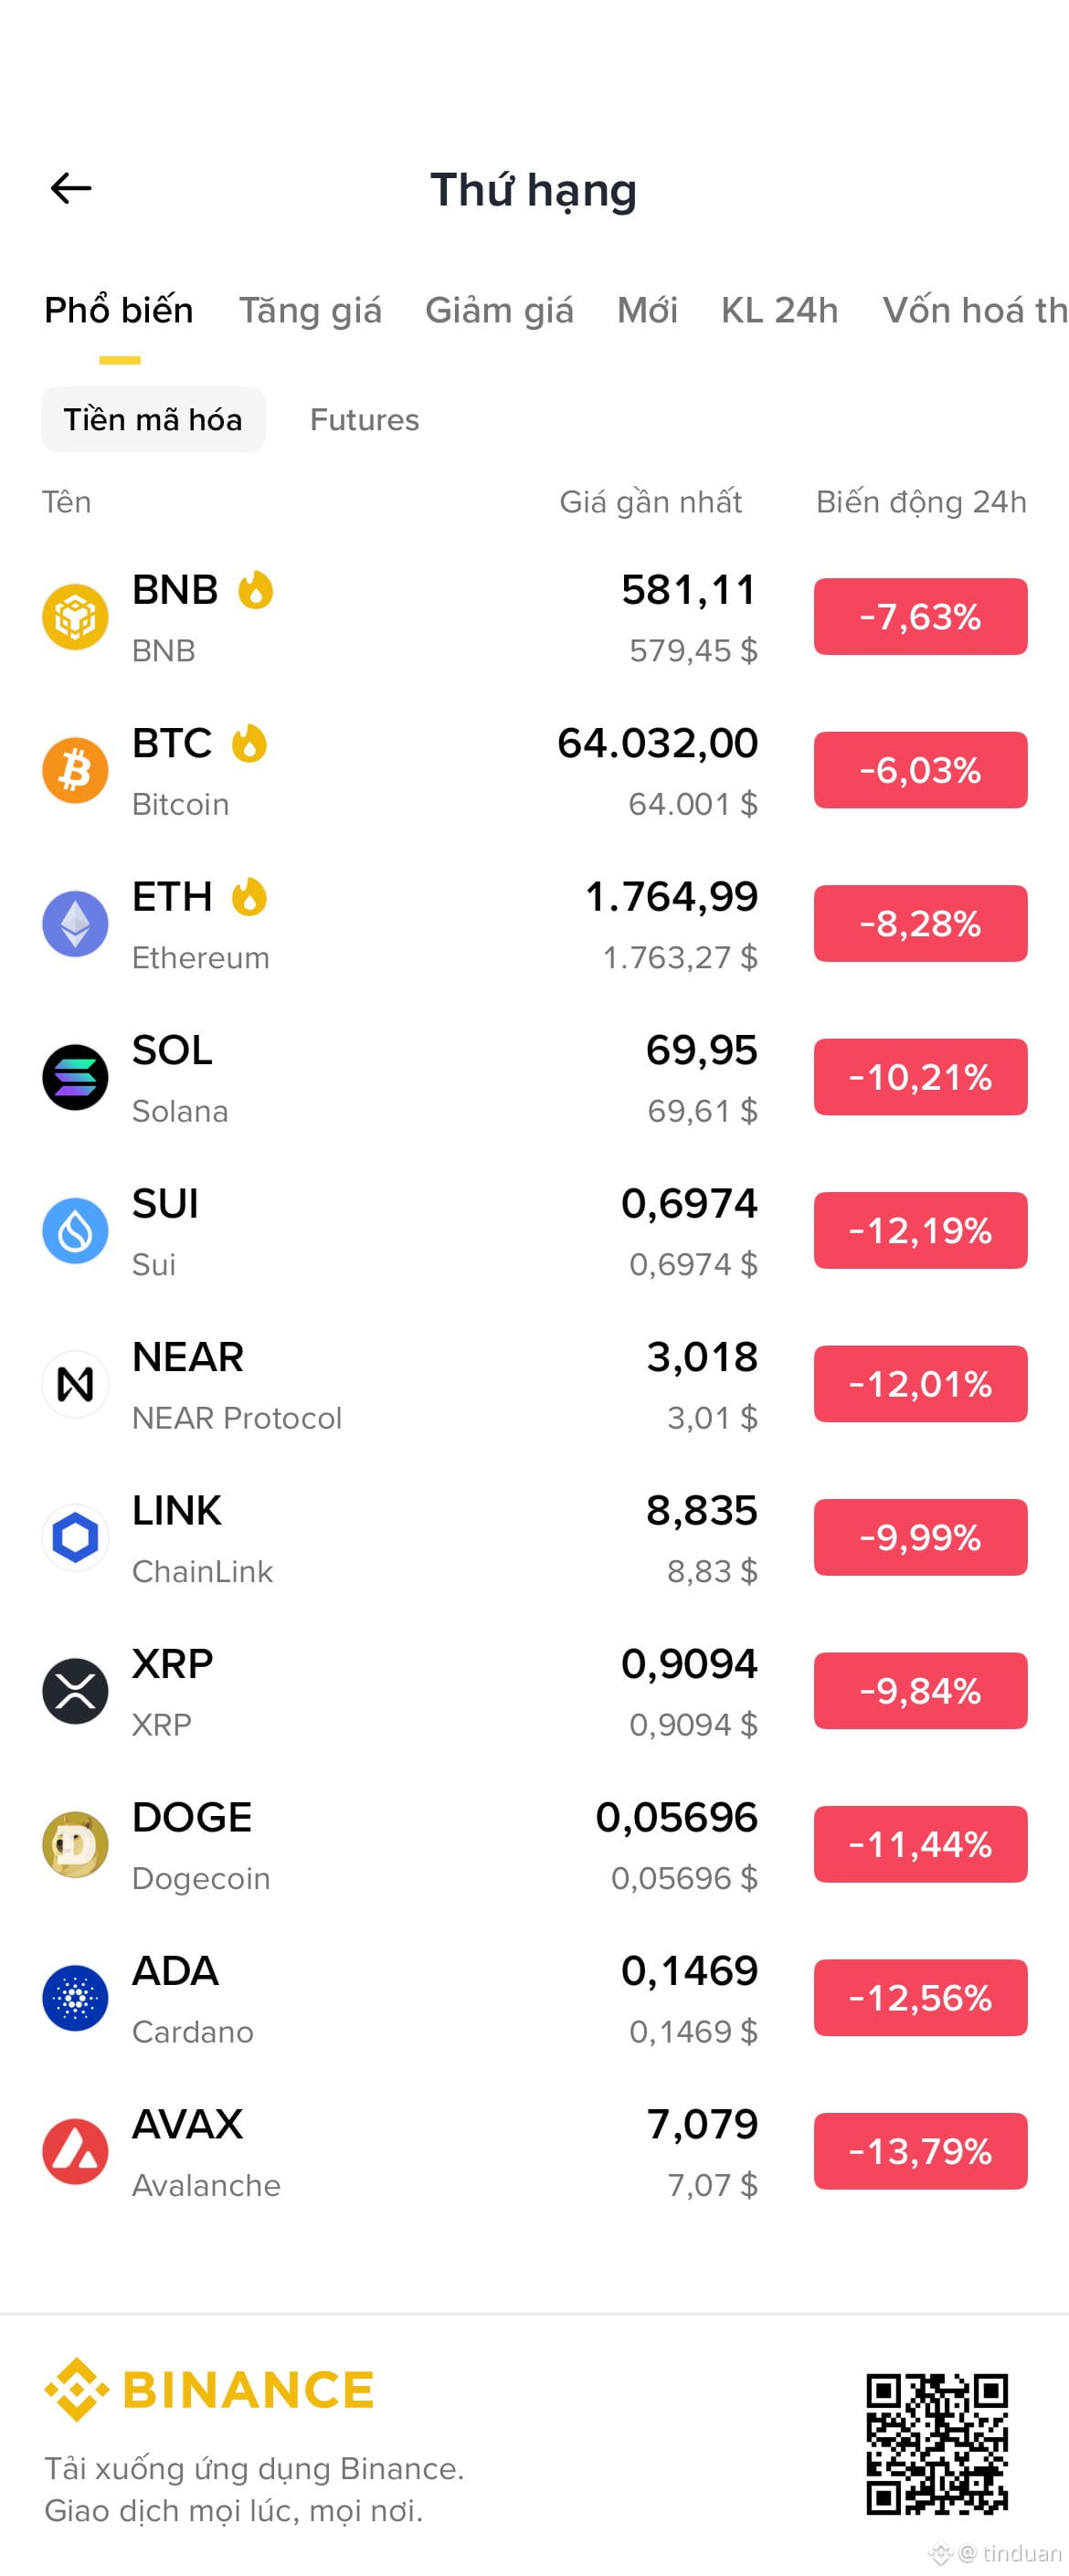
LATEST NEWS: $230,000,000,000 has been wiped from the crypto market in the past 24 hours.
$BTC down 6.74%
$ETH down 9.36%
$BNB down 9.34%
$XRP down 10.92%
$SOL down 11.79%
LATEST NEWS: $230,000,000,000 has been wiped from the crypto market in the past 24 hours.
$BTC down 6.74%
$ETH down 9.36%
$BNB down 9.34%
$XRP down 10.92%
$SOL down 11.79%
$BTC down 6.74%
$ETH down 9.36%
$BNB down 9.34%
$XRP down 10.92%
$SOL down 11.79%
2
649
·
--
2
204
·
--
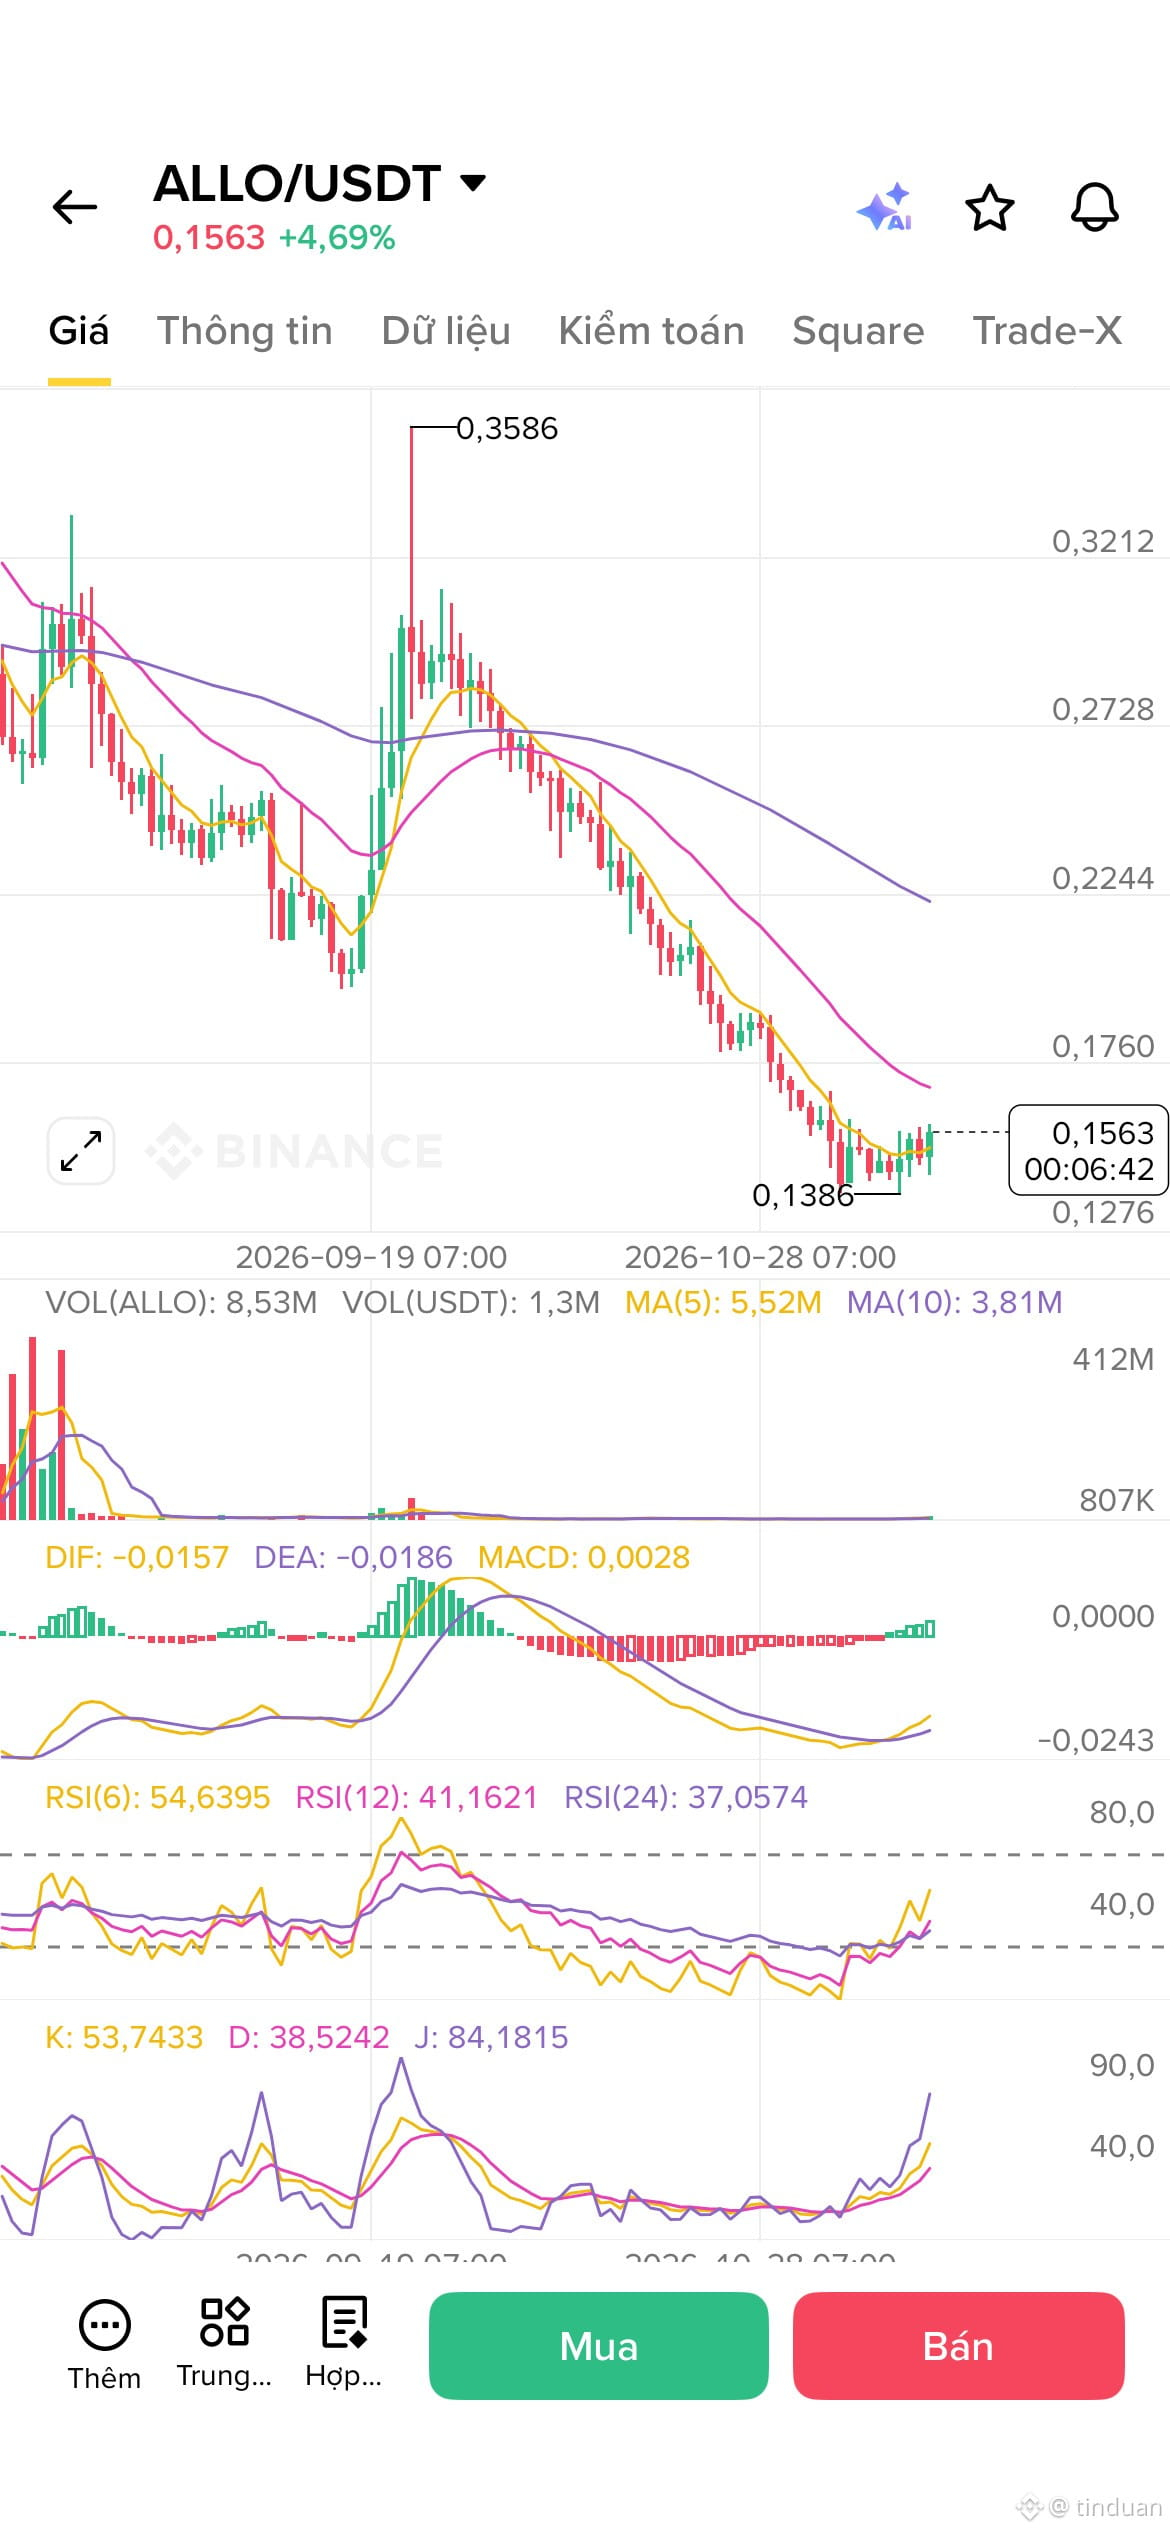
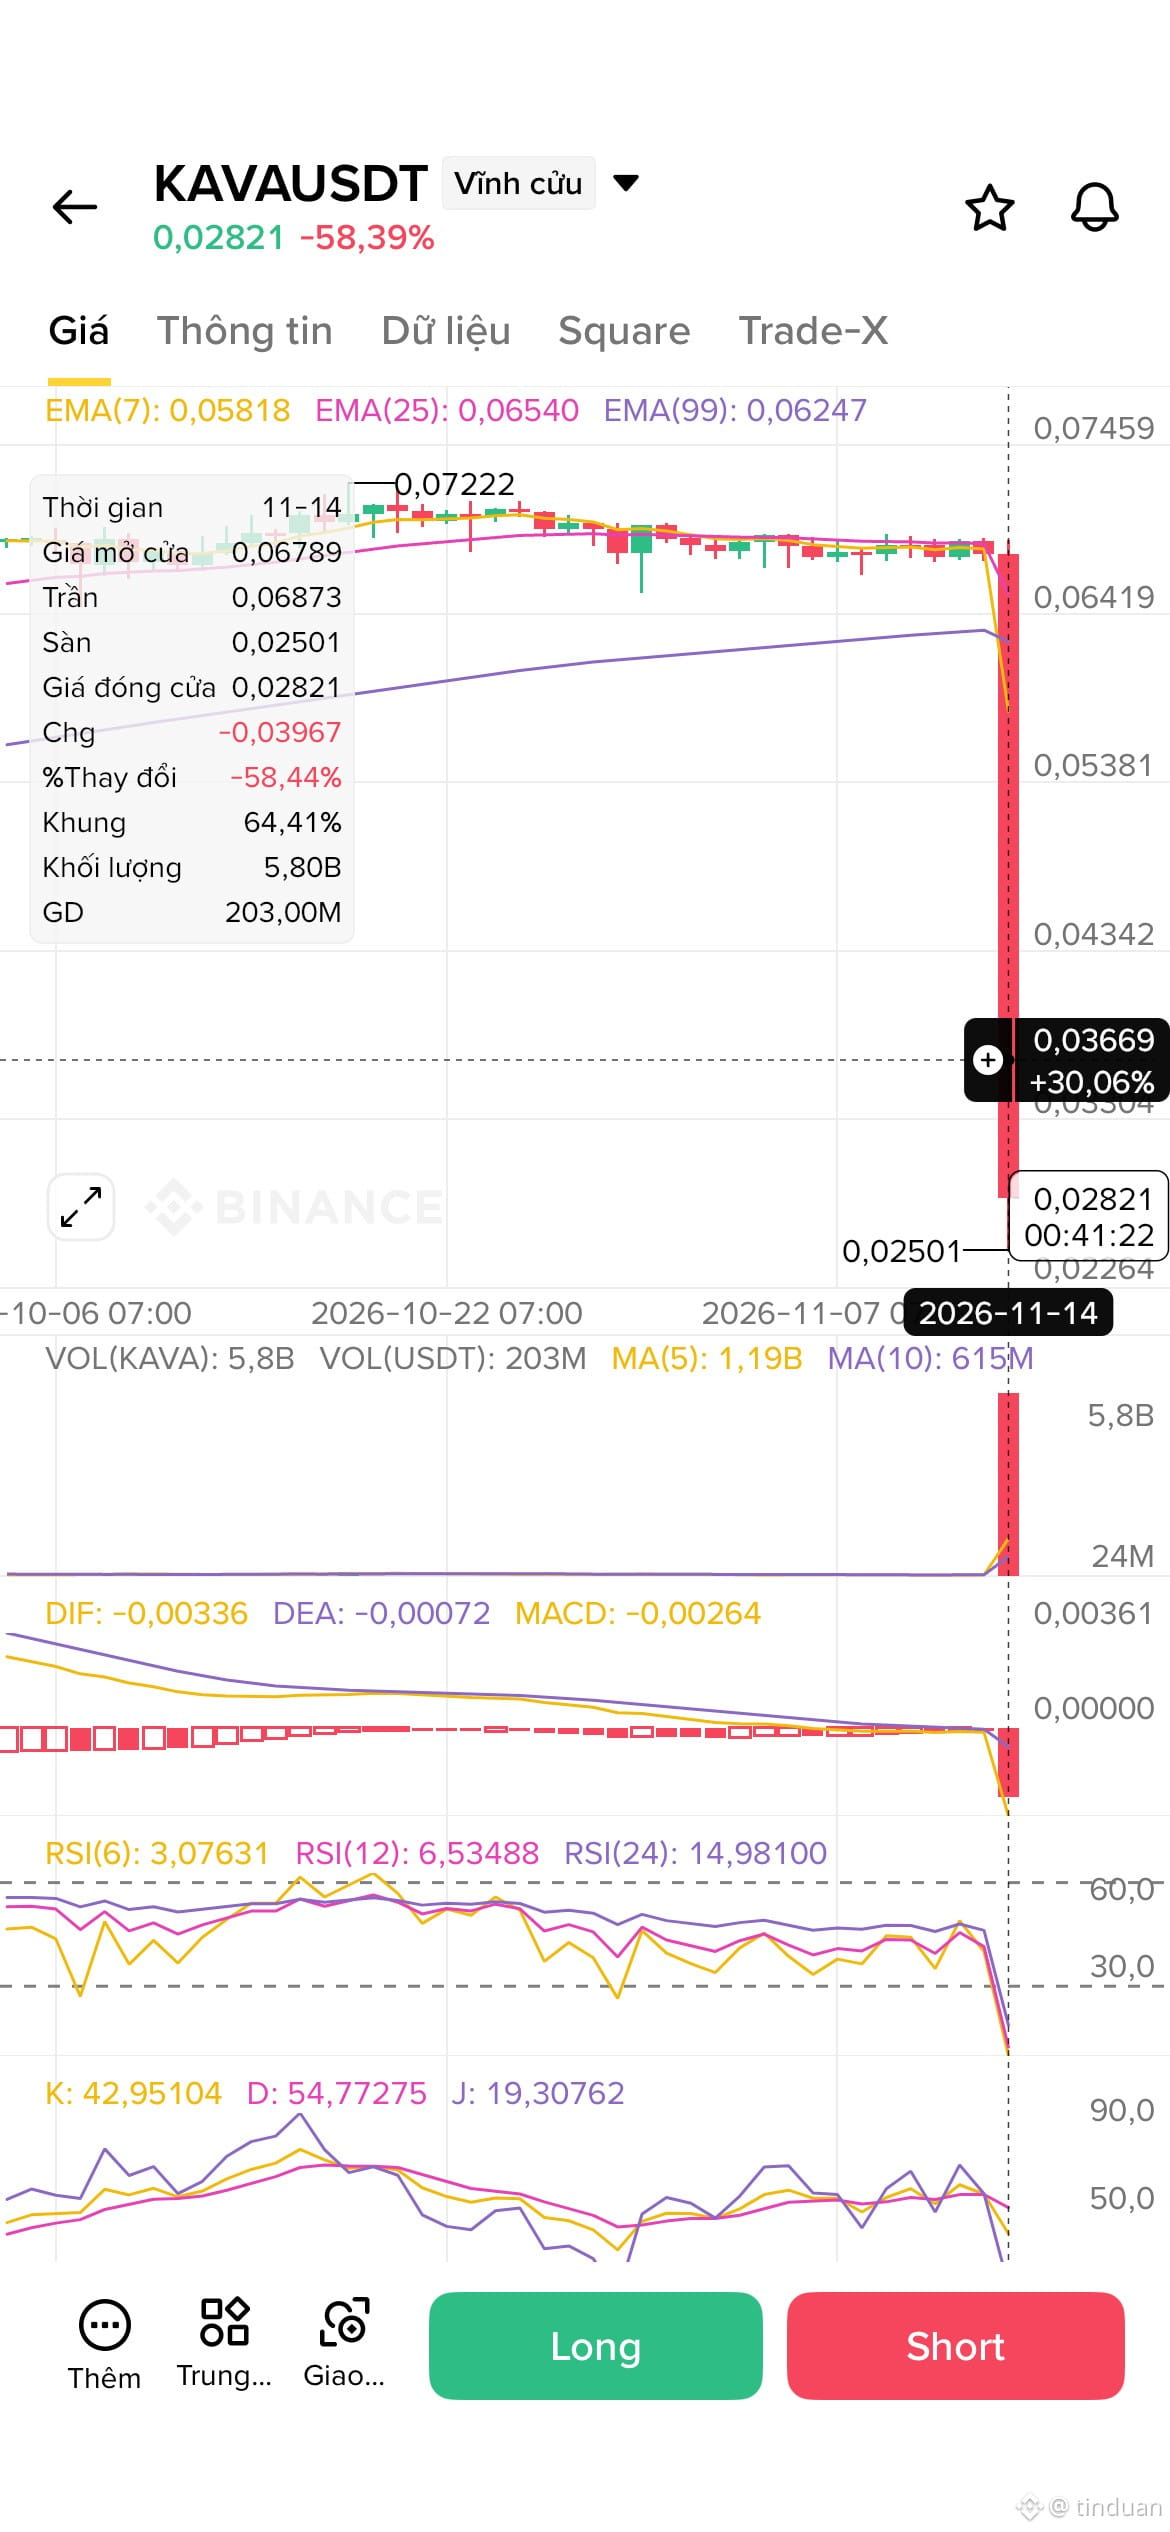
$ALLO The price has been consolidating for quite a long time,
will it reverse and move up???
$ALLO The price has been consolidating for quite a long time,
will it reverse and move up???
will it reverse and move up???
2
266
·
--
BTC plunges below $64,000 amid Fed rate concernsMacro-driven sell-off
Strong October jobs and CPI data led markets to fully price in a 25 bps Fed rate hike in December, sending BTC down around 12% this week and briefly below $64,000, with more than $691 million liquidated in just one hour.
ETF outflows
Spot Bitcoin ETFs recorded seven consecutive days of net outflows totaling more than $1.44 billion, while the Fear & Greed Index plunged to 15 — its lowest level since June.
BTC plunges below $64,000 amid Fed rate concerns
Macro-driven sell-off
Strong October jobs and CPI data led markets to fully price in a 25 bps Fed rate hike in December, sending BTC down around 12% this week and briefly below $64,000, with more than $691 million liquidated in just one hour.
ETF outflows
Spot Bitcoin ETFs recorded seven consecutive days of net outflows totaling more than $1.44 billion, while the Fear & Greed Index plunged to 15 — its lowest level since June.
Strong October jobs and CPI data led markets to fully price in a 25 bps Fed rate hike in December, sending BTC down around 12% this week and briefly below $64,000, with more than $691 million liquidated in just one hour.
ETF outflows
Spot Bitcoin ETFs recorded seven consecutive days of net outflows totaling more than $1.44 billion, while the Fear & Greed Index plunged to 15 — its lowest level since June.
2
485
·
--
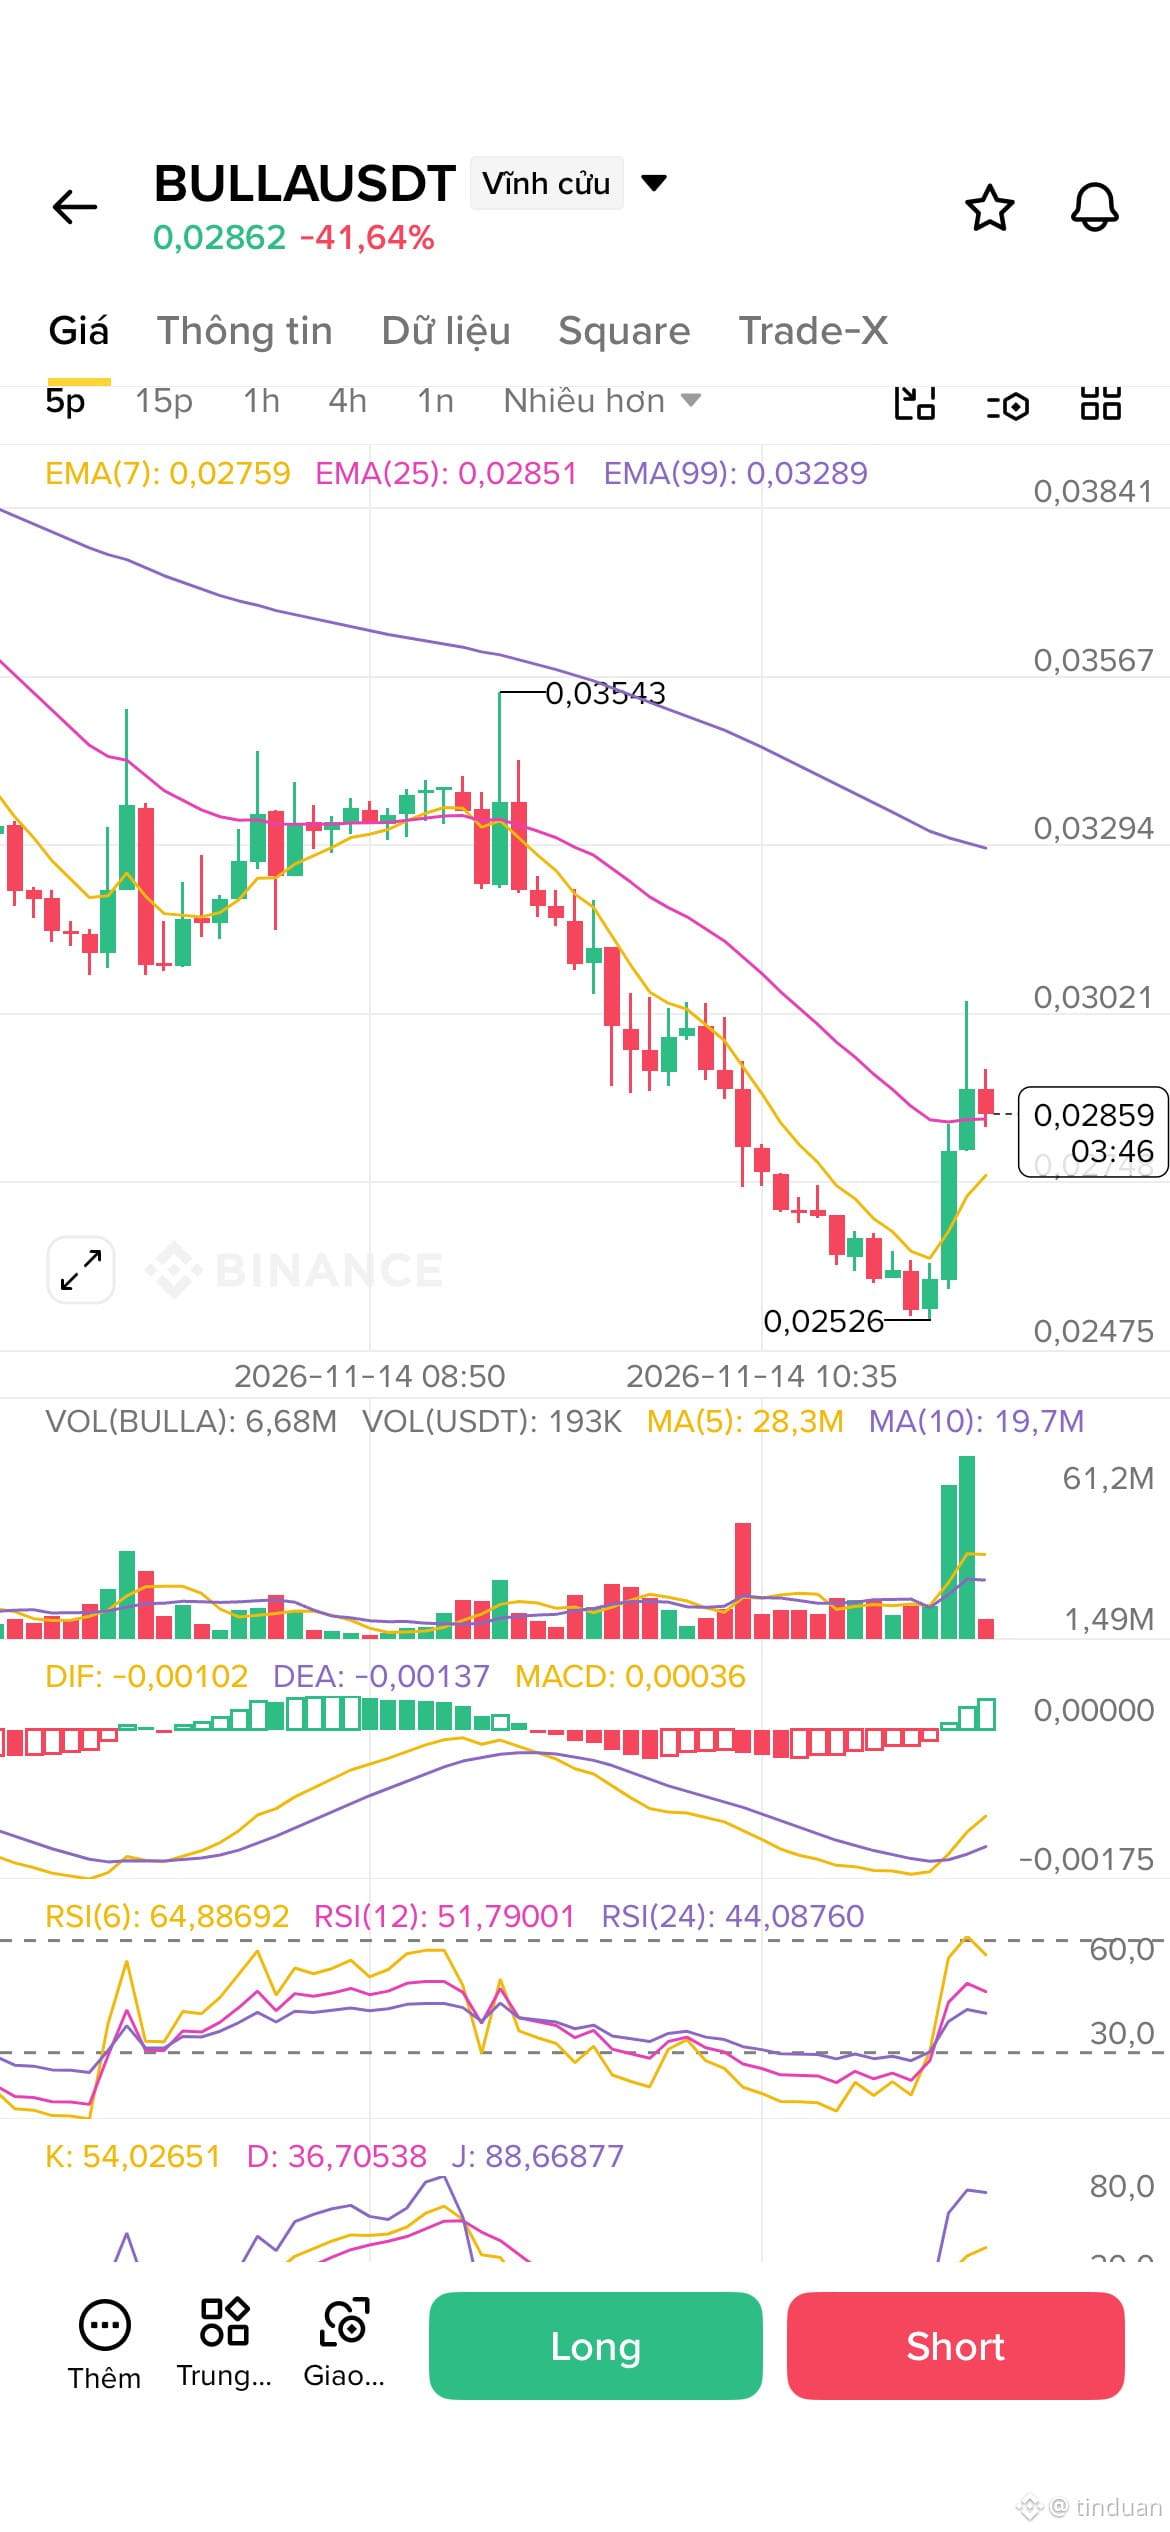
$BULLA There's a signal now, should we enter? Or is it just a market trap?
{future}(BULLAUSDT)
$BULLA There's a signal now, should we enter? Or is it just a market trap?
2
345
·
--
30D trade $AKE 139.4 USDT
$AKE Yesterday, if you’d shorted AKE at 0.00636, you’d have taken a massive loss 🤪🤪🤪
$AKE Yesterday, if you’d shorted AKE at 0.00636, you’d have taken a massive loss 🤪🤪🤪
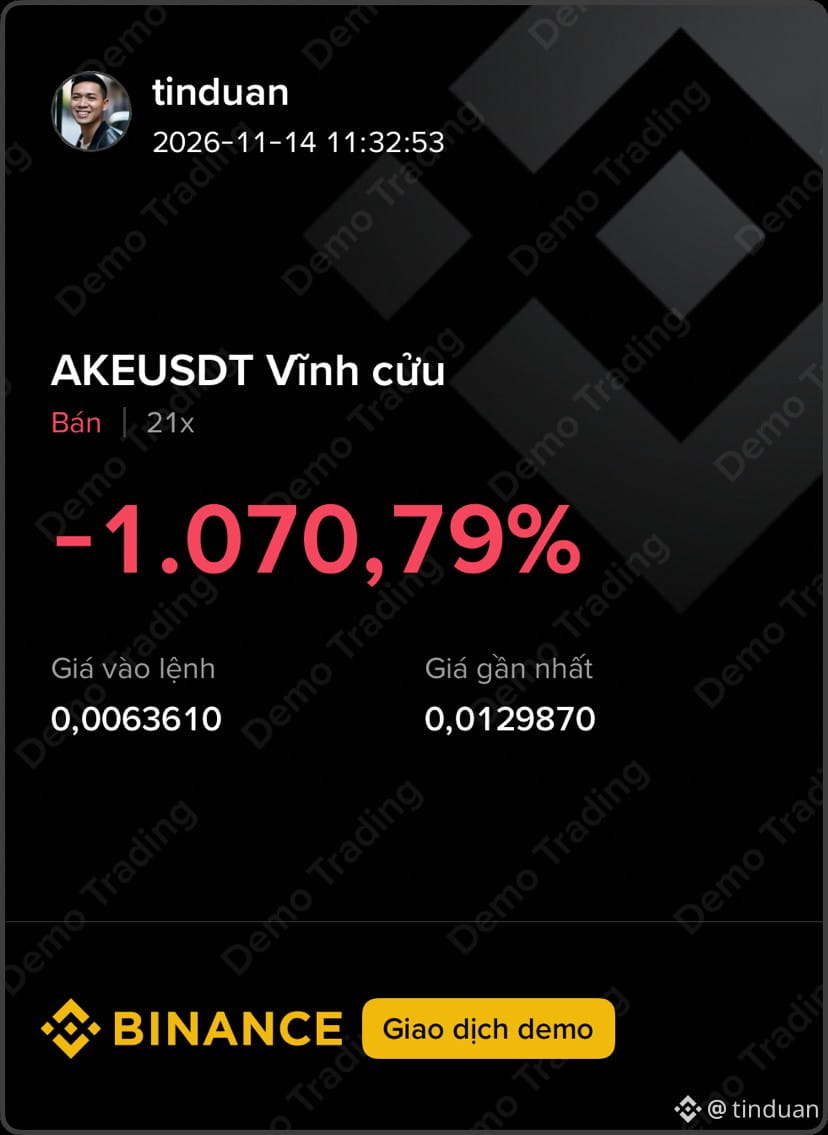
2
386
·
--
$BANANAS31 There’s a bounce, but we’ll only know later whether it’s a reversal 😁
{future}(BANANAS31USDT)
$BANANAS31 There’s a bounce, but we’ll only know later whether it’s a reversal 😁
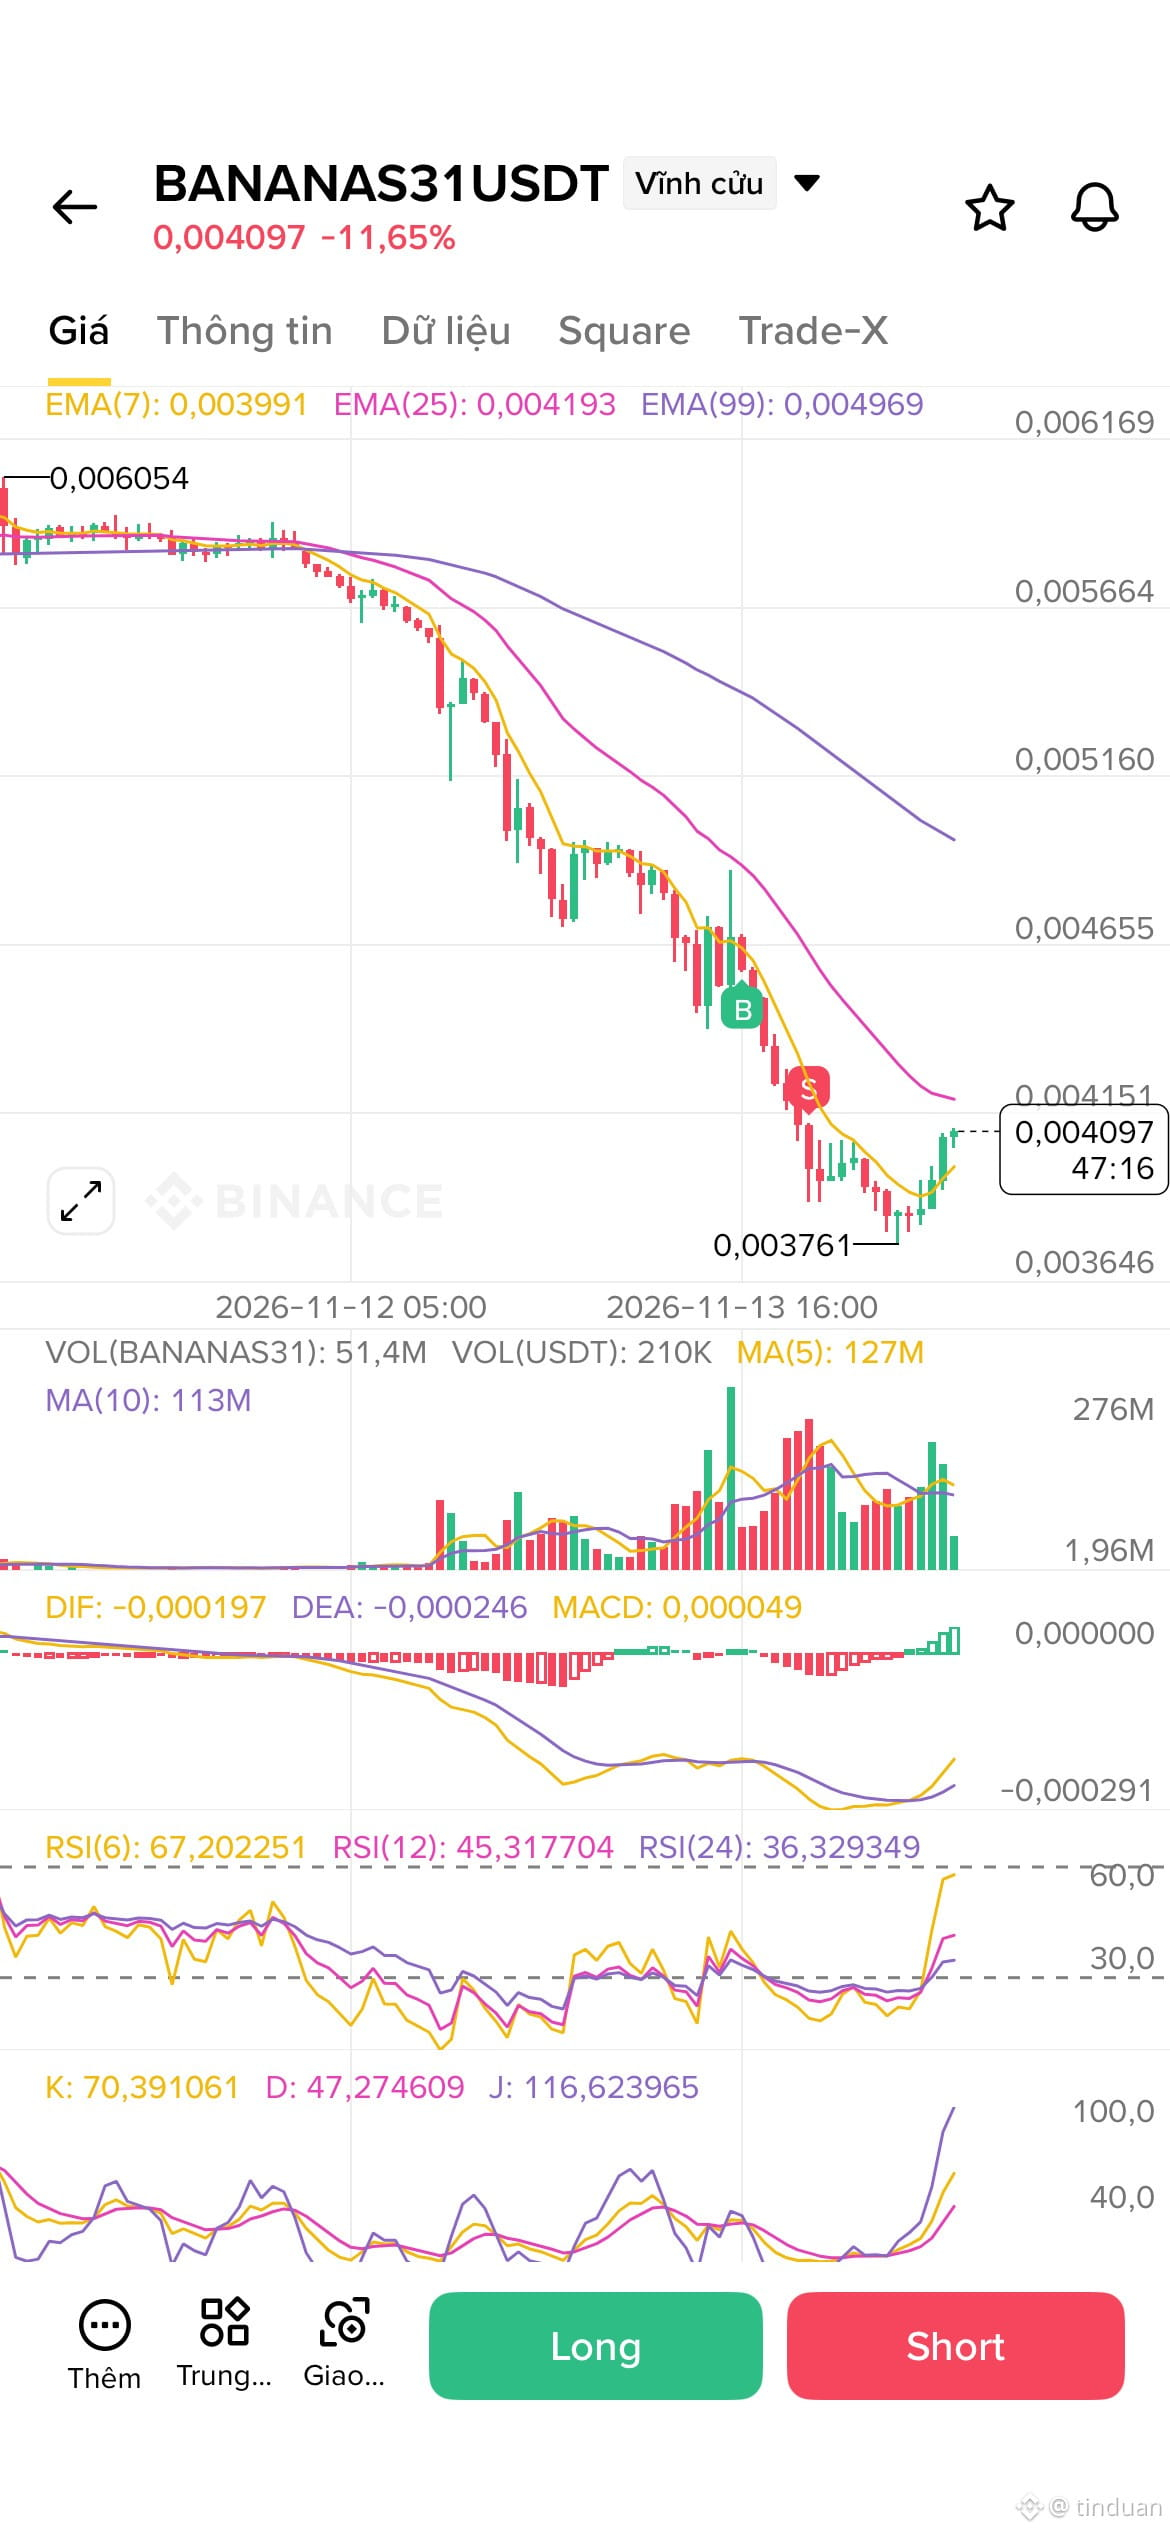
2
275
·
--
IMX is so sad - the wind won't change direction
IMX is so sad - the wind won't change direction
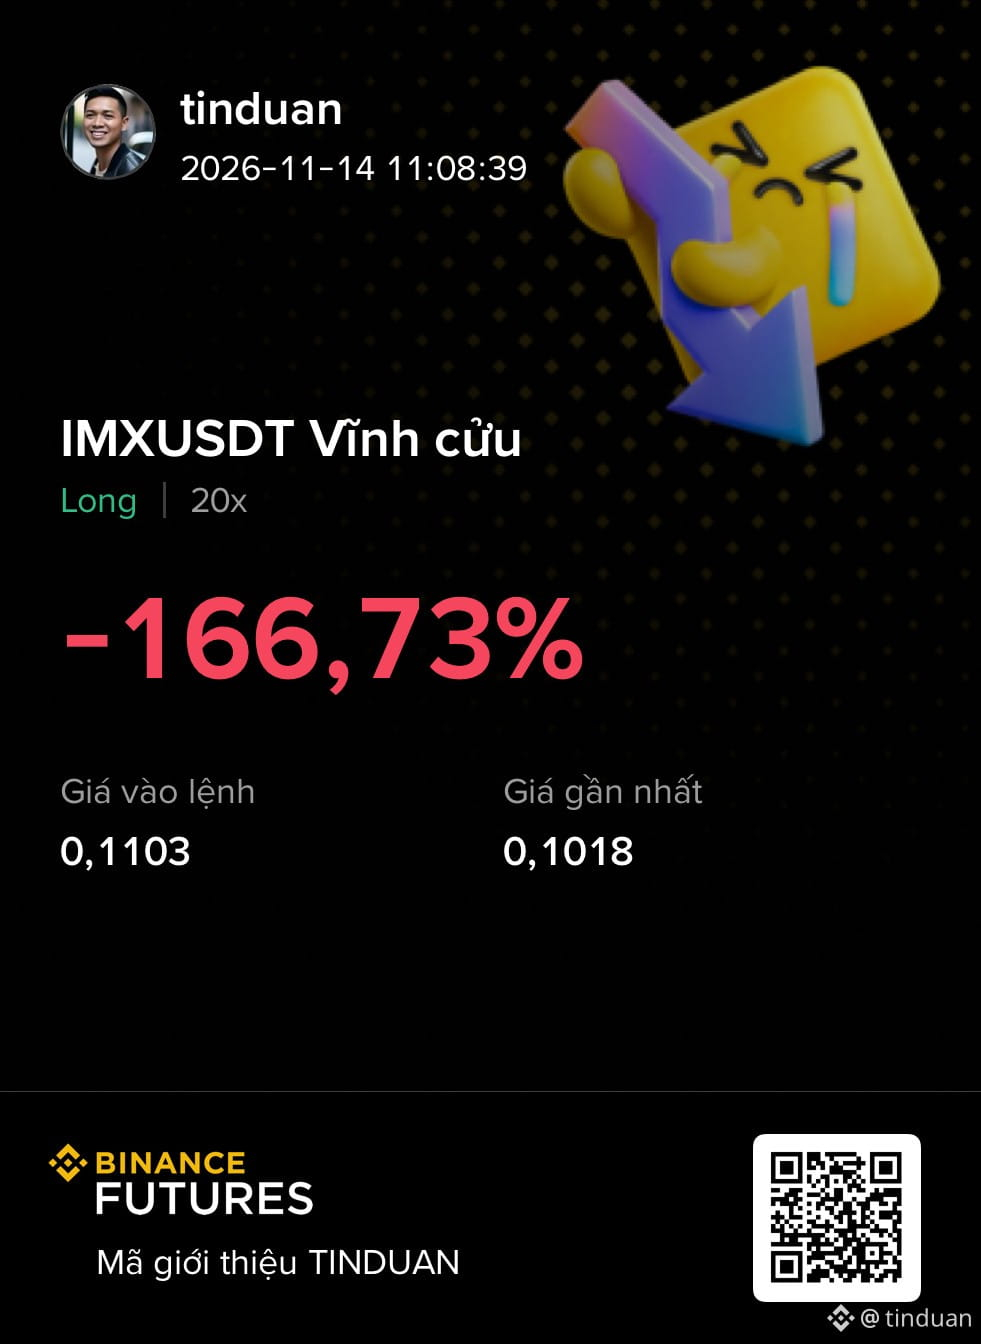
2
116
Log in to explore more content
Join global crypto users on Binance Square
⚡️ Get latest and useful information about crypto.
💬 Trusted by the world’s largest crypto exchange.
👍 Discover real insights from verified creators.
Email / Phone number