

Havertz Dawn
37 Posts

Havertz Dawn
Report
Block User
8 Following
857 Followers
658 Liked
Posts
All
Live
·
--
On days when nothing new is happening in the market, I find myself feeling grateful 🙏✨
Because on days like these, the market gives me time to “rest” and do the things I love without worrying that I’ll miss a big move because I wasn’t watching the charts.
Today, I can still follow yesterday’s market scenario, so I’ll keep monitoring and share an update later.
Because on days like these, the market gives me time to “rest” and do the things I love without worrying that I’ll miss a big move because I wasn’t watching the charts.
Today, I can still follow yesterday’s market scenario, so I’ll keep monitoring and share an update later.

1
532
·
--
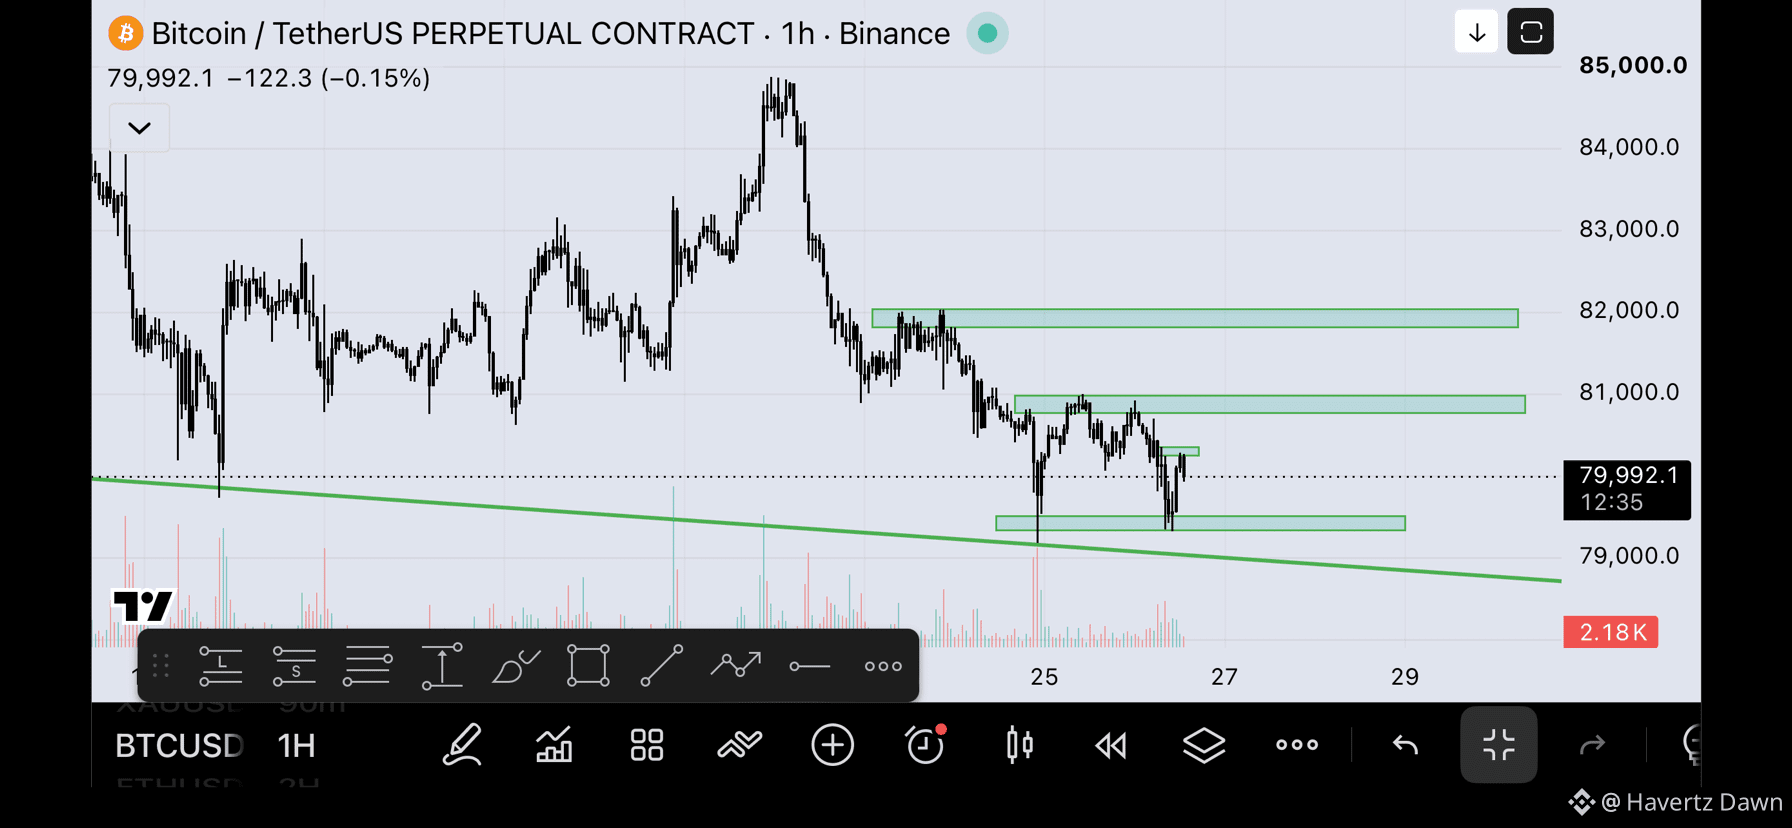
📊 BTC 26/10 - How volatile could price action be ahead of the FOMC news?
From yesterday until now, BTC has been trading in the 79.3k–81k range, and it’s pretty uncomfortable trying to tell whether this is accumulation before moving up or accumulation before another drop.
Looking at multiple timeframes, the larger 1D, 2D, and 3D charts are still aligned in pointing to a downtrend for the market. However, today the market is more likely to see a slight rebound.
→ The evidence leans more toward the downside, as more of the larger timeframes are gradually coming into agreement.
The current SW zone is still 79.1k–84.8k. If price stays within this range and remains near the current bottom, its direction will be harder to predict leading up to FOMC.
🎯 Current strategy:
SHORT: For a short, I’d look at resistance zones, starting with the smaller timeframes and moving up to the larger ones. But the two most important zones are 81k and 82k.
LONG: If price can continue to hold above 79k (50/50 odds), you could go long toward the resistance zones in the short scenario.
⚠️ Trading mindset: Price may move around here and gradually make the direction more of a 50/50 call if it holds the 79k zone for too long, so be more cautious and manage your expectations.
I’ll be livestreaming tonight around 20:00–22:00 to take a deeper look at next week’s scenarios. See you there, guys :D
4
775
·
--
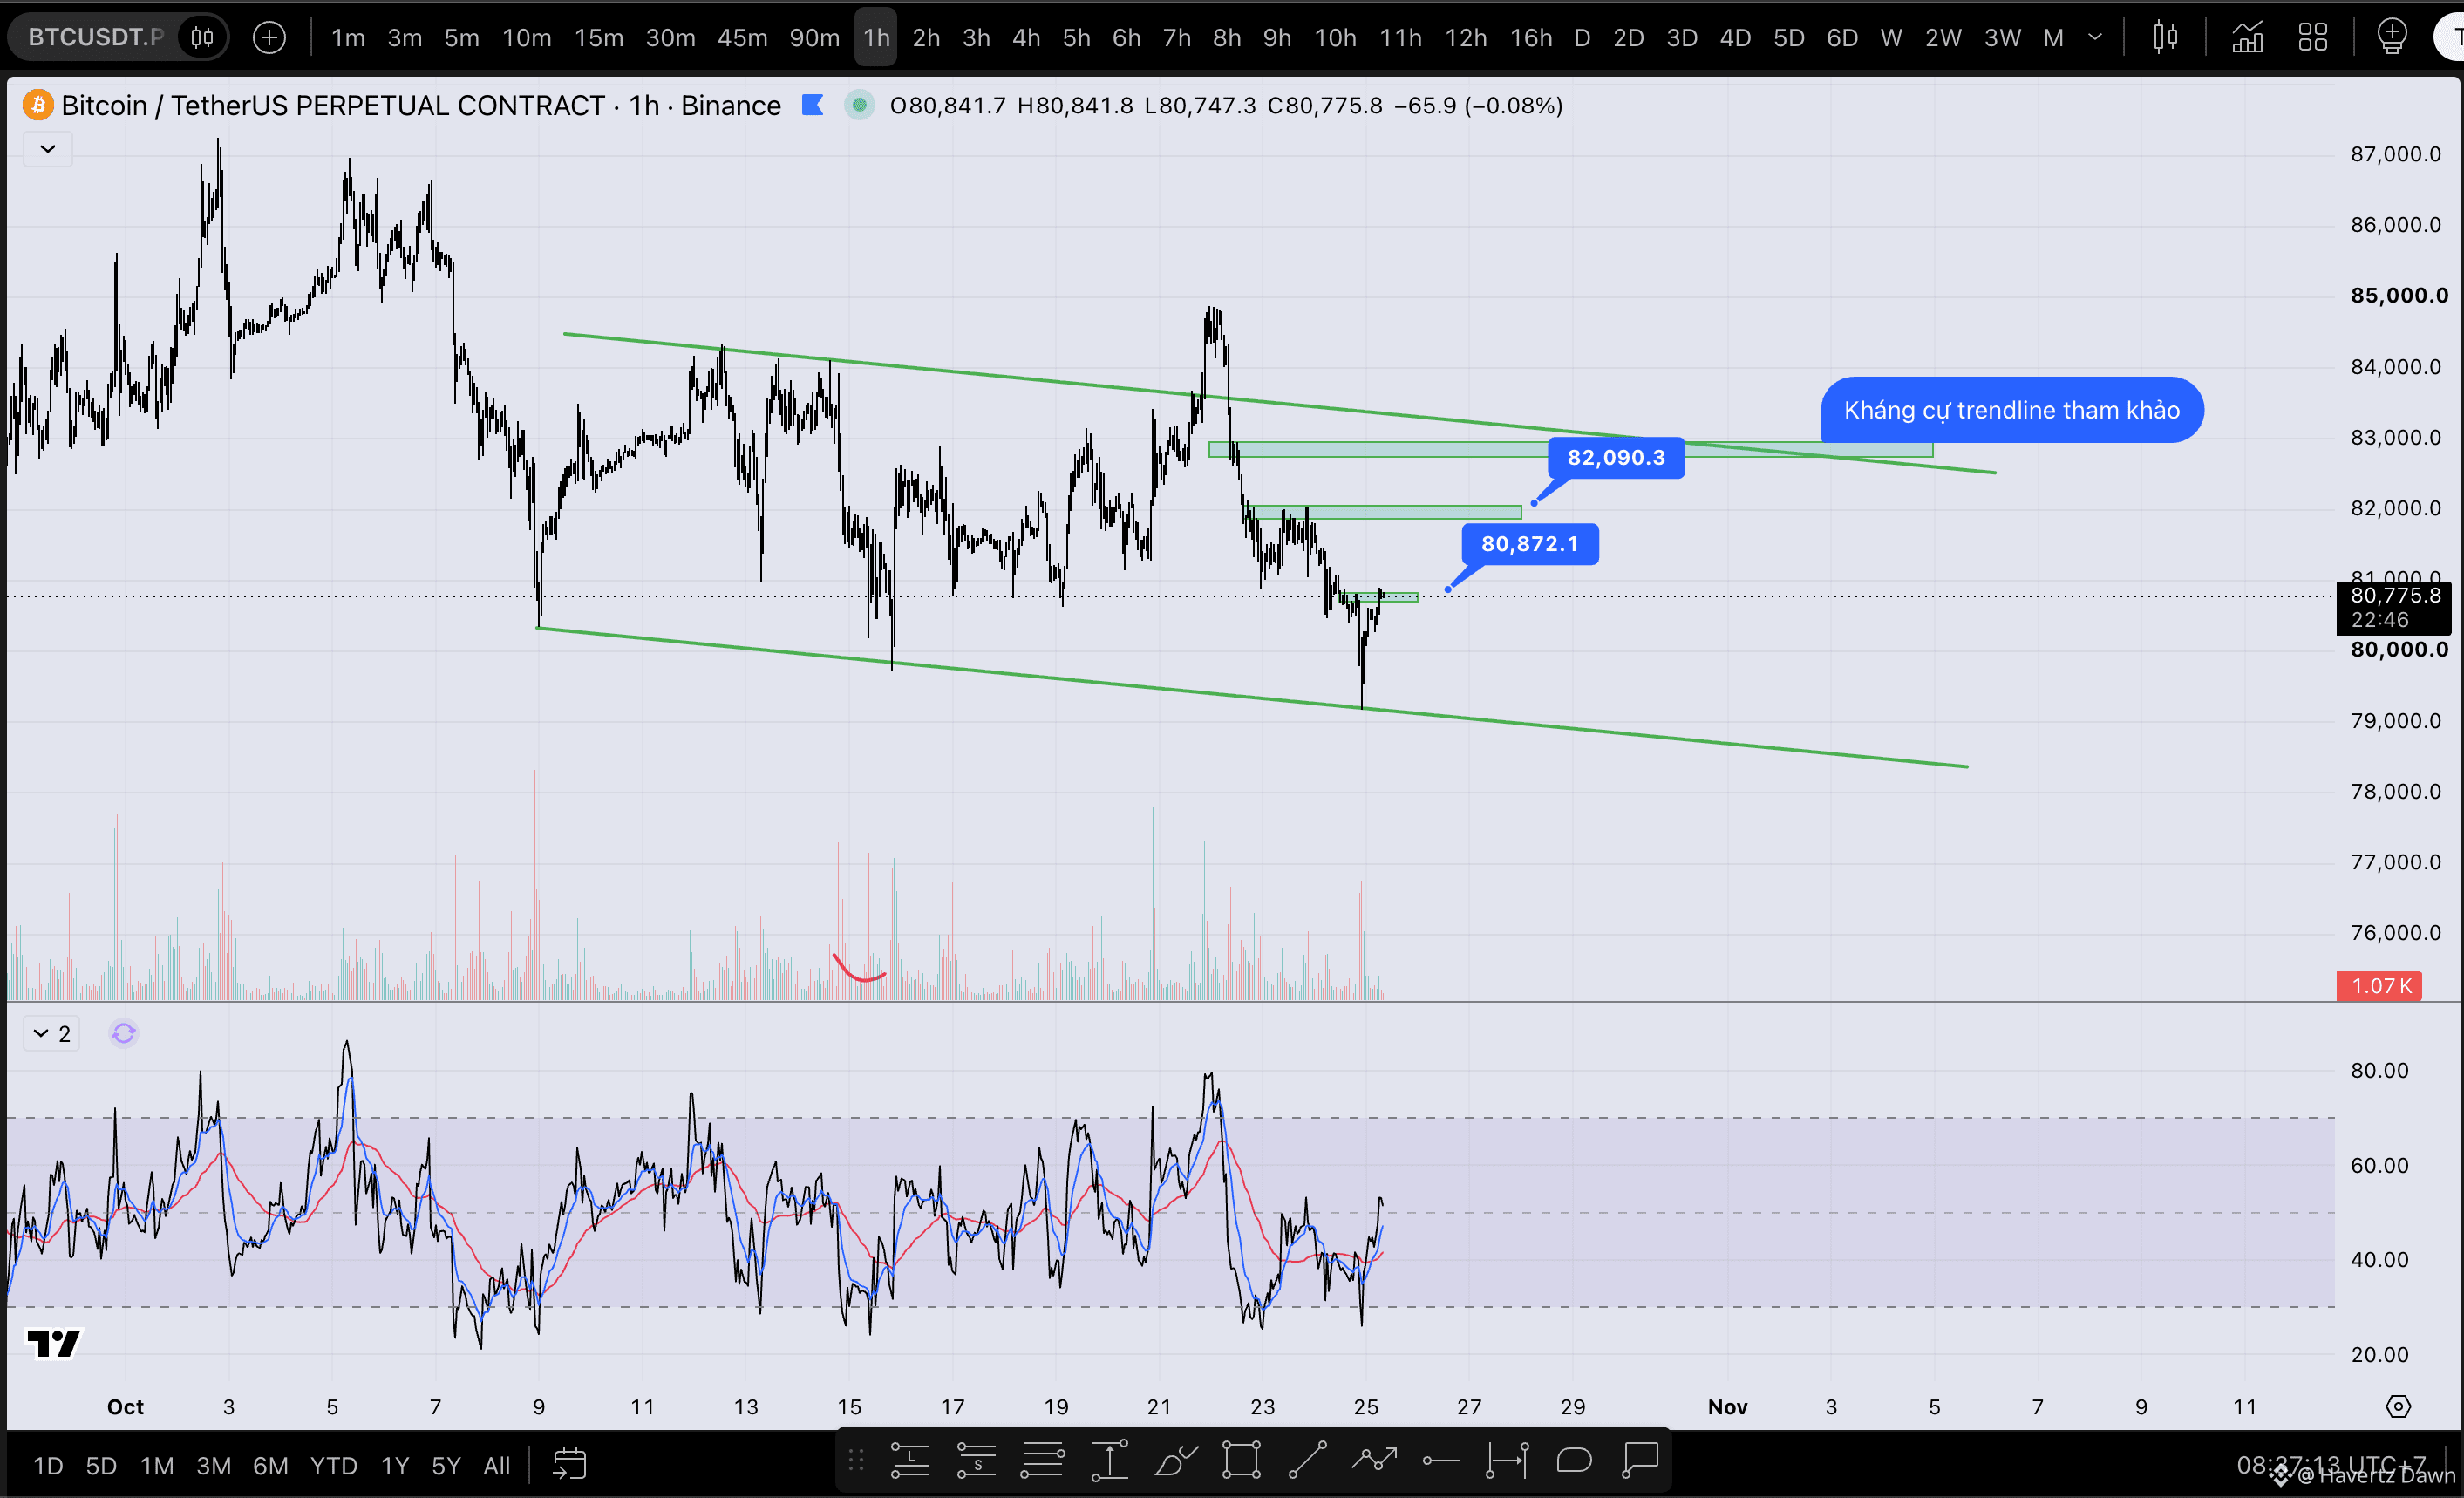
📊 BTC 25/10 - Is the direction any clearer yet?
BTC was quite surprising over the last two days of the weekend, with some decent 1–2k price swings for traders to trade, though unfortunately many longs got liquidated.
Looking at multiple timeframes, the larger timeframes—1D, 2D, and 3D—are still aligned in pointing to a market downtrend. However, today the market is more likely to see a slight recovery.
👉 The evidence leans more toward the downside, as more larger timeframes are gradually aligning. This recovery is just an H2 move within the 1D–3D downtrend.
The current SW range is still 79k1–84k8. Although last night price swept through 79k7, making it seem as if the SW range had broken and a clearer direction was emerging, the candle close left everyone uncertain again, meaning we still have to keep trading within the SW range.
🎯 Current strategy:
SHORT: If shorting, watch the resistance zones at 80k9, 82k1, and 83k (this is a reference trendline).
LONG: Watch smaller timeframes like M15. If price pulls back and forms solid support, you could go long toward the resistance zones above.
⚠️ Trading outlook: For now, the bias is more toward the downside, until the evidence changes as price moves through the day (I’ll post updates in the group and on my livestream).
I’ll be livestreaming tonight around 20:00–22:00 to take a deeper look at next week’s scenarios. See you there :D
2
1.6k
·
--
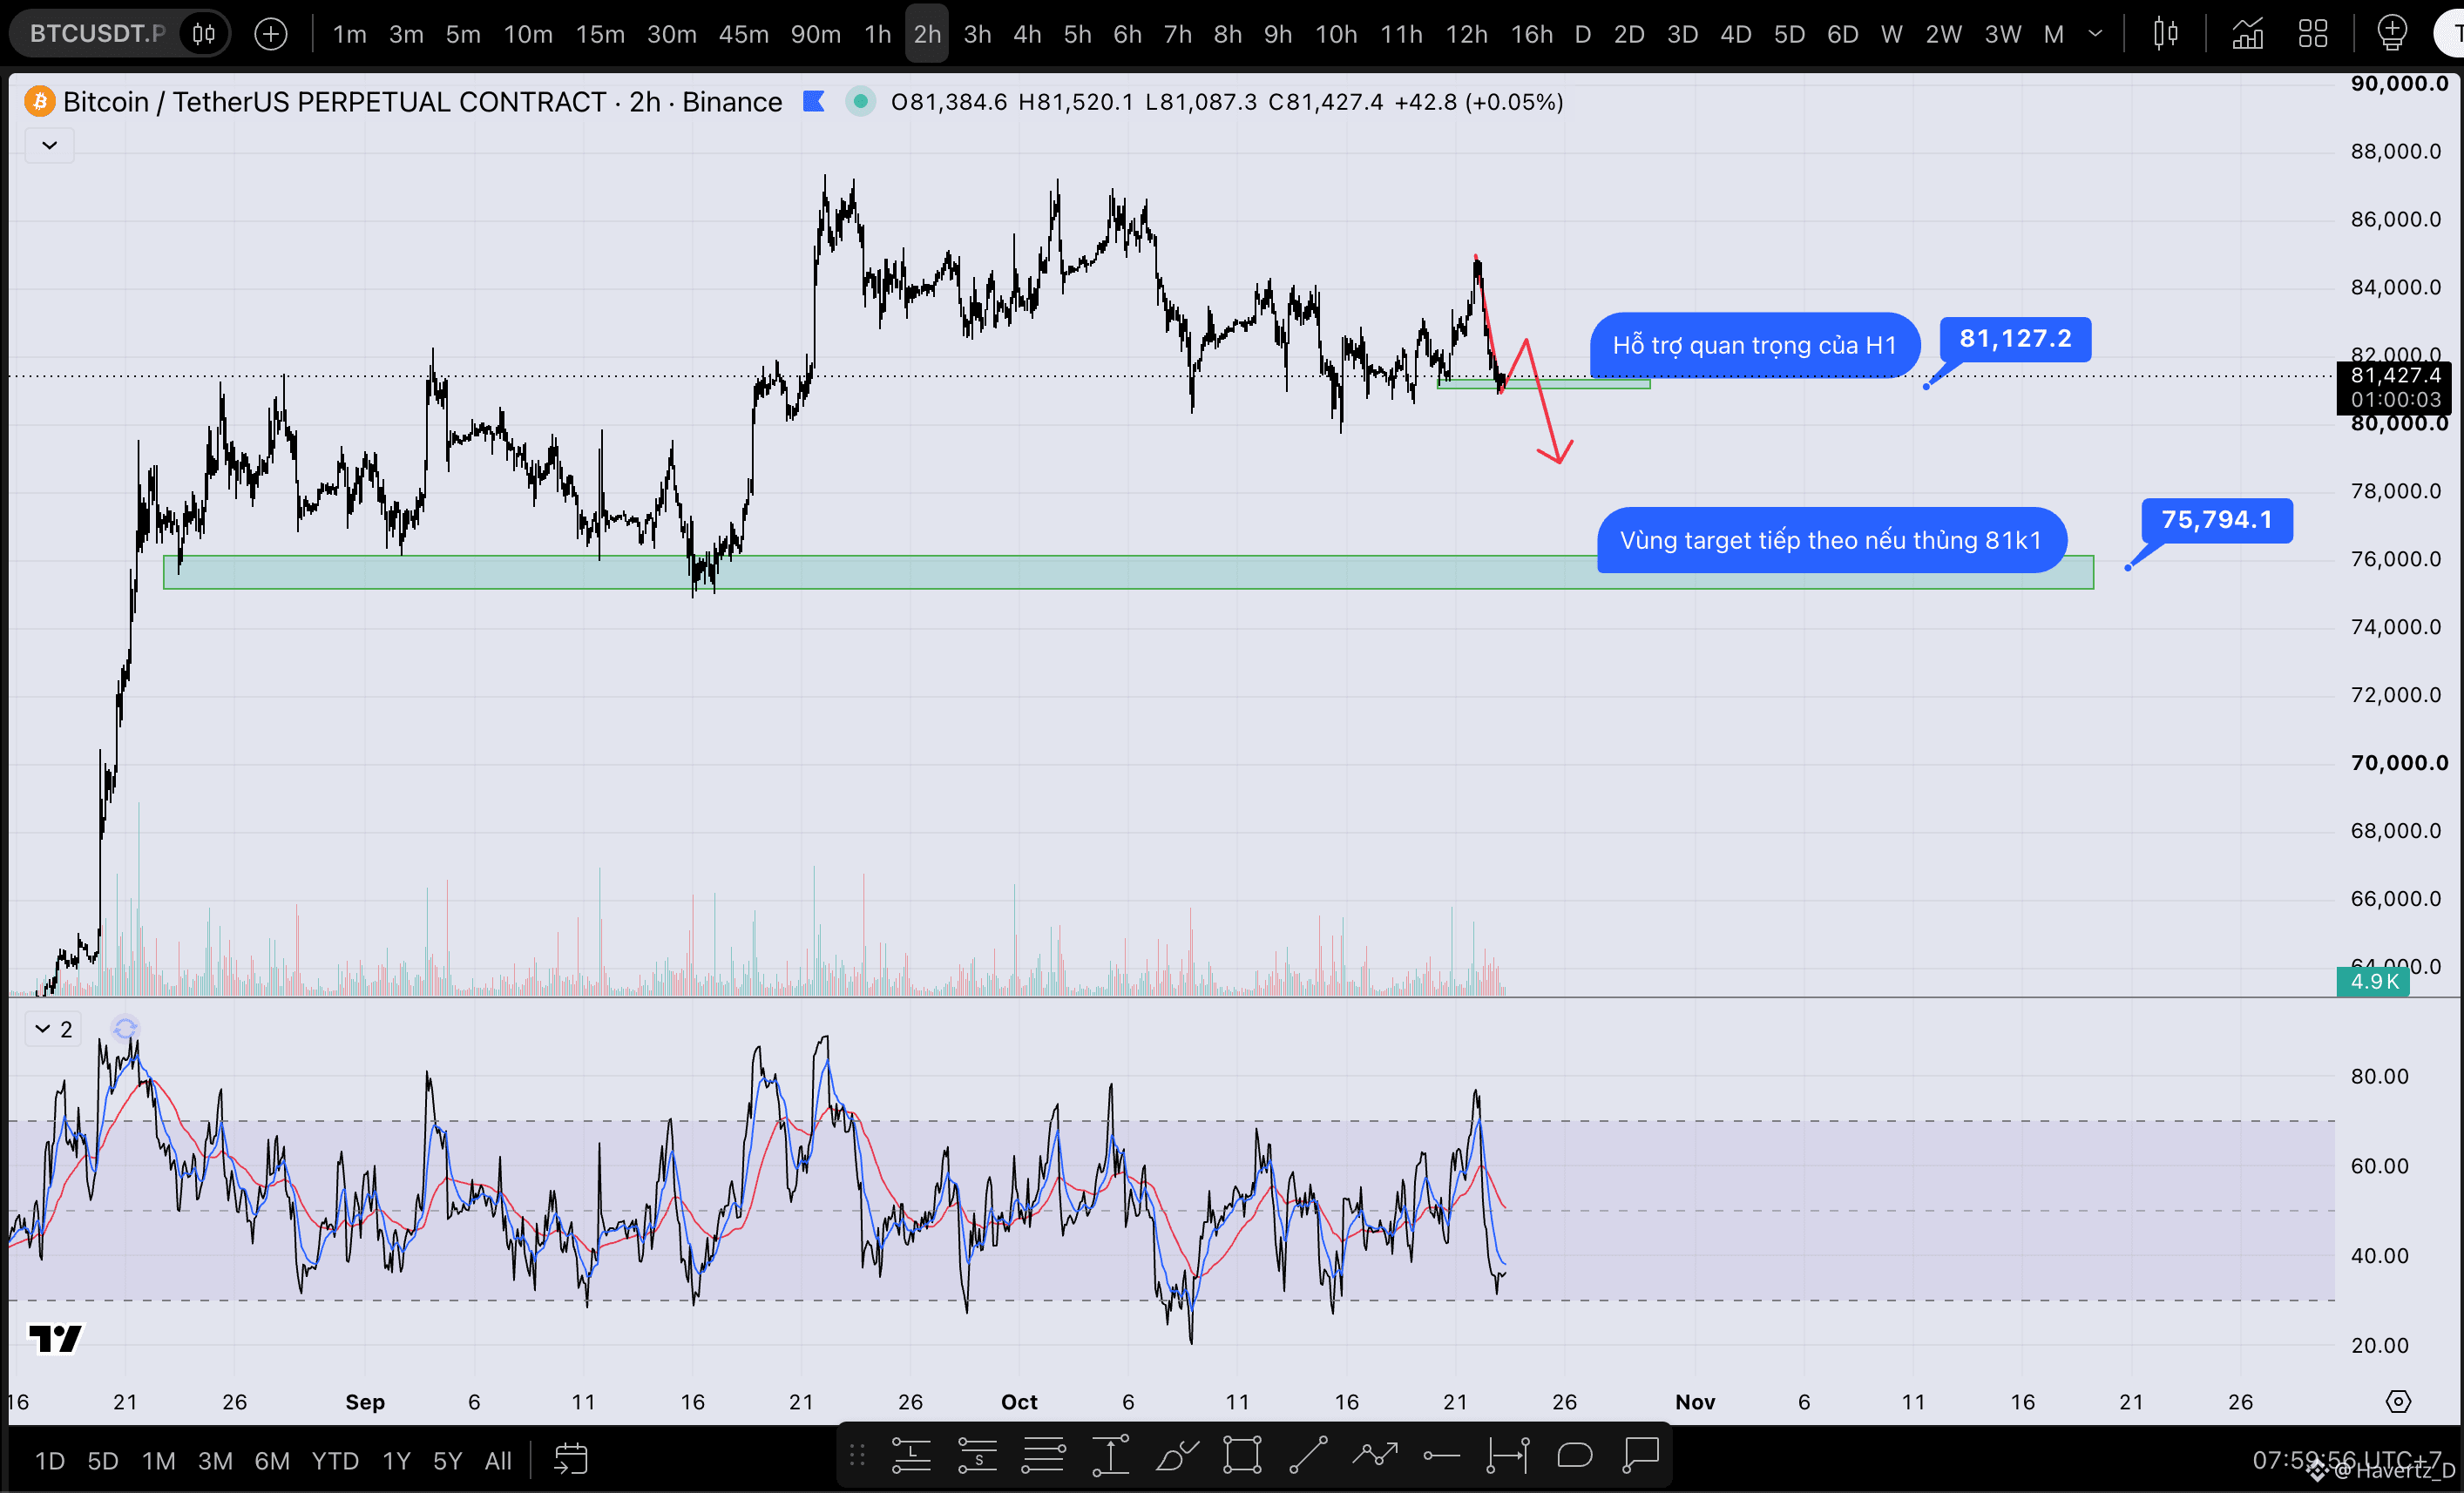
📊 BTC 23/10 - As the evidence gradually leans one way, should we have expectations?
Yesterday, BTC gave back a swing from 84k8 to 81k1 (key H1 support), as outlined in yesterday's scenario.
Looking across multiple timeframes, H1 has now entered a downtrend in alignment with H2–H4, as well as 1D, 2D, and 3D. However, it has yet to decisively break below H1 support at 81k1 (this zone is important according to Dow Theory).
👉 The evidence is increasingly favoring the downside, with more higher timeframes gradually coming into alignment.
The current range is still 79k7–84k5. As long as price remains within this range, prioritize taking profit when it reaches resistance or support. But since the evidence is gradually leaning bearish (SHORT), even when closing trades, be cautious with LONG positions and manage them closely.
🎯 Current strategy:
SHORT: If entering SHORT now, watch for a rebound on M30–H1 before going SHORT (the rebound could take half a day to a day). Keep an eye on the resistance zones at 82k1 and 83k.
LONG: Price is currently touching key support at 81k1. You could take a small LONG position and manage it around the resistance zones on the lower timeframes above.
⚠️ Trading mindset: At this point, the outlook favors the downside until the evidence changes as price moves throughout the day (I'll post updates in the group and on my livestream).
I'll be livestreaming tonight around 20:00–22:00 to take a deeper look at next week's scenarios. See you there, guys :D
1
8
12.6k
·
--
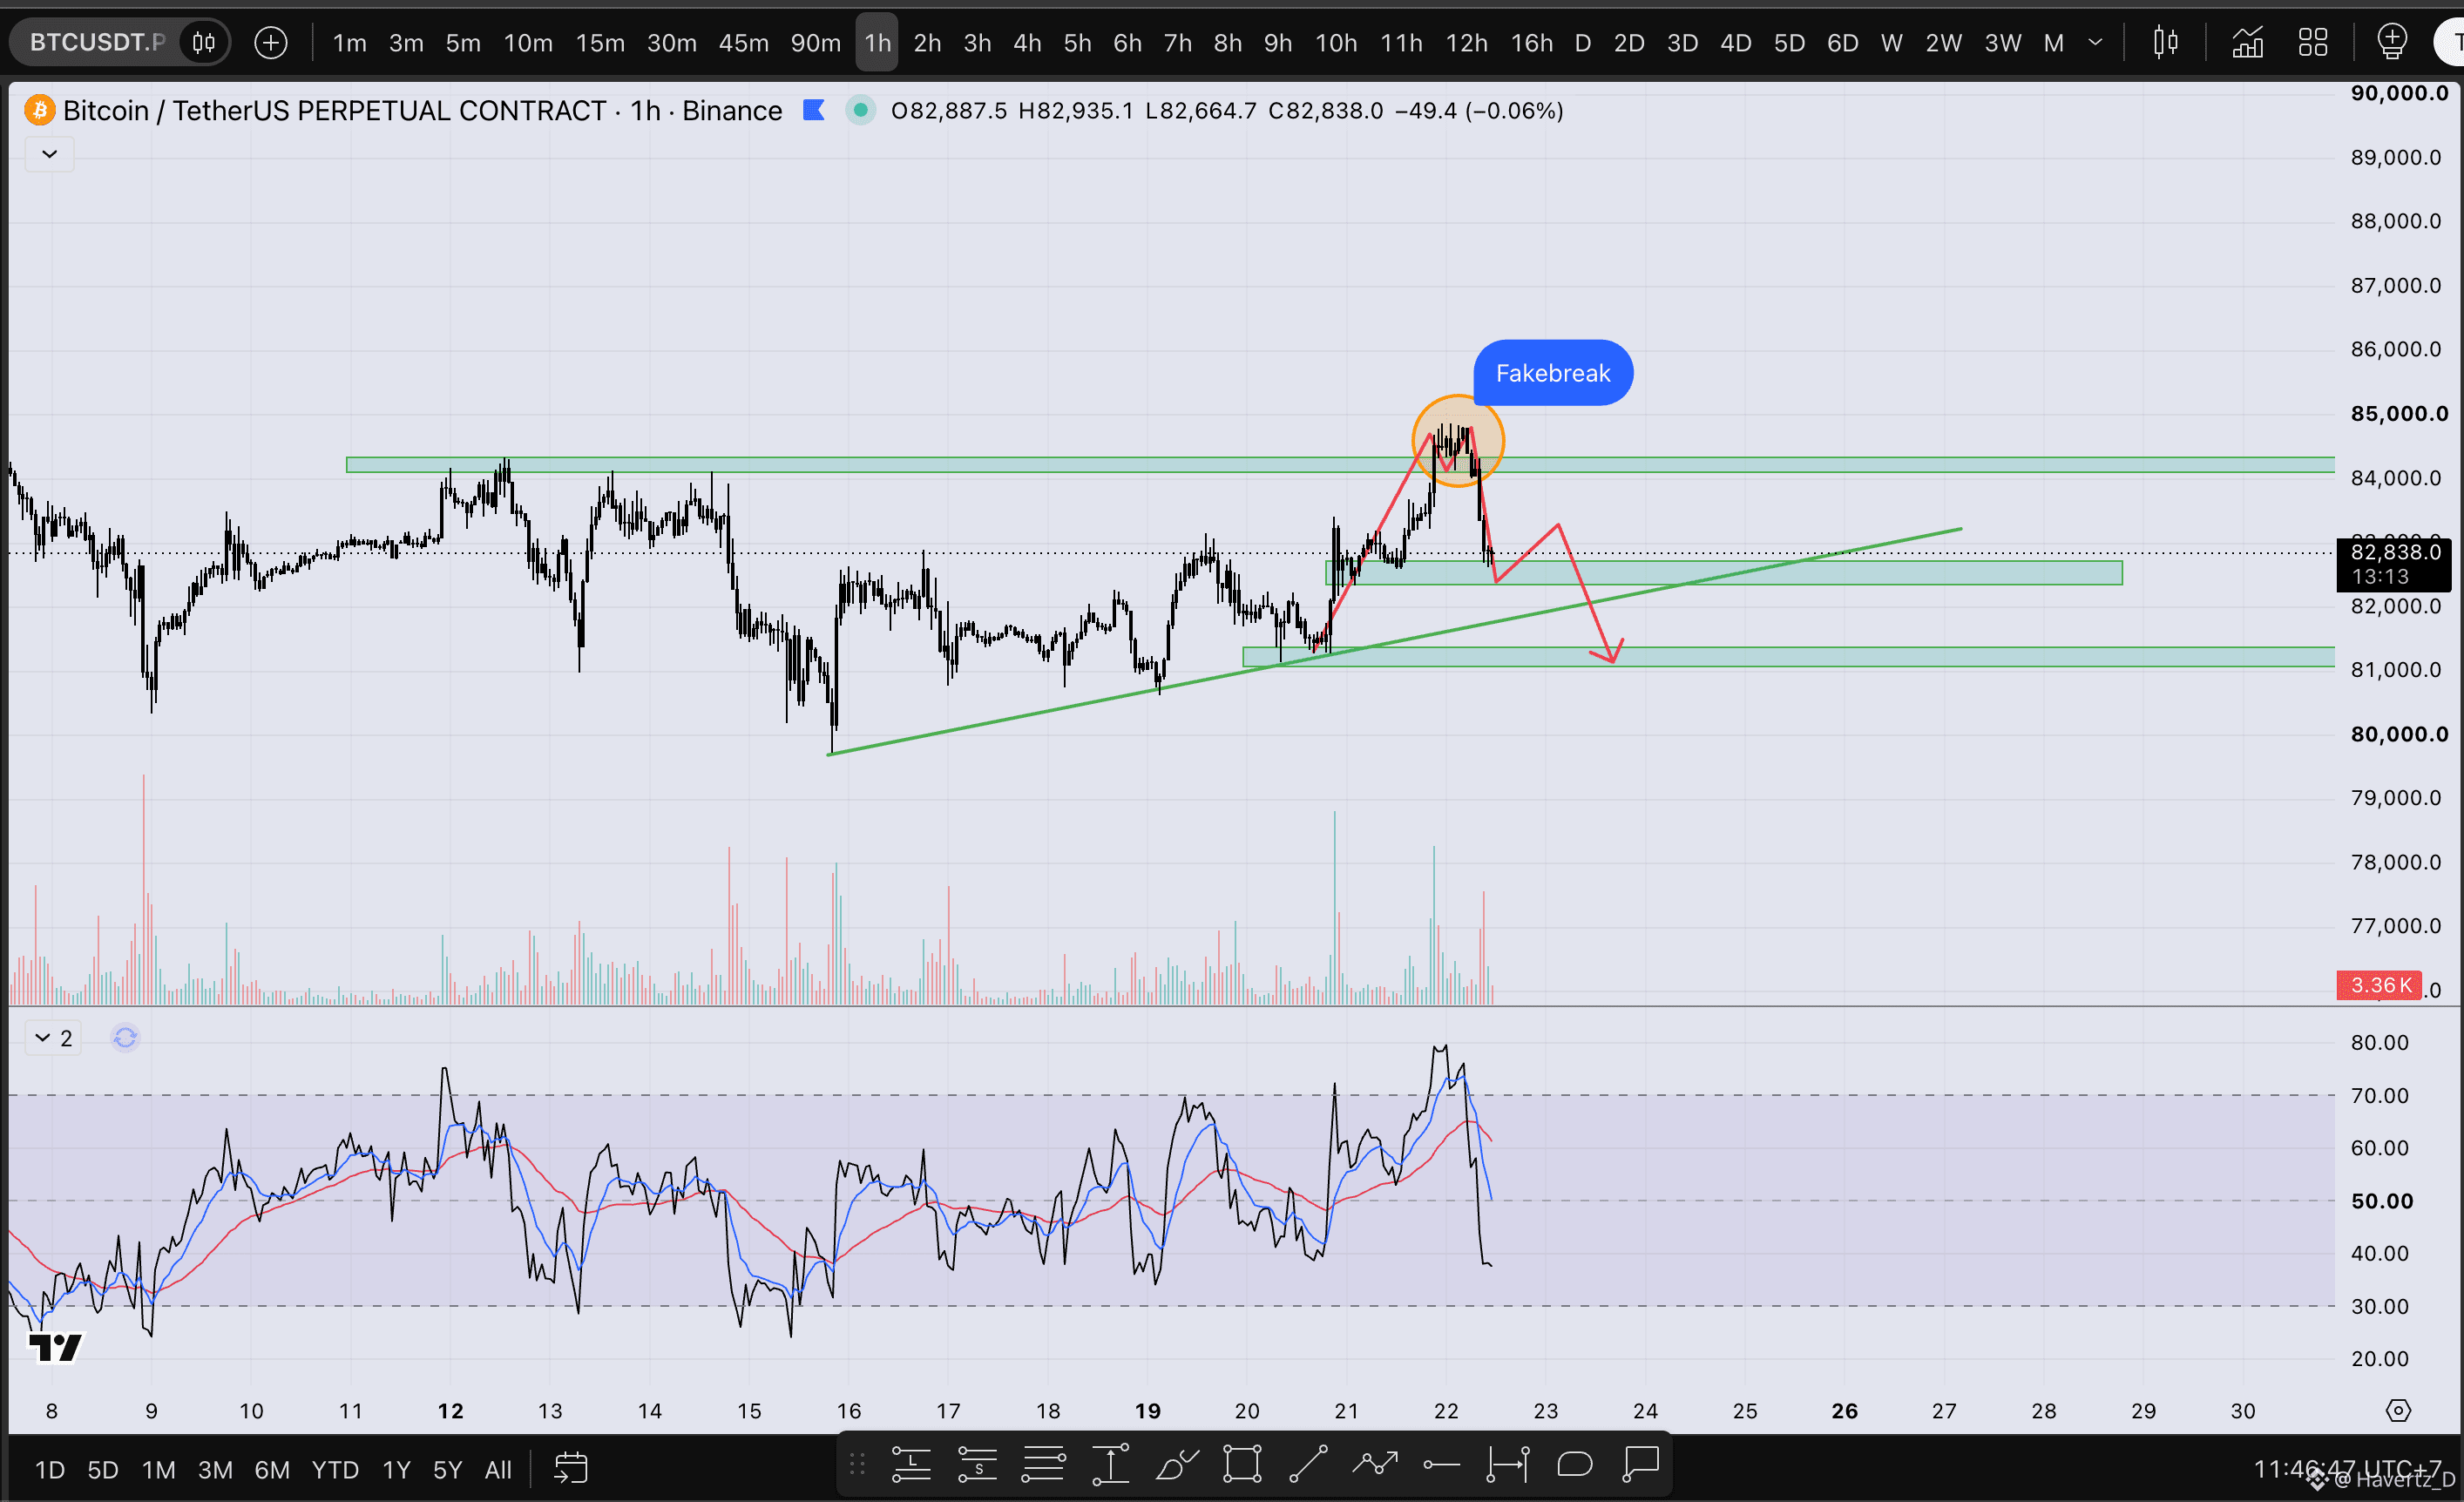
📊 BTC 22/10 - Lower expectations while price remains trapped in the SW range
BTC rose from the 81k2–84k8 zone during the sessions on the 20th and 21st, and made a fake breakout above the H4–H7 resistance at 84k4. This is the zone that keeps the 1D–2D downtrend in effect.
Looking across multiple timeframes, H1 has now entered a downward phase in sync with 1D and 2D. However, as price falls to the support zones below, watch for reactions so you can close SHORT positions and take LONG positions in the opposite direction.
The current SW range is still 79k7–84k5. As long as price stays within this range, prioritize taking profits when it reaches resistance or support. The trendline in the chart is for reference only; the horizontal support zones below are what matter most.
🎯 Current strategy:
SHORT: You can look for continuation SHORT entries on the 5M and 15M timeframes, and manage the trade at the support levels below. (Also keep an eye on the trendline.)
LONG: Watch for reactions at the support zones below, as shown in the chart. The deepest support is 79k7. If it holds, going LONG is still reasonable; if price breaks below it, watch for a deeper support zone.
⚠️ Trading mindset: This is a time to be more cautious and prioritize taking profits early, as the timeframes are moving in opposite directions and are quite out of sync.
8
20.1k
Log in to explore more content
Join global crypto users on Binance Square
⚡️ Get latest and useful information about crypto.
💬 Trusted by the world’s largest crypto exchange.
👍 Discover real insights from verified creators.
Email / Phone number