
煌道 | 交易之道搬运号
450 Posts

煌道 | 交易之道搬运号
分析师、交易员,美股、数字货币交易,融合技术分析、数据分析、宏观分析;
无付费群也无需证明自己,单纯记录看盘及交易思路,大多数观点会在每日早上收盘后发布
0 Following
1.4K+ Followers
1.0K+ Liked
Posts
All
Videos
9.4 Market rebound continues
After a full week of consolidation and buildup, BTC is currently maintaining its upward momentum. The small peak at 83,000 is expected to be crossed successfully. However, the next key point to watch is whether, after breaking through this level, the asset price can truly hold steady above it. For now, it is advisable to regard this as a rebound and trade cautiously, while always maintaining adequate risk awareness.
Looking at recent market performance, it is clear that crypto-related stocks such as MSTR and CRCL are moving noticeably stronger than the broader cryptocurrency market. At the current macro stage, investors do not need to engage too deeply in the back-and-forth speculation surrounding altcoins. Compared with that, crypto stocks not only offer active volatility similar to that of altcoins, but also tend to be more stable in overall movement. If you must look for targets within the altcoin sector, the only project we currently hold a positive outlook on is HYPE.
Finally, a special reminder for everyone: the latest Non-Farm Payrolls employment data is set to be released this evening. This crucial economic indicator is extremely important—it will most directly influence and determine the path the Federal Reserve will choose for its next monetary policy.
After a full week of consolidation and buildup, BTC is currently maintaining its upward momentum. The small peak at 83,000 is expected to be crossed successfully. However, the next key point to watch is whether, after breaking through this level, the asset price can truly hold steady above it. For now, it is advisable to regard this as a rebound and trade cautiously, while always maintaining adequate risk awareness.
Looking at recent market performance, it is clear that crypto-related stocks such as MSTR and CRCL are moving noticeably stronger than the broader cryptocurrency market. At the current macro stage, investors do not need to engage too deeply in the back-and-forth speculation surrounding altcoins. Compared with that, crypto stocks not only offer active volatility similar to that of altcoins, but also tend to be more stable in overall movement. If you must look for targets within the altcoin sector, the only project we currently hold a positive outlook on is HYPE.
Finally, a special reminder for everyone: the latest Non-Farm Payrolls employment data is set to be released this evening. This crucial economic indicator is extremely important—it will most directly influence and determine the path the Federal Reserve will choose for its next monetary policy.
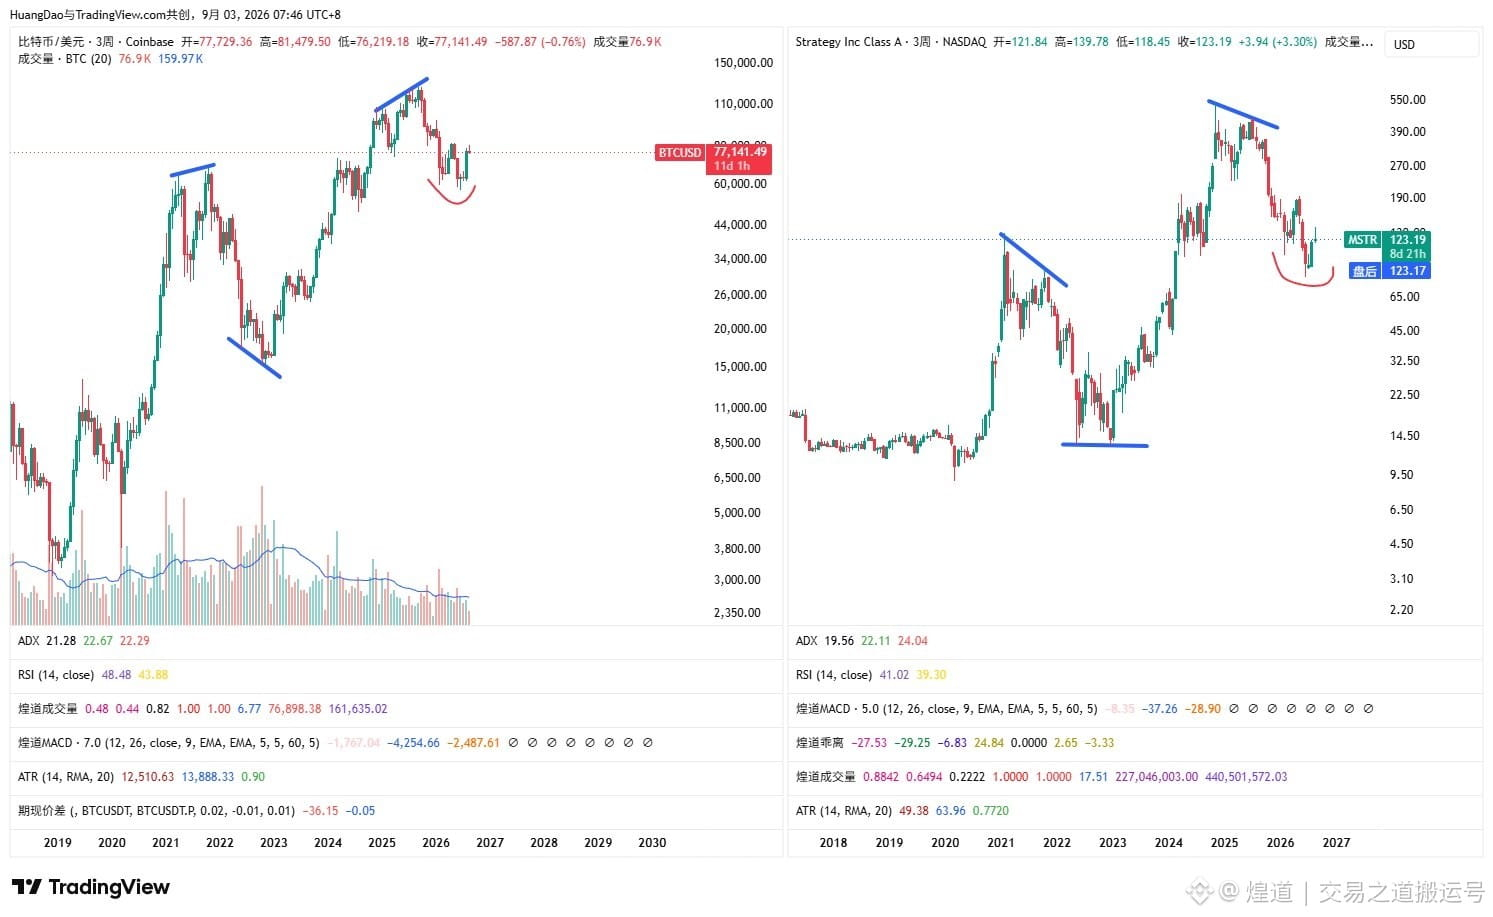
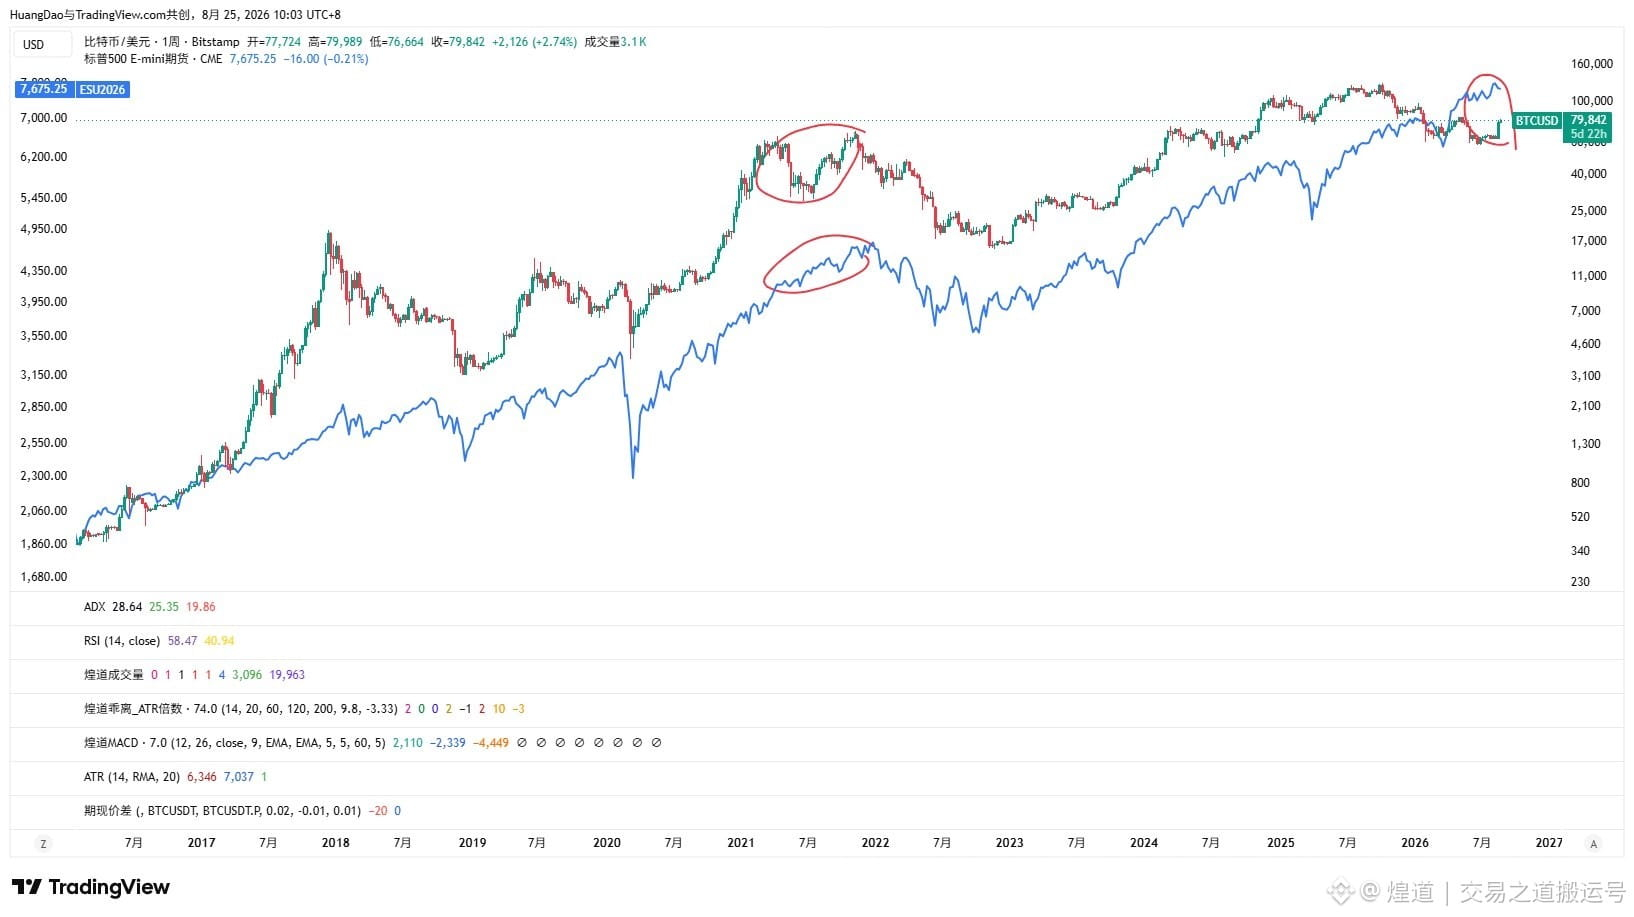
9.3 On how to find truly reliable bargain-hunt signals—here is a very practical perspective. You can focus on the market performance of MSTR and BTC. When their price action diverges, it often indicates that the market is about to reach a top or a bottom.
We can look back at the highest points of BTC in the last two bull markets and the lowest point of the previous cycle. In these three key market turning points, MSTR did not choose to follow BTC’s path—instead, it showed a clear divergence trend.
From a deeper logic standpoint, once a leveraged instrument refuses to move in sync with the spot market, it suggests that current market sentiment has reached some kind of extreme state. At that moment, those “smart money” players will choose to stop following, and this phenomenon often gives rise to a real major top or major bottom. It’s worth noting that, given current market conditions, we have not yet seen this critical divergence signal emerge.
We can look back at the highest points of BTC in the last two bull markets and the lowest point of the previous cycle. In these three key market turning points, MSTR did not choose to follow BTC’s path—instead, it showed a clear divergence trend.
From a deeper logic standpoint, once a leveraged instrument refuses to move in sync with the spot market, it suggests that current market sentiment has reached some kind of extreme state. At that moment, those “smart money” players will choose to stop following, and this phenomenon often gives rise to a real major top or major bottom. It’s worth noting that, given current market conditions, we have not yet seen this critical divergence signal emerge.
Looking back at the development of cryptocurrencies, the core figures who truly brought this industry into the mainstream public eye are actually only three people—a leap that even cz, who has long been highly influential, has never managed to achieve.
First, let’s go back to 2021. At the time, Musk publicly called out Dogecoin. After this extremely feverish market sentiment reached its peak, it directly triggered the remarkable 519 liquidation event.
Then, looking at the market in 2025, Trump chose to issue tokens on the Solana chain. This major move also pushed Solana’s price action to its peak.
Now in 2026, with the emergence of the Sun-ge (孙割) and Jing Tian (景甜) incident, it’s hard not to pause and wonder: could this current BTC rebound be approaching the point where it tops out as well? Market participants are all speculating—does this behind-the-scenes mean that Sun-ge has already set up a short position in advance?
First, let’s go back to 2021. At the time, Musk publicly called out Dogecoin. After this extremely feverish market sentiment reached its peak, it directly triggered the remarkable 519 liquidation event.
Then, looking at the market in 2025, Trump chose to issue tokens on the Solana chain. This major move also pushed Solana’s price action to its peak.
Now in 2026, with the emergence of the Sun-ge (孙割) and Jing Tian (景甜) incident, it’s hard not to pause and wonder: could this current BTC rebound be approaching the point where it tops out as well? Market participants are all speculating—does this behind-the-scenes mean that Sun-ge has already set up a short position in advance?
Looking back across the long history of the cryptocurrency industry, the truth is that there were only three people who genuinely helped this field break through and enter the public eye. It has to be said—this is a feat that even cz hasn’t managed to achieve.
The first to take the stage is Musk. In 21, he loudly promoted Dogecoin, pushing the market’s frenzy to its highest peak—before inevitably triggering the brutal 519 liquidation event.
The second is Trump. Fast forward to 25, and he chose to issue tokens on the Sol network. That move directly spurred Sol’s price action to its peak.
And the third story takes place in 26. As news spread about Sun Ge sleeping with Jing Tian, the market seemed to reach another strange turning point. Given all the past experiences and patterns, people can’t help but wonder: with this current wave of BTC rebound, is it also about to hit the top—right away?
The first to take the stage is Musk. In 21, he loudly promoted Dogecoin, pushing the market’s frenzy to its highest peak—before inevitably triggering the brutal 519 liquidation event.
The second is Trump. Fast forward to 25, and he chose to issue tokens on the Sol network. That move directly spurred Sol’s price action to its peak.
And the third story takes place in 26. As news spread about Sun Ge sleeping with Jing Tian, the market seemed to reach another strange turning point. Given all the past experiences and patterns, people can’t help but wonder: with this current wave of BTC rebound, is it also about to hit the top—right away?
Recently, the comment section on actress Jing Tian’s social media platforms has seen a surge of public attention, with many people flooding in and leaving messages. Everyone has been expressing their views with humorous remarks.
Some netizens, in a joking tone, asked whether this is pure love or a beauty trap arranged by the Communist Party. Others joked that she nearly made a great contribution to China, almost succeeding in getting Justin Sun (Sun Yuchen) extradited back to the country. Meanwhile, some comments teased that the money should be fully bet on Zhang Xiaoqian, saying that as long as the fingernails are trimmed neatly, one can touch wherever they want.
After scanning through these heated discussions, many people lament that, looking at the entire affair, the most despairing situation is actually that of the accountant. In addition, netizens also raised such questions: since Jing Tian is the mom, does the father have to be Zhang Jike?
As for the romantic updates among these parties, someone in the comments provided a vivid summary, saying it went like this: Zhang took over as the “receptacle” for Wang, and then Sun again took over as the “receptacle” for Zhang. Finally, a netizen put it very sharply: as long as the money supply on Sun’s side comes to a stop, the feelings between the two will immediately become zero.
Some netizens, in a joking tone, asked whether this is pure love or a beauty trap arranged by the Communist Party. Others joked that she nearly made a great contribution to China, almost succeeding in getting Justin Sun (Sun Yuchen) extradited back to the country. Meanwhile, some comments teased that the money should be fully bet on Zhang Xiaoqian, saying that as long as the fingernails are trimmed neatly, one can touch wherever they want.
After scanning through these heated discussions, many people lament that, looking at the entire affair, the most despairing situation is actually that of the accountant. In addition, netizens also raised such questions: since Jing Tian is the mom, does the father have to be Zhang Jike?
As for the romantic updates among these parties, someone in the comments provided a vivid summary, saying it went like this: Zhang took over as the “receptacle” for Wang, and then Sun again took over as the “receptacle” for Zhang. Finally, a netizen put it very sharply: as long as the money supply on Sun’s side comes to a stop, the feelings between the two will immediately become zero.




8.27 The coming week will be a critical period to test whether the current market is truly a bull market.
Judging purely from the technical price action, last week’s breakout looks almost identical to the early-stage performance seen in previous bull markets. However, if we analyze from the perspective of market sentiment, the two are quite different.
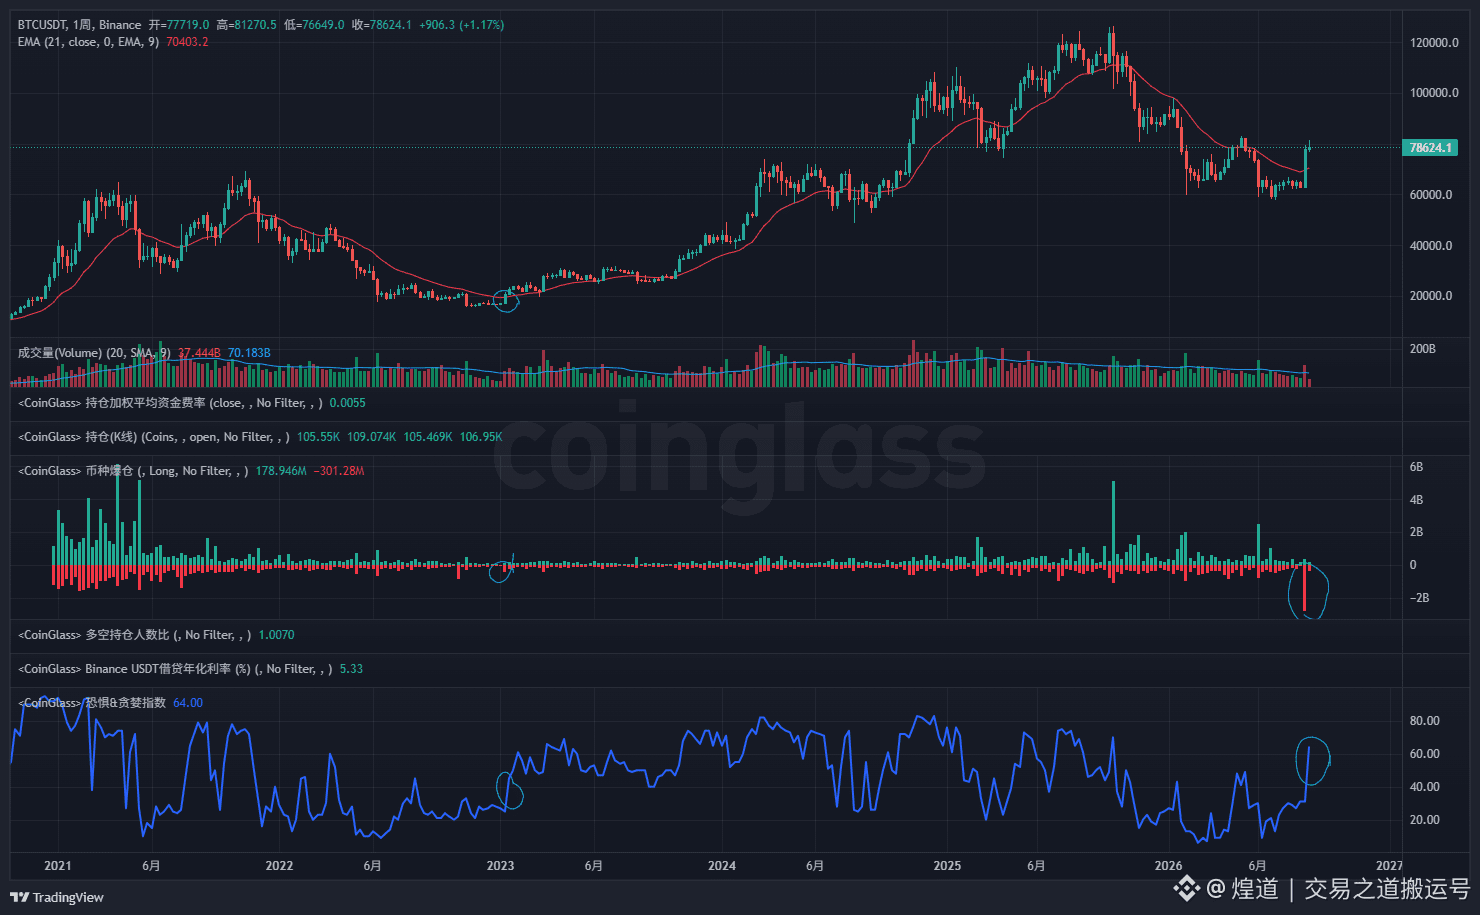
First, last week the market witnessed a short-squeeze liquidation scale that set a new historical record, while the Greed and Fear Index also jumped to 74 in one go. These data suggest that public investment enthusiasm has been fully ignited. Yet experience tells us that the true starting point of a bull market often unfolds slowly in a quiet atmosphere full of hesitation.
Second, current US stock index levels are in a historic high-range zone. Looking back at past cycle patterns, market upturns are typically synchronized with US stock indices recovering from relatively low levels.
Therefore, the market outlook for the next 1–2 weeks is especially important. If BTC fails to successfully break through the 83,000 level in the near term, the probability that this rally is a false breakout will be very high. In that case, it will not be the beginning of a bull market; instead, it could become a signal that poses a significant risk to the long side. After the short-side force is comprehensively liquidated, downward pressure is likely to shift in turn toward the long side.
Judging purely from the technical price action, last week’s breakout looks almost identical to the early-stage performance seen in previous bull markets. However, if we analyze from the perspective of market sentiment, the two are quite different.
First, last week the market witnessed a short-squeeze liquidation scale that set a new historical record, while the Greed and Fear Index also jumped to 74 in one go. These data suggest that public investment enthusiasm has been fully ignited. Yet experience tells us that the true starting point of a bull market often unfolds slowly in a quiet atmosphere full of hesitation.
Second, current US stock index levels are in a historic high-range zone. Looking back at past cycle patterns, market upturns are typically synchronized with US stock indices recovering from relatively low levels.
Therefore, the market outlook for the next 1–2 weeks is especially important. If BTC fails to successfully break through the 83,000 level in the near term, the probability that this rally is a false breakout will be very high. In that case, it will not be the beginning of a bull market; instead, it could become a signal that poses a significant risk to the long side. After the short-side force is comprehensively liquidated, downward pressure is likely to shift in turn toward the long side.
Market Watch: Two Key Signals Worth Paying Attention to on August 26
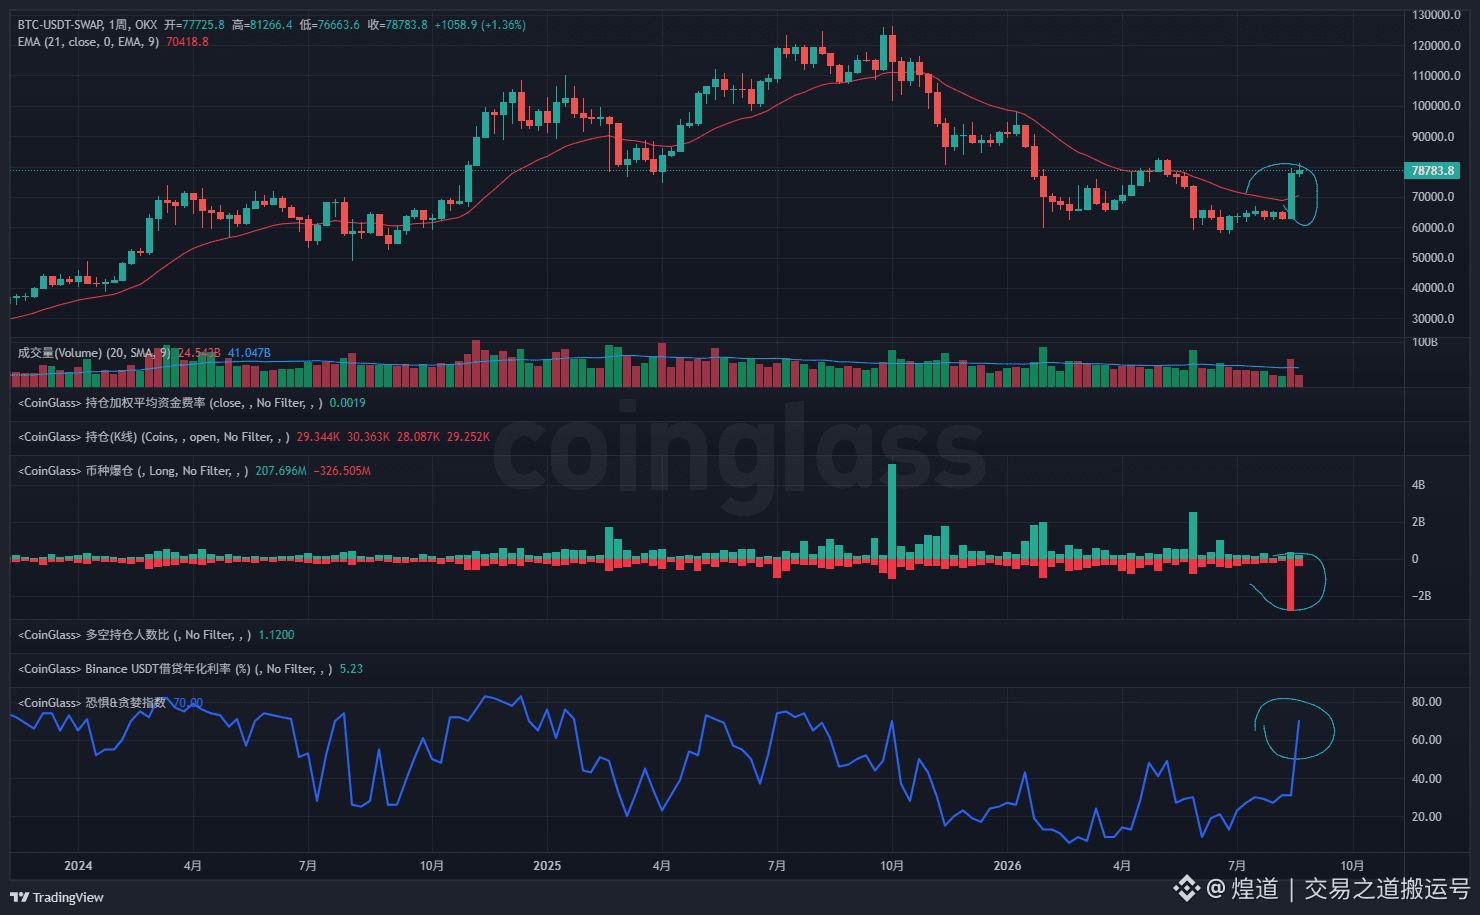
Friends, in the market action on August 26, we noticed two unusual signs that everyone should be extra cautious about.
The first is a noticeable change in market sentiment indicators. In recent days, the Fear & Greed Index has surged rapidly to 64. Based on past experience, in the early stage of a bull market, investors often go through a psychological shift from staying in watch-and-wait mode to gradually growing hesitant. At this time, the index usually stays in the 30–40 range. In addition, in the initial phase, big players generally do not want to attract a large amount of chasing crowd to enter the market.
The second signal comes from liquidation data on trading platforms. Just last week, exchanges worldwide collectively went through the largest short-squeeze liquidation event in history. Generally speaking, in the early stage of a bull market, price rallies are often carried out quietly. However, the recent rally has been unusually loud, making it hard not to suspect there may be a risk of inducing long positions to enter and become bagholders by forcing liquidation of shorts.
Taken together, these two points allow us to establish a key observation indicator. If, in the upcoming market moves, BTC cannot quickly break upward through the critical level of 83,000, then my personal overall bullish outlook for the future will decrease significantly.
Friends, in the market action on August 26, we noticed two unusual signs that everyone should be extra cautious about.
The first is a noticeable change in market sentiment indicators. In recent days, the Fear & Greed Index has surged rapidly to 64. Based on past experience, in the early stage of a bull market, investors often go through a psychological shift from staying in watch-and-wait mode to gradually growing hesitant. At this time, the index usually stays in the 30–40 range. In addition, in the initial phase, big players generally do not want to attract a large amount of chasing crowd to enter the market.
The second signal comes from liquidation data on trading platforms. Just last week, exchanges worldwide collectively went through the largest short-squeeze liquidation event in history. Generally speaking, in the early stage of a bull market, price rallies are often carried out quietly. However, the recent rally has been unusually loud, making it hard not to suspect there may be a risk of inducing long positions to enter and become bagholders by forcing liquidation of shorts.
Taken together, these two points allow us to establish a key observation indicator. If, in the upcoming market moves, BTC cannot quickly break upward through the critical level of 83,000, then my personal overall bullish outlook for the future will decrease significantly.
In BTC’s upward trend, everyone can focus on two very core levels.
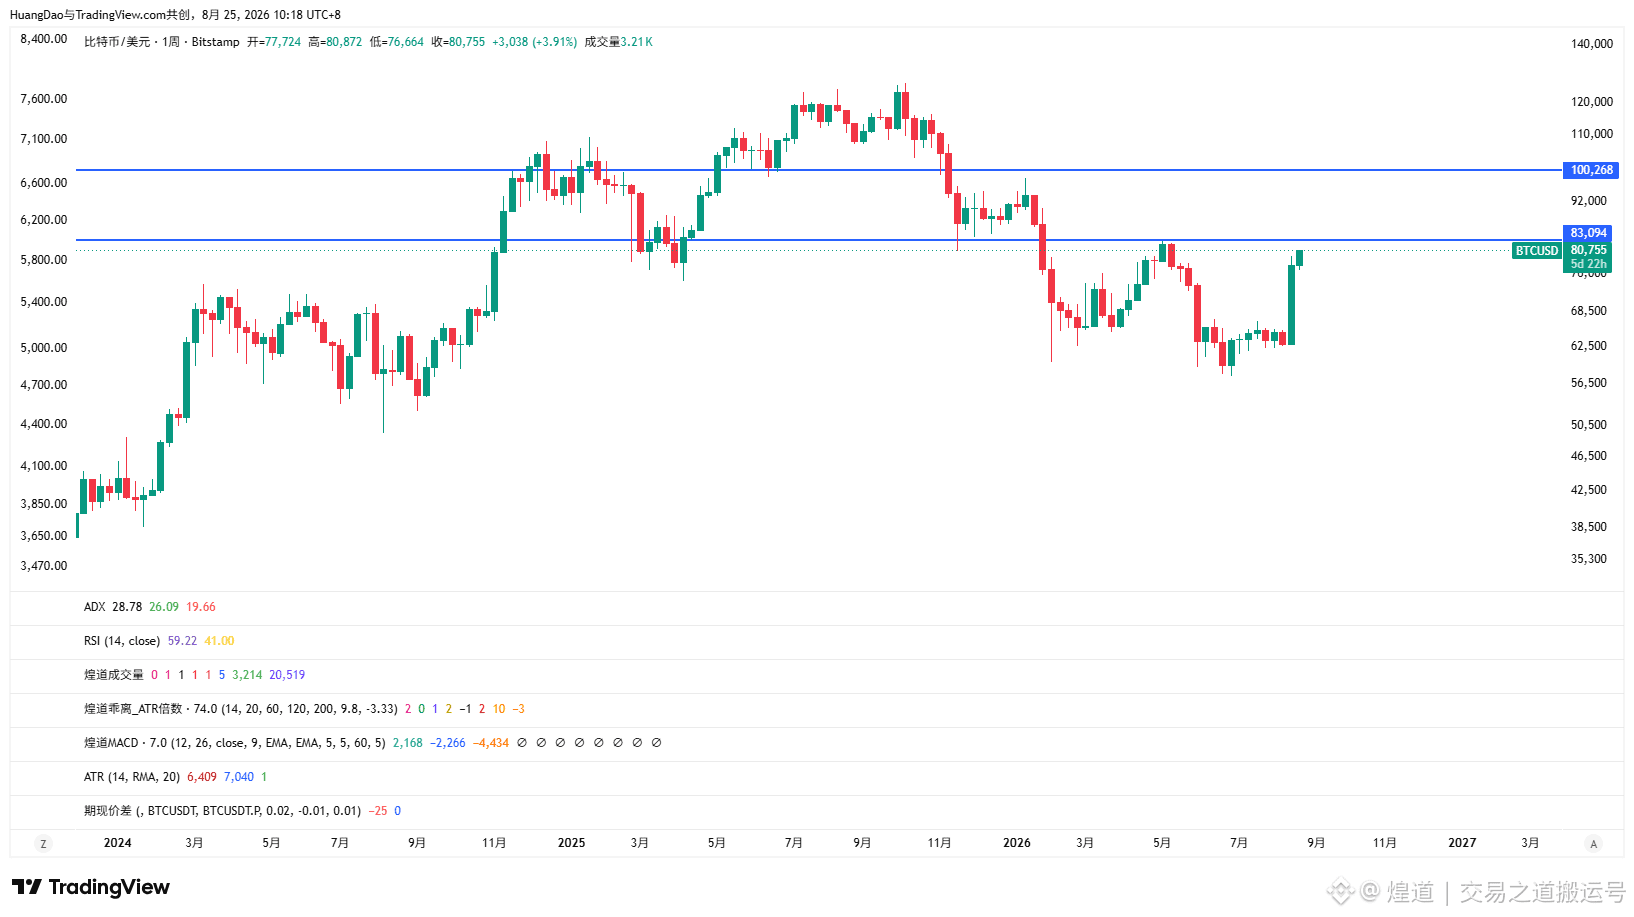
First is around 83,000. This is the first prior swing high. If the price can successfully break above it, it means the market has formed a higher high, thereby officially signaling the end of the downtrend. However, it’s worth noting that after this breakout, the market often sees a first wave of a relatively solid pullback.
The other key level is around the 100,000 mark. This is a complex area where multiple resistance factors overlap. It’s not only the big round psychological level in many people’s minds, but it also happens to sit at the crucial Fibonacci 0.618 position—and there is a densely packed zone of trapped positions above it. Due to these combined factors, when the price reaches this region, a pullback with a larger magnitude is expected to be triggered.
First is around 83,000. This is the first prior swing high. If the price can successfully break above it, it means the market has formed a higher high, thereby officially signaling the end of the downtrend. However, it’s worth noting that after this breakout, the market often sees a first wave of a relatively solid pullback.
The other key level is around the 100,000 mark. This is a complex area where multiple resistance factors overlap. It’s not only the big round psychological level in many people’s minds, but it also happens to sit at the crucial Fibonacci 0.618 position—and there is a densely packed zone of trapped positions above it. Due to these combined factors, when the price reaches this region, a pullback with a larger magnitude is expected to be triggered.
8.25 Market Depth Analysis: Are We Entering a New Bull Market, or Is This Just the Last Rebound of the Old One?
Friends, today we will objectively sort out the current market trend. By comparing historical data, we can see that in the past, the lowest points of bear markets usually clustered in the year-end period. However, the bottom of this cycle’s行情 has already emerged in the third quarter—this timing is much earlier than the traditional patterns of the past.
In addition, the macro environment has also been quite different from previous cycles. In earlier periods, when bear markets bottomed out, it was often accompanied by sustained declines in stock indices and lingering attempts to form a base. But this time, the macro stock index is operating at the high end of its historical range.
Looking back at the market’s development, the only period that best matches the current situation is a special interval in the previous bull market. At that time, BTC also went through a round of price “halving,” with a sharp pullback from an absolute high of 64,000 to 30,000, and then it only gathered strength afterward to surge to a new all-time high record. Even more coincidentally, the timing of that base formation was also in July, and the stock-index environment was likewise maintained near new highs.
Although in market analysis we don’t need to cling rigidly to old lessons or fully copy past experiences, given these highly similar objective features, everyone still needs to remain sufficiently vigilant about the risk that the market could play out in a similar way in the future.
Friends, today we will objectively sort out the current market trend. By comparing historical data, we can see that in the past, the lowest points of bear markets usually clustered in the year-end period. However, the bottom of this cycle’s行情 has already emerged in the third quarter—this timing is much earlier than the traditional patterns of the past.
In addition, the macro environment has also been quite different from previous cycles. In earlier periods, when bear markets bottomed out, it was often accompanied by sustained declines in stock indices and lingering attempts to form a base. But this time, the macro stock index is operating at the high end of its historical range.
Looking back at the market’s development, the only period that best matches the current situation is a special interval in the previous bull market. At that time, BTC also went through a round of price “halving,” with a sharp pullback from an absolute high of 64,000 to 30,000, and then it only gathered strength afterward to surge to a new all-time high record. Even more coincidentally, the timing of that base formation was also in July, and the stock-index environment was likewise maintained near new highs.
Although in market analysis we don’t need to cling rigidly to old lessons or fully copy past experiences, given these highly similar objective features, everyone still needs to remain sufficiently vigilant about the risk that the market could play out in a similar way in the future.
Market Guide: Response Strategies After Missing Out on the Opportunity (8.24)
In response to the “missed the move” concern that many people have been asking about recently, here are a few objective market observations and suggestions.
First, based on the weekly chart, BTC and major mainstream crypto assets have clearly broken away from the downtrend that began after 120,000. This means that even if you didn’t manage to precisely time the buy at the absolute bottom, the current price range is still an excellent early stage for right-side trading within the broader cycle—so it’s not too late to enter.
Second, regarding near-term price expectations, it’s unlikely that the market will see a major deep retracement until BTC reaches and successfully breaks through the key level of 83,000. However, once the price breaks through this level smoothly, it will inevitably be followed by a technical pullback—at that point, it will be a good opportunity for you to continue increasing your positions prudently.
Finally, for investment mindset, it’s recommended to focus on the present and avoid setting targets too far into the future. Considering that the Nasdaq index is still trading within its historical high-range, the market performance ahead may not necessarily be the comprehensive bull market we’re hoping for. It’s entirely possible that it will show a local bull market similar to what we saw in 2019 and 2021. Therefore, maintaining rational expectations and a steady investment pace is especially important.
In response to the “missed the move” concern that many people have been asking about recently, here are a few objective market observations and suggestions.
First, based on the weekly chart, BTC and major mainstream crypto assets have clearly broken away from the downtrend that began after 120,000. This means that even if you didn’t manage to precisely time the buy at the absolute bottom, the current price range is still an excellent early stage for right-side trading within the broader cycle—so it’s not too late to enter.
Second, regarding near-term price expectations, it’s unlikely that the market will see a major deep retracement until BTC reaches and successfully breaks through the key level of 83,000. However, once the price breaks through this level smoothly, it will inevitably be followed by a technical pullback—at that point, it will be a good opportunity for you to continue increasing your positions prudently.
Finally, for investment mindset, it’s recommended to focus on the present and avoid setting targets too far into the future. Considering that the Nasdaq index is still trading within its historical high-range, the market performance ahead may not necessarily be the comprehensive bull market we’re hoping for. It’s entirely possible that it will show a local bull market similar to what we saw in 2019 and 2021. Therefore, maintaining rational expectations and a steady investment pace is especially important.
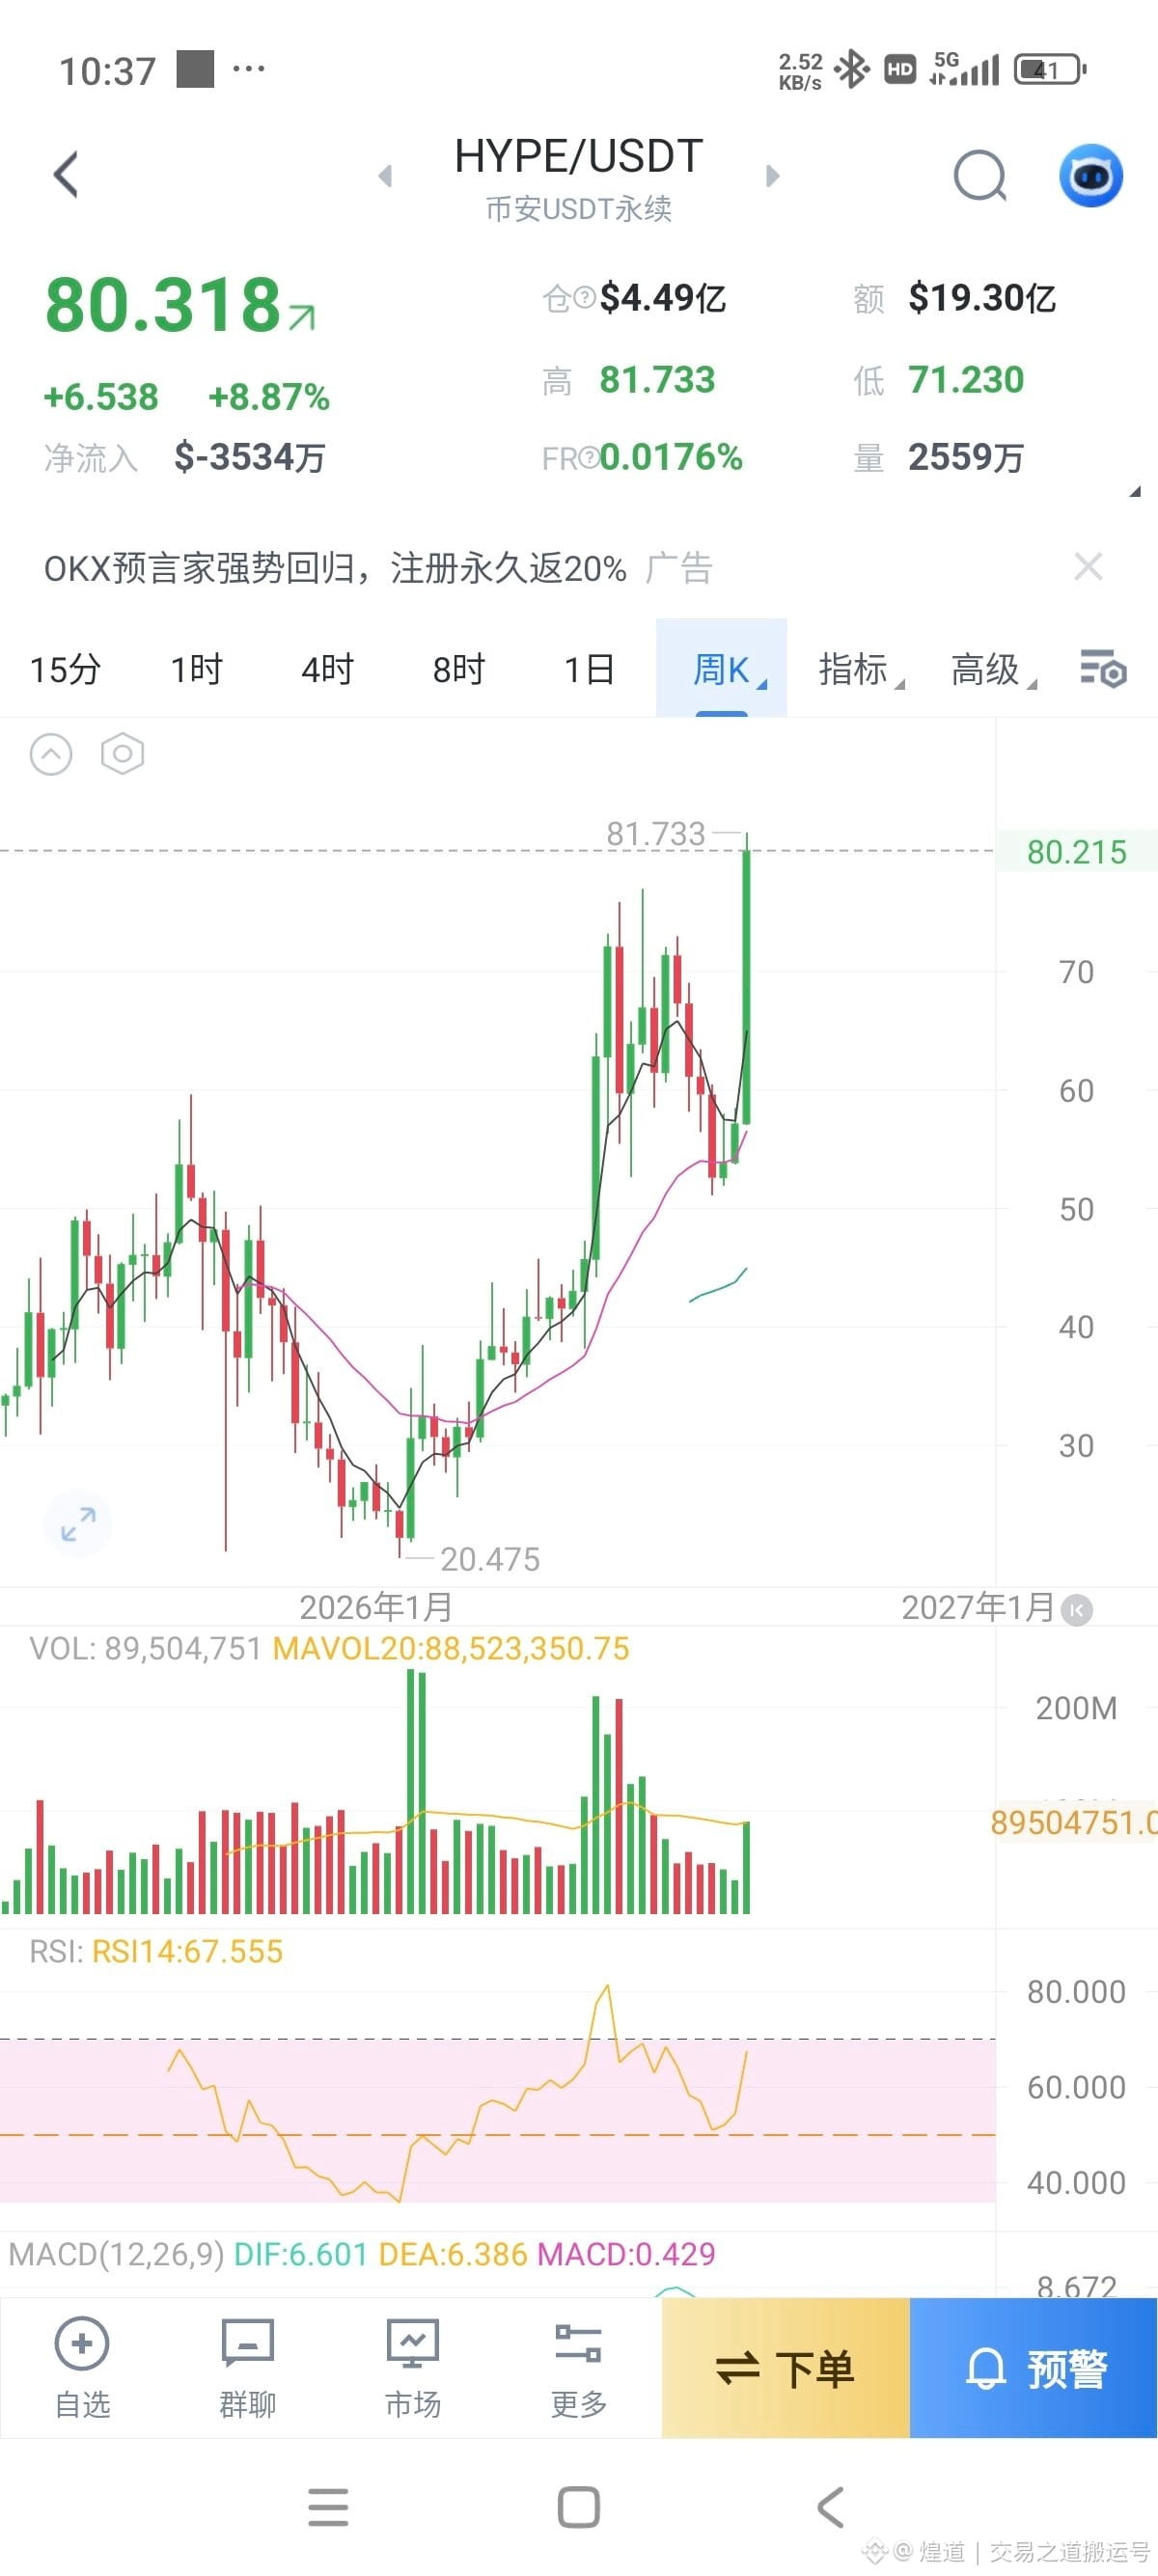
Very soon, #Hype successfully broke the record and reached the highest price in history. Across the entire cryptocurrency market, it is currently the only large-cap asset to achieve a new high. For the next bull market cycle, I am confident that its performance will far surpass BTC, and its circulating market cap will also cross the one-hundred-billion-dollar mark. Without exaggeration, in the bull market cycle that is about to come, this is my personal most favorite crypto project—absolutely number one.
August 21 Market Outlook Discussion: Has the Bull Market Already Arrived?
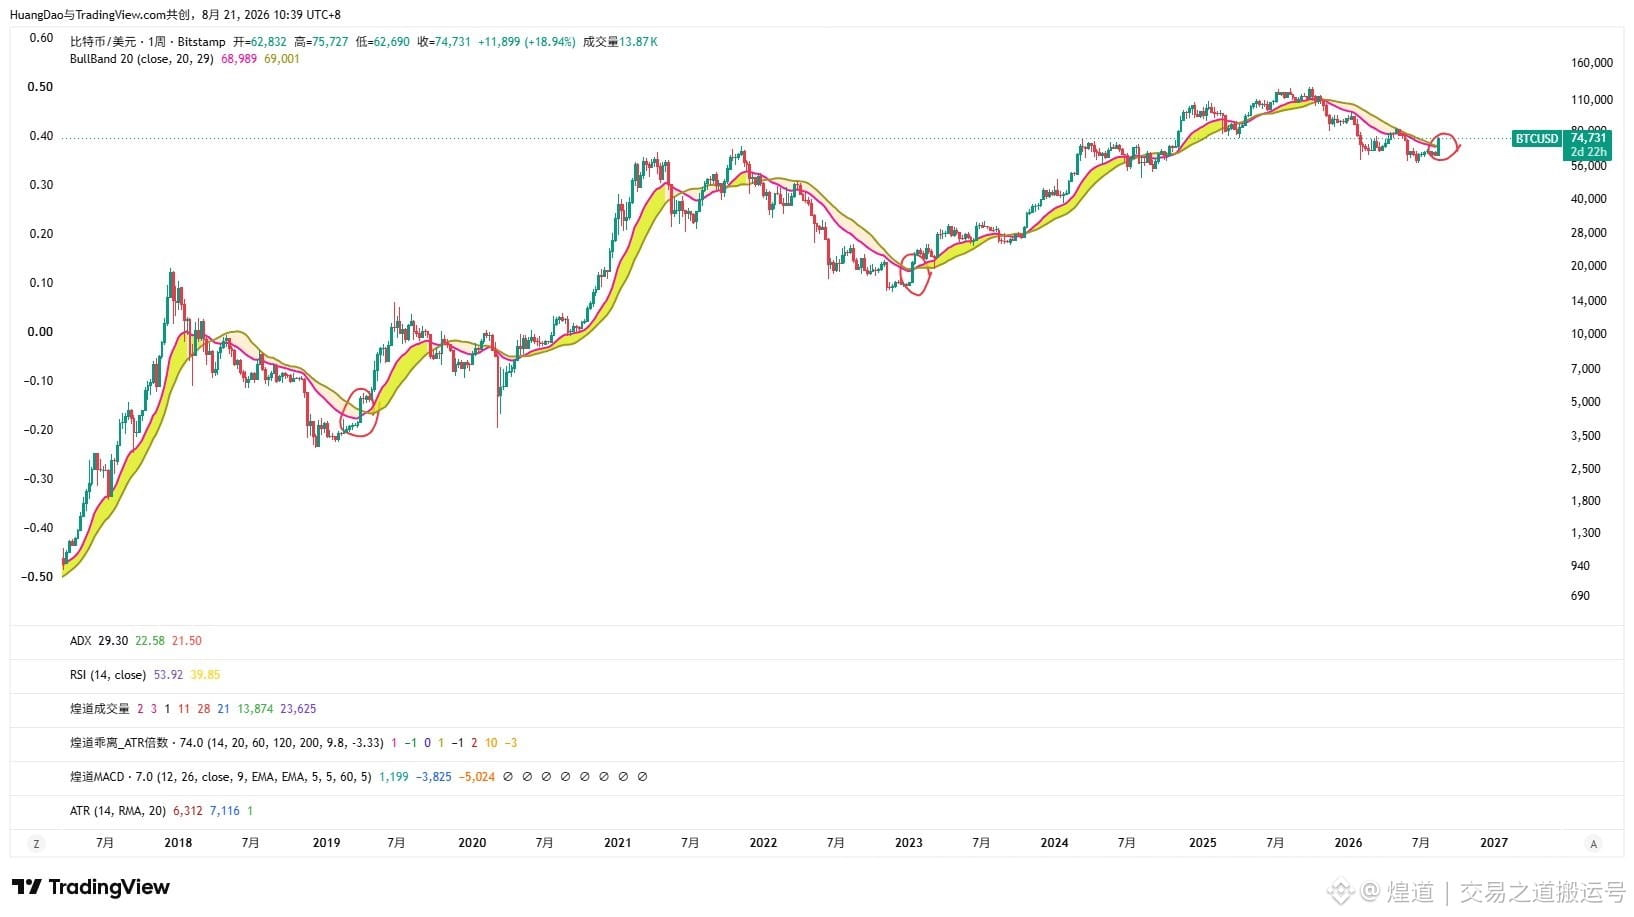
Friends, today we’re going to take an in-depth look at the recent price action. If we use only the technical chart patterns of the candlesticks as the reference standard, the market’s trajectory shown on the weekly chart is nearly identical to the situation when the 2018 and 2022 bear markets were transitioning from their late stages into the early bull market period. With a particularly large-volume, solid-bodied candlestick successfully landing and firmly stepping onto the bull market support zone, at the weekly level we have received an extremely clear and strong bullish long signal.
However, we need to pay attention to one key difference between the current environment and the past. In 2018 and 2022, when bottom structures were forming, the stock index was also simultaneously at the trough. But now, the stock index still remains in the historical high range. In comparison, the macro backdrop today is actually closer to the situation in May 2021 from the previous market cycle. At that time, BTC suffered a sudden drop from 60,000 to 30,000, after which it fought back against the trend and went on to set a new all-time high of 69,000. During that period, the stock index also stayed within the historical high zone. Based on a comprehensive assessment of all the data above, regardless of how the market rhythm evolves afterward, the current bullish momentum is at least able to support the continuation of the uptrend for one to two more months.
Friends, today we’re going to take an in-depth look at the recent price action. If we use only the technical chart patterns of the candlesticks as the reference standard, the market’s trajectory shown on the weekly chart is nearly identical to the situation when the 2018 and 2022 bear markets were transitioning from their late stages into the early bull market period. With a particularly large-volume, solid-bodied candlestick successfully landing and firmly stepping onto the bull market support zone, at the weekly level we have received an extremely clear and strong bullish long signal.
However, we need to pay attention to one key difference between the current environment and the past. In 2018 and 2022, when bottom structures were forming, the stock index was also simultaneously at the trough. But now, the stock index still remains in the historical high range. In comparison, the macro backdrop today is actually closer to the situation in May 2021 from the previous market cycle. At that time, BTC suffered a sudden drop from 60,000 to 30,000, after which it fought back against the trend and went on to set a new all-time high of 69,000. During that period, the stock index also stayed within the historical high zone. Based on a comprehensive assessment of all the data above, regardless of how the market rhythm evolves afterward, the current bullish momentum is at least able to support the continuation of the uptrend for one to two more months.
8.20 Market Dynamics Update: Has the Bear Market Really Ended?
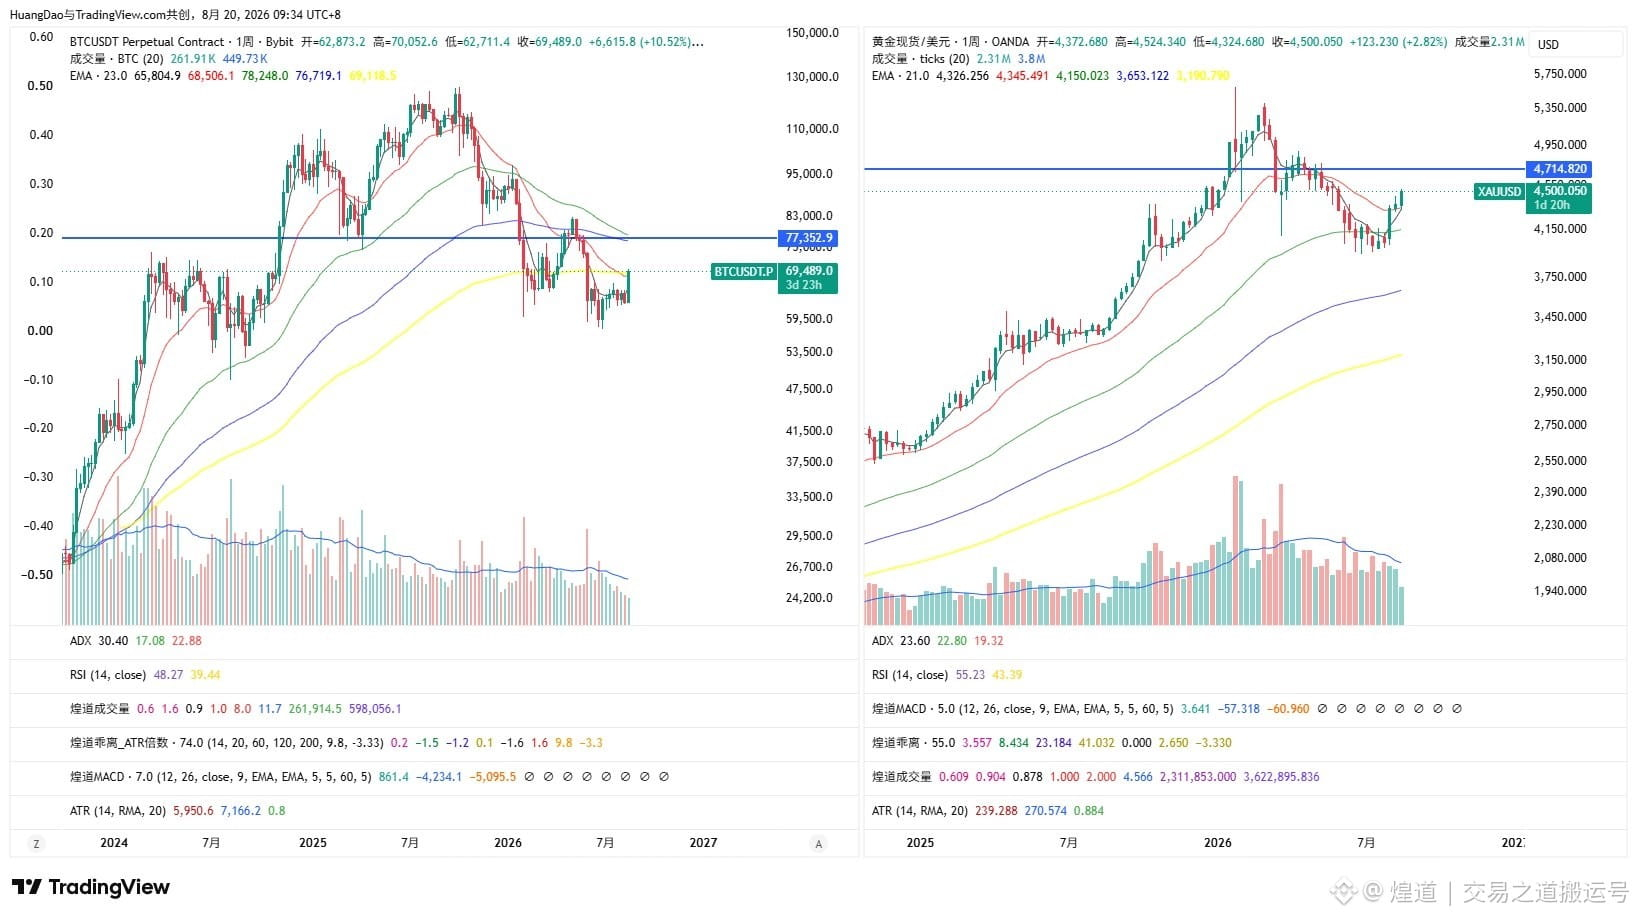
In yesterday’s market, both BTC and gold became the leading gainers. In fact, it’s not hard to see that their recent price action shows a strong similarity. Both are currently in a phase of recovery after experiencing a stretch of continuous declines. However, friends need to understand that the current bear market has not truly come to an end yet. If BTC’s performance remains relatively strong, there is a chance that the price could revisit the 77,000 area. But to break through the previous swing’s high at 83,000 is still, for now, not very realistic. Under the same market logic, gold’s price is also expected to pull back to around the 4,700 region.
When facing the current行情 (market conditions), everyone should stay rational. This kind of rapid surge in a short period of time is mainly aimed at trapping shorts; in essence, it is setting the stage for the start of a new round of downward trend. A clear feature of this type of market is that it comes quickly and leaves just as fast. Based on the current market tempo, this rebound is expected to end within about two to three weeks.
In yesterday’s market, both BTC and gold became the leading gainers. In fact, it’s not hard to see that their recent price action shows a strong similarity. Both are currently in a phase of recovery after experiencing a stretch of continuous declines. However, friends need to understand that the current bear market has not truly come to an end yet. If BTC’s performance remains relatively strong, there is a chance that the price could revisit the 77,000 area. But to break through the previous swing’s high at 83,000 is still, for now, not very realistic. Under the same market logic, gold’s price is also expected to pull back to around the 4,700 region.
When facing the current行情 (market conditions), everyone should stay rational. This kind of rapid surge in a short period of time is mainly aimed at trapping shorts; in essence, it is setting the stage for the start of a new round of downward trend. A clear feature of this type of market is that it comes quickly and leaves just as fast. Based on the current market tempo, this rebound is expected to end within about two to three weeks.
8.18 Several Dangerous Signals Worth Watching in the Market
Recently, as the market develops, we have observed a number of phenomena that require caution. First is a rather dangerous signal: an increasing number of KOLs have begun to join the camp that believes the BTC bear market is bottoming. Based on historical experience, the true bottom of a bear market is usually accompanied by significant divergence of opinions, yet now almost everyone is leaning overwhelmingly toward the view that the bottom has already arrived. This level of consensus in sentiment is certainly something we should think deeply about.
Second, we need to pay attention to the state of the macro financial markets. The S&P index is still holding at historical highs. Looking back at past data, we have never seen a bear market bottom while the stock index remained at such a high level. If the stock index were to enter a bear-market cycle in the future, BTC would inevitably have further room to decline. This suggests that the latter half of the current bear market may not have truly started yet.
Finally, historical price action also provides us with some important references. Looking back at 2018 and 2022, during the period from June to October in both years, the market was in a sustained phase of choppy, range-bound movement. Then, around the mid-November period election, the market ultimately triggered a final wave of heavy selloff. These objective patterns from the past are all reminding us that, when facing the current market, staying clear-headed and rational is especially important.
Recently, as the market develops, we have observed a number of phenomena that require caution. First is a rather dangerous signal: an increasing number of KOLs have begun to join the camp that believes the BTC bear market is bottoming. Based on historical experience, the true bottom of a bear market is usually accompanied by significant divergence of opinions, yet now almost everyone is leaning overwhelmingly toward the view that the bottom has already arrived. This level of consensus in sentiment is certainly something we should think deeply about.
Second, we need to pay attention to the state of the macro financial markets. The S&P index is still holding at historical highs. Looking back at past data, we have never seen a bear market bottom while the stock index remained at such a high level. If the stock index were to enter a bear-market cycle in the future, BTC would inevitably have further room to decline. This suggests that the latter half of the current bear market may not have truly started yet.
Finally, historical price action also provides us with some important references. Looking back at 2018 and 2022, during the period from June to October in both years, the market was in a sustained phase of choppy, range-bound movement. Then, around the mid-November period election, the market ultimately triggered a final wave of heavy selloff. These objective patterns from the past are all reminding us that, when facing the current market, staying clear-headed and rational is especially important.
Market Analysis for August 17: 2026 May See Another “Final Dip” Again
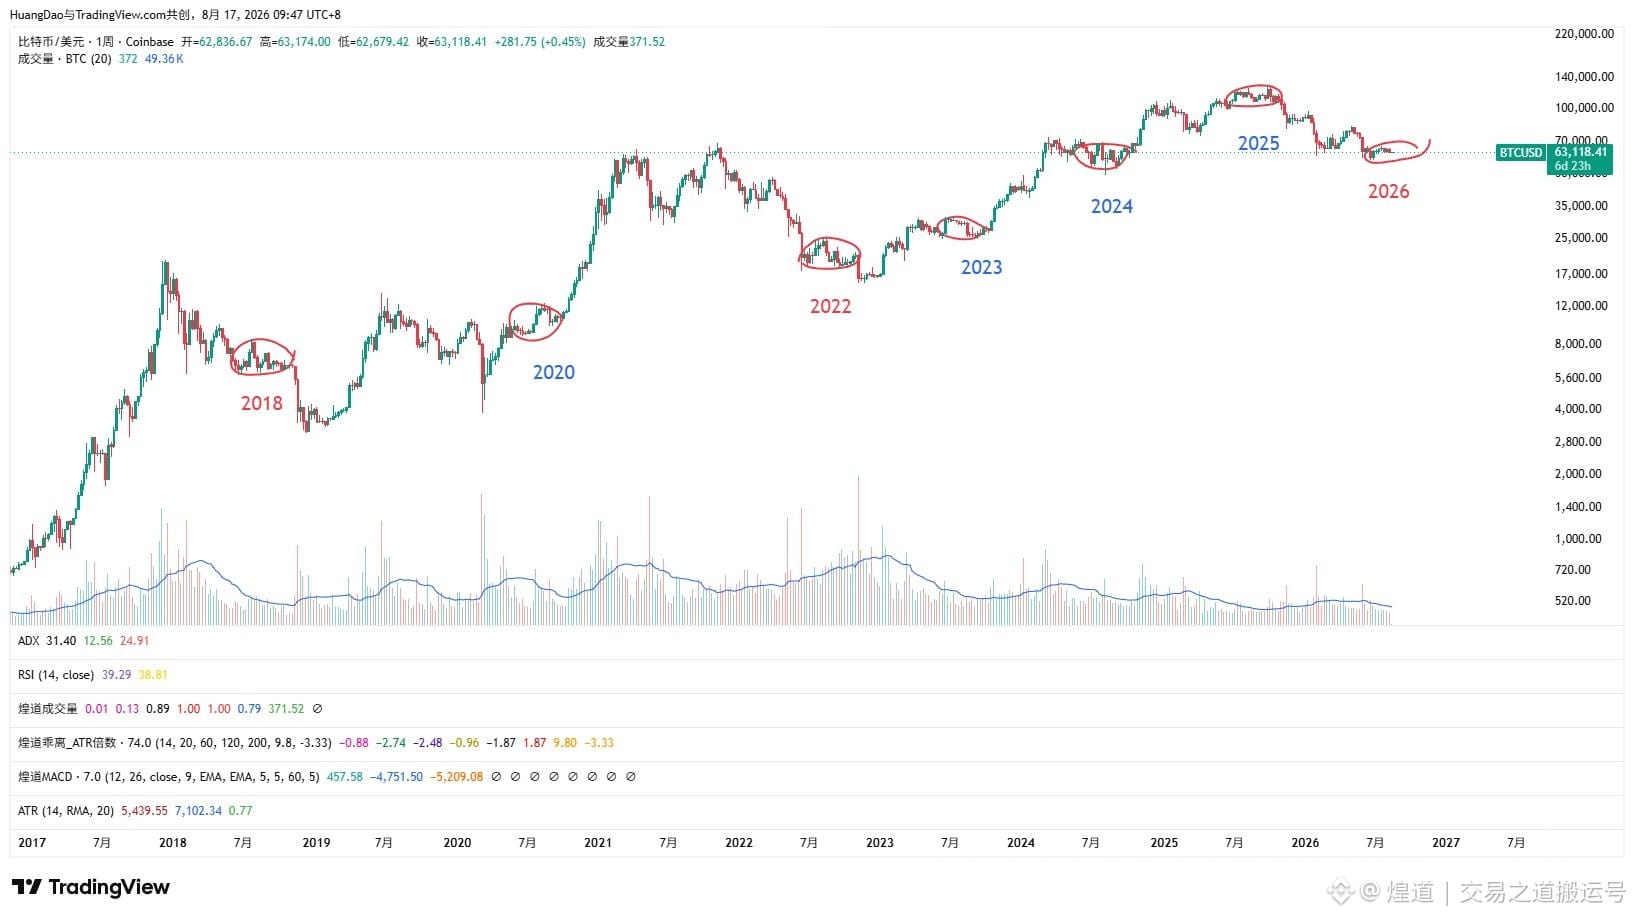
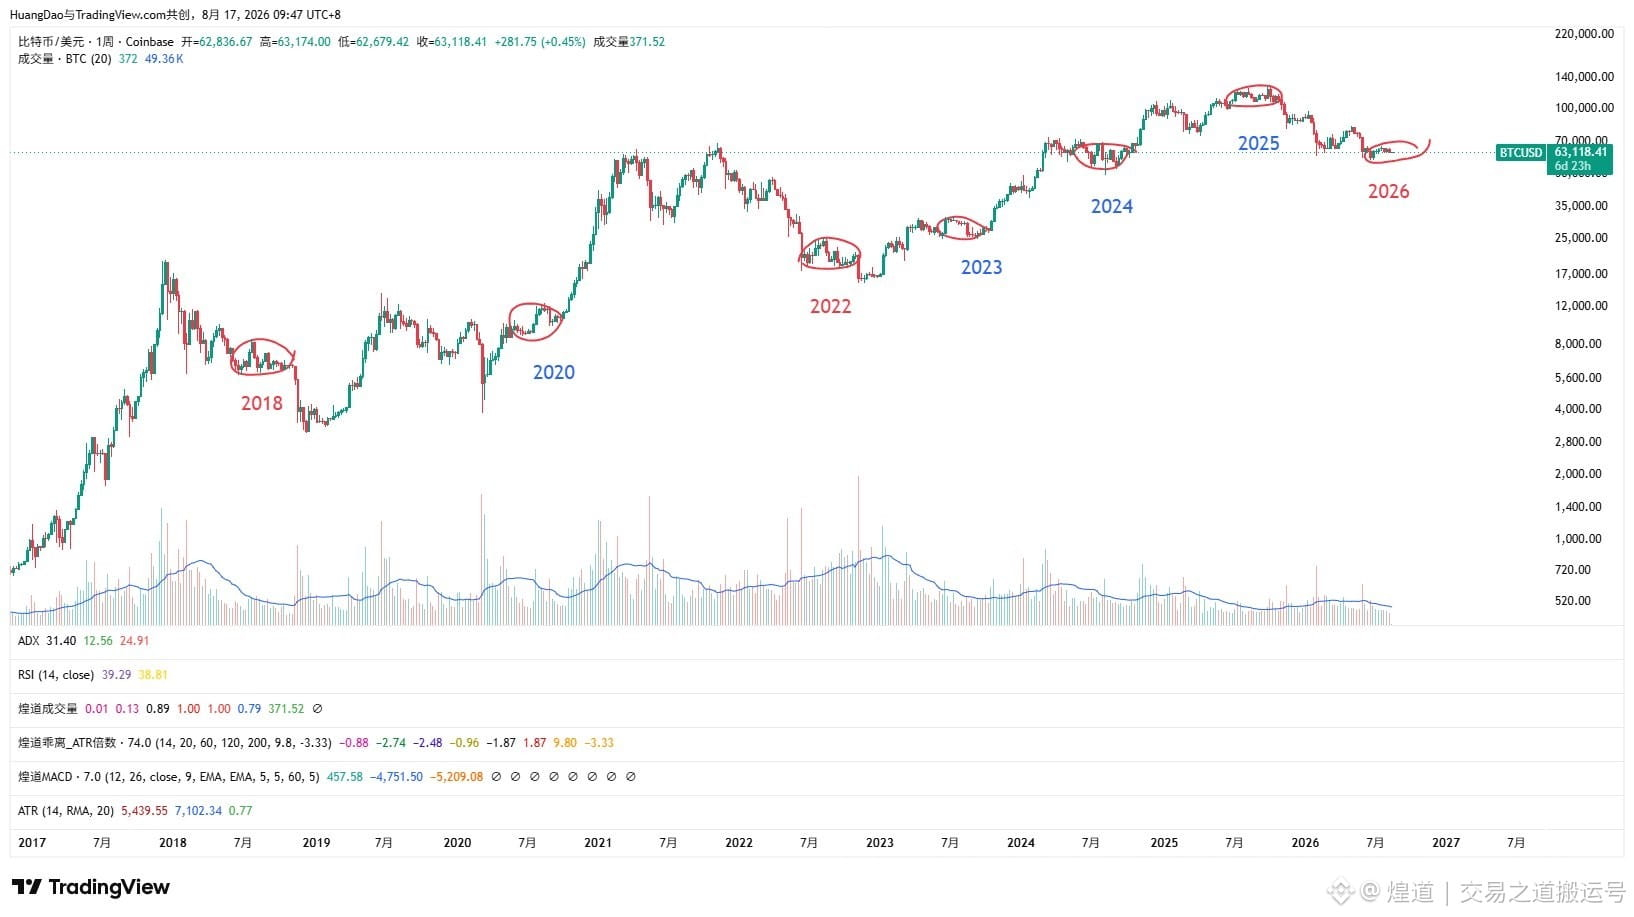
Hello everyone. Today, I’d like to discuss the cyclical patterns of the cryptocurrency market. Looking back at BTC’s historical performance, we can see that from June to October each year often falls into a relatively calm period of consolidation and range trading. By closely observing 2018, 2020, 2022, 2023, 2024, and 2025, we find that this cycle’s behavior is nearly replayed almost every year. During these months, market volatility often narrows significantly to between 20% and 30%, and only from October to November does the market truly pick a direction and break out into a clear trend.
This year-end trend breakout is not accidental—it has a very close relationship with the U.S. midterm elections held in November. Policy changes triggered by the election process are often the core factor that disrupts market calm and causes volatility to rise markedly.
Additionally, when reviewing past bear-market years, we can draw more cautionary conclusions. In the two typical bear-market years, 2018 and 2022, the market also experienced this: after a long period of consolidation, it started a “final dip” in November that triggered extreme panic, ultimately revealing the bottom region. According to specific historical data, the severity of the two sell-offs differed—2018 saw a decline of 50%, while 2022 fell by 27%. Based on these objective patterns and cyclical logic, I’ve made a forecast for the 2026 market outlook: I believe that in 2026, there is a high likelihood of another “final pull-down,” and I expect the magnitude of this drop to exceed 30%. I hope this data-driven analysis can provide some useful references for your future planning.
Hello everyone. Today, I’d like to discuss the cyclical patterns of the cryptocurrency market. Looking back at BTC’s historical performance, we can see that from June to October each year often falls into a relatively calm period of consolidation and range trading. By closely observing 2018, 2020, 2022, 2023, 2024, and 2025, we find that this cycle’s behavior is nearly replayed almost every year. During these months, market volatility often narrows significantly to between 20% and 30%, and only from October to November does the market truly pick a direction and break out into a clear trend.
This year-end trend breakout is not accidental—it has a very close relationship with the U.S. midterm elections held in November. Policy changes triggered by the election process are often the core factor that disrupts market calm and causes volatility to rise markedly.
Additionally, when reviewing past bear-market years, we can draw more cautionary conclusions. In the two typical bear-market years, 2018 and 2022, the market also experienced this: after a long period of consolidation, it started a “final dip” in November that triggered extreme panic, ultimately revealing the bottom region. According to specific historical data, the severity of the two sell-offs differed—2018 saw a decline of 50%, while 2022 fell by 27%. Based on these objective patterns and cyclical logic, I’ve made a forecast for the 2026 market outlook: I believe that in 2026, there is a high likelihood of another “final pull-down,” and I expect the magnitude of this drop to exceed 30%. I hope this data-driven analysis can provide some useful references for your future planning.
Market Insight on August 17: A Discussion on Whether BTC May Face Its Last Pullback in 2026
Hello everyone. Today, let’s sort out the potential future trajectory of Bitcoin. Based on historical patterns, I personally believe that in 2026, BTC is highly likely to undergo one final major pullback and downside selloff, with the expected drawdown exceeding 30%.
Looking back at past market cycles, we can see a very clear seasonal feature. In 2018, 2020, 2022, 2023, 2024, and 2025, almost every year from June to October, Bitcoin has mostly been moving sideways and consolidating. During this extended consolidation period, market volatility typically gradually narrows to a range of 20% to 30%. Price action often needs to build momentum, and only from October to November does it truly break out into a clear direction.
If we focus our attention on two representative bear-market years—2018 and 2022—we can find striking similarities. In both years, after the initial period of sideways consolidation, the market launched its final selloff that triggered widespread panic in November, and that sequence ultimately succeeded in establishing a bottom. Although the magnitude of these bottom adjustments differed—2018 saw a 50% drop, while 2022 saw a 27% drop—the overall timing and rhythm were remarkably consistent. Based on these historical data, I infer that 2026 will likely see a similar ultimate pullback as well.
Delving into the deeper logic behind it, this kind of periodic anomaly is mainly closely related to the U.S. midterm elections held in November. Changes in policy direction brought about by the election process often serve as a key catalyst, which in turn leads to a significant amplification of volatility across the entire financial market.
Hello everyone. Today, let’s sort out the potential future trajectory of Bitcoin. Based on historical patterns, I personally believe that in 2026, BTC is highly likely to undergo one final major pullback and downside selloff, with the expected drawdown exceeding 30%.
Looking back at past market cycles, we can see a very clear seasonal feature. In 2018, 2020, 2022, 2023, 2024, and 2025, almost every year from June to October, Bitcoin has mostly been moving sideways and consolidating. During this extended consolidation period, market volatility typically gradually narrows to a range of 20% to 30%. Price action often needs to build momentum, and only from October to November does it truly break out into a clear direction.
If we focus our attention on two representative bear-market years—2018 and 2022—we can find striking similarities. In both years, after the initial period of sideways consolidation, the market launched its final selloff that triggered widespread panic in November, and that sequence ultimately succeeded in establishing a bottom. Although the magnitude of these bottom adjustments differed—2018 saw a 50% drop, while 2022 saw a 27% drop—the overall timing and rhythm were remarkably consistent. Based on these historical data, I infer that 2026 will likely see a similar ultimate pullback as well.
Delving into the deeper logic behind it, this kind of periodic anomaly is mainly closely related to the U.S. midterm elections held in November. Changes in policy direction brought about by the election process often serve as a key catalyst, which in turn leads to a significant amplification of volatility across the entire financial market.
August 12 Market Outlook: Tonight’s CPI Data Guidance and Recent Asset Price Movement Analysis
The CPI data to be released tonight has drawn significant attention, as it will directly serve as a key indicator for whether the September rate hike will be carried out. Broad expectations place the year-over-year CPI increase at 3.4%, and based on current market sentiment, the probability of implementing a rate hike in September is roughly 40%.
In the digital asset space, BTC and ETH are still maintaining a range-bound, choppy consolidation. The direction of any short-term breakout remains unclear. However, it’s worth noting that the recent performance of SOL/BTC appears particularly strong. This upward momentum is mainly driven by a steady stream of positive catalysts, including the Agave v4.2 network upgrade officially scheduled to be rolled out on August 17, as well as highly anticipated deflationary governance proposal(s) discussed in the market.
As for precious metals, after gold has carved out a stretch of consecutive rallying moves, it has now entered a consolidation and buildup phase. Since the current price still has room for further upside before reaching the anticipated target level of 4750, if the market subsequently sees a pullback, it could still be a good opportunity for investors to consider adding positions on dips.
In addition, looking at developments in regional stock markets, the Korean index has recently been in a rebound and recovery rhythm. For future trading observations, it’s recommended that everyone closely monitor and pay attention to potential technical resistance levels around the 7020 area.
The CPI data to be released tonight has drawn significant attention, as it will directly serve as a key indicator for whether the September rate hike will be carried out. Broad expectations place the year-over-year CPI increase at 3.4%, and based on current market sentiment, the probability of implementing a rate hike in September is roughly 40%.
In the digital asset space, BTC and ETH are still maintaining a range-bound, choppy consolidation. The direction of any short-term breakout remains unclear. However, it’s worth noting that the recent performance of SOL/BTC appears particularly strong. This upward momentum is mainly driven by a steady stream of positive catalysts, including the Agave v4.2 network upgrade officially scheduled to be rolled out on August 17, as well as highly anticipated deflationary governance proposal(s) discussed in the market.
As for precious metals, after gold has carved out a stretch of consecutive rallying moves, it has now entered a consolidation and buildup phase. Since the current price still has room for further upside before reaching the anticipated target level of 4750, if the market subsequently sees a pullback, it could still be a good opportunity for investors to consider adding positions on dips.
In addition, looking at developments in regional stock markets, the Korean index has recently been in a rebound and recovery rhythm. For future trading observations, it’s recommended that everyone closely monitor and pay attention to potential technical resistance levels around the 7020 area.
7.14 Rate-Hike Cycle Market Analysis
First, focus on developments at the macro level. South Korea will hold a central bank meeting on July 16. Current market expectations indicate that it will most likely announce a 25BB rate hike. At the same time, the probability that the U.S. Federal Reserve will take one more rate-hike action before the end of this year has already reached 70%.
In terms of the specific investment landscape, the storage sector has indeed seen a streak of consecutive declines in recent days. However, looking at the bigger trend, the sector is still firmly in a bull market. The recent pullback, in fact, offers a fairly good entry opportunity.
Finally, let’s discuss our long-term view on BTC. The current judgment is that the 60,000 level is not the true bottom, but rather the midsection of the market. After a round of repeated choppy consolidation, BTC is expected to follow the direction of the stock index into the final bear-market phase. There is still potential for a 50% drop in the future.
First, focus on developments at the macro level. South Korea will hold a central bank meeting on July 16. Current market expectations indicate that it will most likely announce a 25BB rate hike. At the same time, the probability that the U.S. Federal Reserve will take one more rate-hike action before the end of this year has already reached 70%.
In terms of the specific investment landscape, the storage sector has indeed seen a streak of consecutive declines in recent days. However, looking at the bigger trend, the sector is still firmly in a bull market. The recent pullback, in fact, offers a fairly good entry opportunity.
Finally, let’s discuss our long-term view on BTC. The current judgment is that the 60,000 level is not the true bottom, but rather the midsection of the market. After a round of repeated choppy consolidation, BTC is expected to follow the direction of the stock index into the final bear-market phase. There is still potential for a 50% drop in the future.
On May 18th, global financial assets showed a synchronized decline.
In the macro context of accelerated capital withdrawal, major markets continued their downward trajectory during today's early trading session, following significant sell-offs last week. Investors can observe that stock markets in Japan and South Korea, along with US index futures, precious metals, and the crypto space, are all experiencing a downward trend.
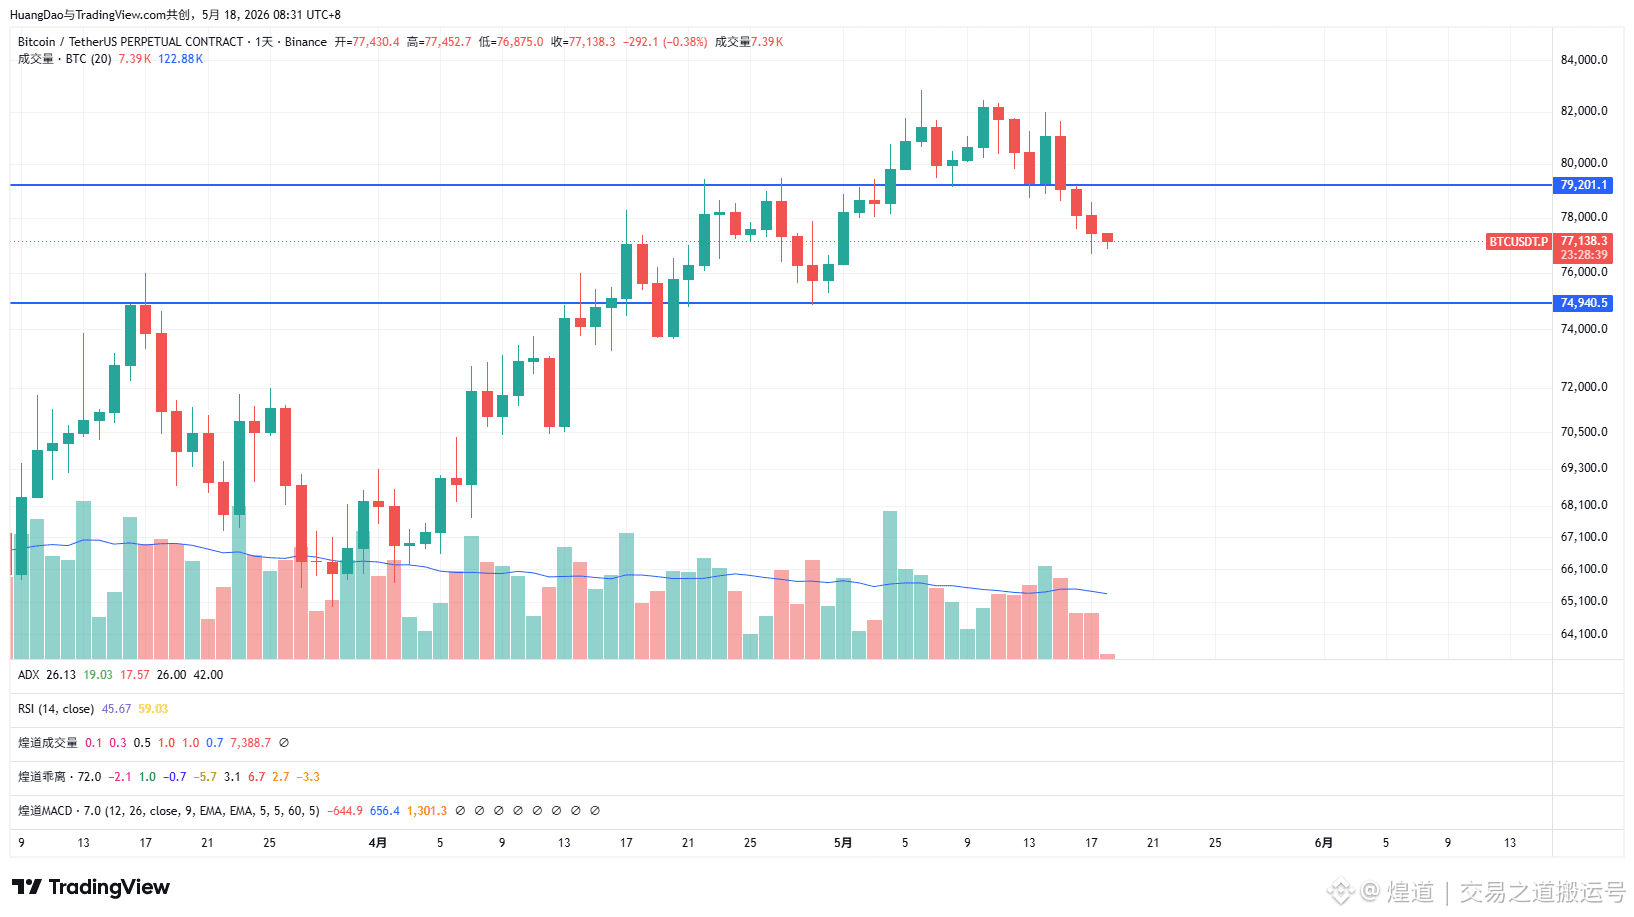
In terms of crypto assets, BTC and ETH have both fallen below critical support levels. This market action clearly indicates that the recent rebound that started from the 60k level has officially come to an end. Moving forward, the entire cryptocurrency market is expected to re-enter a bearish downtrend on a weekly basis, and given the current funding and technical landscape, it will be exceptionally difficult to reclaim the 79,200 high.
Looking ahead, BTC's immediate downside target will be to break below the 75,000 mark. Through this search for support, the asset's movement will create a more significant lower local bottom on the chart.
In the macro context of accelerated capital withdrawal, major markets continued their downward trajectory during today's early trading session, following significant sell-offs last week. Investors can observe that stock markets in Japan and South Korea, along with US index futures, precious metals, and the crypto space, are all experiencing a downward trend.
In terms of crypto assets, BTC and ETH have both fallen below critical support levels. This market action clearly indicates that the recent rebound that started from the 60k level has officially come to an end. Moving forward, the entire cryptocurrency market is expected to re-enter a bearish downtrend on a weekly basis, and given the current funding and technical landscape, it will be exceptionally difficult to reclaim the 79,200 high.
Looking ahead, BTC's immediate downside target will be to break below the 75,000 mark. Through this search for support, the asset's movement will create a more significant lower local bottom on the chart.
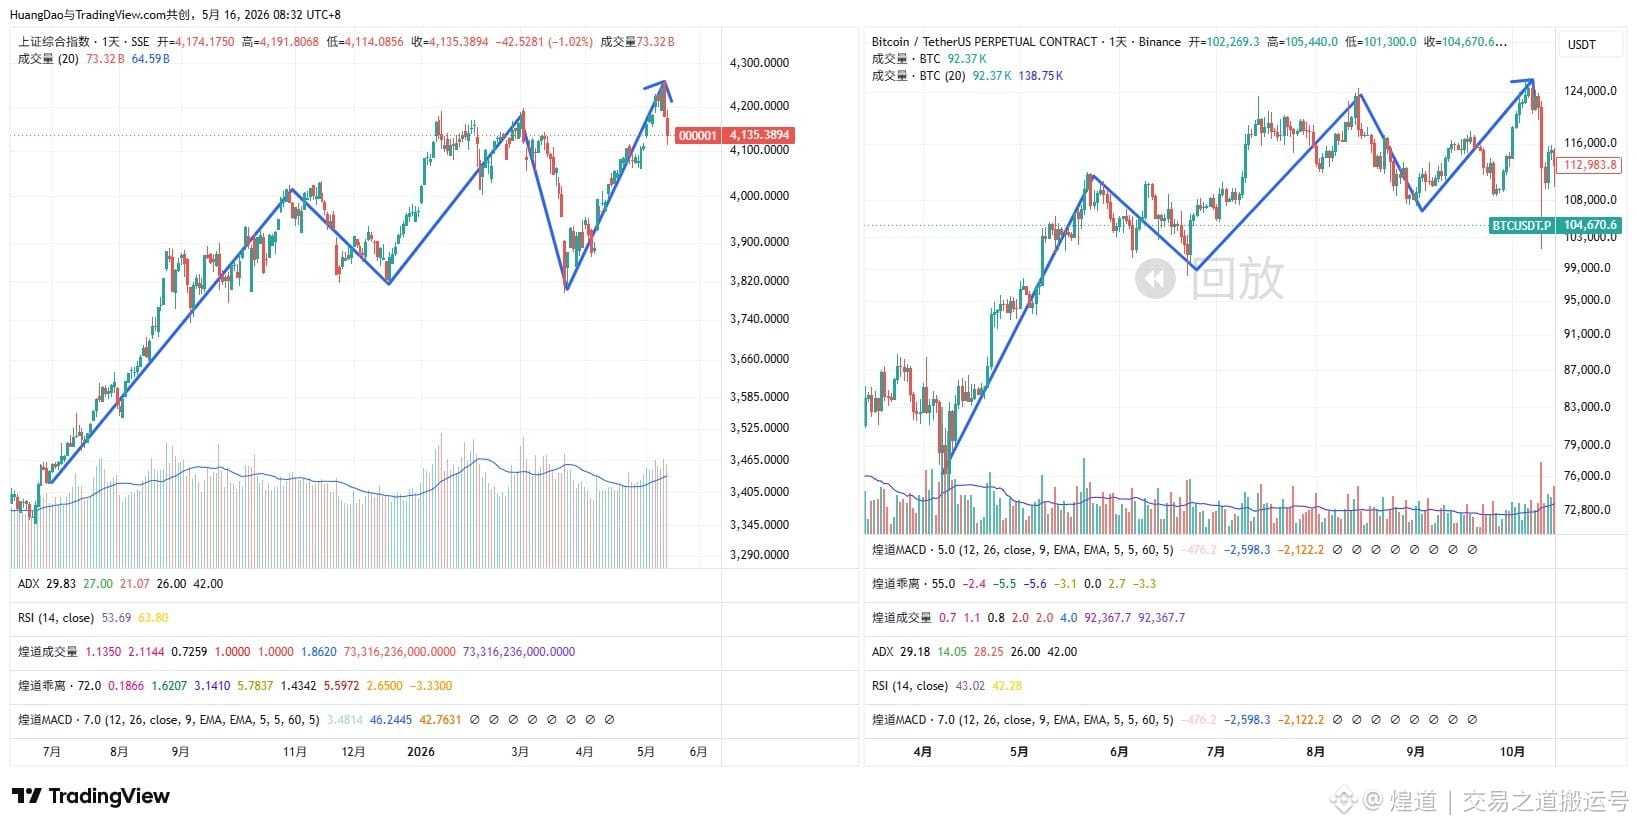
It seems like everyone's been chatting about whether the A-share market has hit its peak recently. If you take a closer look, you'll notice that the current A-share performance mirrors the trajectory of BTC when it reached 125,000. Both of these markets share a common trait: the momentum for breaking new highs is gradually fading, and the moving averages are starting to flatten out. Before a definitive top is established, the market often experiences a sharp and steep rally that draws in bullish funds, only to then kick off a significant downturn.
Log in to explore more content