
小秋的交易日常
131 Posts

小秋的交易日常
公众号《秋同学的k线感悟》币安手续费8折邀优惠:《T684RN8E》主打BTC每日盘口运用动能理论知识技术分析,准确率90%!
Open Trade
Frequent Trader
5.9 Months
5 Following
97 Followers
76 Liked
Posts
Portfolio
All
Videos
Live
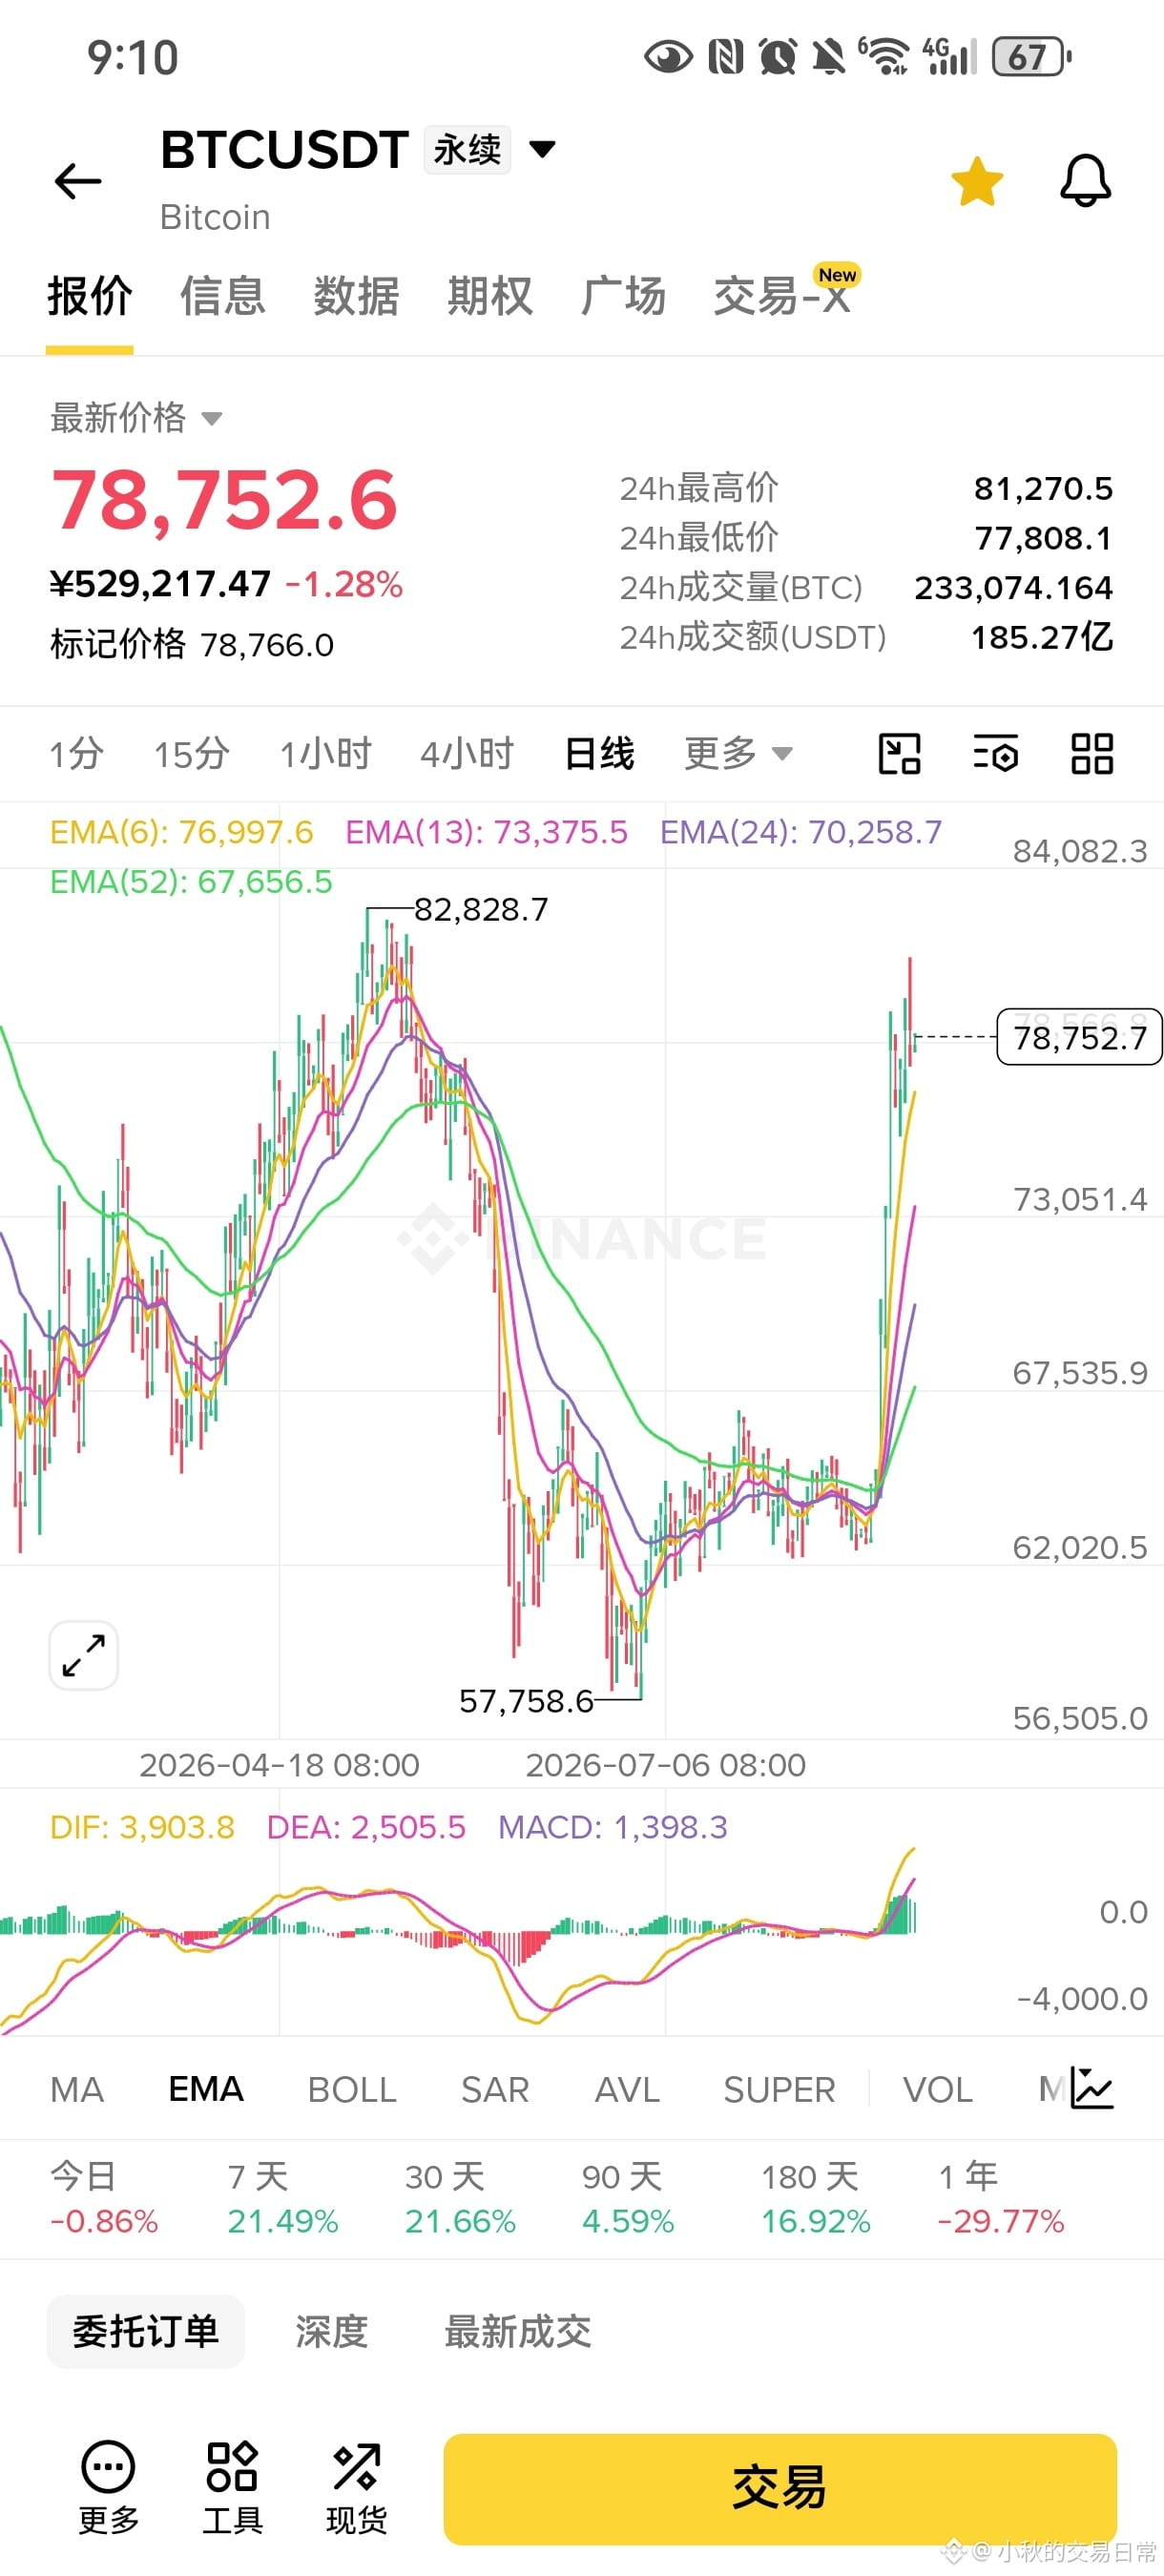
BTC technical analysis for August 26.
Previously I told everyone that 62,000 is support; as long as it doesn’t break, the trend is upward, and now it’s delivering perfectly!
For those who haven’t entered yet, don’t chase the price up for now. The resistance above is the previous high around 81,500, which is also the historical high area around 83,000. The closer it gets to this resistance zone, the more you should consider taking a short on the short term.
Support below is 73,000. After a pullback, consider going long again—70,000 and 67,500! As long as it doesn’t break, it will do a 45-day breakout rebound!
The big-picture direction has already been analyzed! Wishing everyone makes money every day!
Previously I told everyone that 62,000 is support; as long as it doesn’t break, the trend is upward, and now it’s delivering perfectly!
For those who haven’t entered yet, don’t chase the price up for now. The resistance above is the previous high around 81,500, which is also the historical high area around 83,000. The closer it gets to this resistance zone, the more you should consider taking a short on the short term.
Support below is 73,000. After a pullback, consider going long again—70,000 and 67,500! As long as it doesn’t break, it will do a 45-day breakout rebound!
The big-picture direction has already been analyzed! Wishing everyone makes money every day!
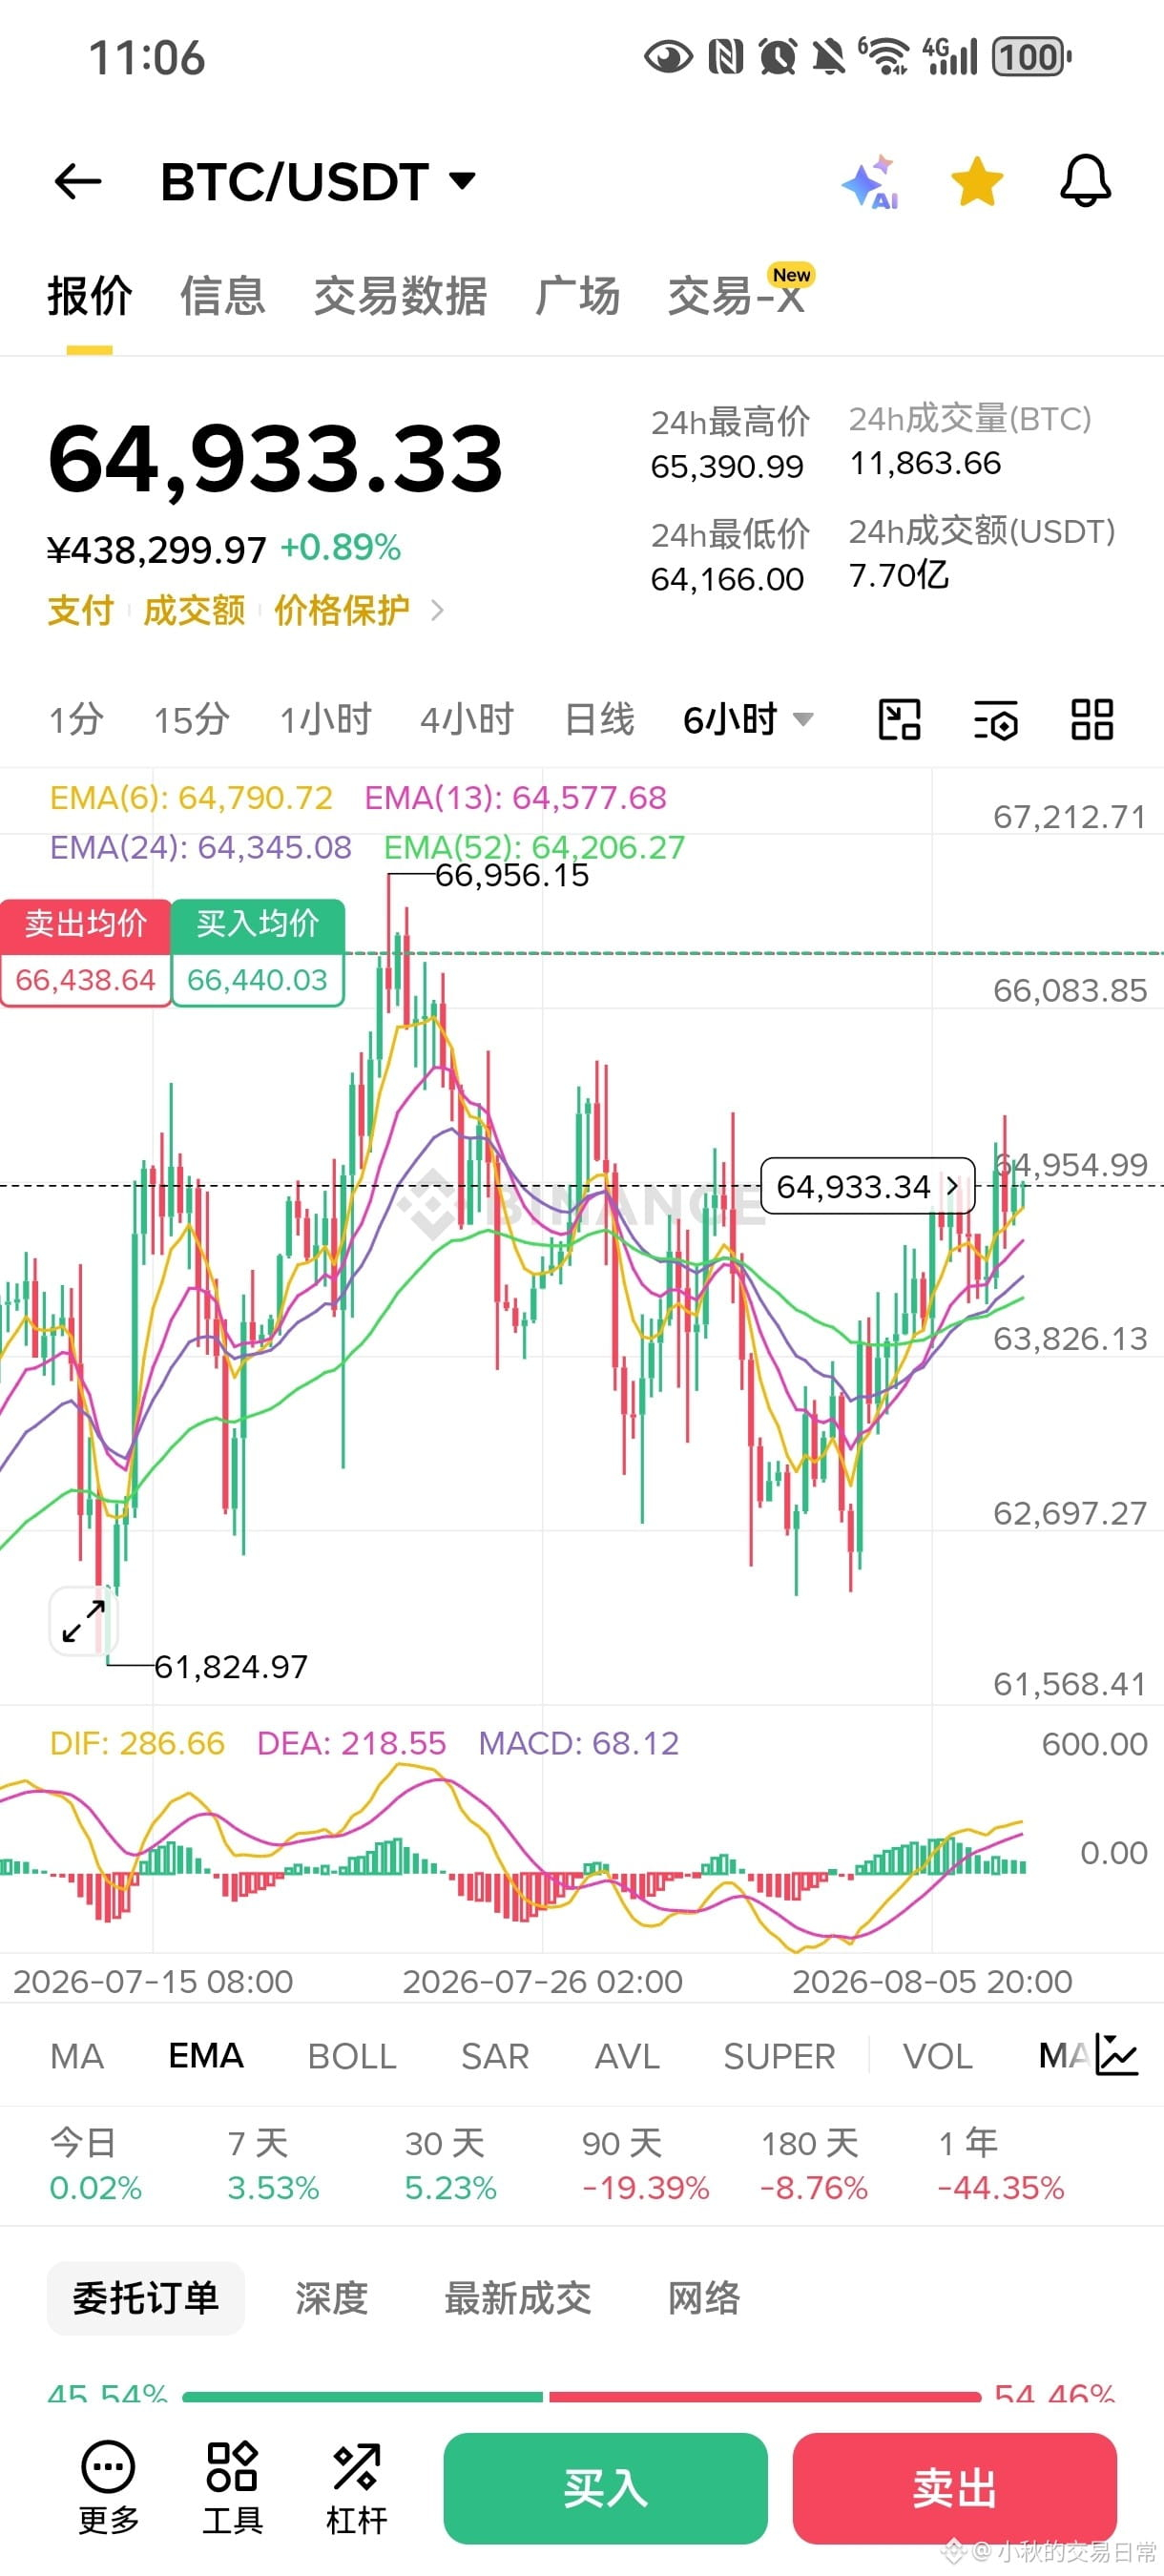
August 8 BTC Technical Analysis
Last time I also told everyone to watch the 6-hour timeframe. The 6-hour chart has also perfectly formed a bottom buy point. Around 62,000, it has been holding and hasn’t broken down. The bullish force is strong. Right now, I’m mainly watching support at 64,000. If it doesn’t break, we’ll see whether it can move toward the weekly resistance level around 74,000!
The rebound from the BTC zero line in February hasn’t officially started yet. So just be patient and wait. For now, this is still a short-term view. When a bottom structure comes out, everyone needs to take it seriously.
Recently the movement has been rather slow and messy, so I haven’t focused on it much. It’s better to trade gold lately, and the setup looks good too.
I went to trade gold! Next time I’ll analyze gold’s technicals as well, and share intraday trades or trend trades. That’s also for me to deepen my impression and understanding, and to help myself.
Last time I also told everyone to watch the 6-hour timeframe. The 6-hour chart has also perfectly formed a bottom buy point. Around 62,000, it has been holding and hasn’t broken down. The bullish force is strong. Right now, I’m mainly watching support at 64,000. If it doesn’t break, we’ll see whether it can move toward the weekly resistance level around 74,000!
The rebound from the BTC zero line in February hasn’t officially started yet. So just be patient and wait. For now, this is still a short-term view. When a bottom structure comes out, everyone needs to take it seriously.
Recently the movement has been rather slow and messy, so I haven’t focused on it much. It’s better to trade gold lately, and the setup looks good too.
I went to trade gold! Next time I’ll analyze gold’s technicals as well, and share intraday trades or trend trades. That’s also for me to deepen my impression and understanding, and to help myself.
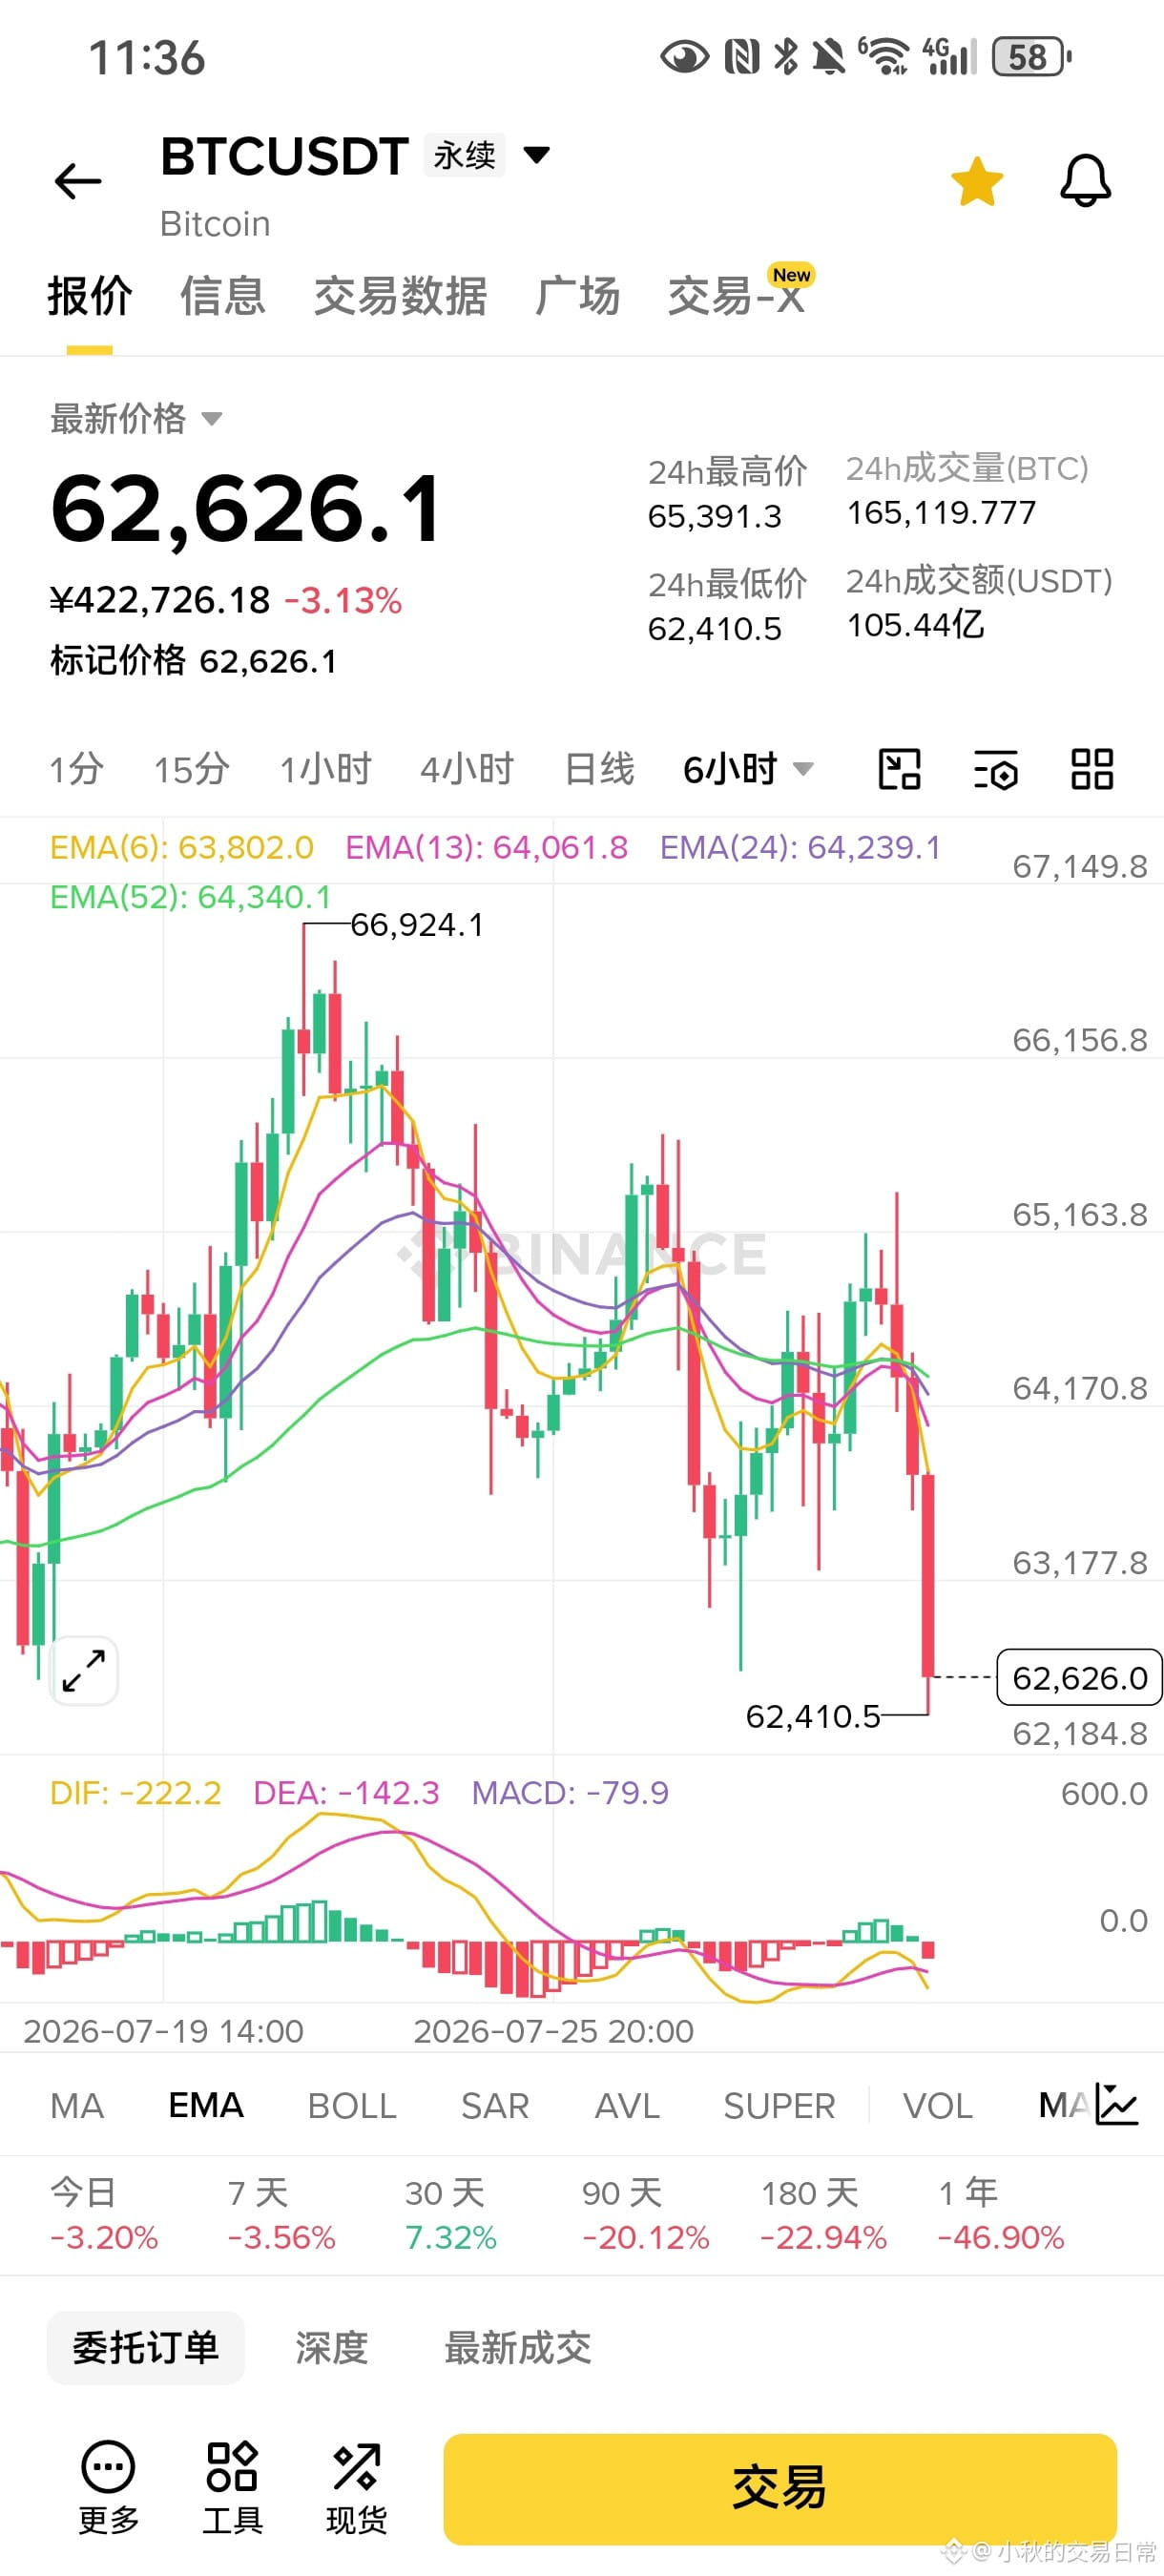
July 31 BTC technical analysis,
Today it finally started to fall—after dragging for days.
On July 23, I already told everyone: if it doesn’t break above the previous high, you can short it. Once the time logic is done, it will definitely drop!
Right now, first we’ll see whether 61,500 is broken; then look lower. Focus on the energy over the next 6 hours.
It’s still too early for longs. When the right pattern forms, I’ll post again—when I lay out the long setup.
You don’t need to analyze every day so often. I’m a bit lazy. When I don’t post content, it means nothing has changed. When I do post, that’s when opportunities are coming—so keep an eye out!
If you don’t understand technical analysis or don’t have time to learn, just copy the assignment!
For friends who can read the charts, please follow!
Today it finally started to fall—after dragging for days.
On July 23, I already told everyone: if it doesn’t break above the previous high, you can short it. Once the time logic is done, it will definitely drop!
Right now, first we’ll see whether 61,500 is broken; then look lower. Focus on the energy over the next 6 hours.
It’s still too early for longs. When the right pattern forms, I’ll post again—when I lay out the long setup.
You don’t need to analyze every day so often. I’m a bit lazy. When I don’t post content, it means nothing has changed. When I do post, that’s when opportunities are coming—so keep an eye out!
If you don’t understand technical analysis or don’t have time to learn, just copy the assignment!
For friends who can read the charts, please follow!
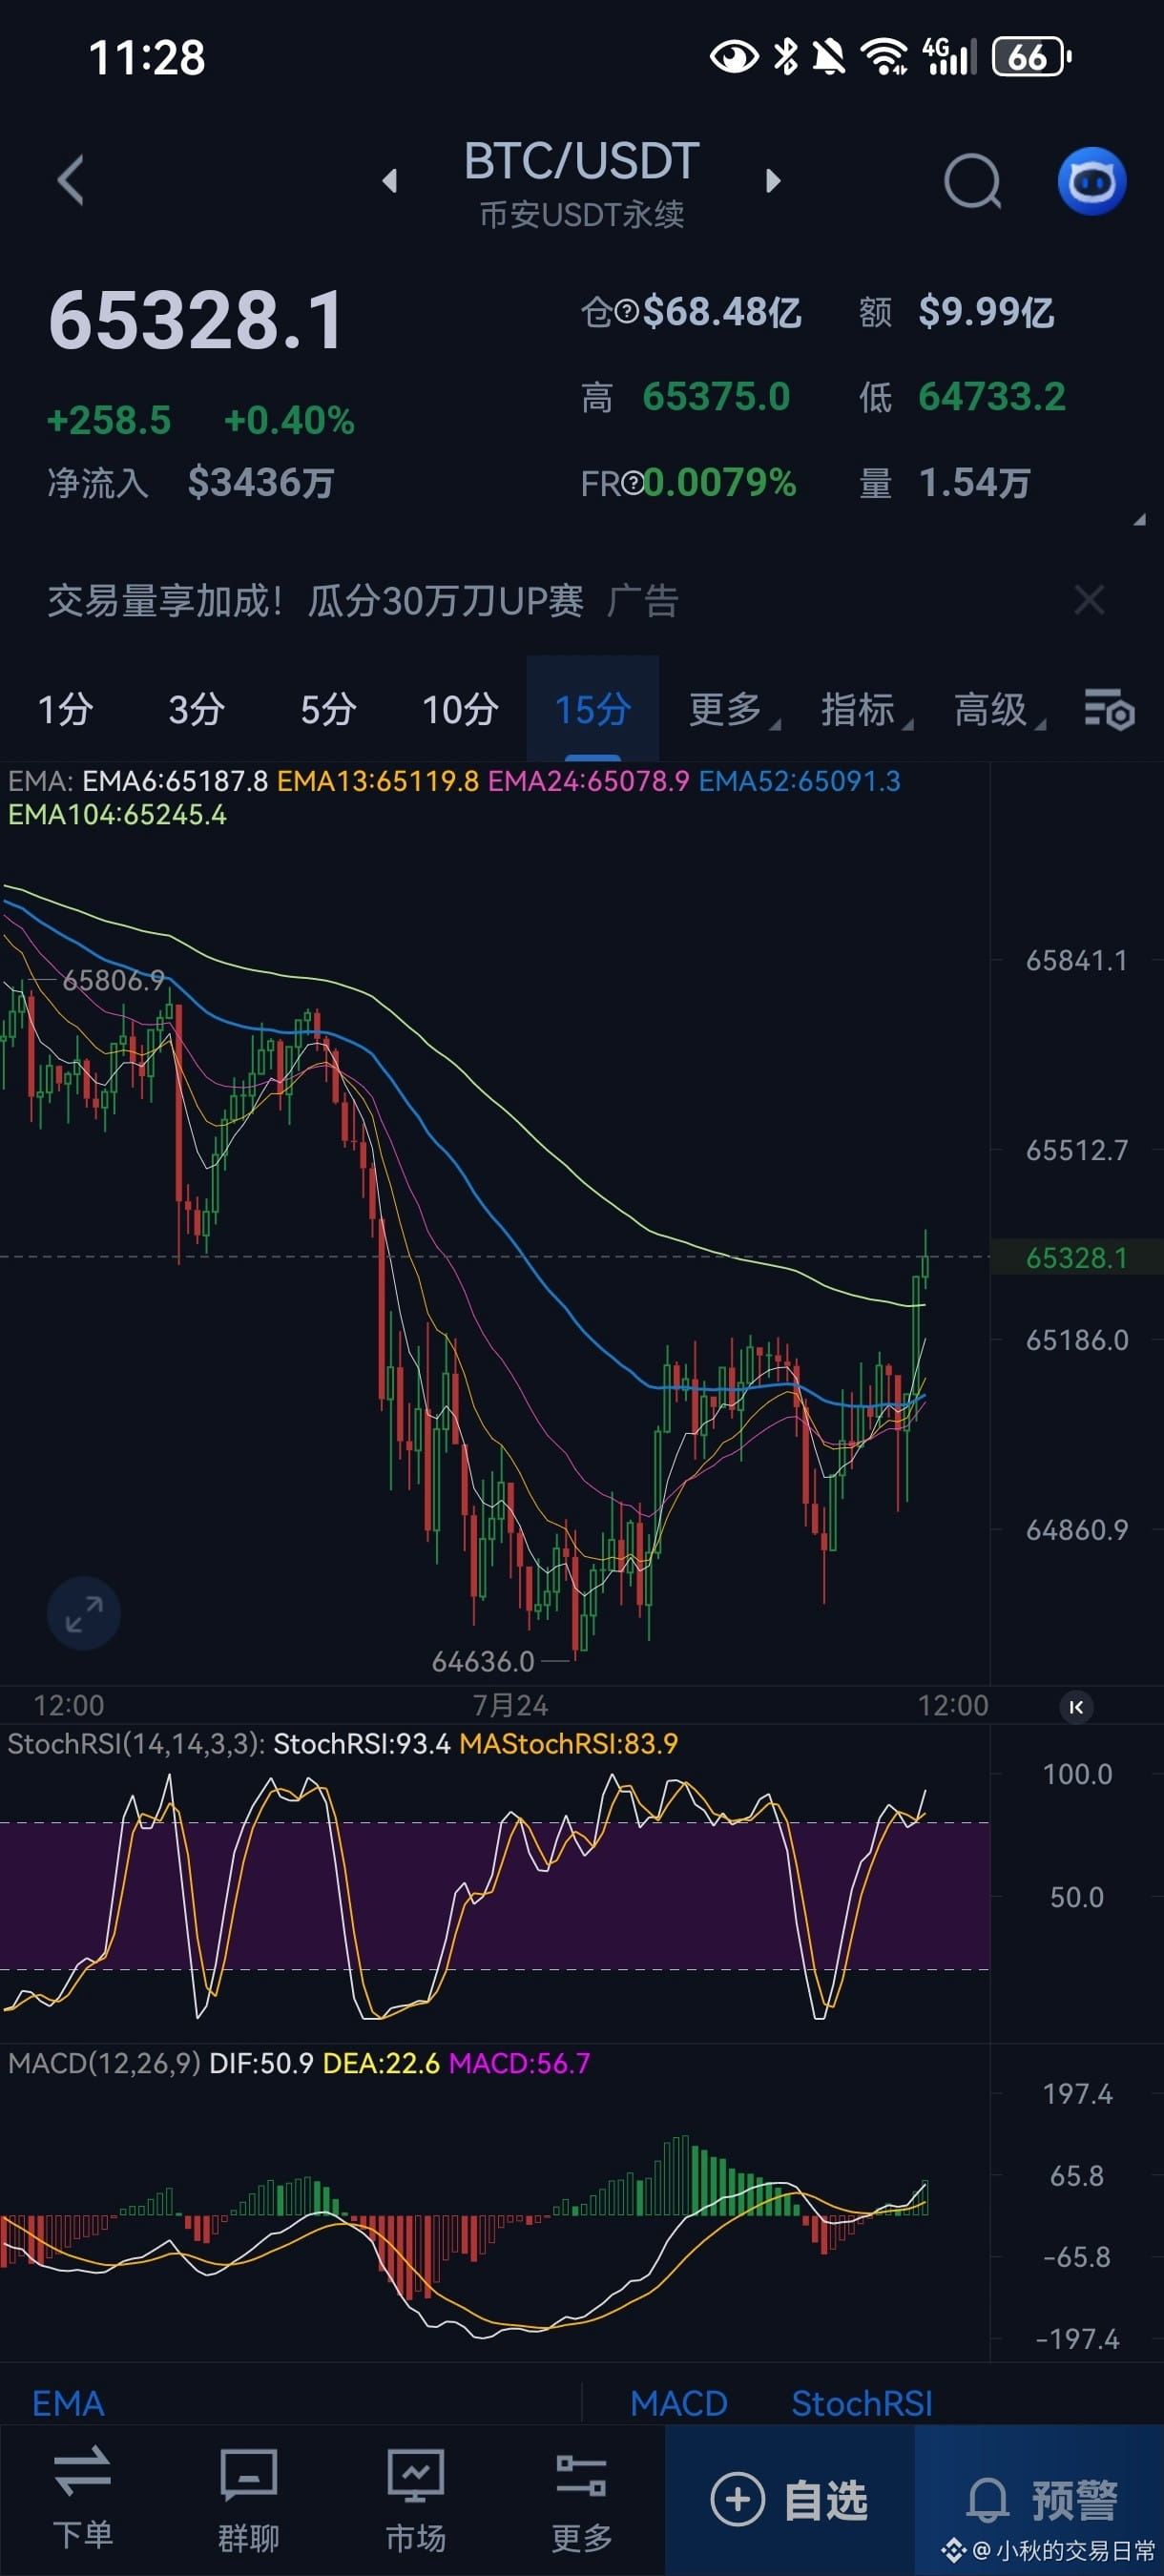
July 24 BTC technical analysis
Yesterday, 64,500 was reached—it’s a support. Since the 6-hour chart has returned to the 0 line, now we’ll look at the strength of this rebound. If the strength is big, it should be able to reach around 68,000 without a problem. If it can’t go up, short it!
Pay attention to the last logic within the 6-hour period. For long traders near 64,500 on the short term, just look at the 15-minute chart. If it drops below the 0 line, exit!
Yesterday, 64,500 was reached—it’s a support. Since the 6-hour chart has returned to the 0 line, now we’ll look at the strength of this rebound. If the strength is big, it should be able to reach around 68,000 without a problem. If it can’t go up, short it!
Pay attention to the last logic within the 6-hour period. For long traders near 64,500 on the short term, just look at the 15-minute chart. If it drops below the 0 line, exit!
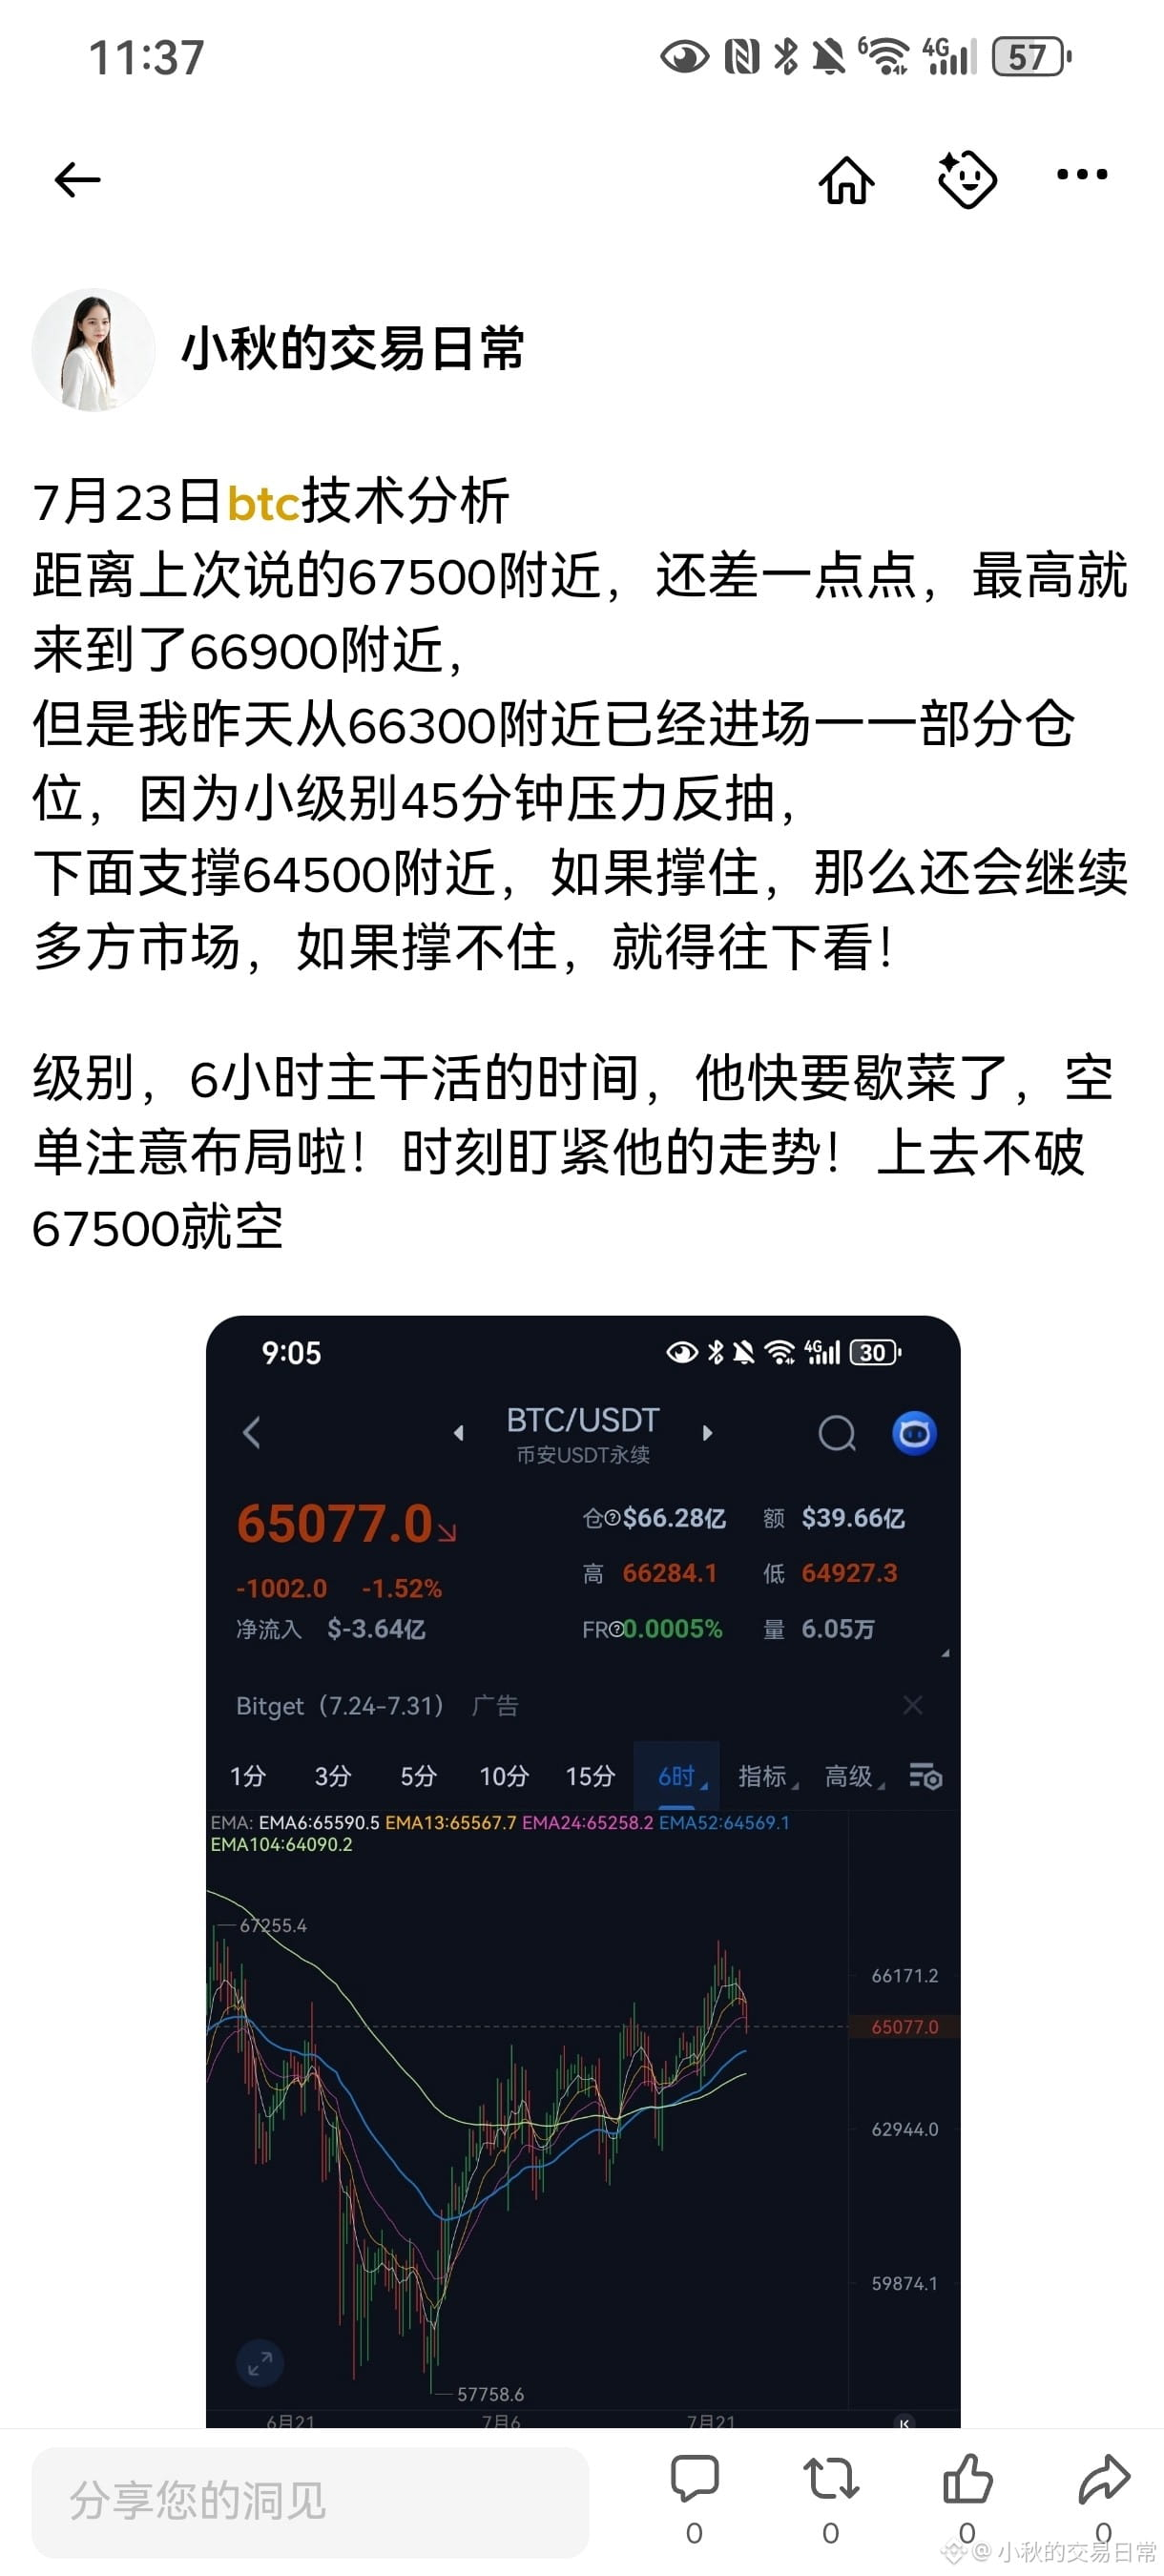
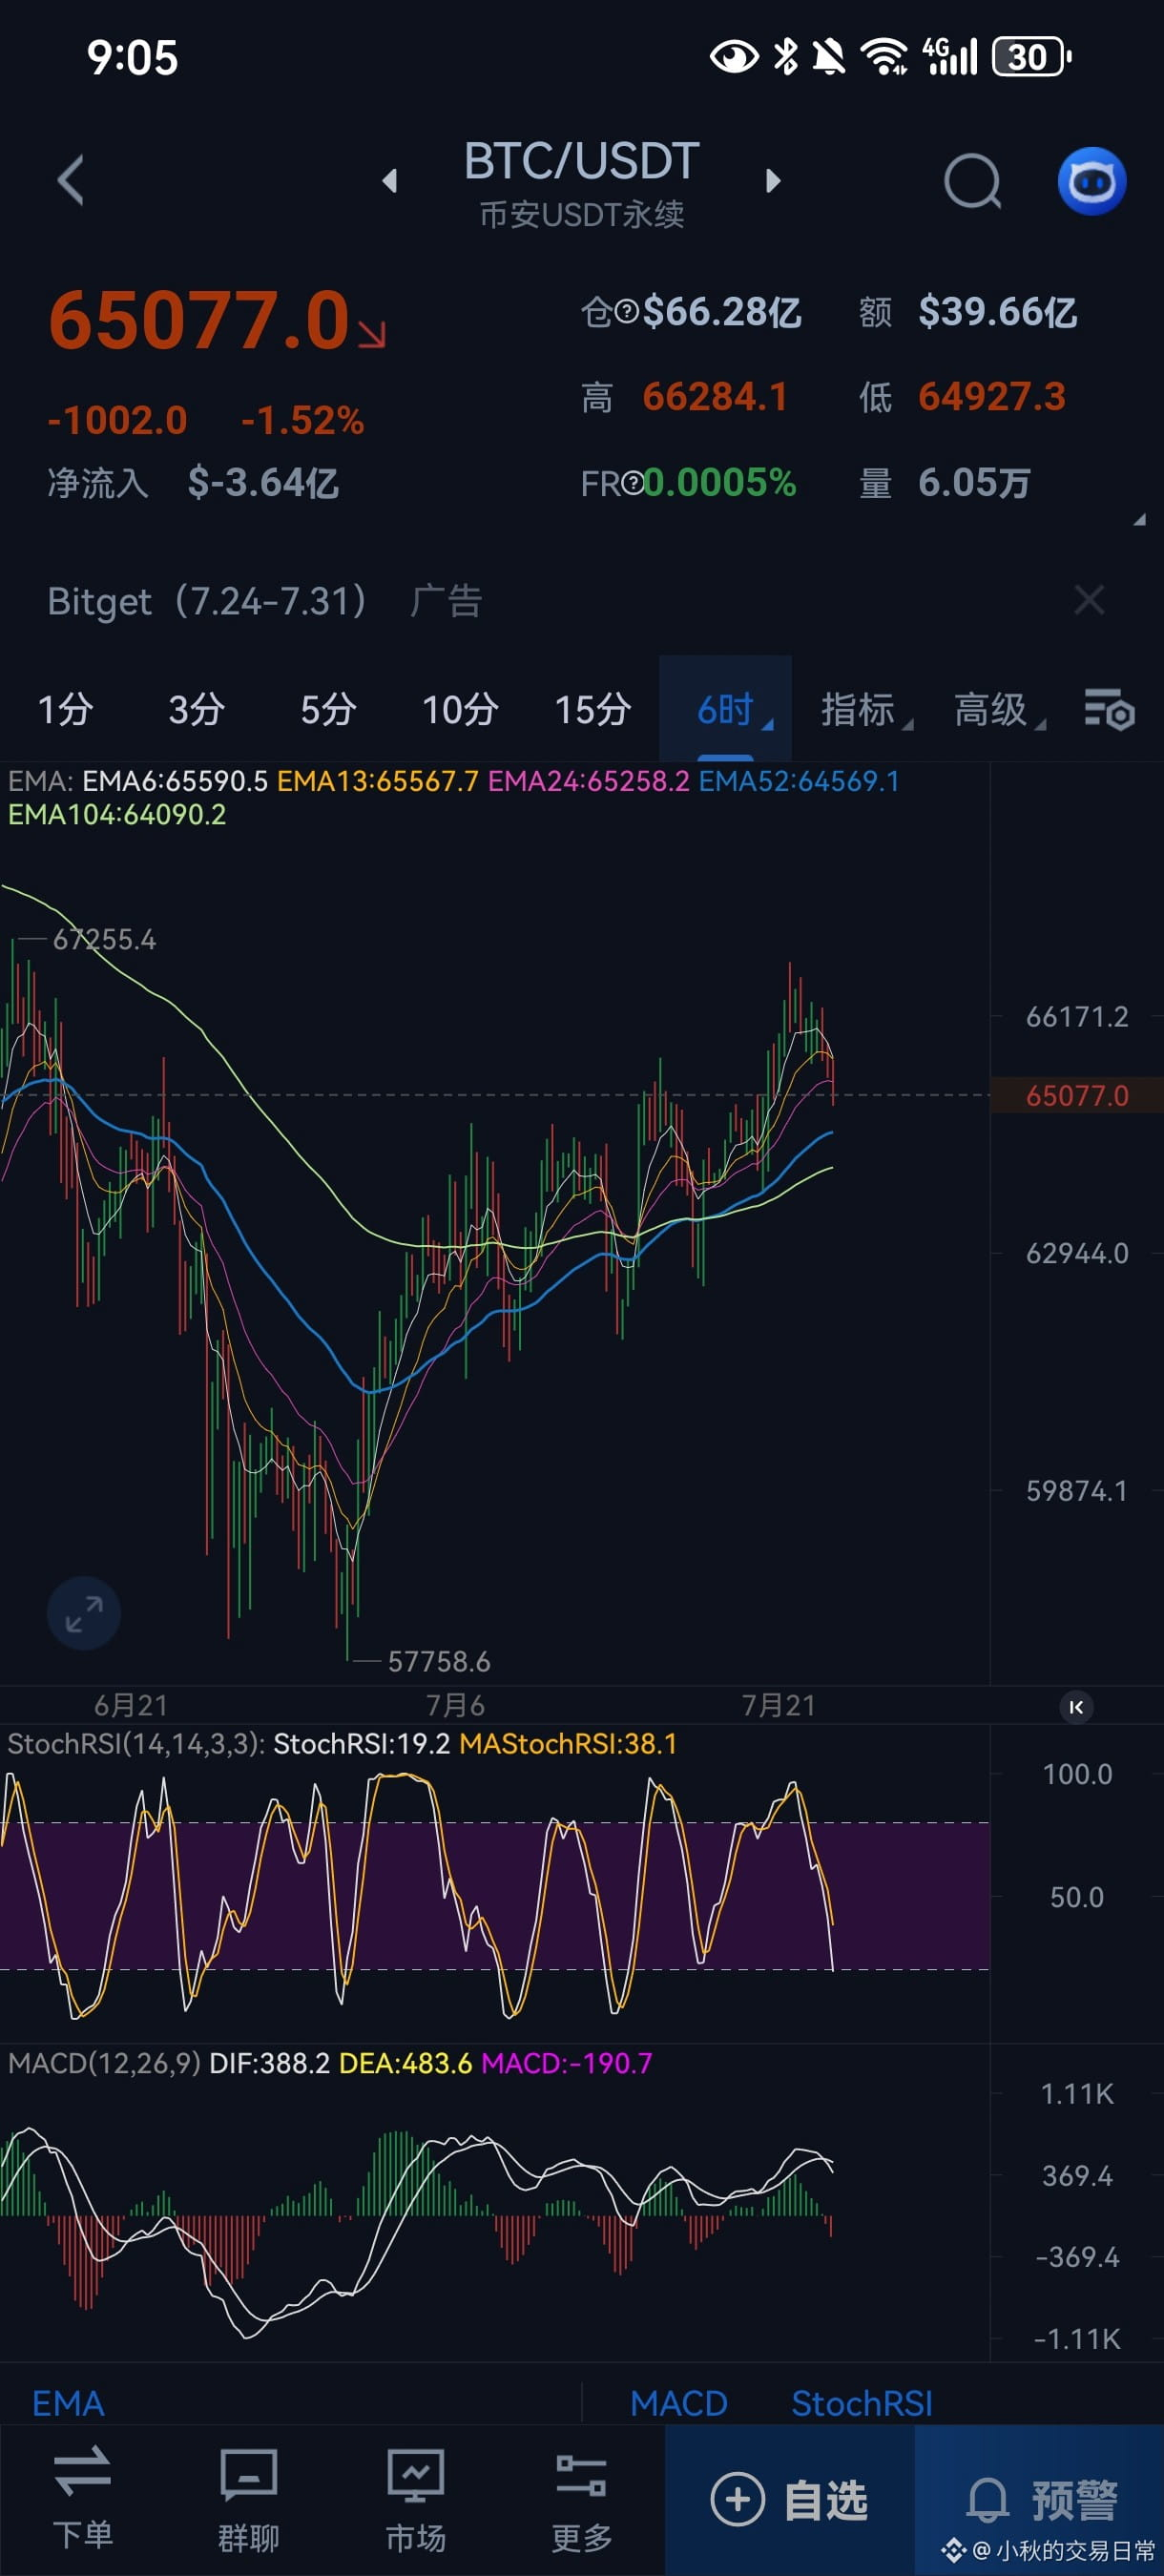
July 23 BTC technical analysis
Since what I said last time about the area near 67,500 is still a little bit off—the high only reached around 66,900.
But yesterday, I entered around 66,300 with part of my positions because on the smaller timeframe (45 minutes) there’s a resistance pullback.
Below, there’s support around 64,500. If it holds, then the market will continue in a bullish direction; if it doesn’t hold, then we have to look lower!
For the level/timeframe where the 6-hour main swing is in play, it’s almost “done.” Be careful with your short positions—plan your entries carefully! Keep a close eye on its movement at all times!
If it goes up but fails to break 67,500, then go short.
Since what I said last time about the area near 67,500 is still a little bit off—the high only reached around 66,900.
But yesterday, I entered around 66,300 with part of my positions because on the smaller timeframe (45 minutes) there’s a resistance pullback.
Below, there’s support around 64,500. If it holds, then the market will continue in a bullish direction; if it doesn’t hold, then we have to look lower!
For the level/timeframe where the 6-hour main swing is in play, it’s almost “done.” Be careful with your short positions—plan your entries carefully! Keep a close eye on its movement at all times!
If it goes up but fails to break 67,500, then go short.
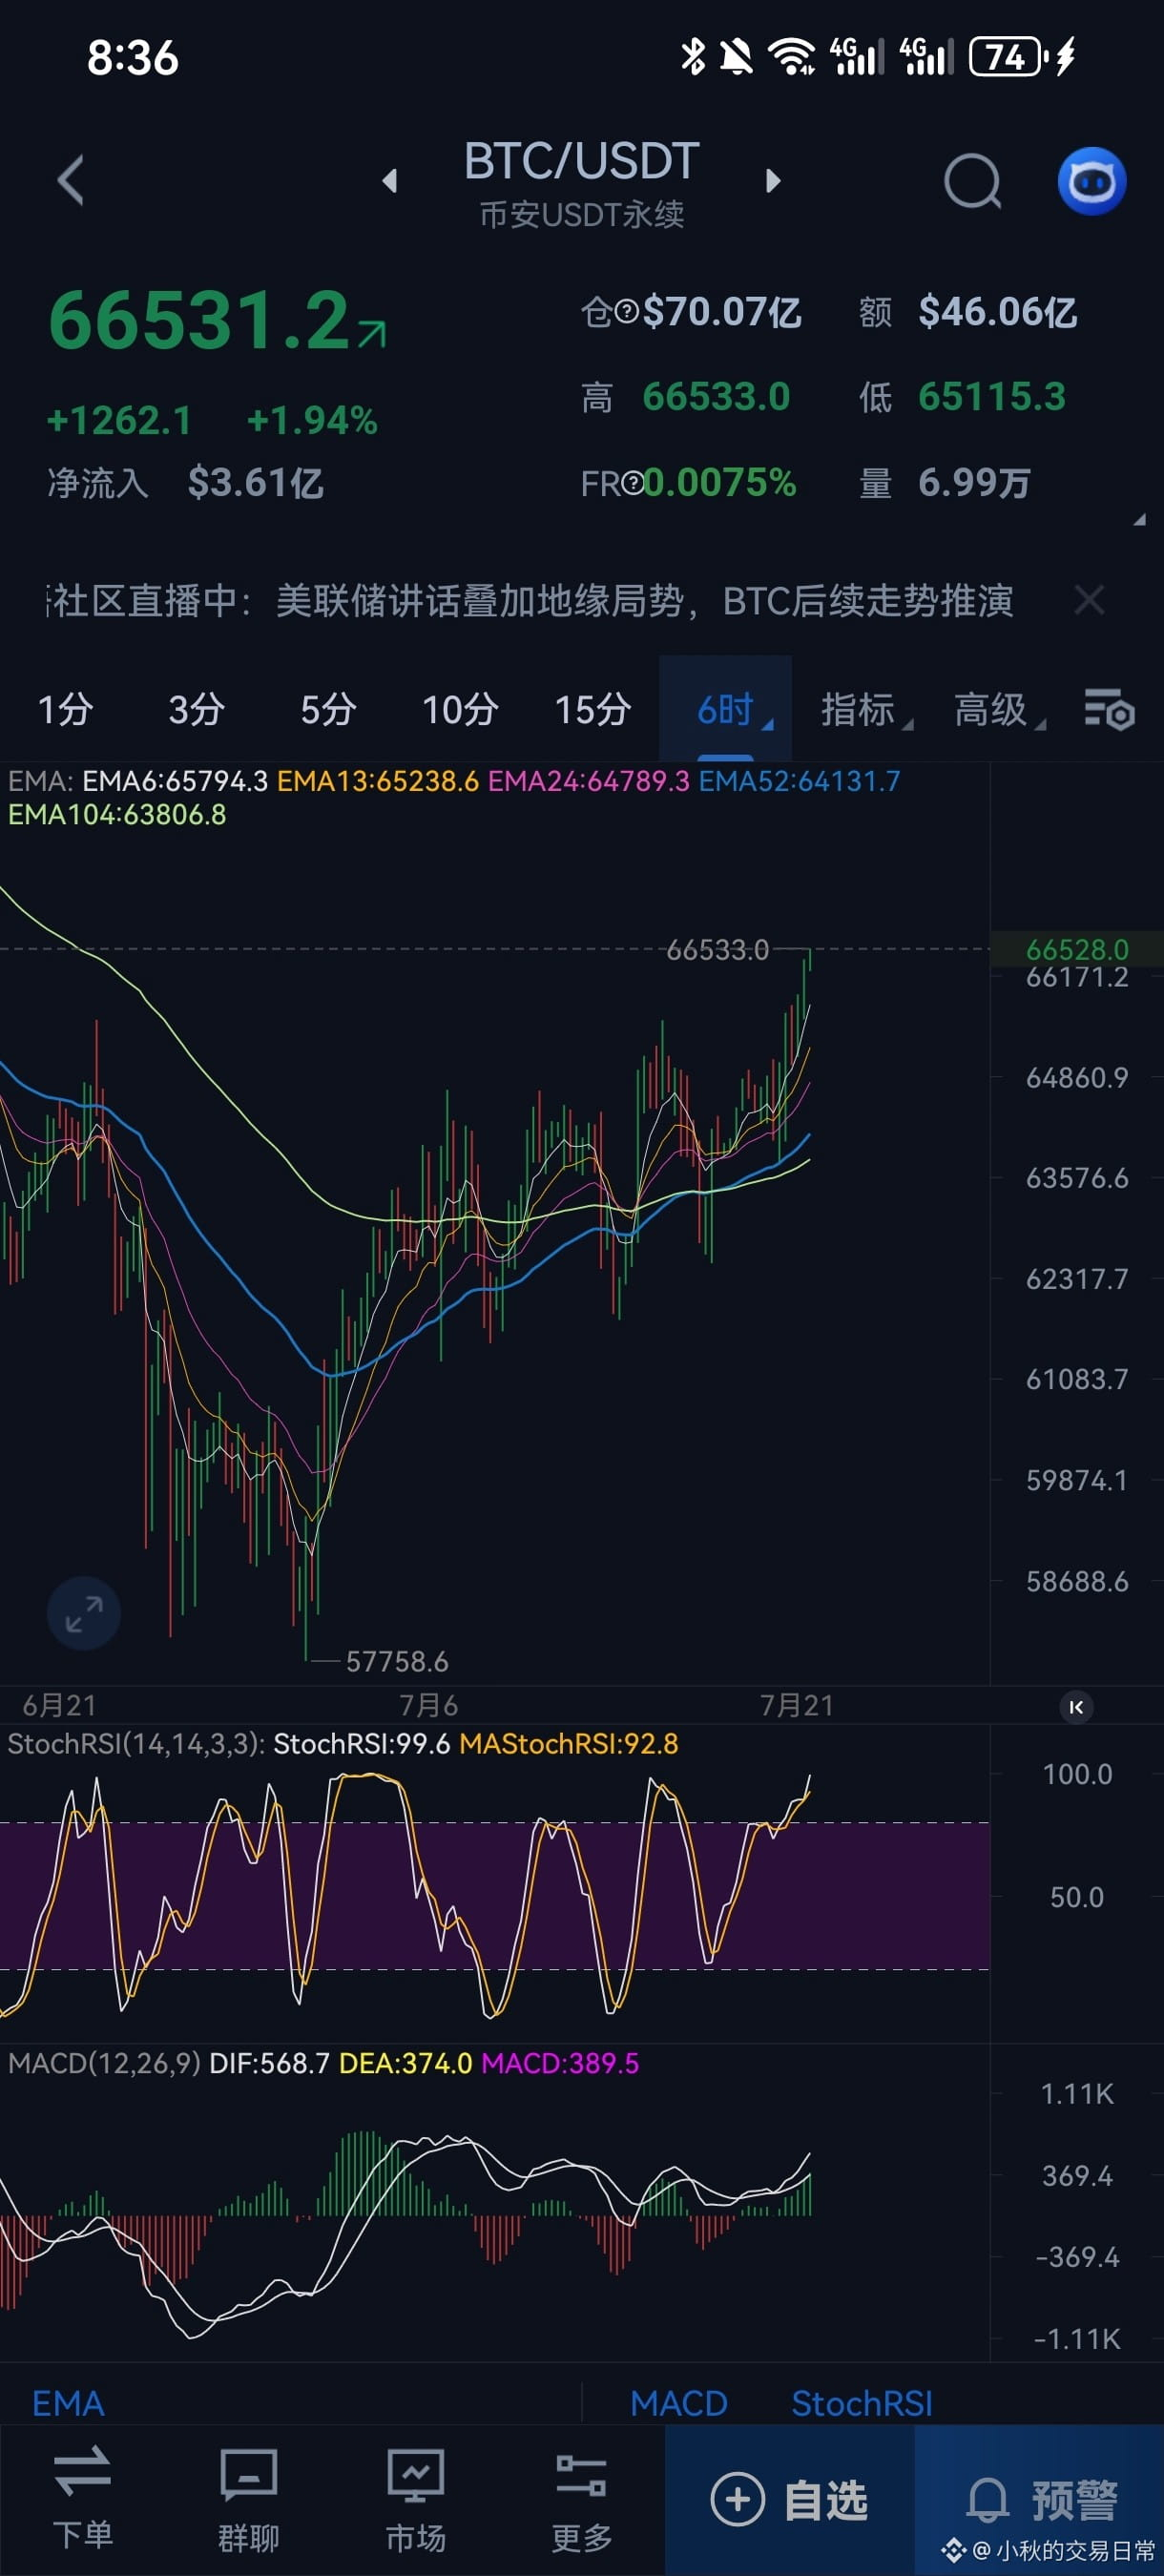
July 21 BTC Technical Analysis
Are you losing money, or making money?
The current bullish trend is still ongoing, and everything is within the scope of our analysis—nothing much has changed. The structure hasn’t broken yet, so for now, let’s just hold onto the long position at the bottom. For the first target above, we should look for resistance around 67,500. The key focus is the energy on the 6-hour timeframe!
I’m now starting to think more in terms of long-term setups. I won’t be watching small timeframe fluctuations—only then can you hold the trade properly. Especially for BTC—its movement is kind of slow/gradual. If you watch small timeframes, it’s very easy to get off the train. Then once you’re off, getting back on becomes difficult!
I’ll keep working hard. Sometimes I’m still affected by outside interference, which throws off my train of thought!
I’m analyzing and recording my thoughts here. Looking back later, I’ll understand what I was thinking at the time—and I think it will be quite helpful for me. In the future, I’ll work hard and share my daily thoughts as well. If you’re a friend who can resonate with me and understand what I’m saying, please follow me!
Are you losing money, or making money?
The current bullish trend is still ongoing, and everything is within the scope of our analysis—nothing much has changed. The structure hasn’t broken yet, so for now, let’s just hold onto the long position at the bottom. For the first target above, we should look for resistance around 67,500. The key focus is the energy on the 6-hour timeframe!
I’m now starting to think more in terms of long-term setups. I won’t be watching small timeframe fluctuations—only then can you hold the trade properly. Especially for BTC—its movement is kind of slow/gradual. If you watch small timeframes, it’s very easy to get off the train. Then once you’re off, getting back on becomes difficult!
I’ll keep working hard. Sometimes I’m still affected by outside interference, which throws off my train of thought!
I’m analyzing and recording my thoughts here. Looking back later, I’ll understand what I was thinking at the time—and I think it will be quite helpful for me. In the future, I’ll work hard and share my daily thoughts as well. If you’re a friend who can resonate with me and understand what I’m saying, please follow me!
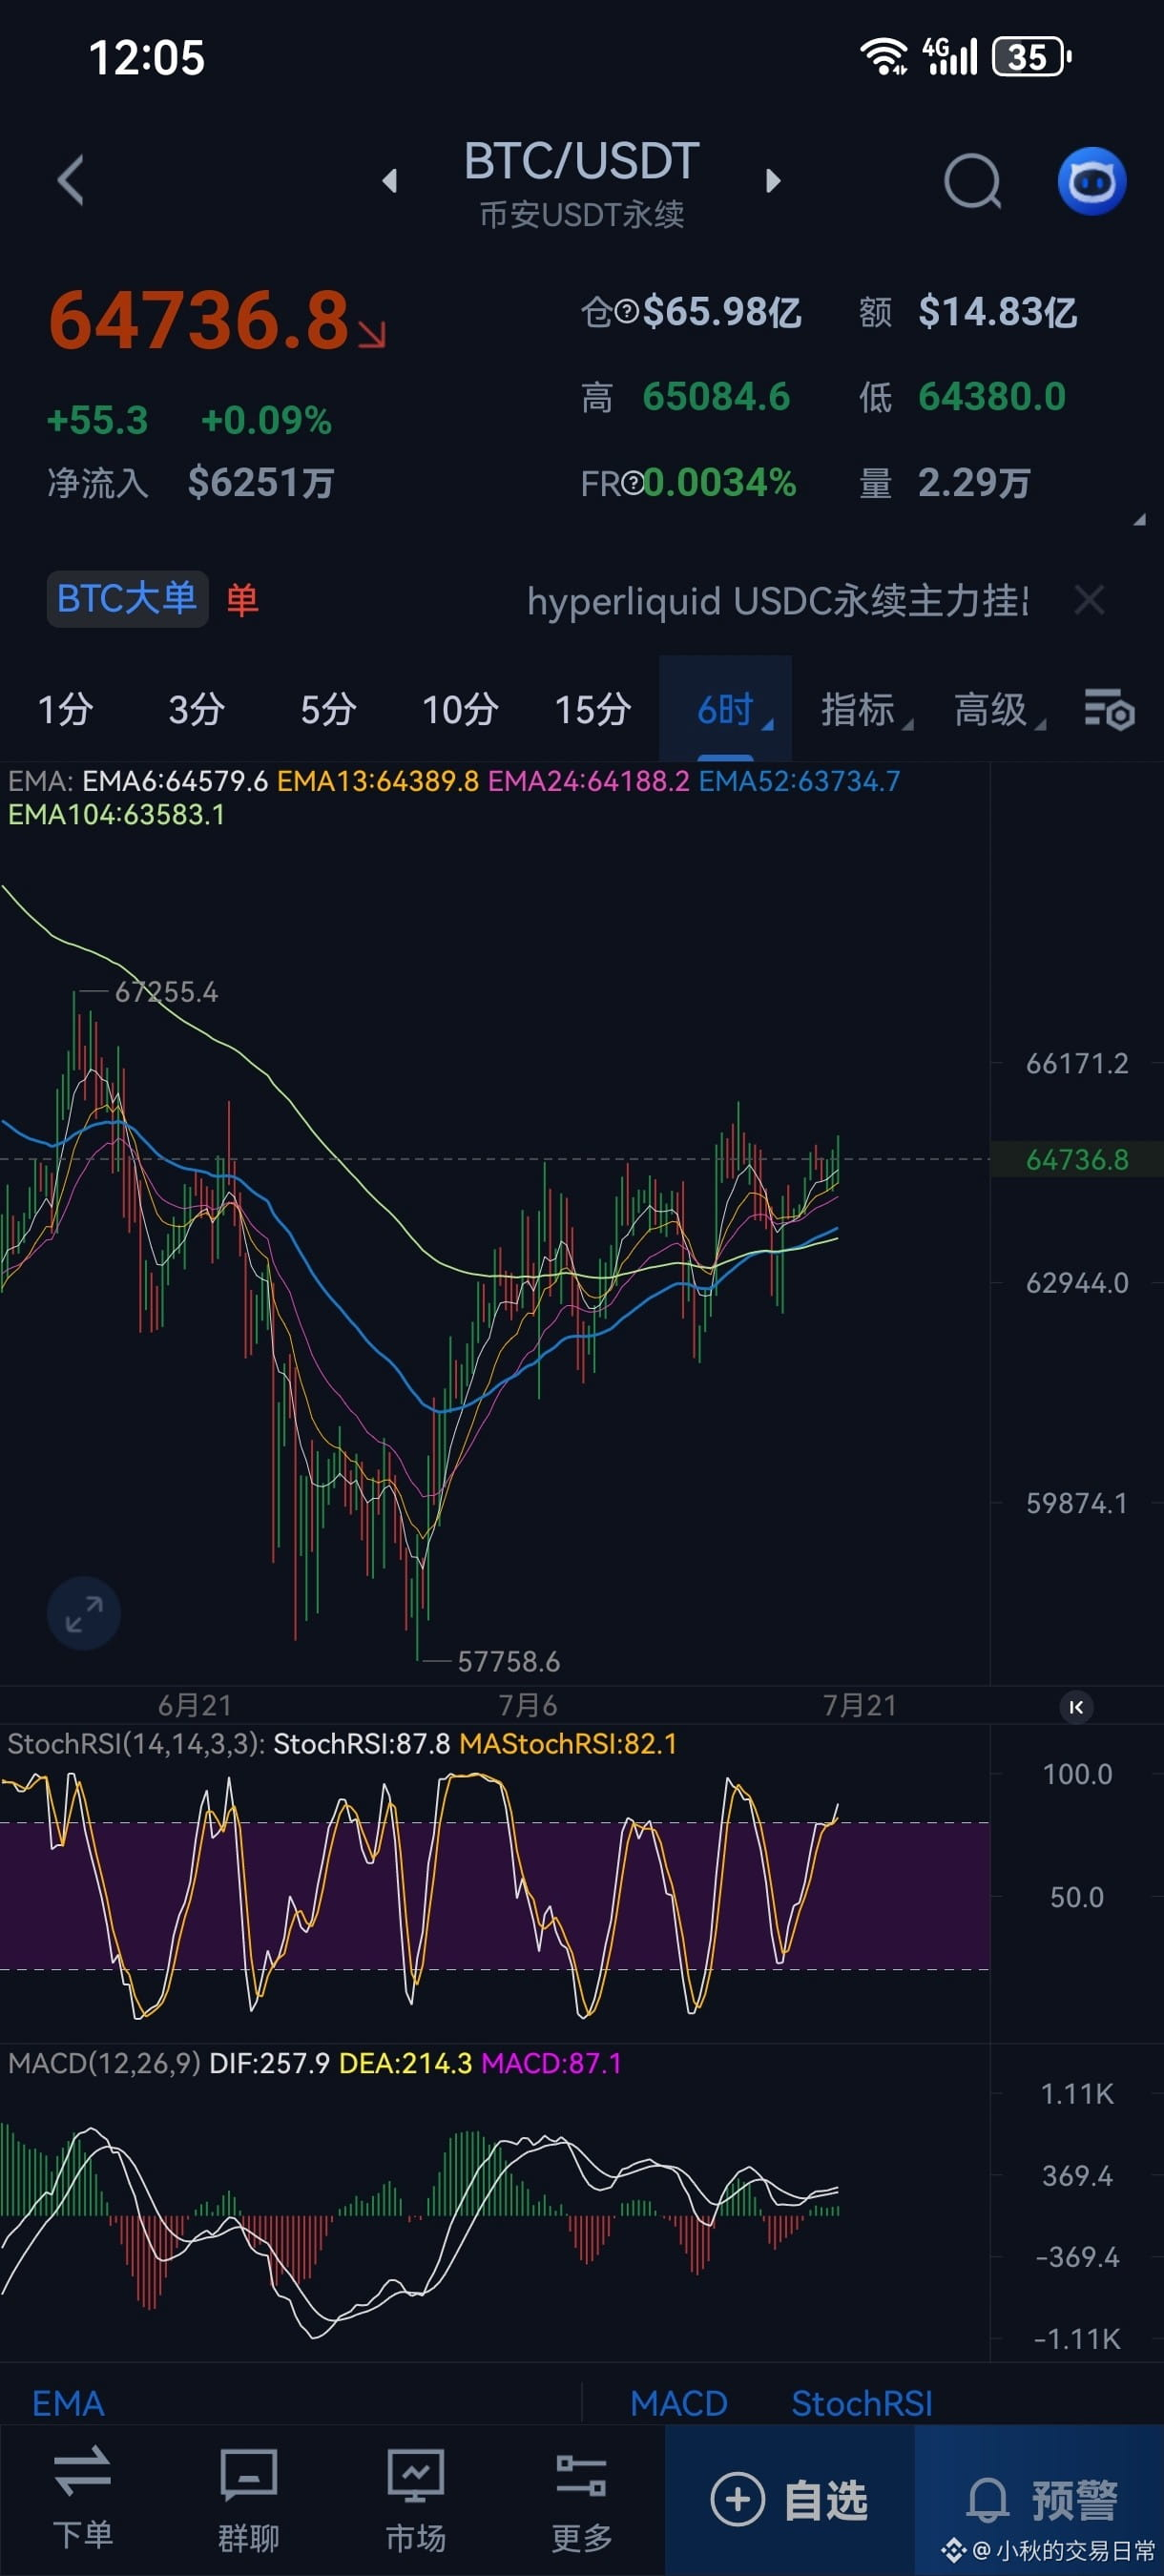
July 20 BTC technical analysis
We’re still in progress under the 6-hour logic. In this 6-hour period, the top-and-bottom structure is still forming, and 65,500 has not yet made an effective breakout! Wait for the logic to finish running.
As for the bottom 59,000 long positions, they can still be held for a bit more. Currently, there hasn’t been a bearish signal reversal in the trend line.
If the 6-hour momentum is strong enough to break through the 1-day resistance, then it will first move toward the 2-day level, around 67,500!
If short sellers want to enter for a short-term trade, wait for it to bounce again within the 6-hour window—then enter after the divergence appears!
We’re still in progress under the 6-hour logic. In this 6-hour period, the top-and-bottom structure is still forming, and 65,500 has not yet made an effective breakout! Wait for the logic to finish running.
As for the bottom 59,000 long positions, they can still be held for a bit more. Currently, there hasn’t been a bearish signal reversal in the trend line.
If the 6-hour momentum is strong enough to break through the 1-day resistance, then it will first move toward the 2-day level, around 67,500!
If short sellers want to enter for a short-term trade, wait for it to bounce again within the 6-hour window—then enter after the divergence appears!
Knowing is easy, but practicing is difficult. Knowing and doing must be unified. It’s been half a year, and I still haven’t managed it! Trading—this path—really tests human nature. When you’re in the right state, everything goes very smoothly. But once your mood turns bad, a single fleeting thought can defeat the strategy you’ve been thinking about!
Really, that saying is spot on: when you’re in a good state, just keep making trades; when you’re not in a good state and your mood is bad, then rest! Otherwise you’ll feel even worse.
This journey of refining yourself through trading is long. Take it slow. Give yourself more time—forgive yourself. Make peace with yourself. As long as you’re improving, that’s enough. Getting better and better is all I want. Landing a leap instantly to the top isn’t what I’m aiming for.
Everyone has days when they feel bad. Keep adjusting your mindset, and do your best to execute every order! Keep going!
Every time I update a post, there’s basically no issue. A week ago, I already told everyone about the 65500 plan to place a short position!
But recently I haven’t been watching the market, and I didn’t do it. I missed it! Wait for the next opportunity. Right now, my mind is on Hunan, and I don’t have the headspace to watch the market!
Starting next week, I’ll work harder and update a post every day…
Really, that saying is spot on: when you’re in a good state, just keep making trades; when you’re not in a good state and your mood is bad, then rest! Otherwise you’ll feel even worse.
This journey of refining yourself through trading is long. Take it slow. Give yourself more time—forgive yourself. Make peace with yourself. As long as you’re improving, that’s enough. Getting better and better is all I want. Landing a leap instantly to the top isn’t what I’m aiming for.
Everyone has days when they feel bad. Keep adjusting your mindset, and do your best to execute every order! Keep going!
Every time I update a post, there’s basically no issue. A week ago, I already told everyone about the 65500 plan to place a short position!
But recently I haven’t been watching the market, and I didn’t do it. I missed it! Wait for the next opportunity. Right now, my mind is on Hunan, and I don’t have the headspace to watch the market!
Starting next week, I’ll work harder and update a post every day…

July 15 BTC technical analysis,
The current market trend has already reversed. The previous posts were also consistently bullish—perfectly in line with what we predicted. The current resistance above is 65,500. Let’s see whether it can hold. If it holds, the 1-day pullback setup won’t be valid anymore.
A bottom-buying signal formed on the 6-hour chart. On the 6-hour timeframe, it has returned to the 0 axis—this is the rational entry point. At this moment, you can’t short yet! Wait until the internal logic of the 6-hour cycle finishes, then consider a short-term short position.
For the trend, go with the direction of the long side. When it pulls back, go long. Follow me—if you can understand it simply, you basically won’t place contrarian trades, right? Trade with the trend. Positions initiated from the 0 axis are generally steady and reliable.
The current market trend has already reversed. The previous posts were also consistently bullish—perfectly in line with what we predicted. The current resistance above is 65,500. Let’s see whether it can hold. If it holds, the 1-day pullback setup won’t be valid anymore.
A bottom-buying signal formed on the 6-hour chart. On the 6-hour timeframe, it has returned to the 0 axis—this is the rational entry point. At this moment, you can’t short yet! Wait until the internal logic of the 6-hour cycle finishes, then consider a short-term short position.
For the trend, go with the direction of the long side. When it pulls back, go long. Follow me—if you can understand it simply, you basically won’t place contrarian trades, right? Trade with the trend. Positions initiated from the 0 axis are generally steady and reliable.
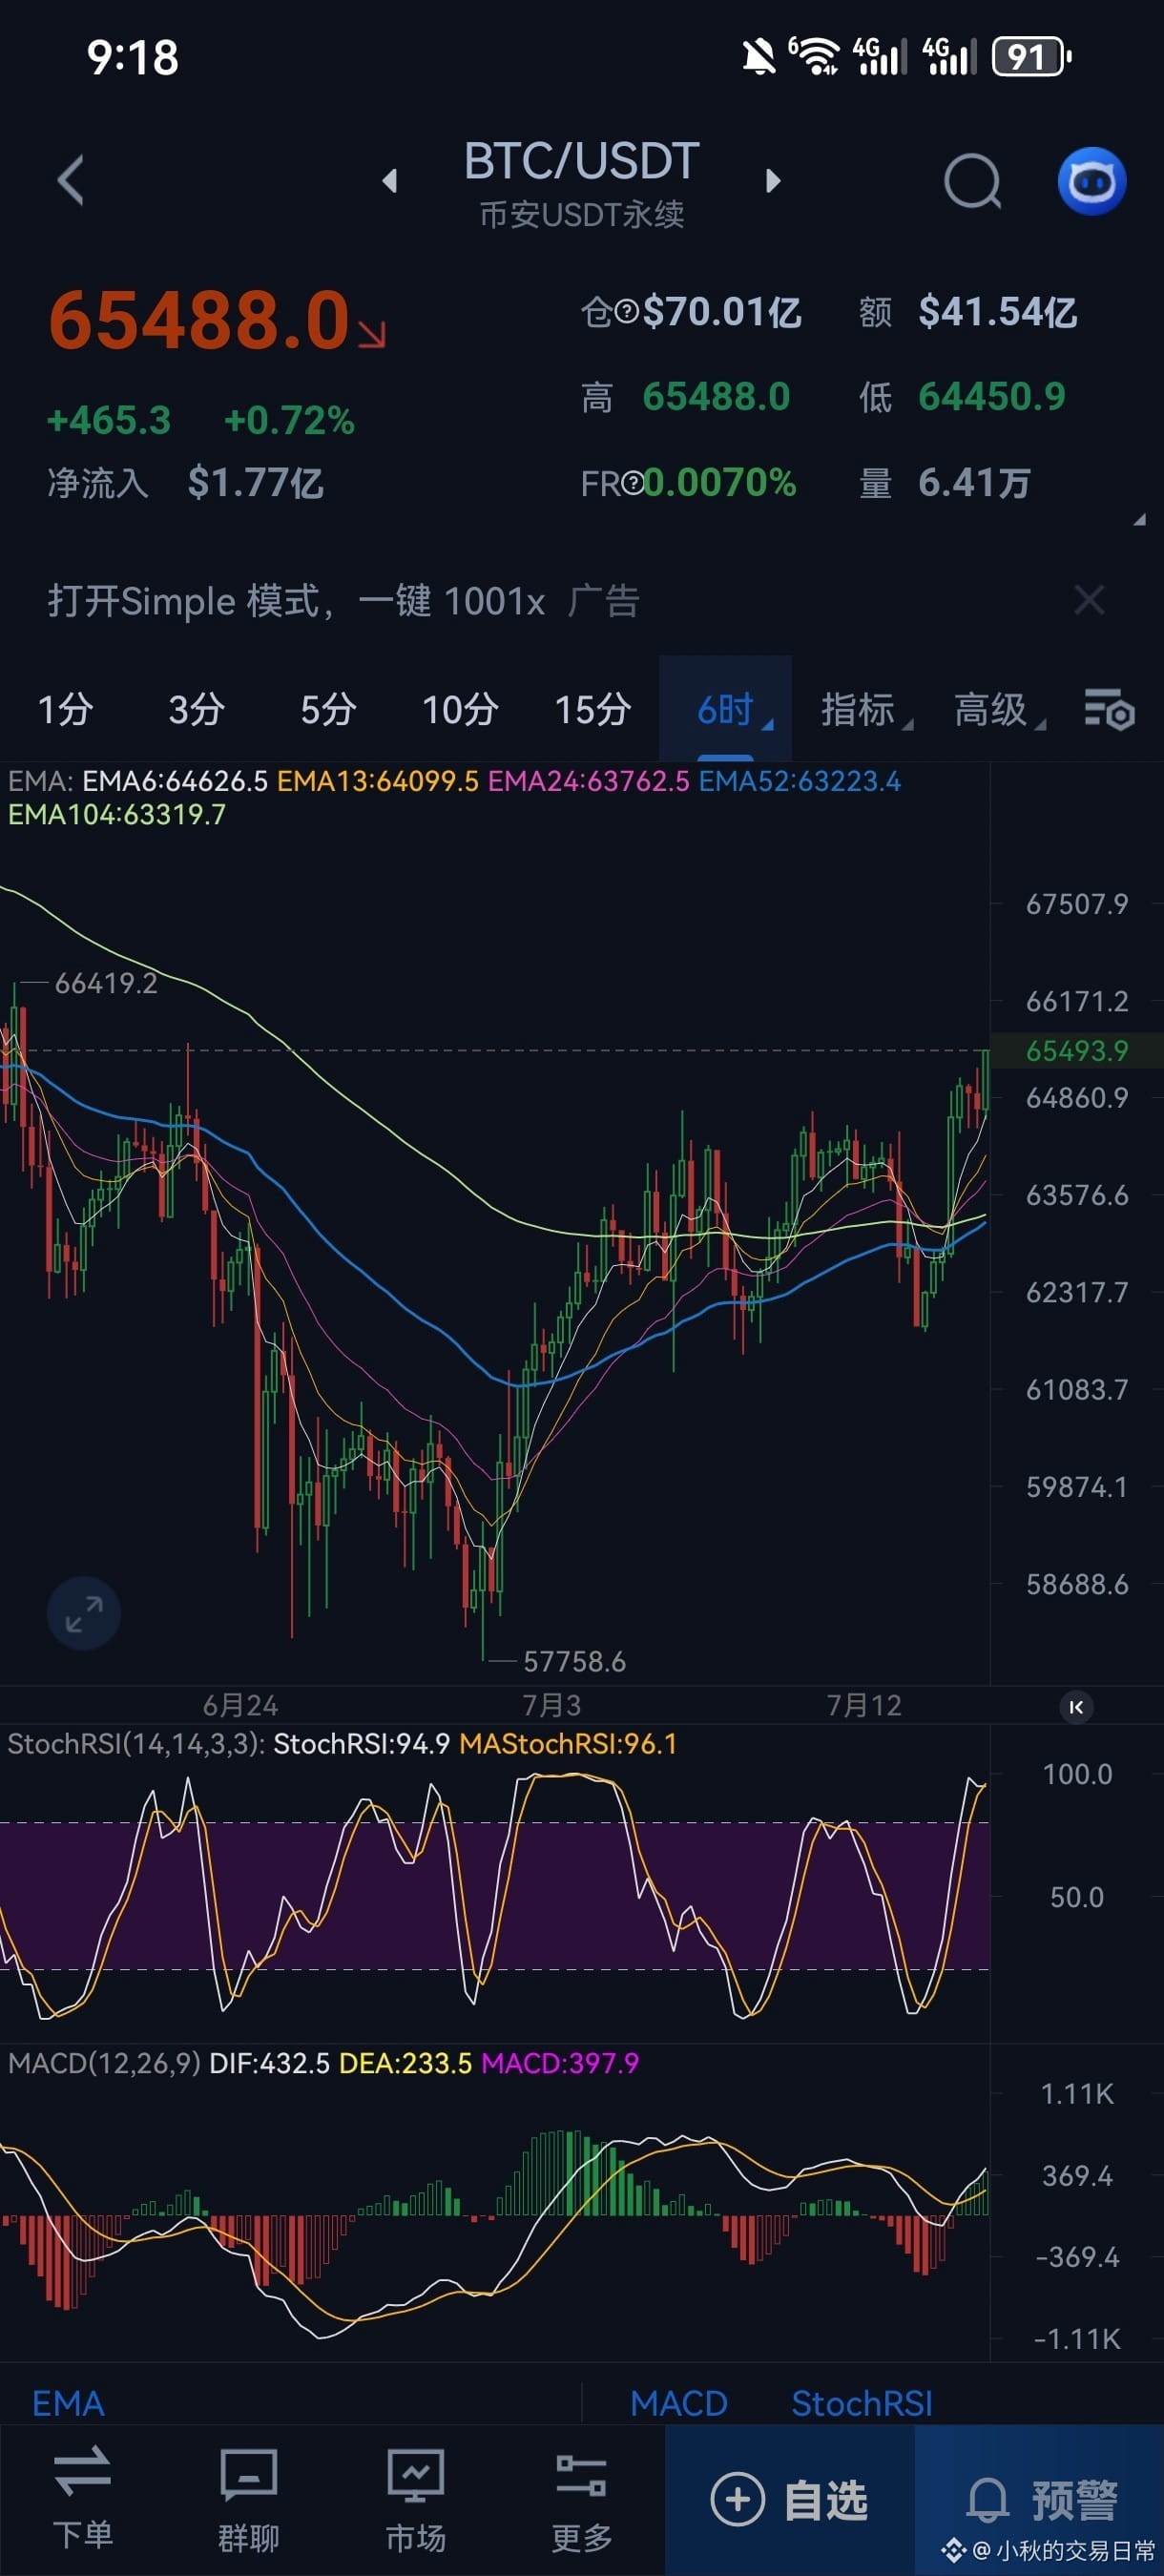
July 9 BTC technical analysis
We have now reached the 4-hour 0-axis support area. The 30-minute chart has already formed a bottom divergence buy signal, and we’ve also arrived at the 62,000 range I mentioned a couple of days ago. The 4-hour support here is very important—this level must not break. If it holds, it could push toward around 65,500! If it breaks, we’ll likely need further adjustment!
Around 62,000—do you dare to get on board?
A few days ago, when it was around 64,000, our group also alerted everyone about this wave of decline. Most people followed the timing! If you keep the rhythm right, making money is actually as simple as breathing—it's just about each person’s practice!
We have now reached the 4-hour 0-axis support area. The 30-minute chart has already formed a bottom divergence buy signal, and we’ve also arrived at the 62,000 range I mentioned a couple of days ago. The 4-hour support here is very important—this level must not break. If it holds, it could push toward around 65,500! If it breaks, we’ll likely need further adjustment!
Around 62,000—do you dare to get on board?
A few days ago, when it was around 64,000, our group also alerted everyone about this wave of decline. Most people followed the timing! If you keep the rhythm right, making money is actually as simple as breathing—it's just about each person’s practice!
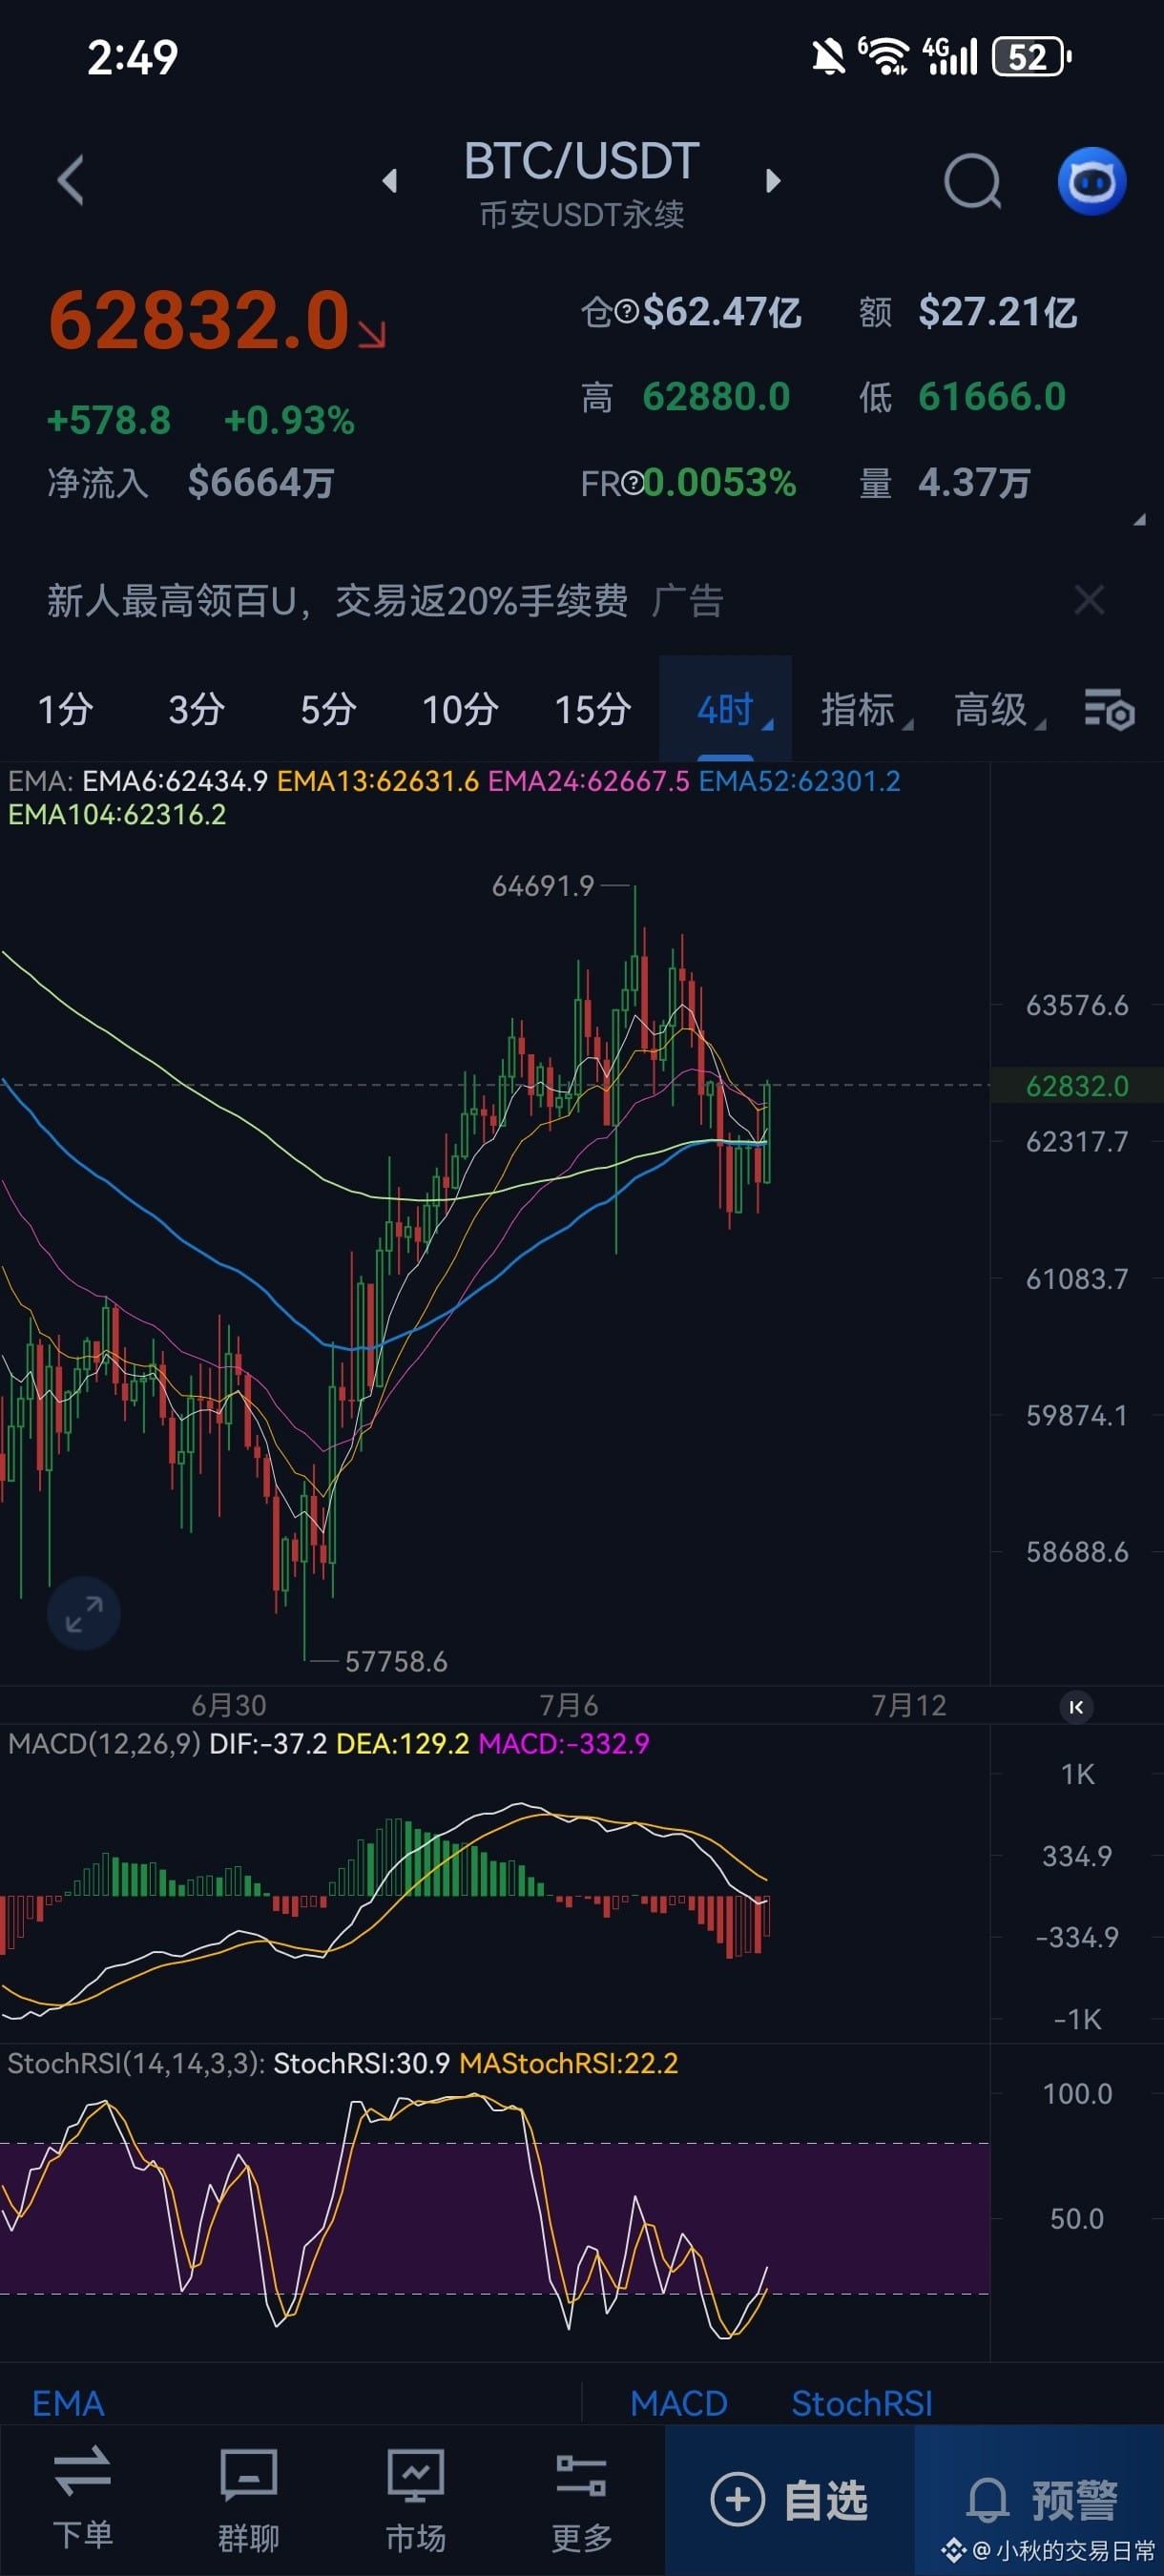
July 7 BTC technical analysis,
Currently the price is at the 16-hour pressure level. It’s just a little short of the 65,500 area I predicted—still in a one-day pressure zone!
So how is the market looking now?
First, look at the four-hour support: if it doesn’t break below around 62,200, then the outlook is still to move up toward the 65,500 area!
The price action is still running within the expected range. The logic is still under the 16-hour pressure; as long as the pullback doesn’t break 62,200, I remain bullish! Consider setting up a short position only around the 66,000 area.
Currently the price is at the 16-hour pressure level. It’s just a little short of the 65,500 area I predicted—still in a one-day pressure zone!
So how is the market looking now?
First, look at the four-hour support: if it doesn’t break below around 62,200, then the outlook is still to move up toward the 65,500 area!
The price action is still running within the expected range. The logic is still under the 16-hour pressure; as long as the pullback doesn’t break 62,200, I remain bullish! Consider setting up a short position only around the 66,000 area.
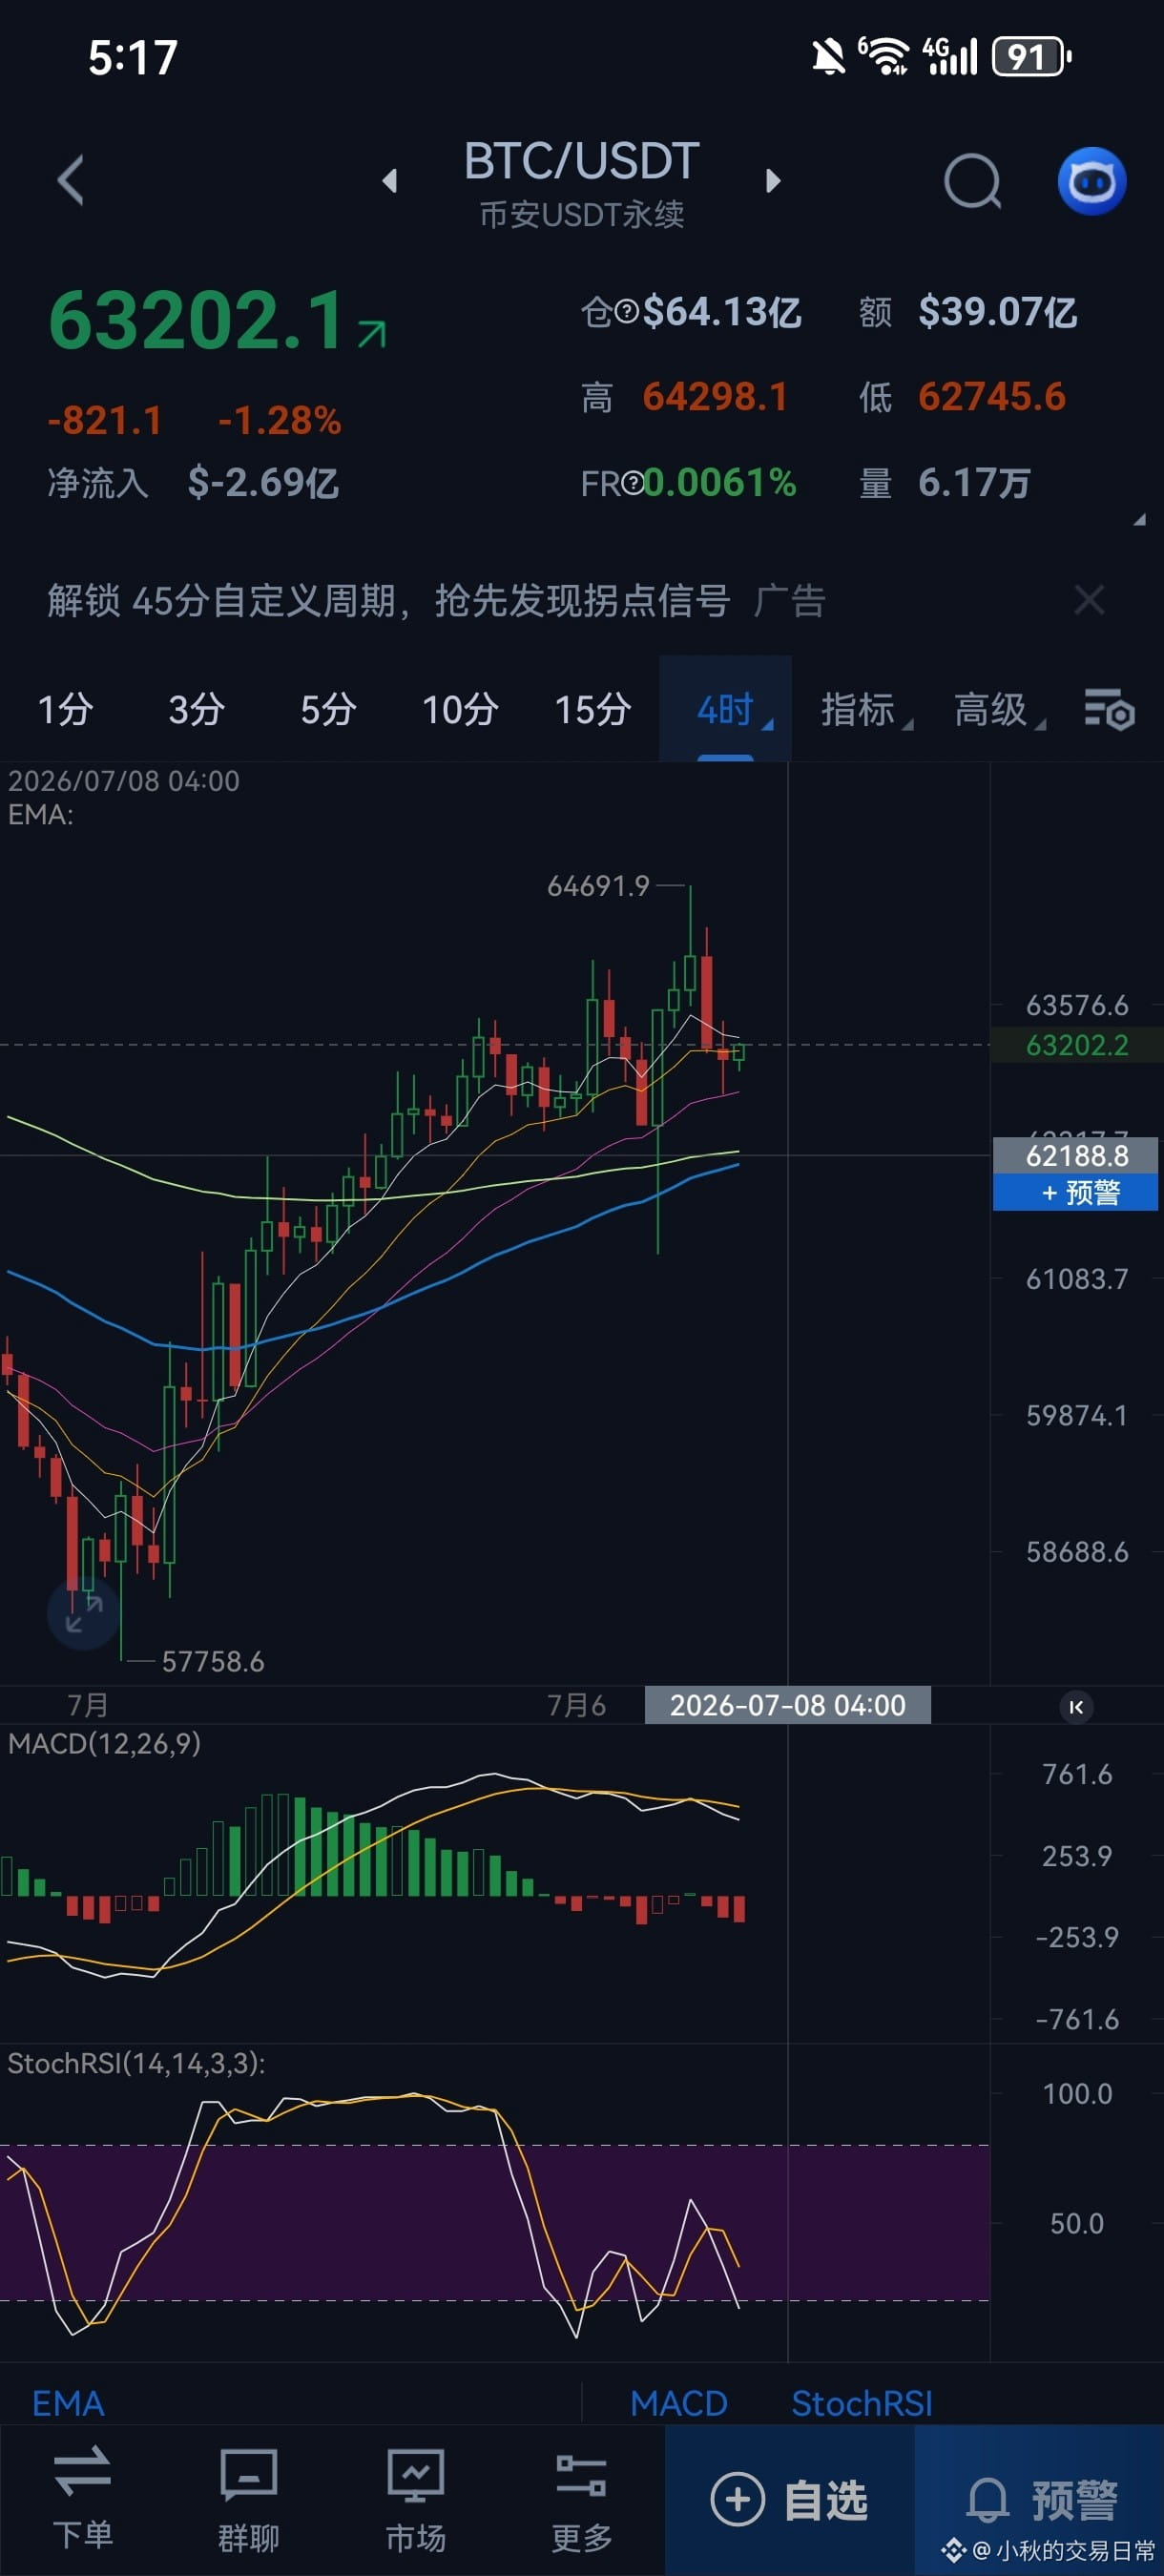
July 2 Bitcoin technical analysis, 8:30 AM
Where will Bitcoin go today? Which level should you watch?
The past few days I didn’t update posts because I went out for field study—then I didn’t want to post. Actually, the market has all been within our expectations. Every time it has been unbelievably precise. Now I finally understand the meaning of learning—at least I won’t be a fool, and at least I won’t give money to the market for nothing!
I’m finally not a fool now!
1. Watch whether the overhead pressure around 63,000 can break through effectively. On the downside, the 2-hour support is around 60,000. If 60,000 holds, then priority is to go long on a lower timeframe pullback.
2. If it drops straight down within 1 hour or 2 hours, then after the pullback we can consider going short again; or if within 1 hour or 2 hours it creates a divergence but doesn’t break above 63,000, then don’t short into a move up—also, as long as 58,000 isn’t broken, we still prioritize longs.
The wealth password has already been sent to you—can you understand it? If you can keep up, then it depends on your insight!
Where will Bitcoin go today? Which level should you watch?
The past few days I didn’t update posts because I went out for field study—then I didn’t want to post. Actually, the market has all been within our expectations. Every time it has been unbelievably precise. Now I finally understand the meaning of learning—at least I won’t be a fool, and at least I won’t give money to the market for nothing!
I’m finally not a fool now!
1. Watch whether the overhead pressure around 63,000 can break through effectively. On the downside, the 2-hour support is around 60,000. If 60,000 holds, then priority is to go long on a lower timeframe pullback.
2. If it drops straight down within 1 hour or 2 hours, then after the pullback we can consider going short again; or if within 1 hour or 2 hours it creates a divergence but doesn’t break above 63,000, then don’t short into a move up—also, as long as 58,000 isn’t broken, we still prioritize longs.
The wealth password has already been sent to you—can you understand it? If you can keep up, then it depends on your insight!
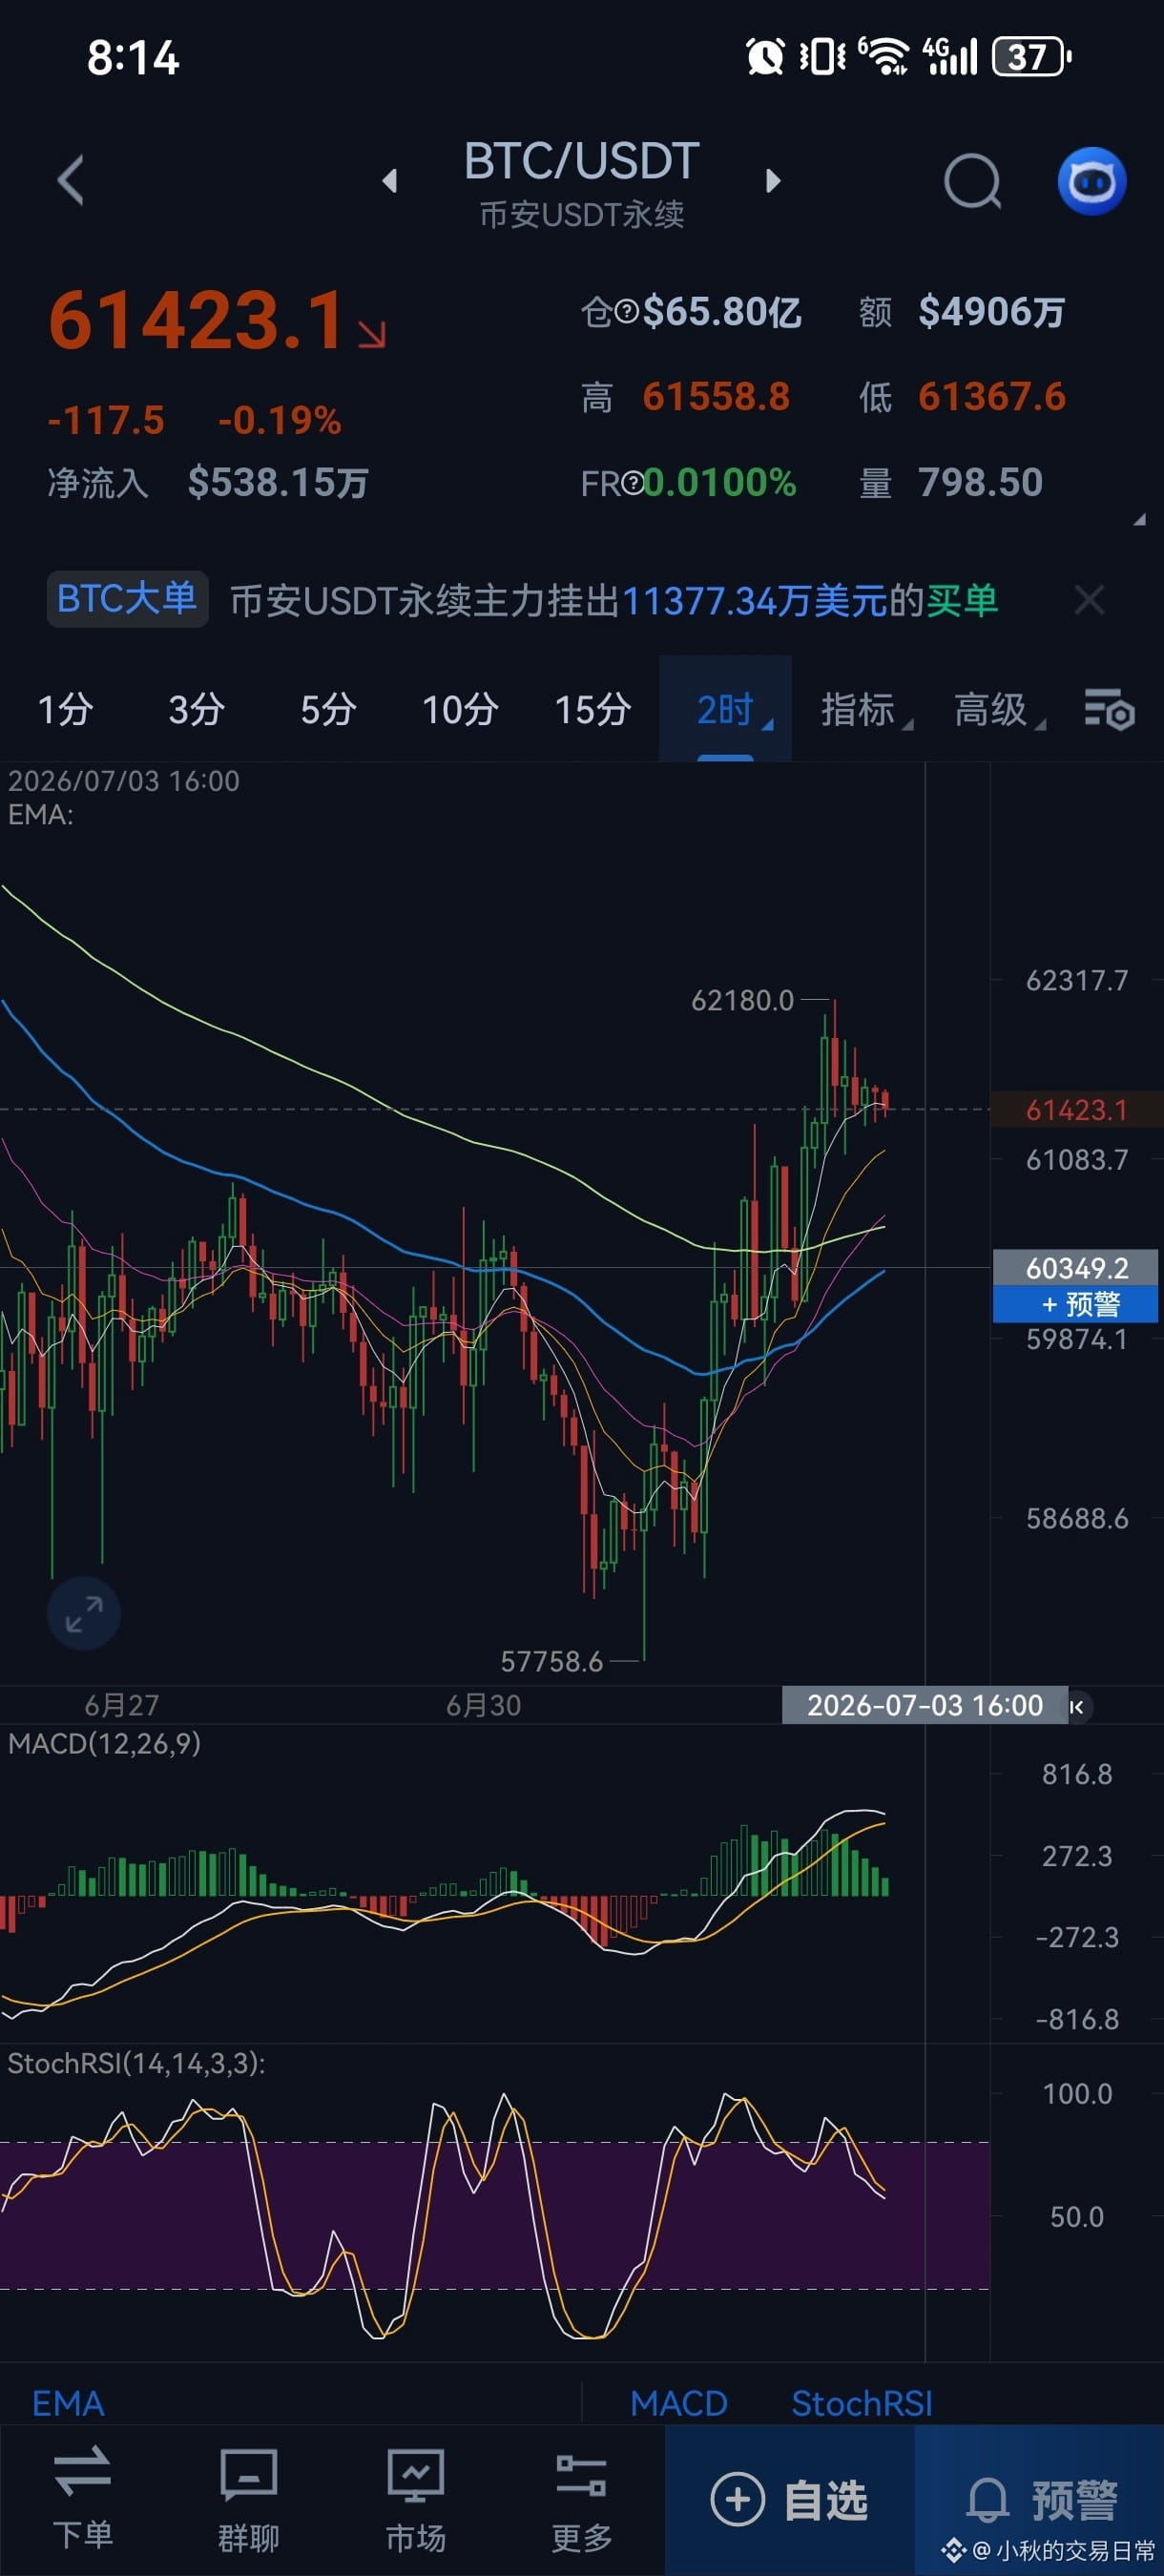
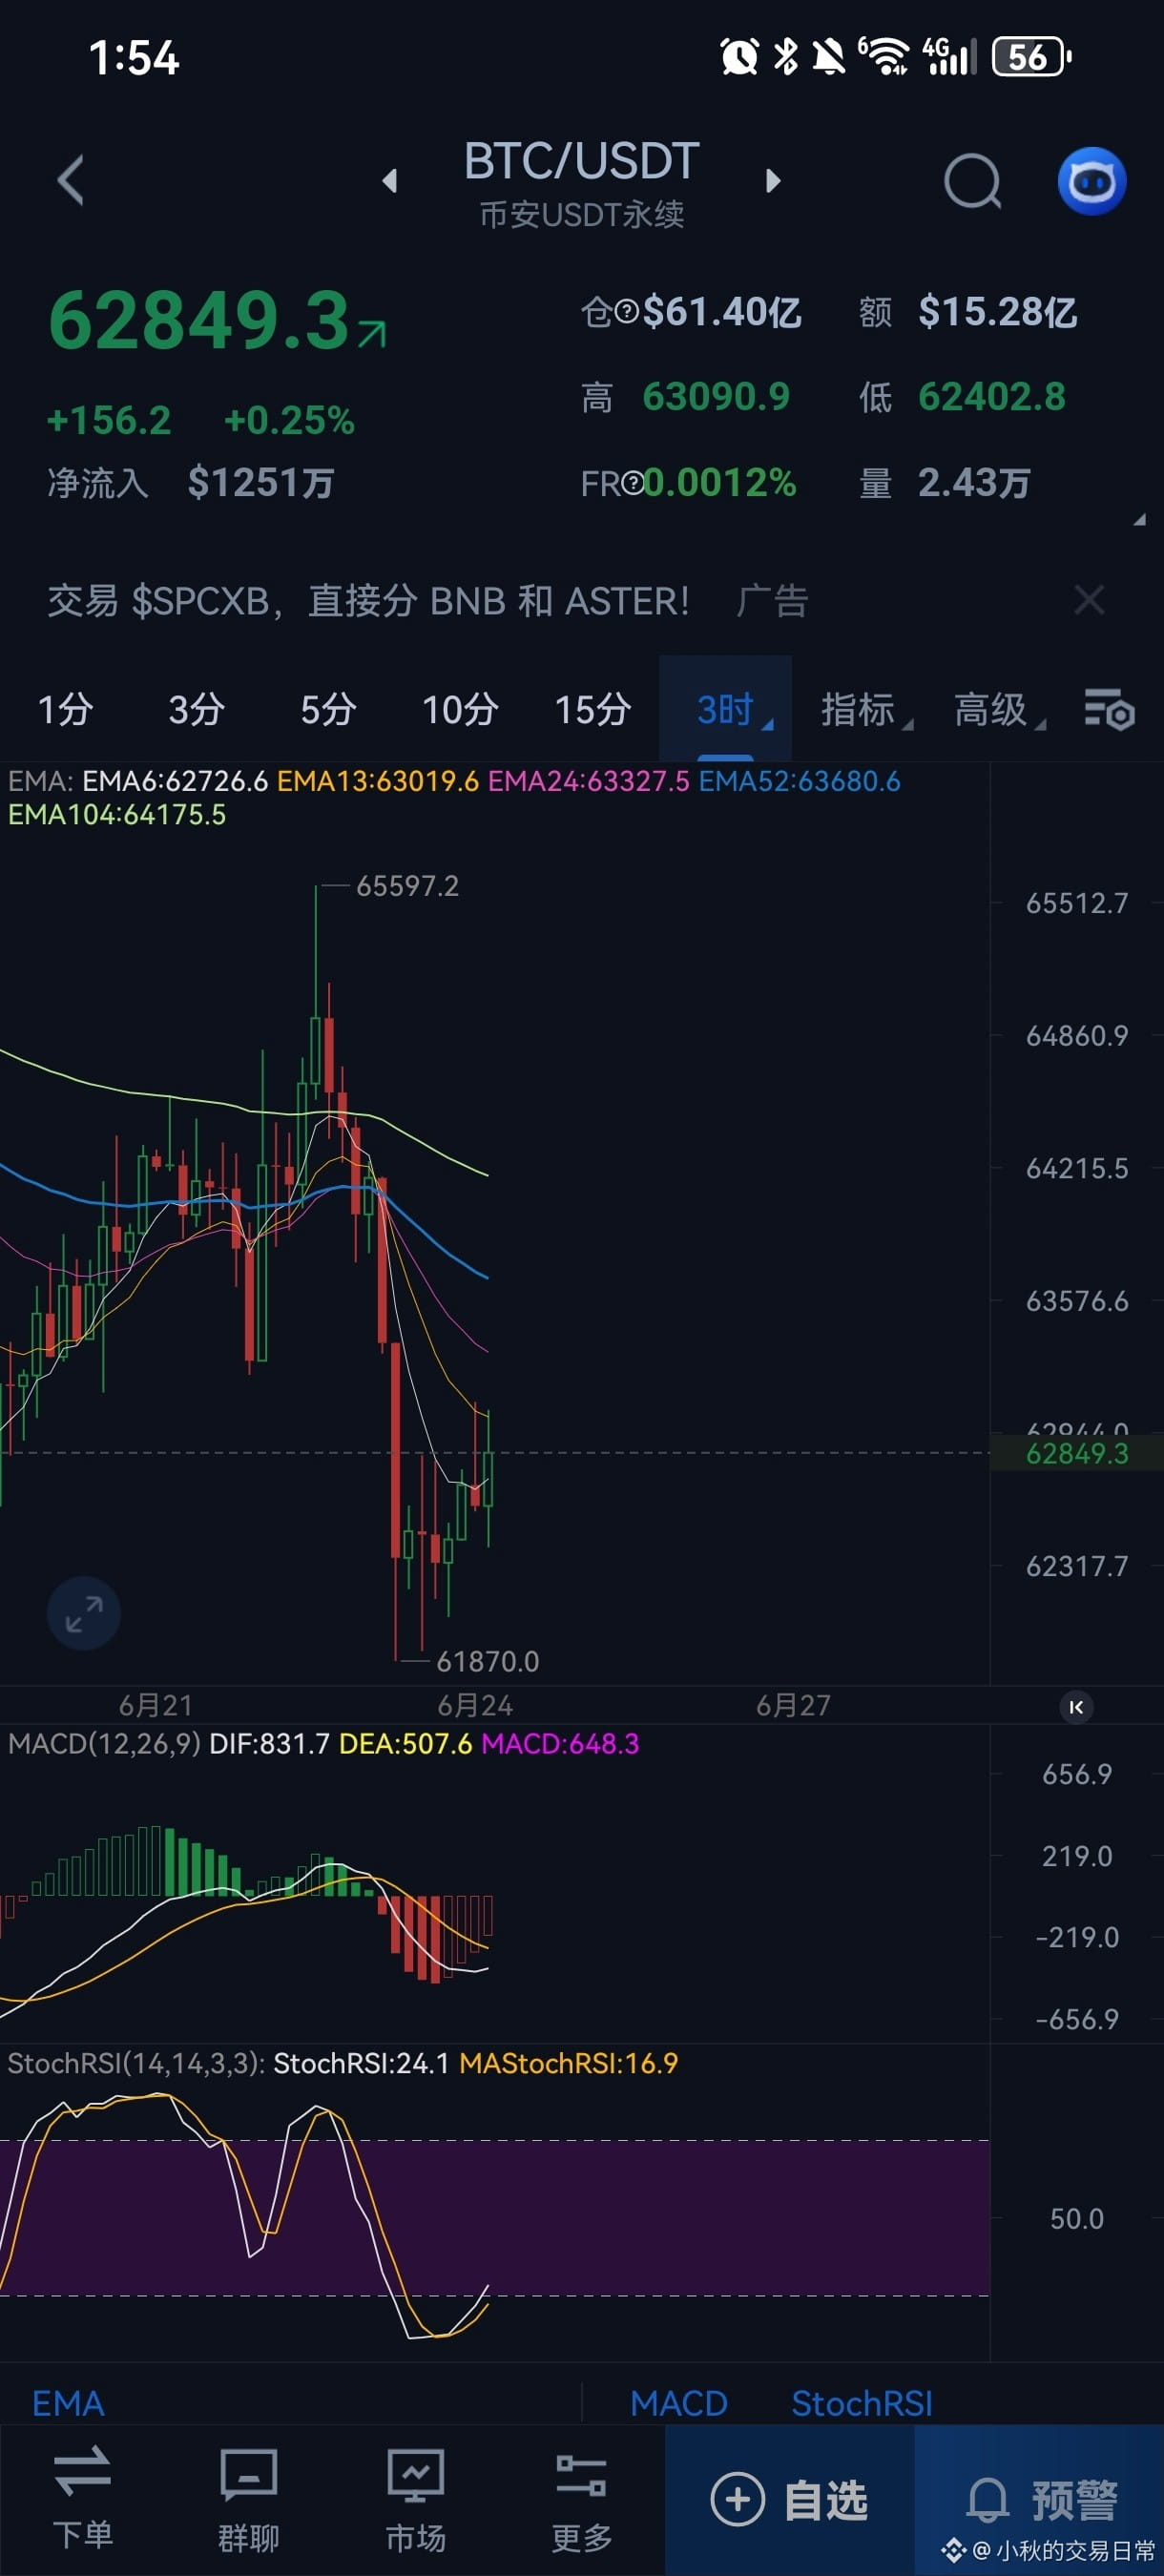
Bitcoin technical analysis on June 24
It’s now 14:00 in the afternoon. Note the 2-hour pressure level around 63,500; 63,000 is currently the first resistance.
Prefer going short and watch the strength of the 15-minute rebound! If a buy signal appears, enter a short. If the price holds steady, cancel the trade. Then first look for support below at 62,000.
Currently, it’s consolidating around the monthly support level. The bottom buy setup hasn’t formed yet. The key focus is whether the resistance at 63,500 can be broken through. Stay cautious for now. As for Ethereum, focus on the strength of the 12-hour pullback rebound!
It’s now 14:00 in the afternoon. Note the 2-hour pressure level around 63,500; 63,000 is currently the first resistance.
Prefer going short and watch the strength of the 15-minute rebound! If a buy signal appears, enter a short. If the price holds steady, cancel the trade. Then first look for support below at 62,000.
Currently, it’s consolidating around the monthly support level. The bottom buy setup hasn’t formed yet. The key focus is whether the resistance at 63,500 can be broken through. Stay cautious for now. As for Ethereum, focus on the strength of the 12-hour pullback rebound!
June 22 BTC Market Analysis
Currently in a sideways consolidation phase, with no clear buy or sell signals. Key resistance to watch is at 65,000 and support at 63,800.
Once we break through either level, the direction will become clear:
1. If 64,000 holds, we’ll lean bullish and if we break and hold above 65,000, it’s a long, targeting around 68,000 in the next day.
2. If we break below 63,800 and the 1-hour MACD yellow line crosses down, we’ll short, aiming for the previous low at 60,000!
During consolidation, don’t engage. It’s pointless!
Focus on the 1 and 2-hour chart positions.
Dynamic analysis! Don’t open trades casually! Be strategic!
Currently in a sideways consolidation phase, with no clear buy or sell signals. Key resistance to watch is at 65,000 and support at 63,800.
Once we break through either level, the direction will become clear:
1. If 64,000 holds, we’ll lean bullish and if we break and hold above 65,000, it’s a long, targeting around 68,000 in the next day.
2. If we break below 63,800 and the 1-hour MACD yellow line crosses down, we’ll short, aiming for the previous low at 60,000!
During consolidation, don’t engage. It’s pointless!
Focus on the 1 and 2-hour chart positions.
Dynamic analysis! Don’t open trades casually! Be strategic!
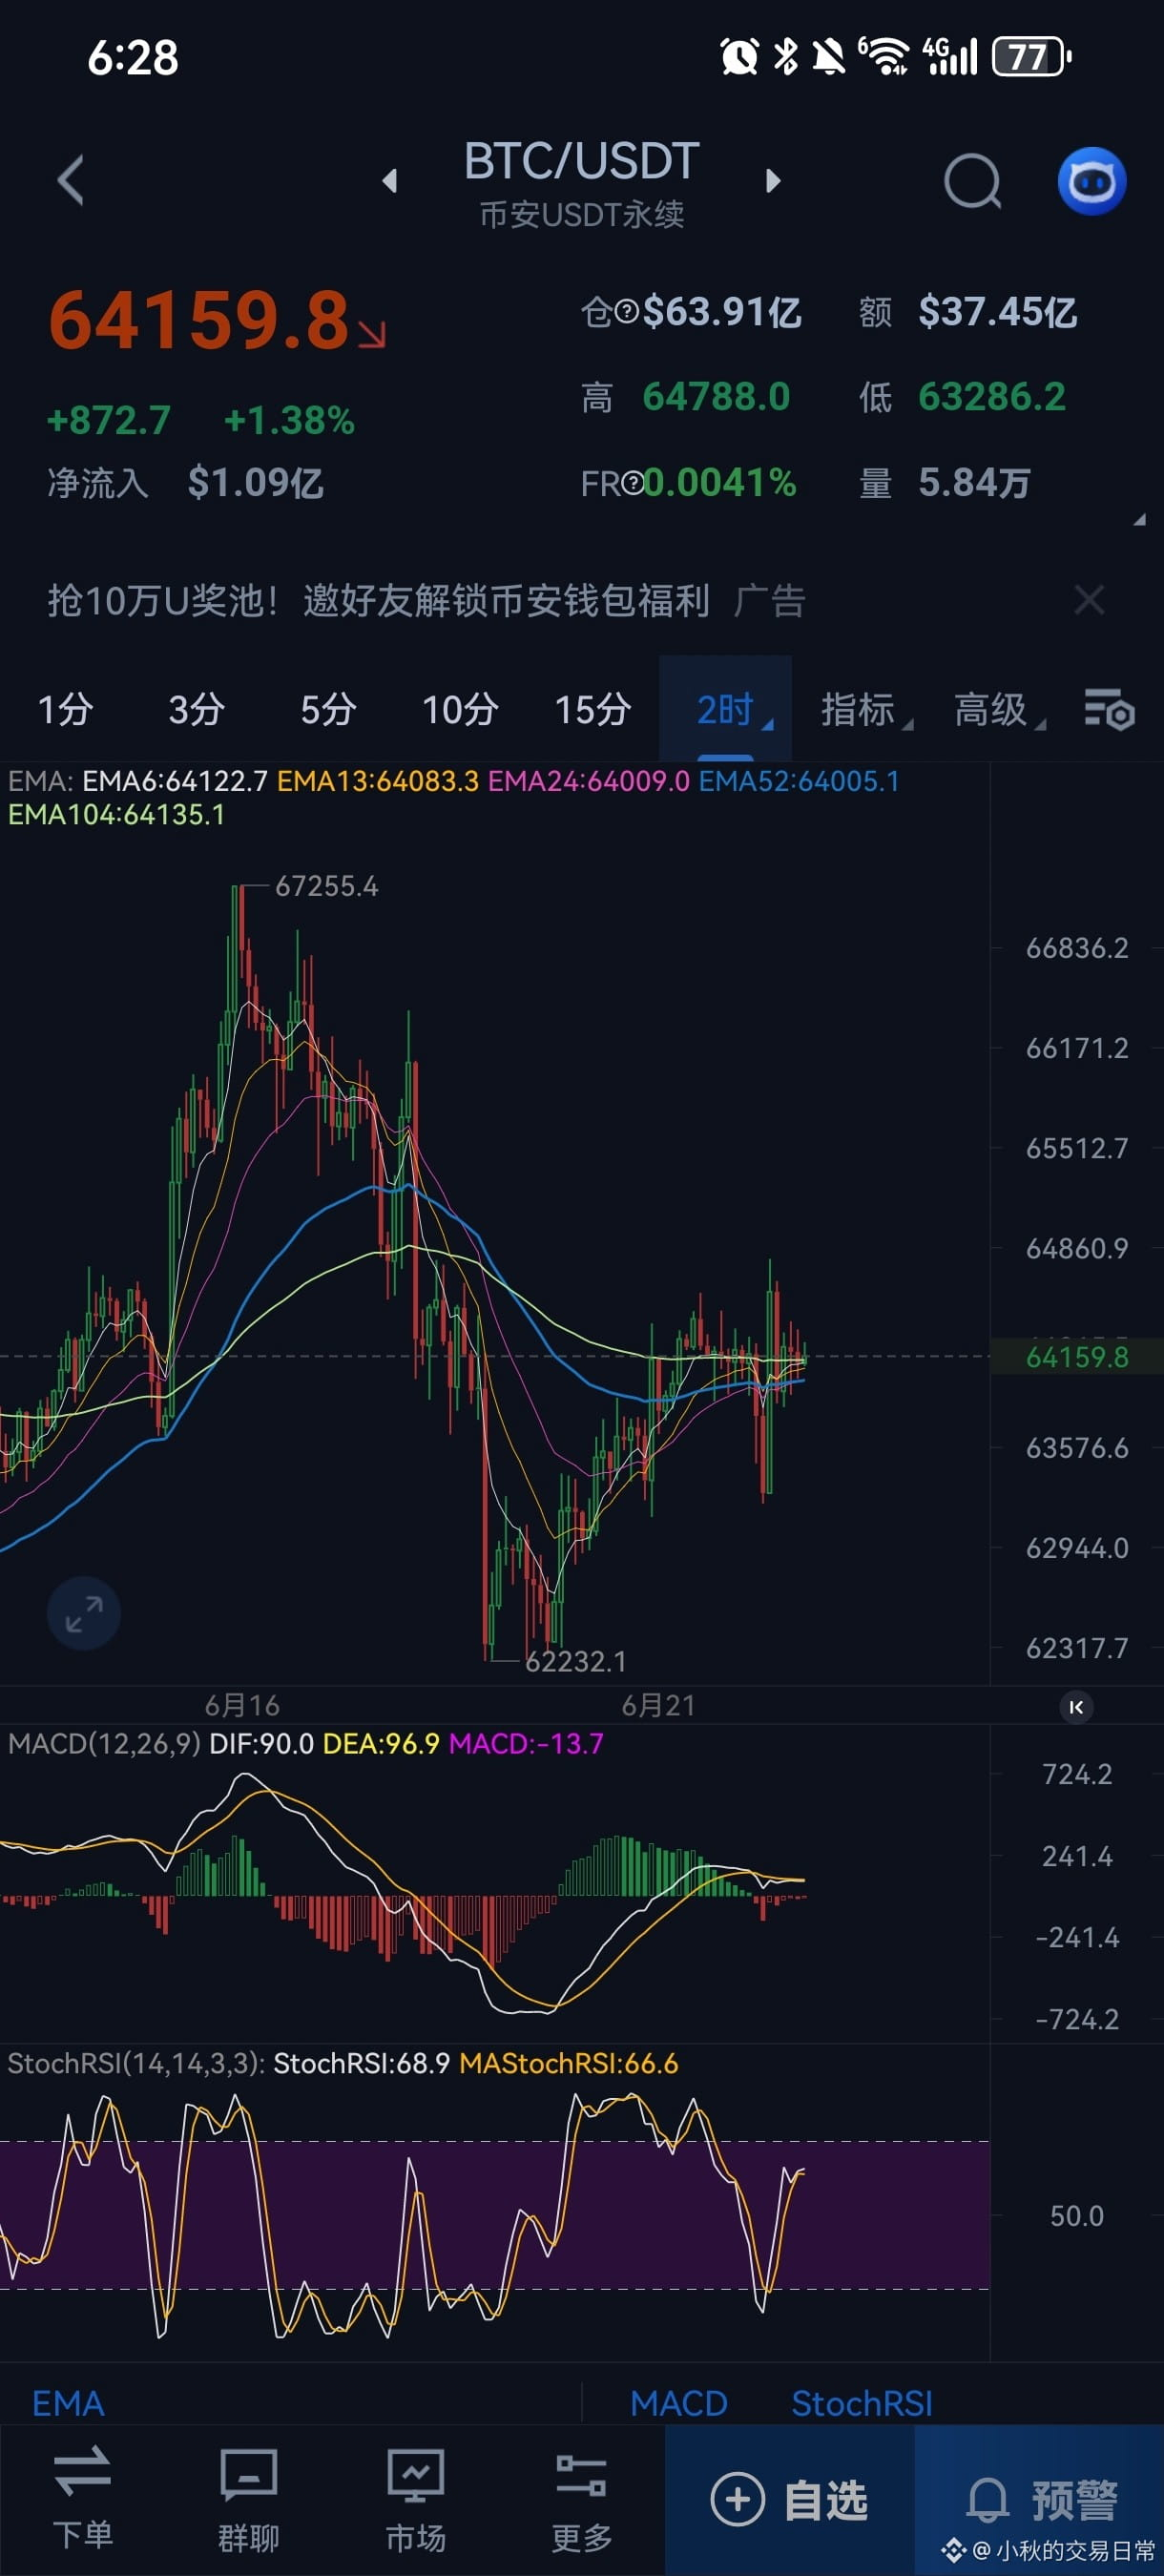
June 20th Bitcoin technical analysis, what should we do now? There's resistance around 64000 for a short setup on the 2-hour chart, watch for a retracement on the 2-hour candlestick! For Ethereum, also look for a 2-hour retracement, if it can’t hold above the resistance near 1730, maybe just hold off for now! First step, check the previous low below.
June 17 BTC technical analysis,
Yesterday I mentioned setting up a short around 67500, targeting first to see 64500.
We're already at that station, time to get off. Close the short position for now, the 4-hour support level needs to hold; if it does, we can look for the previous highs again.
We're in this consolidation range, with upper resistance at 67500 and near 68000,
And the lower support is at 64500!
Today I’m out and busy, so I won't be checking the charts much. I’ll take a look again tomorrow and see how to play it.
Yesterday I mentioned setting up a short around 67500, targeting first to see 64500.
We're already at that station, time to get off. Close the short position for now, the 4-hour support level needs to hold; if it does, we can look for the previous highs again.
We're in this consolidation range, with upper resistance at 67500 and near 68000,
And the lower support is at 64500!
Today I’m out and busy, so I won't be checking the charts much. I’ll take a look again tomorrow and see how to play it.
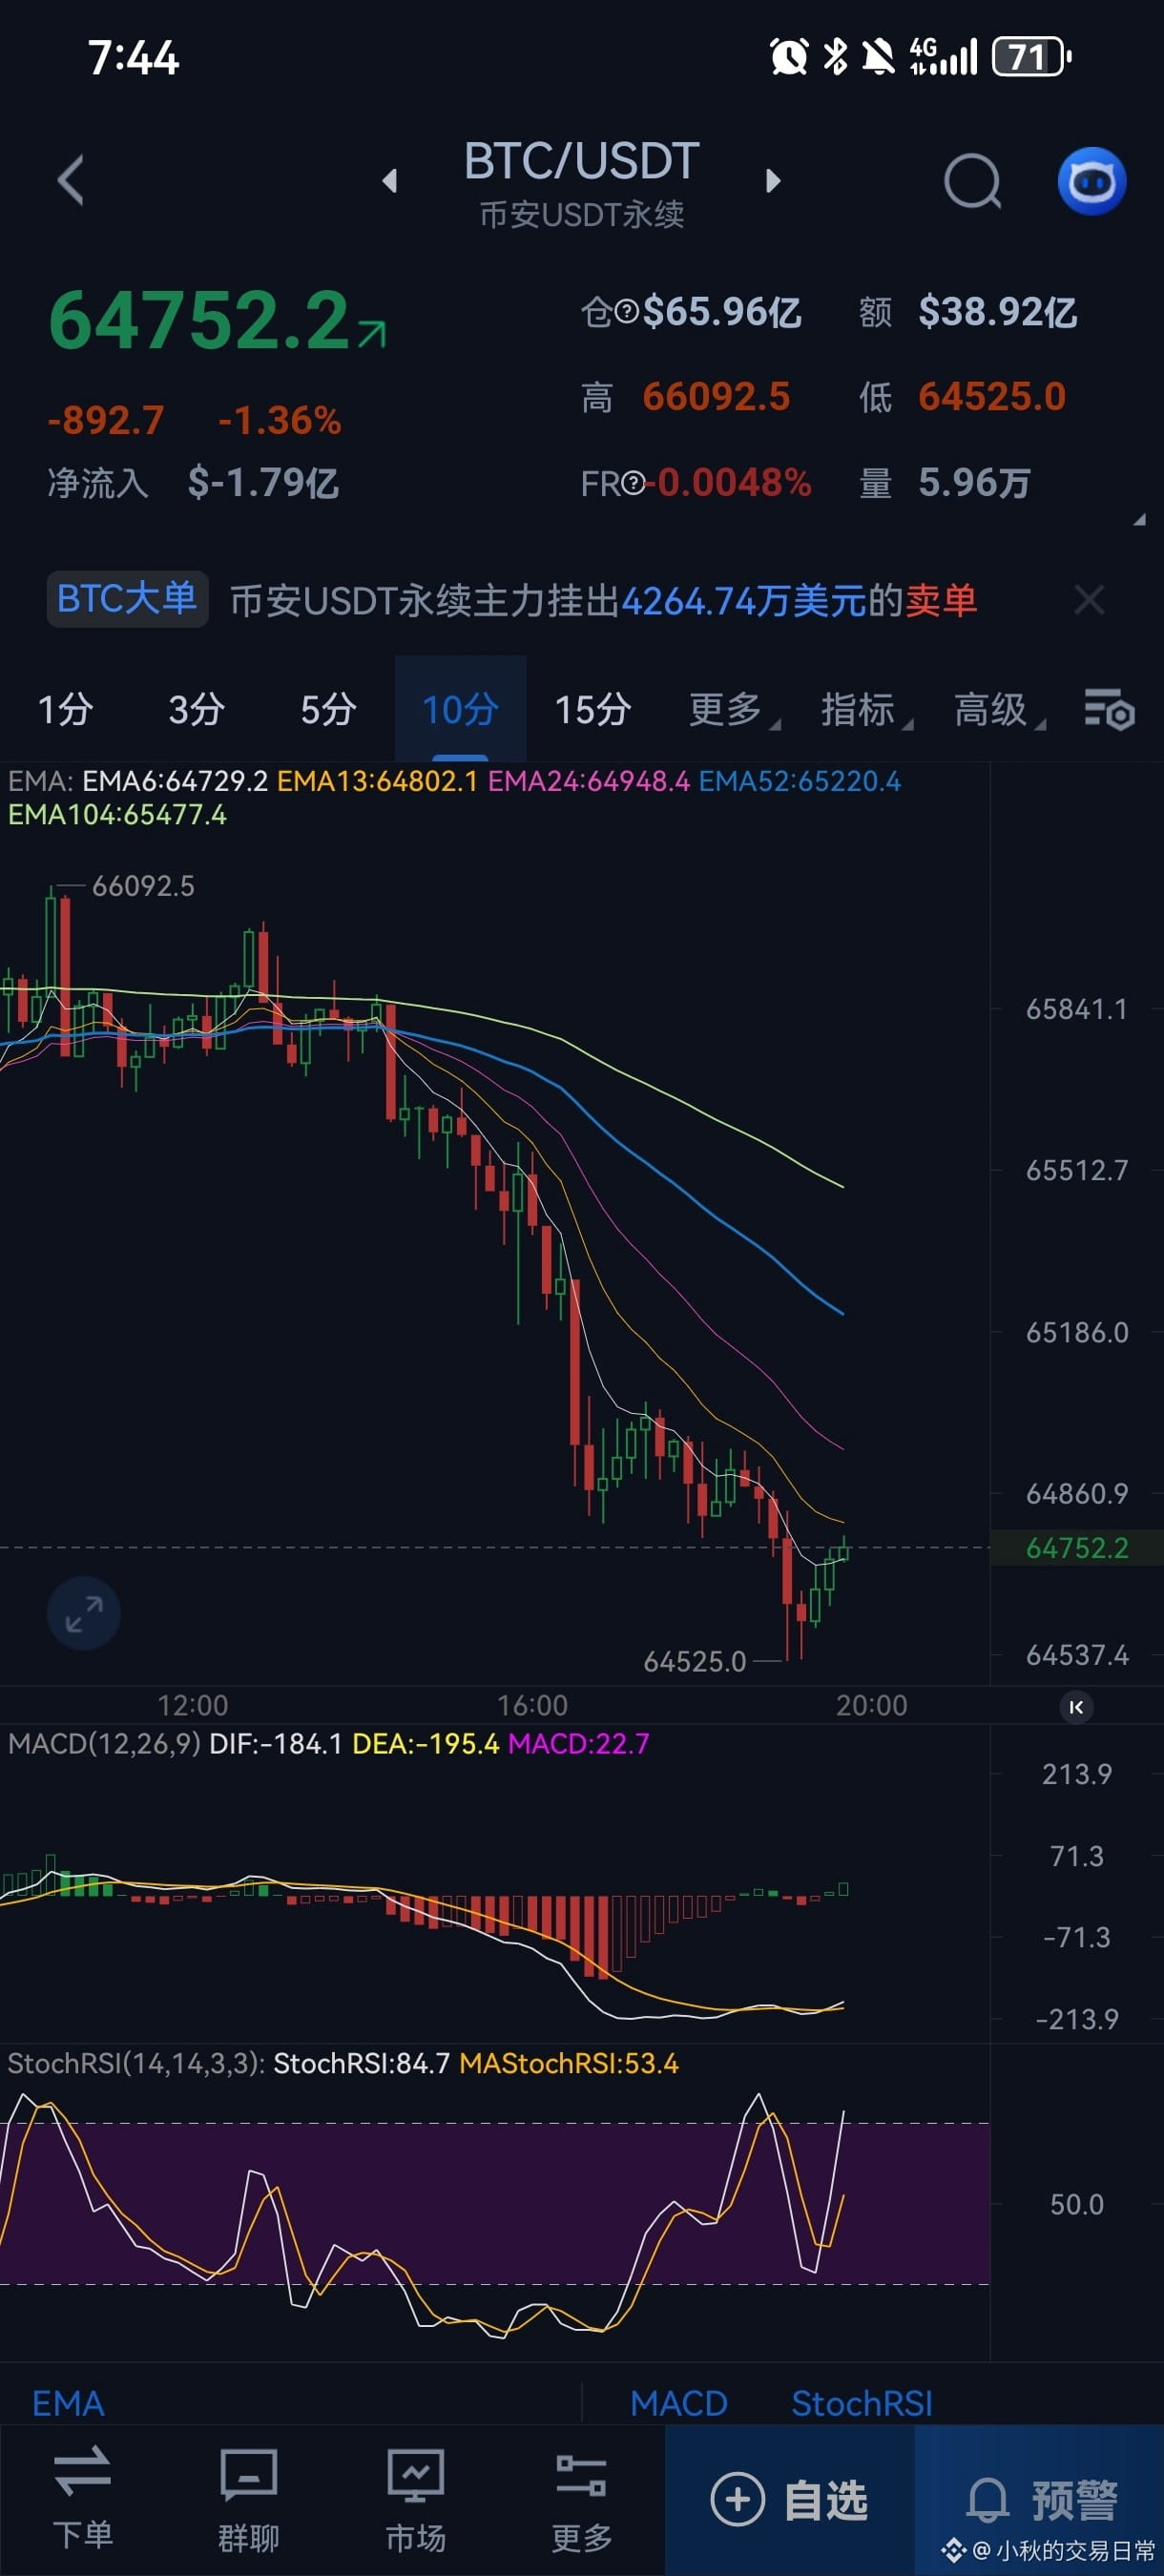
June 16th, Bitcoin Technical Analysis
We're hitting our target perfectly now, just $300 away from 67500. I opened a live stream yesterday and told everyone to set up shorts around 67500, posted it too, keep up with the rhythm, let's eat 🥩!
If you're holding longs, it's time to take some profits, especially with this short-term short.
For the specifics, keep an eye on the support at 64500!
If that support doesn't hold, we'll be looking further down.
Ethereum's pattern is similar to Bitcoin's; if Bitcoin goes short, Ethereum follows suit—two brothers!
Where's the next opportunity? If Bitcoin dares to push up to 68000, then just short it without hesitation! Go all in!
We're hitting our target perfectly now, just $300 away from 67500. I opened a live stream yesterday and told everyone to set up shorts around 67500, posted it too, keep up with the rhythm, let's eat 🥩!
If you're holding longs, it's time to take some profits, especially with this short-term short.
For the specifics, keep an eye on the support at 64500!
If that support doesn't hold, we'll be looking further down.
Ethereum's pattern is similar to Bitcoin's; if Bitcoin goes short, Ethereum follows suit—two brothers!
Where's the next opportunity? If Bitcoin dares to push up to 68000, then just short it without hesitation! Go all in!
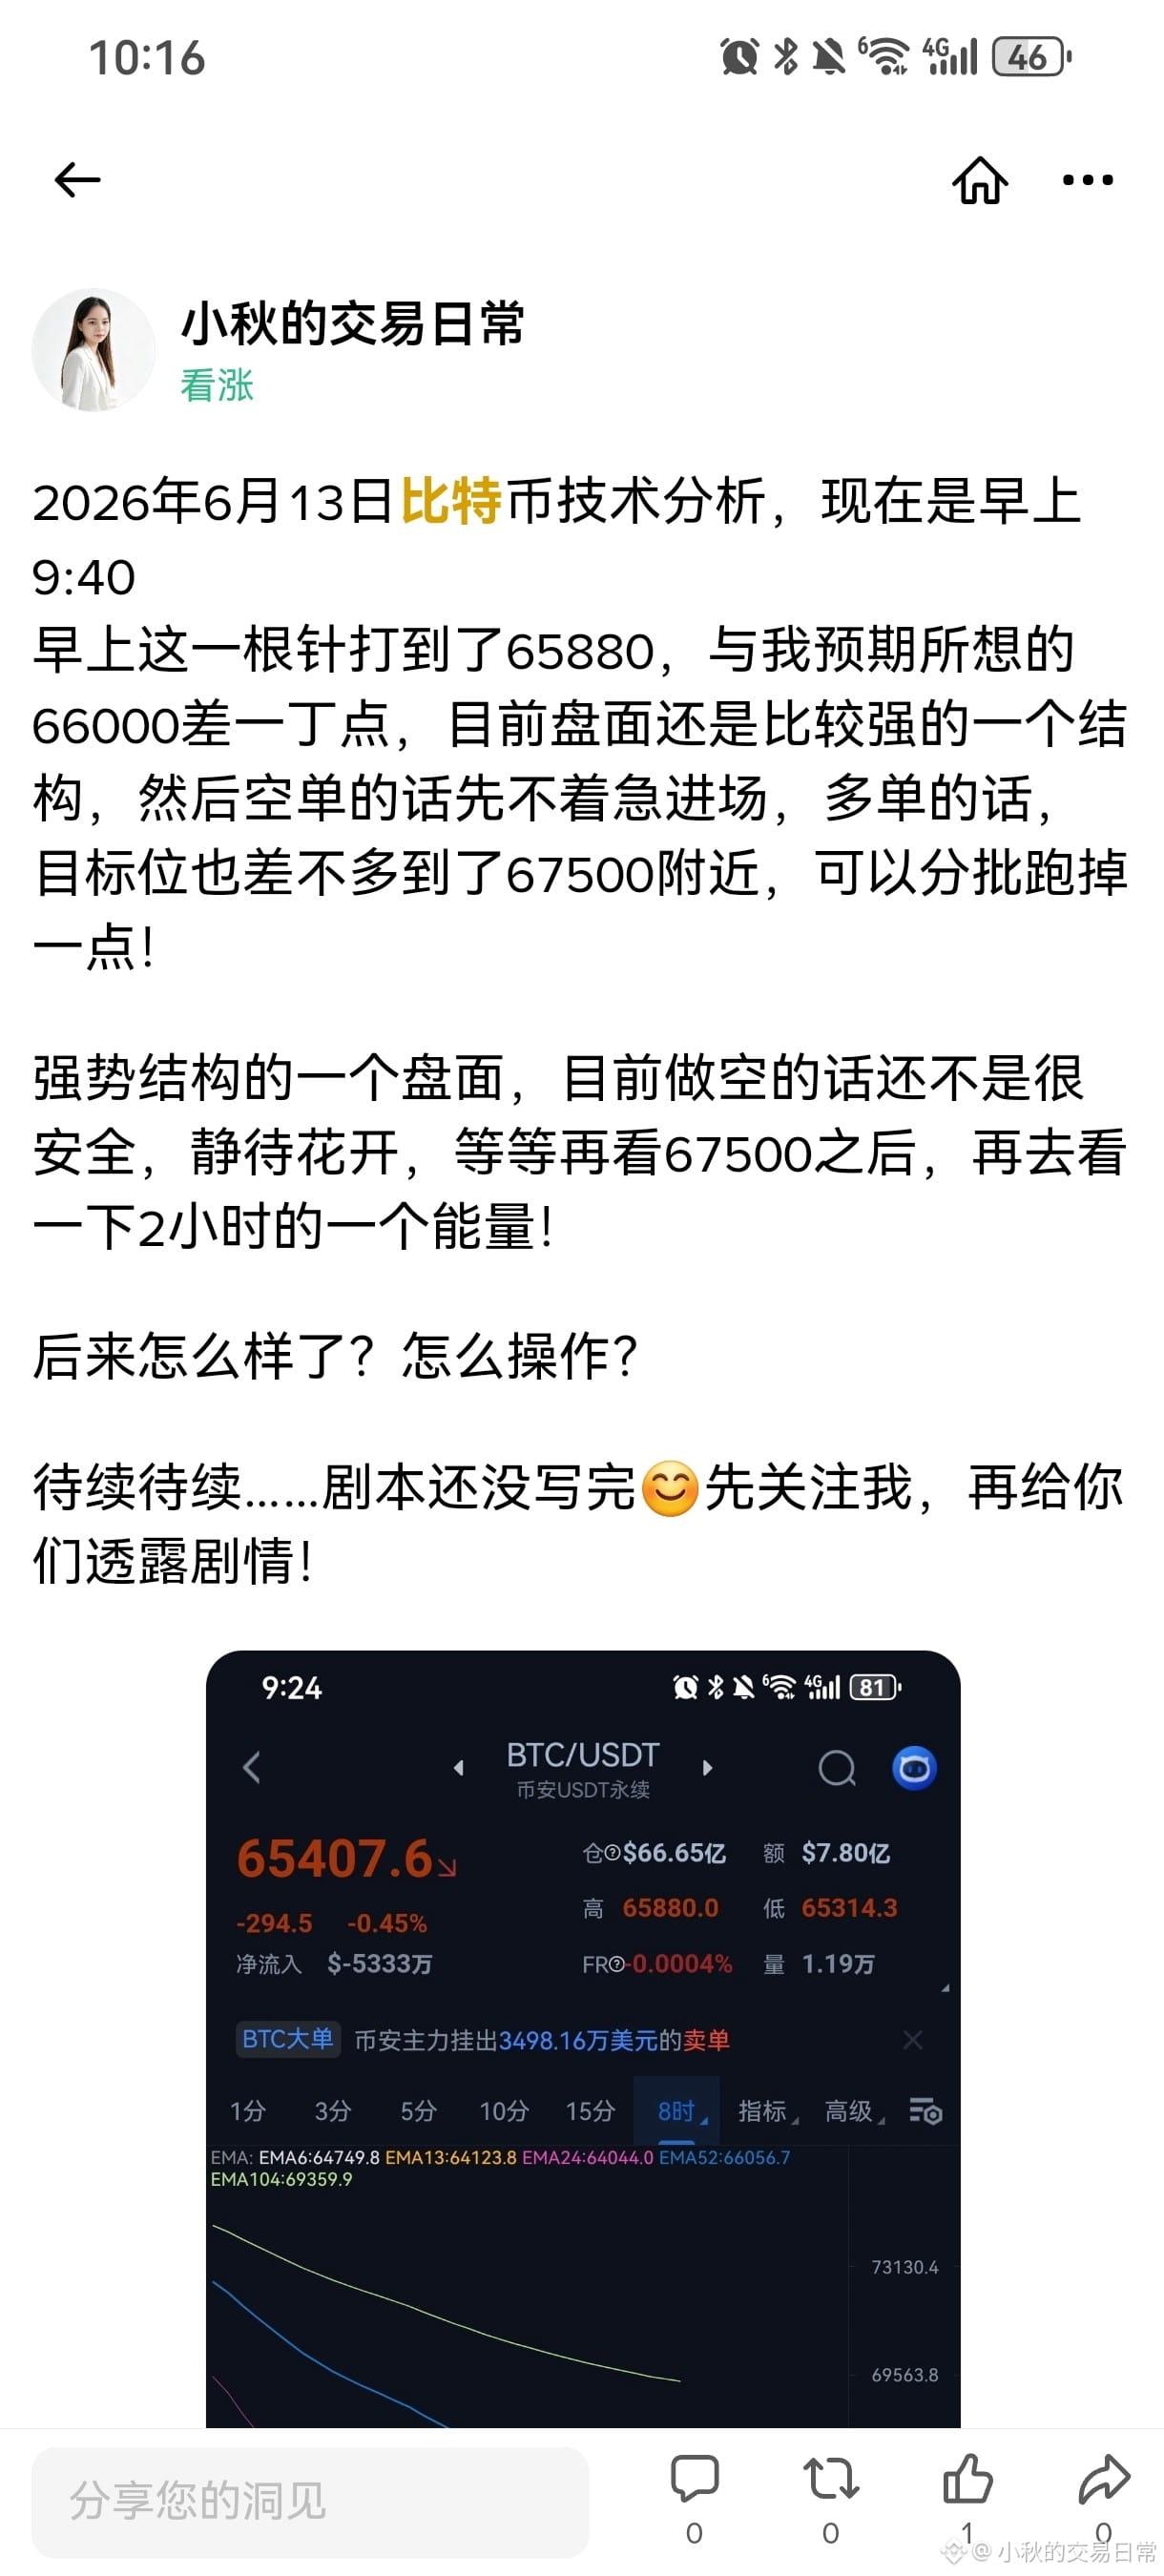
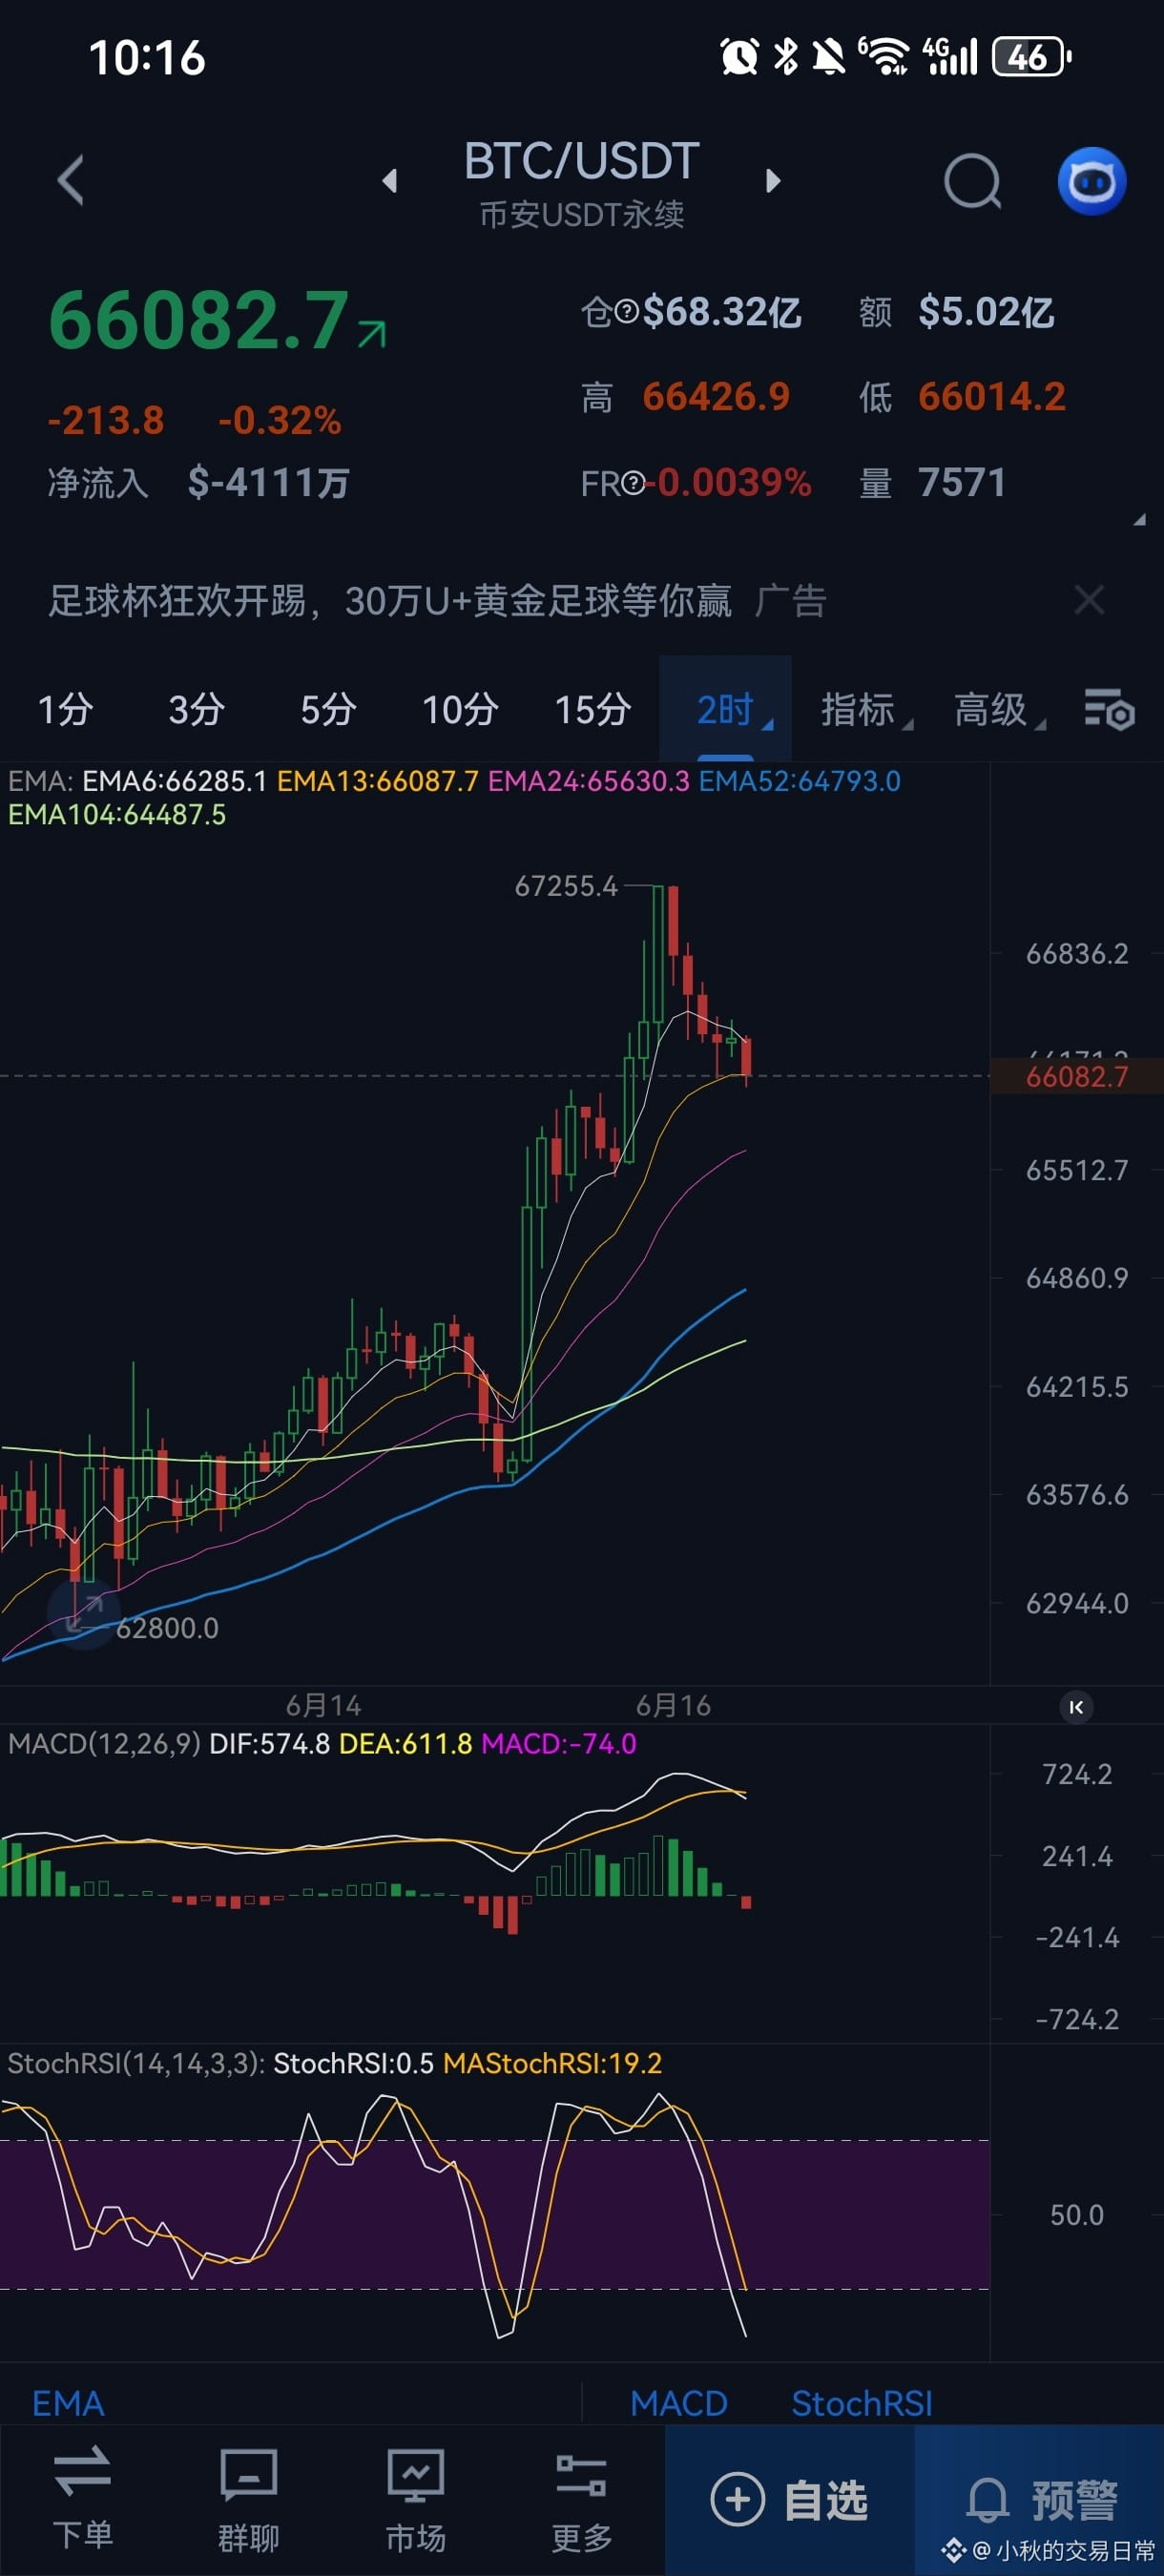
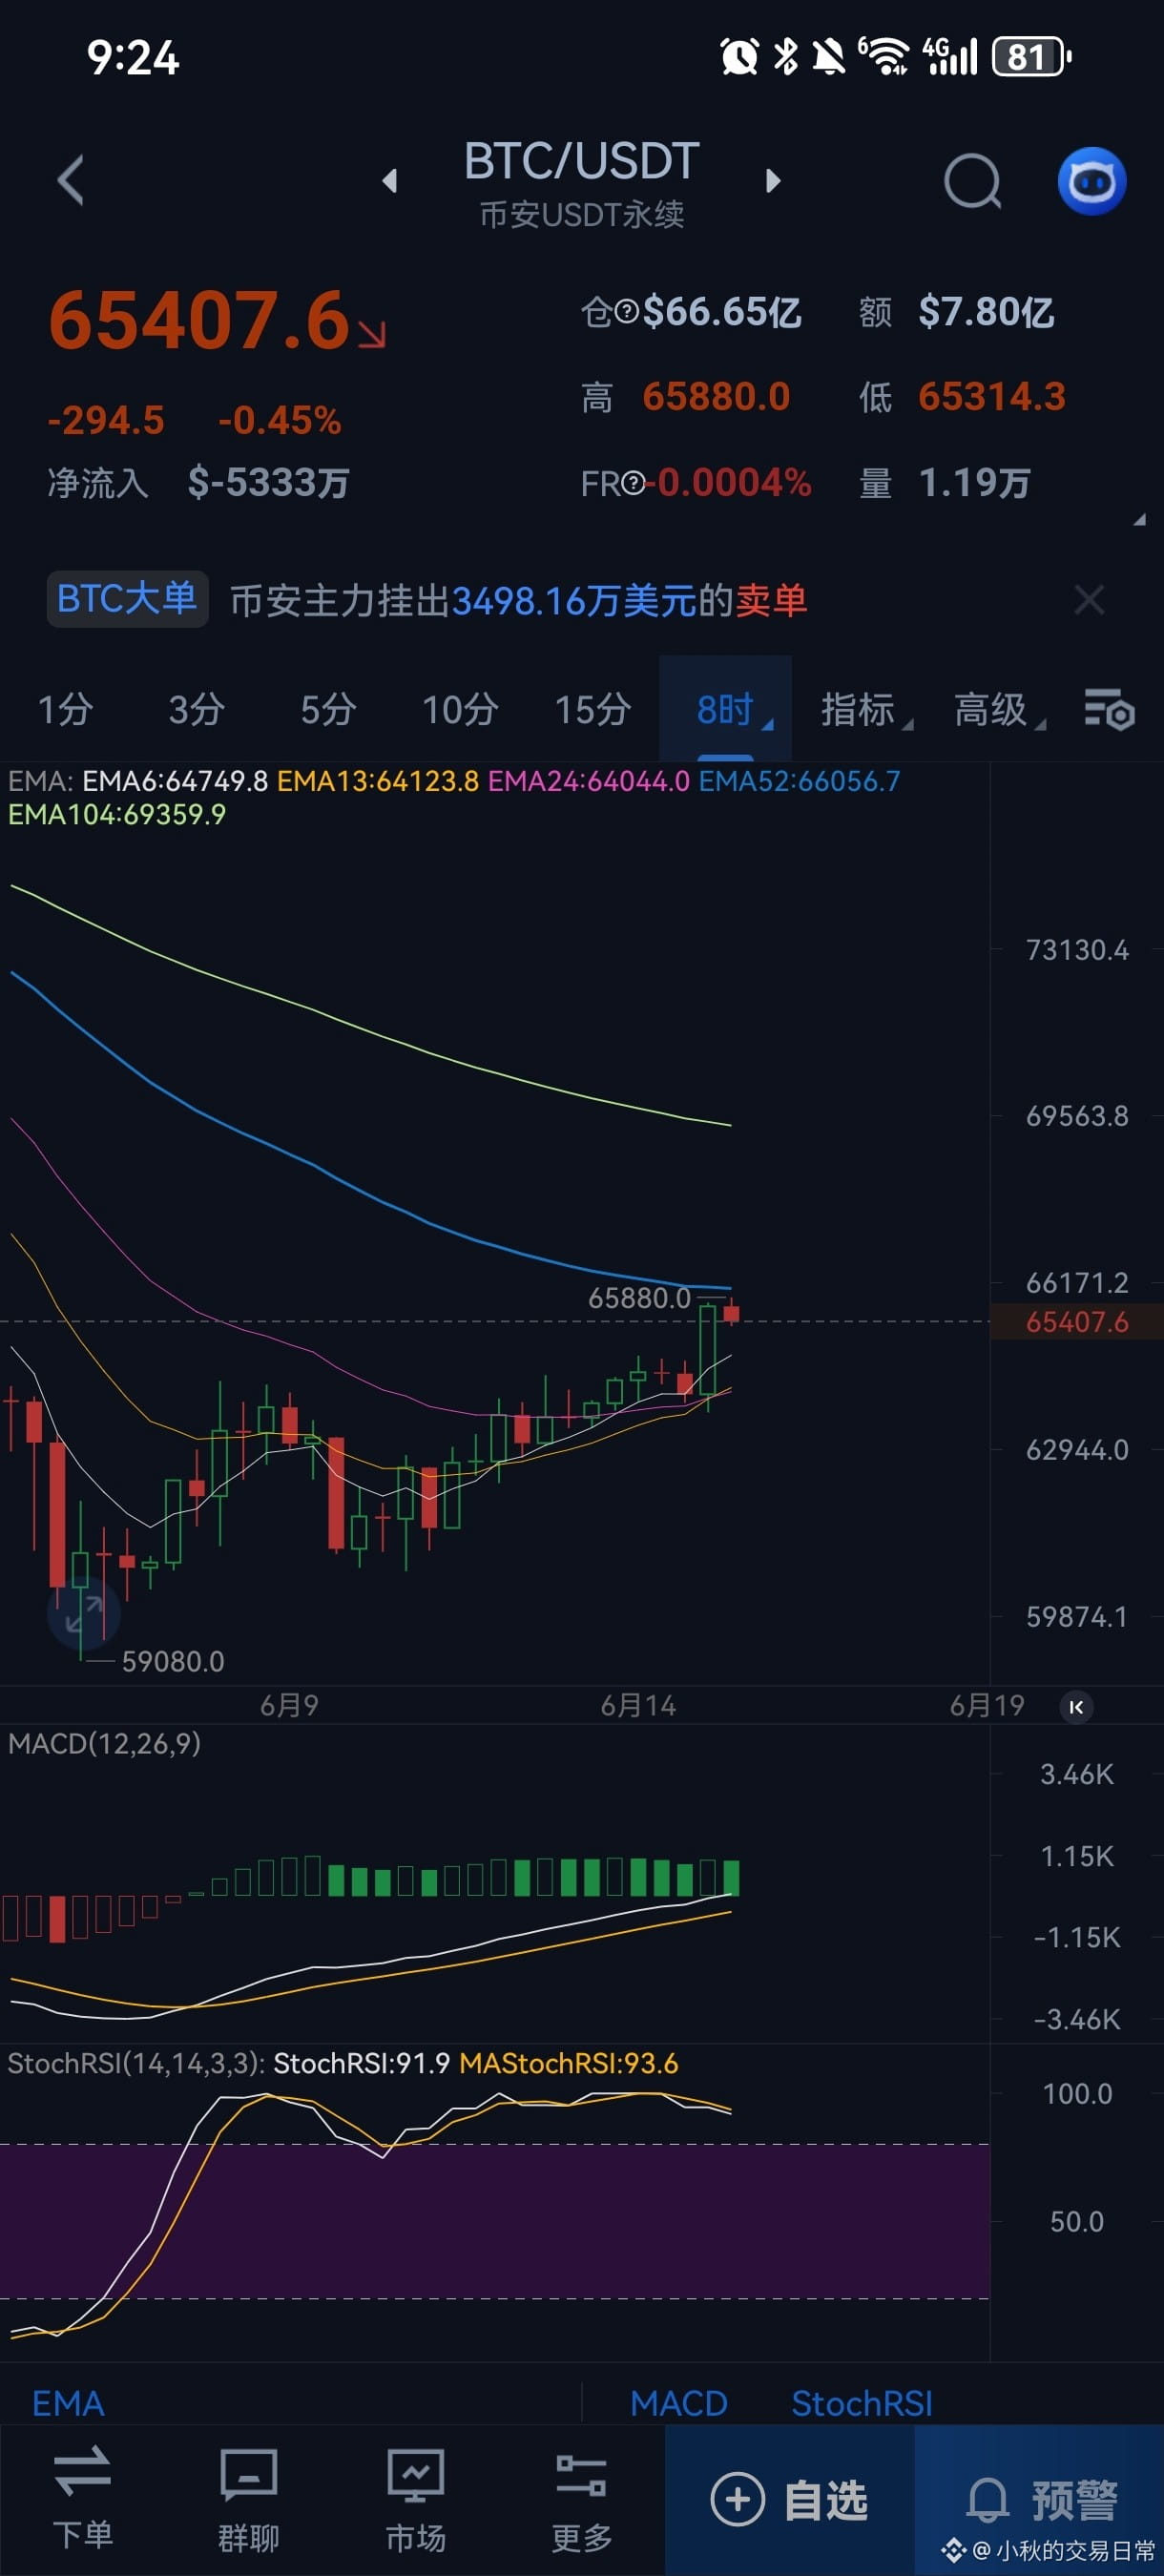
June 13, 2026 Bitcoin Technical Analysis, it's currently 9:40 AM
This morning, the spike hit 65880, just a hair short of my target of 66000. The market's still holding a pretty strong structure. For shorts, I wouldn't rush to enter just yet. As for longs, the target is around 67500, so we could consider taking some profits in batches!
With this strong structure, going short isn't quite safe yet. Let’s wait for the dust to settle and see what happens after 67500, then we can check the 2-hour volume!
So, what happened next? How to play it?
To be continued, to be continued... the script isn't finished yet 😊 Keep an eye on me, and I'll reveal the plot!
This morning, the spike hit 65880, just a hair short of my target of 66000. The market's still holding a pretty strong structure. For shorts, I wouldn't rush to enter just yet. As for longs, the target is around 67500, so we could consider taking some profits in batches!
With this strong structure, going short isn't quite safe yet. Let’s wait for the dust to settle and see what happens after 67500, then we can check the 2-hour volume!
So, what happened next? How to play it?
To be continued, to be continued... the script isn't finished yet 😊 Keep an eye on me, and I'll reveal the plot!
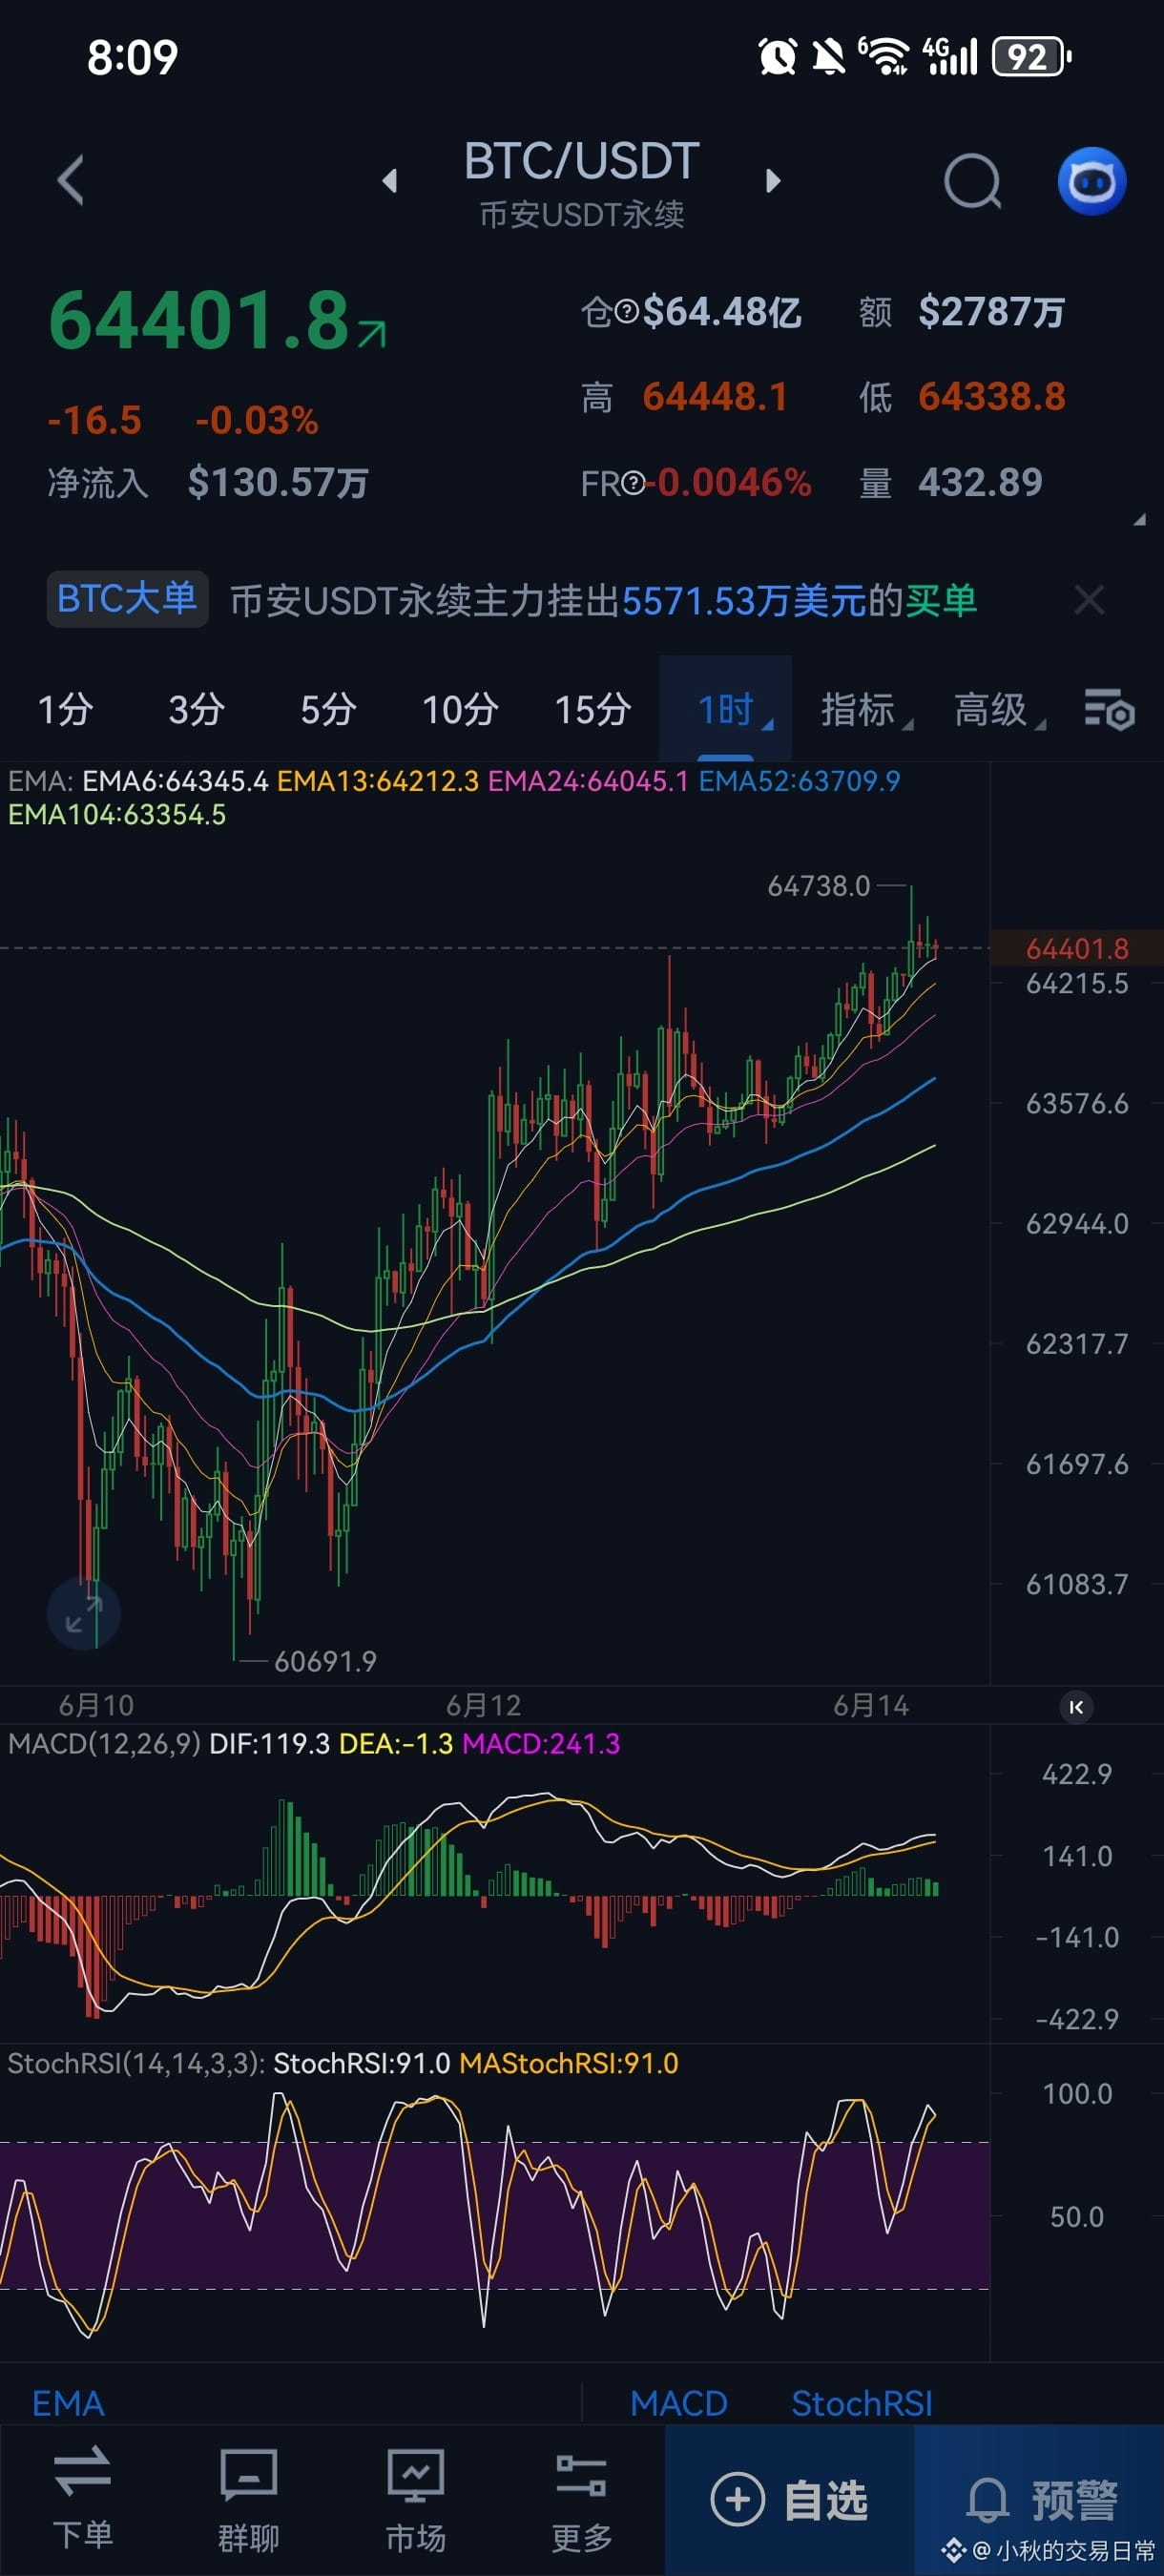
June 14, 2026 Bitcoin Technical Analysis, 8:10 AM, current price is 64380. A couple of days ago, when we were talking about 60600, I jumped in on a long position and have been holding strong. Right now, the 1-hour chart is showing some action, still pushing upward, and it’s not over yet. So for those holding long positions, keep riding that wave.
Now, looking at resistance levels, first up is the minor resistance at 65000. Can we break through that today? The second resistance is at 66500, which is a heavier resistance level. Since the 11th, we've been moving a bit sluggish, but we’re on an upward slope, slowly climbing! Patience is key for holding.Long positions, keep that in mind. For short positions, let's wait a couple more days to see if we can breach that resistance level, and then check if there are any short signals on the 1-hour chart!
Alright, crew, keep the rhythm and eat that steak!🥩
Now, looking at resistance levels, first up is the minor resistance at 65000. Can we break through that today? The second resistance is at 66500, which is a heavier resistance level. Since the 11th, we've been moving a bit sluggish, but we’re on an upward slope, slowly climbing! Patience is key for holding.Long positions, keep that in mind. For short positions, let's wait a couple more days to see if we can breach that resistance level, and then check if there are any short signals on the 1-hour chart!
Alright, crew, keep the rhythm and eat that steak!🥩
Log in to explore more content