
simon78oh
20 Posts

simon78oh
Report
Block User
Open Trade
Occasional Trader
2.1 Years
4 Following
14 Followers
30 Liked
Posts
Portfolio
·
--
Ethereum (ETH) is currently trading around $2.4K–$2.5K. Recent market analysis shows ETH consolidating after a strong rally, with $2,350–$2,360 acting as an important downside level. �
Reuters +1
🔹 Key Support: $2,350–$2,400
🔹 Resistance: $2,550–$2,600
🔹 Major Target Area: $3,000–$3,050
If ETH can break and hold above $2,550–$2,600, the next major upside area could be around $3,000–$3,050.
If $2,350 support breaks, the bullish setup could weaken and a deeper pullback may follow.
📌 My view: ETH remains interesting for the medium term, but confirmation above resistance is important before calling a stronger bullish continuation.
⚠️ This is market analysis, not a guarantee or financial advice. Crypto prices are highly volatile.
$ETH
{future}(ETHFIUSDT)
{spot}(ETHUSDT)
#Ethereum #ETHUSDT #crypto #BinanceSquare #TechnicalAnalysis
Ethereum (ETH) is currently trading around $2.4K–$2.5K. Recent market analysis shows ETH consolidating after a strong rally, with $2,350–$2,360 acting as an important downside level. �
Reuters +1
🔹 Key Support: $2,350–$2,400
🔹 Resistance: $2,550–$2,600
🔹 Major Target Area: $3,000–$3,050
If ETH can break and hold above $2,550–$2,600, the next major upside area could be around $3,000–$3,050.
If $2,350 support breaks, the bullish setup could weaken and a deeper pullback may follow.
📌 My view: ETH remains interesting for the medium term, but confirmation above resistance is important before calling a stronger bullish continuation.
⚠️ This is market analysis, not a guarantee or financial advice. Crypto prices are highly volatile.
$ETH
#Ethereum #ETHUSDT #crypto #BinanceSquare #TechnicalAnalysis
Reuters +1
🔹 Key Support: $2,350–$2,400
🔹 Resistance: $2,550–$2,600
🔹 Major Target Area: $3,000–$3,050
If ETH can break and hold above $2,550–$2,600, the next major upside area could be around $3,000–$3,050.
If $2,350 support breaks, the bullish setup could weaken and a deeper pullback may follow.
📌 My view: ETH remains interesting for the medium term, but confirmation above resistance is important before calling a stronger bullish continuation.
⚠️ This is market analysis, not a guarantee or financial advice. Crypto prices are highly volatile.
$ETH
#Ethereum #ETHUSDT #crypto #BinanceSquare #TechnicalAnalysis
70
·
--
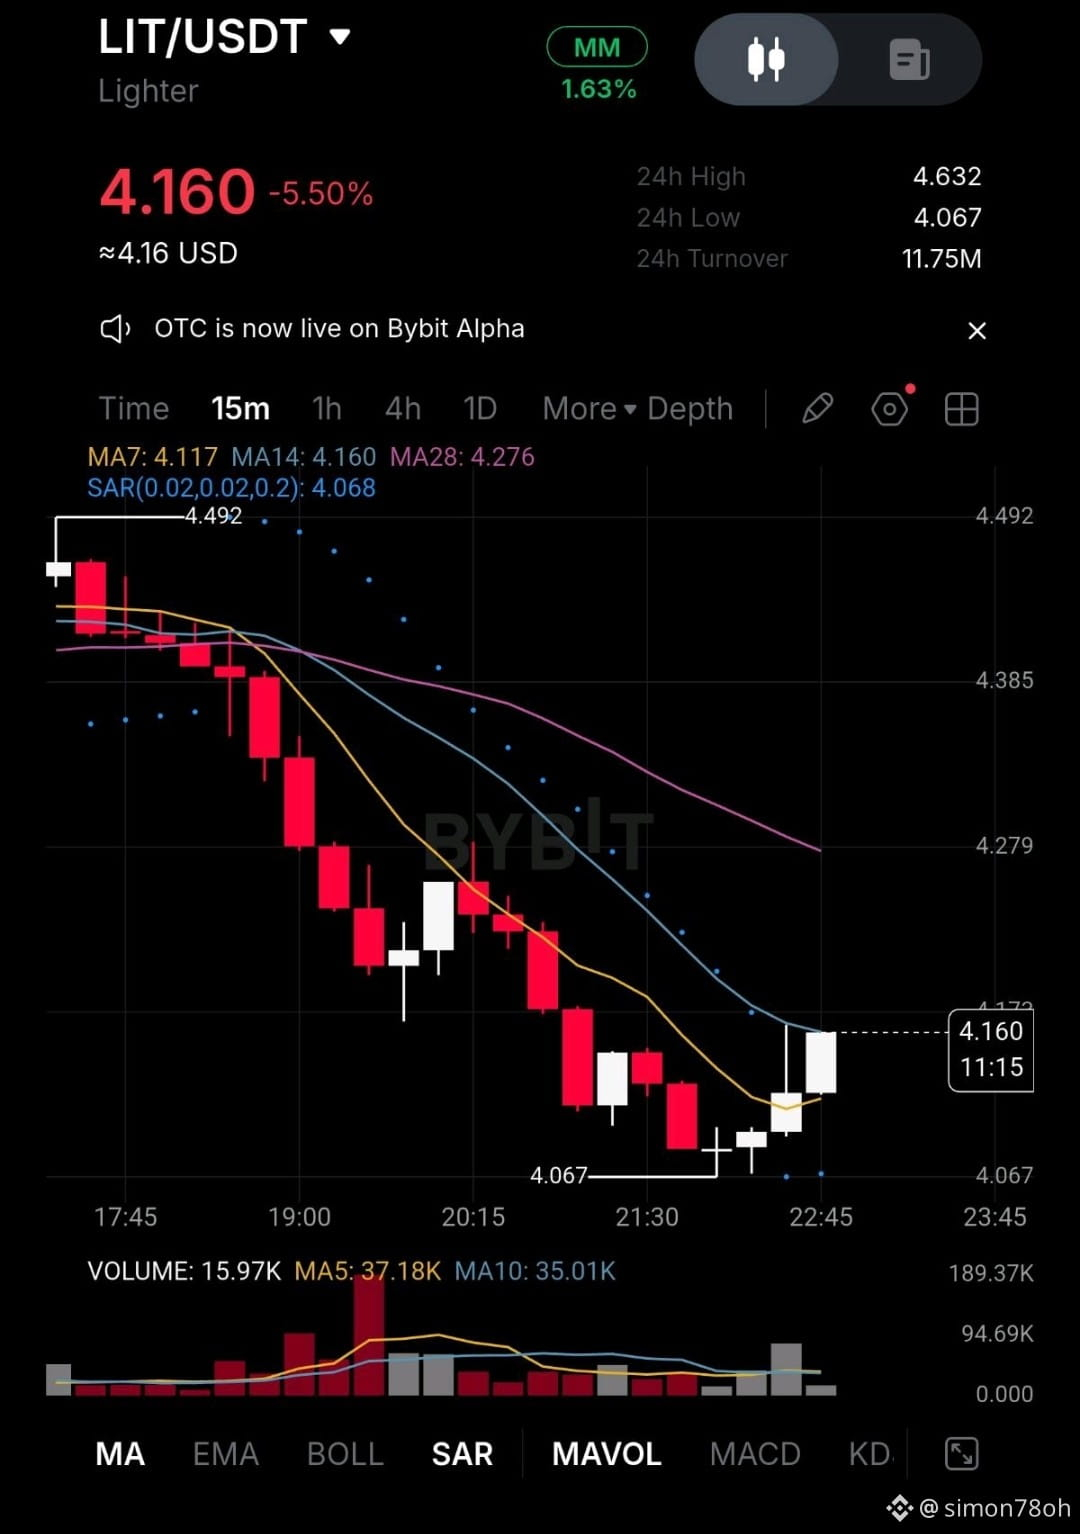
LIT is currently trading around $4.16. On the 15-minute chart, the token has been in a strong downtrend, but a short-term recovery is now visible.
🔹 Support: $4.067–$4.10
🔹 Resistance: $4.16–$4.28
🔹 Major Resistance: $4.38–$4.49
If LIT can break and hold above $4.16, we could see a move toward $4.28 → $4.38.
However, if $4.067 support breaks, further downside pressure could follow.
📌 My view: Short-term recovery is possible, but a clear bullish reversal is not confirmed yet. A sustained breakout above $4.28 would make the bullish setup stronger.
⚠️ This is chart-based analysis, not financial advice. Crypto is highly volatile. Always DYOR.
#Lit
{future}(LITUSDT)
#LIT/USDT #litusdt #crypto #BinanceSquare #TechnicalAnalysis
LIT is currently trading around $4.16. On the 15-minute chart, the token has been in a strong downtrend, but a short-term recovery is now visible.
🔹 Support: $4.067–$4.10
🔹 Resistance: $4.16–$4.28
🔹 Major Resistance: $4.38–$4.49
If LIT can break and hold above $4.16, we could see a move toward $4.28 → $4.38.
However, if $4.067 support breaks, further downside pressure could follow.
📌 My view: Short-term recovery is possible, but a clear bullish reversal is not confirmed yet. A sustained breakout above $4.28 would make the bullish setup stronger.
⚠️ This is chart-based analysis, not financial advice. Crypto is highly volatile. Always DYOR.
#Lit
#LIT/USDT #litusdt #crypto #BinanceSquare #TechnicalAnalysis
🔹 Support: $4.067–$4.10
🔹 Resistance: $4.16–$4.28
🔹 Major Resistance: $4.38–$4.49
If LIT can break and hold above $4.16, we could see a move toward $4.28 → $4.38.
However, if $4.067 support breaks, further downside pressure could follow.
📌 My view: Short-term recovery is possible, but a clear bullish reversal is not confirmed yet. A sustained breakout above $4.28 would make the bullish setup stronger.
⚠️ This is chart-based analysis, not financial advice. Crypto is highly volatile. Always DYOR.
#Lit
#LIT/USDT #litusdt #crypto #BinanceSquare #TechnicalAnalysis
1
96
·
--
#USCryptoReserve
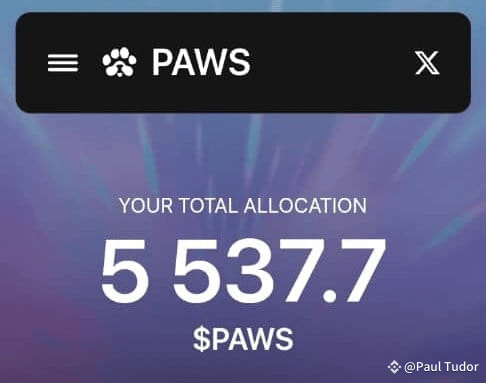
1 $PAWS = Nothing Without Binance…🐾
But With Binance! 🔜
P.s ~ Tomorrow, the truth will be revealed to everyone! 🔝
Hint ~ 🤝
#USCryptoReserve
1 $PAWS = Nothing Without Binance…🐾
But With Binance! 🔜
P.s ~ Tomorrow, the truth will be revealed to everyone! 🔝
Hint ~ 🤝
1 $PAWS = Nothing Without Binance…🐾
But With Binance! 🔜
P.s ~ Tomorrow, the truth will be revealed to everyone! 🔝
Hint ~ 🤝

322
·
--
#TrumpCongressSpeech Guess the $PAWS Listing Price! 🚨 The closest guess will win $500! a huge Airdrop! 🎉
Options:
🔹 $0.05
🔹 $0.07
🔹 $0.09
🔹 $0.1
🔹 $0.3
🔷 $0.5
🔷 $0.9
🔷 $1
#TrumpCongressSpeech Guess the $PAWS Listing Price! 🚨 The closest guess will win $500! a huge Airdrop! 🎉
Options:
🔹 $0.05
🔹 $0.07
🔹 $0.09
🔹 $0.1
🔹 $0.3
🔷 $0.5
🔷 $0.9
🔷 $1
Options:
🔹 $0.05
🔹 $0.07
🔹 $0.09
🔹 $0.1
🔹 $0.3
🔷 $0.5
🔷 $0.9
🔷 $1
55
40
23
8.3k
·
--
Bullish
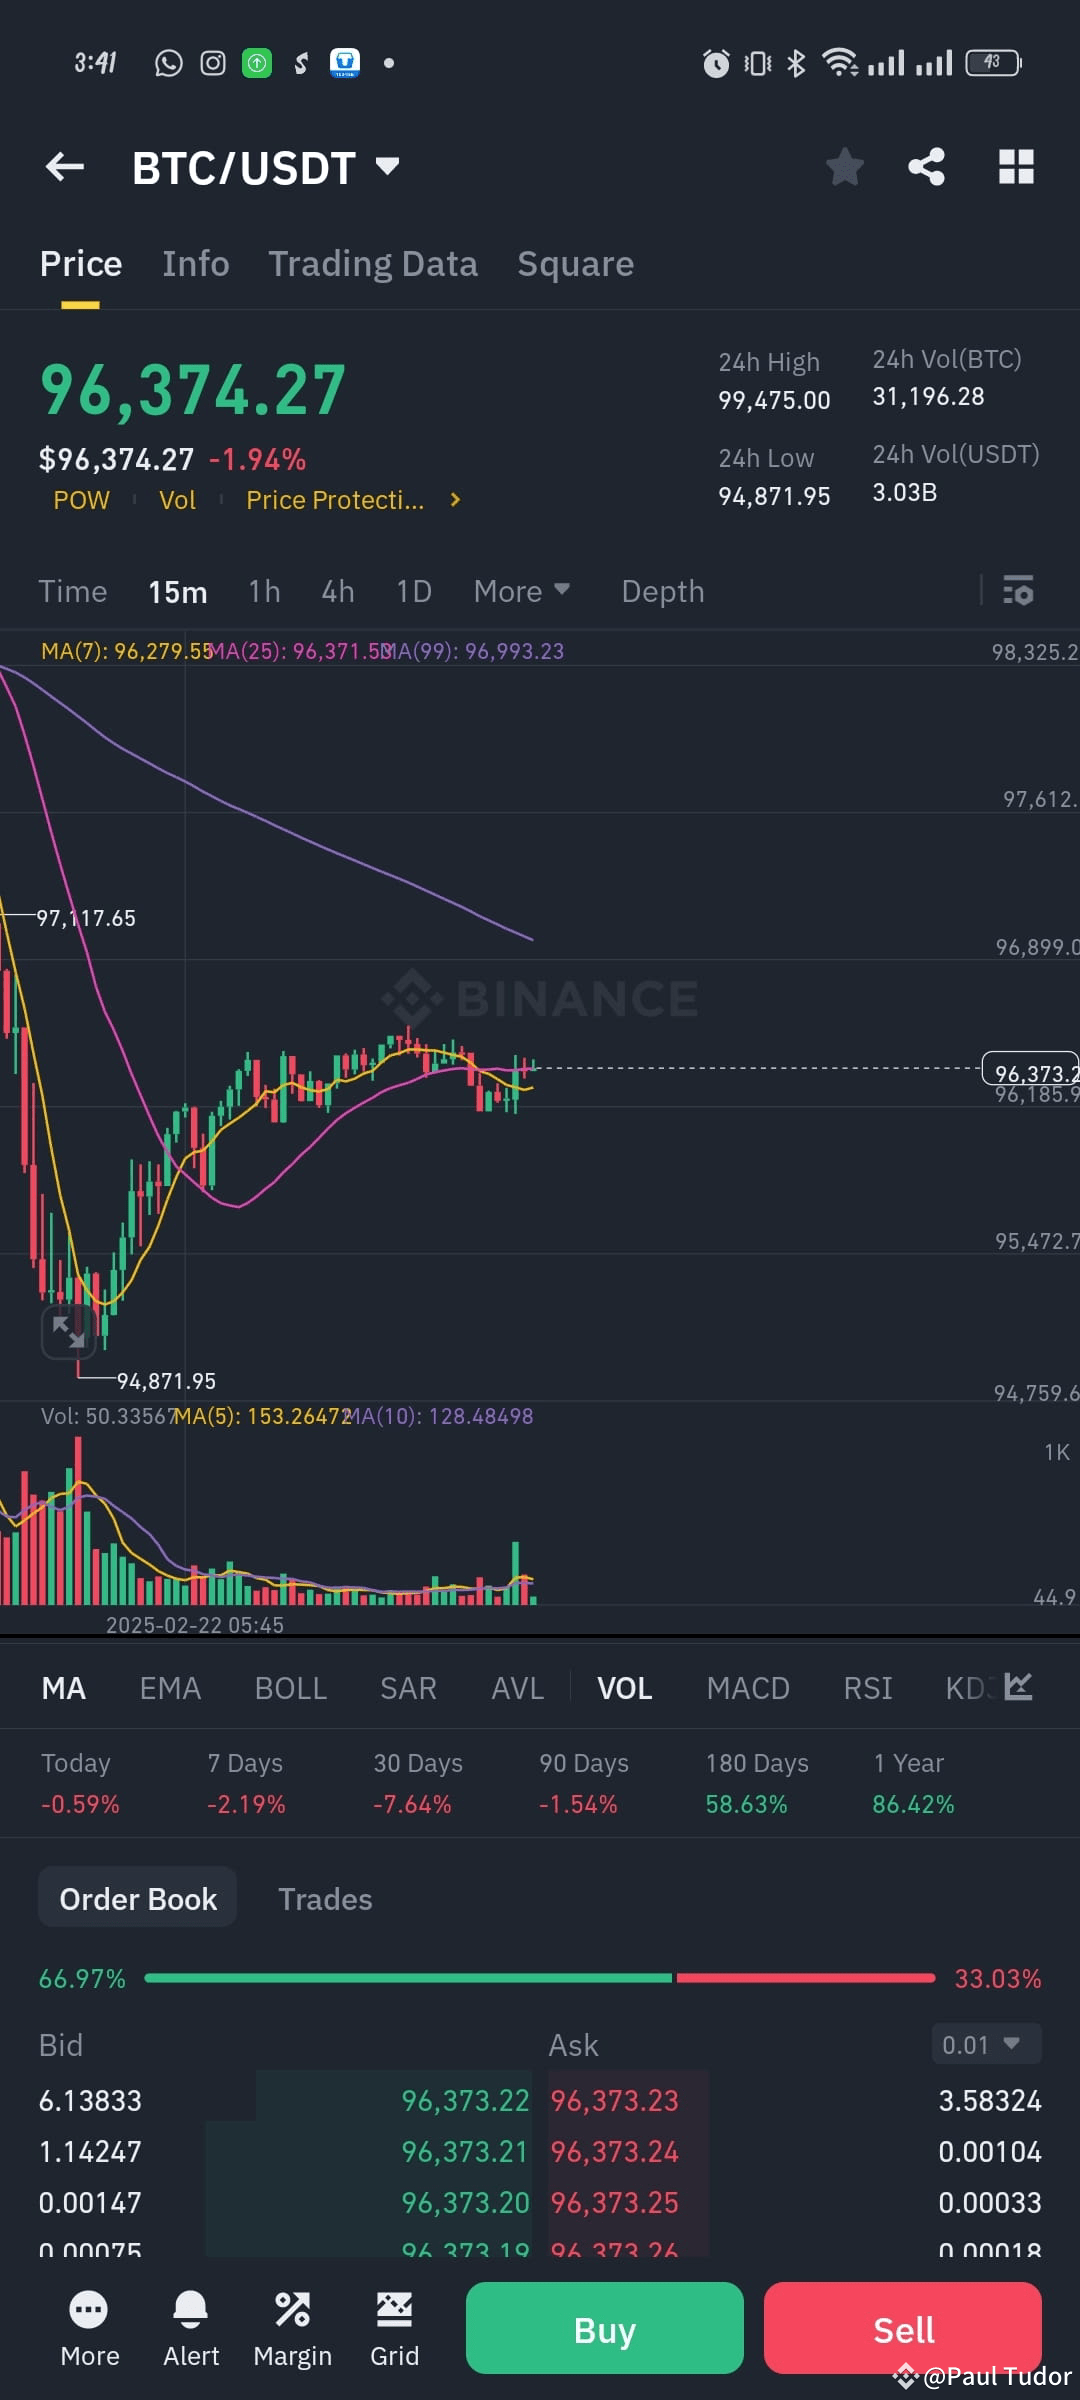
After the rally we had after 6 months of consolidation, Bitcoin is consolidating again in a rectangle.
I believe 90% bitcoin still will go up and according to this rectangle we might see 168k for it.
#BybitSecurityBreach #LitecoinETF #BTC
$BTC
{spot}(BTCUSDT)
After the rally we had after 6 months of consolidation, Bitcoin is consolidating again in a rectangle.
I believe 90% bitcoin still will go up and according to this rectangle we might see 168k for it.
#BybitSecurityBreach #LitecoinETF #BTC
$BTC
I believe 90% bitcoin still will go up and according to this rectangle we might see 168k for it.
#BybitSecurityBreach #LitecoinETF #BTC
$BTC
7
·
--
$LTC 46% price surge over the past two weeks. This impressive rally is largely attributed to growing optimism surrounding the potential approval of a Litecoin-focused Exchange-Traded Fund () in the United States.
🔻ETF Developments Fueling the Rally
The momentum began when a proposed spot Litecoin ETF appeared on the Depository Trust and Clearing Corporation (DTCC) system under the ticker "LTCC." While this listing does not equate to regulatory approval, it signifies that preparations are underway for potential trading, pending the U.S. Securities and Exchange Commission’s (SEC) decision.
Further bolstering investor sentiment, the SEC has formally acknowledged filings to list both XRP and Litecoin ETFs. This acknowledgment initiates a review process, opening a 21-day public comment period. Such procedural advancements are often viewed as positive indicators of potential approval, adding to the growing anticipation within the market.
🔻Surge in Network Activity
Beyond regulatory developments, Litecoin’s on-chain activity has seen a substantial uptick. Data reveals that daily transaction volumes have reached approximately $9.6 billion over the past week, a significant increase from the $2.8 billion recorded in late August 2024. This 243% surge in transaction volume underscores heightened network utility and user engagement, factors that often correlate with positive price movements.
🔻Market Performance and Future Outlook
As of February 21, 2025, Litecoin is trading at approximately $134.73, reflecting a 5.9% increase from the previous close. The intraday high reached $138.76, with a low of $126.46, indicating robust trading activity and investor interest.
Litecoin’s recent price surge is a testament to the dynamic interplay between regulatory developments and intrinsic network growth. The coming weeks will be pivotal in determining whether this momentum can be sustained, particularly in light of impending regulatory decisions.
$LTC 46% price surge over the past two weeks. This impressive rally is largely attributed to growing optimism surrounding the potential approval of a Litecoin-focused Exchange-Traded Fund () in the United States.
🔻ETF Developments Fueling the Rally
The momentum began when a proposed spot Litecoin ETF appeared on the Depository Trust and Clearing Corporation (DTCC) system under the ticker "LTCC." While this listing does not equate to regulatory approval, it signifies that preparations are underway for potential trading, pending the U.S. Securities and Exchange Commission’s (SEC) decision.
Further bolstering investor sentiment, the SEC has formally acknowledged filings to list both XRP and Litecoin ETFs. This acknowledgment initiates a review process, opening a 21-day public comment period. Such procedural advancements are often viewed as positive indicators of potential approval, adding to the growing anticipation within the market.
🔻Surge in Network Activity
Beyond regulatory developments, Litecoin’s on-chain activity has seen a substantial uptick. Data reveals that daily transaction volumes have reached approximately $9.6 billion over the past week, a significant increase from the $2.8 billion recorded in late August 2024. This 243% surge in transaction volume underscores heightened network utility and user engagement, factors that often correlate with positive price movements.
🔻Market Performance and Future Outlook
As of February 21, 2025, Litecoin is trading at approximately $134.73, reflecting a 5.9% increase from the previous close. The intraday high reached $138.76, with a low of $126.46, indicating robust trading activity and investor interest.
Litecoin’s recent price surge is a testament to the dynamic interplay between regulatory developments and intrinsic network growth. The coming weeks will be pivotal in determining whether this momentum can be sustained, particularly in light of impending regulatory decisions.
🔻ETF Developments Fueling the Rally
The momentum began when a proposed spot Litecoin ETF appeared on the Depository Trust and Clearing Corporation (DTCC) system under the ticker "LTCC." While this listing does not equate to regulatory approval, it signifies that preparations are underway for potential trading, pending the U.S. Securities and Exchange Commission’s (SEC) decision.
Further bolstering investor sentiment, the SEC has formally acknowledged filings to list both XRP and Litecoin ETFs. This acknowledgment initiates a review process, opening a 21-day public comment period. Such procedural advancements are often viewed as positive indicators of potential approval, adding to the growing anticipation within the market.
🔻Surge in Network Activity
Beyond regulatory developments, Litecoin’s on-chain activity has seen a substantial uptick. Data reveals that daily transaction volumes have reached approximately $9.6 billion over the past week, a significant increase from the $2.8 billion recorded in late August 2024. This 243% surge in transaction volume underscores heightened network utility and user engagement, factors that often correlate with positive price movements.
🔻Market Performance and Future Outlook
As of February 21, 2025, Litecoin is trading at approximately $134.73, reflecting a 5.9% increase from the previous close. The intraday high reached $138.76, with a low of $126.46, indicating robust trading activity and investor interest.
Litecoin’s recent price surge is a testament to the dynamic interplay between regulatory developments and intrinsic network growth. The coming weeks will be pivotal in determining whether this momentum can be sustained, particularly in light of impending regulatory decisions.
5
·
--
#LitecoinETF
46% price surge over the past two weeks. This impressive rally is largely attributed to growing optimism surrounding the potential approval of a Litecoin-focused Exchange-Traded Fund () in the United States.
🔻ETF Developments Fueling the Rally
The momentum began when a proposed spot Litecoin ETF appeared on the Depository Trust and Clearing Corporation (DTCC) system under the ticker "LTCC." While this listing does not equate to regulatory approval, it signifies that preparations are underway for potential trading, pending the U.S. Securities and Exchange Commission’s (SEC) decision.
Further bolstering investor sentiment, the SEC has formally acknowledged filings to list both XRP and Litecoin ETFs. This acknowledgment initiates a review process, opening a 21-day public comment period. Such procedural advancements are often viewed as positive indicators of potential approval, adding to the growing anticipation within the market.
🔻Surge in Network Activity
Beyond regulatory developments, Litecoin’s on-chain activity has seen a substantial uptick. Data reveals that daily transaction volumes have reached approximately $9.6 billion over the past week, a significant increase from the $2.8 billion recorded in late August 2024. This 243% surge in transaction volume underscores heightened network utility and user engagement, factors that often correlate with positive price movements.
🔻Market Performance and Future Outlook
As of February 21, 2025, Litecoin is trading at approximately $134.73, reflecting a 5.9% increase from the previous close. The intraday high reached $138.76, with a low of $126.46, indicating robust trading activity and investor interest.
Litecoin’s recent price surge is a testament to the dynamic interplay between regulatory developments and intrinsic network growth. The coming weeks will be pivotal in determining whether this momentum can be sustained, particularly in light of impending regulatory decisions.
$LTC
{spot}(LTCUSDT)
#
#LitecoinETF
46% price surge over the past two weeks. This impressive rally is largely attributed to growing optimism surrounding the potential approval of a Litecoin-focused Exchange-Traded Fund () in the United States.
🔻ETF Developments Fueling the Rally
The momentum began when a proposed spot Litecoin ETF appeared on the Depository Trust and Clearing Corporation (DTCC) system under the ticker "LTCC." While this listing does not equate to regulatory approval, it signifies that preparations are underway for potential trading, pending the U.S. Securities and Exchange Commission’s (SEC) decision.
Further bolstering investor sentiment, the SEC has formally acknowledged filings to list both XRP and Litecoin ETFs. This acknowledgment initiates a review process, opening a 21-day public comment period. Such procedural advancements are often viewed as positive indicators of potential approval, adding to the growing anticipation within the market.
🔻Surge in Network Activity
Beyond regulatory developments, Litecoin’s on-chain activity has seen a substantial uptick. Data reveals that daily transaction volumes have reached approximately $9.6 billion over the past week, a significant increase from the $2.8 billion recorded in late August 2024. This 243% surge in transaction volume underscores heightened network utility and user engagement, factors that often correlate with positive price movements.
🔻Market Performance and Future Outlook
As of February 21, 2025, Litecoin is trading at approximately $134.73, reflecting a 5.9% increase from the previous close. The intraday high reached $138.76, with a low of $126.46, indicating robust trading activity and investor interest.
Litecoin’s recent price surge is a testament to the dynamic interplay between regulatory developments and intrinsic network growth. The coming weeks will be pivotal in determining whether this momentum can be sustained, particularly in light of impending regulatory decisions.
$LTC
#
46% price surge over the past two weeks. This impressive rally is largely attributed to growing optimism surrounding the potential approval of a Litecoin-focused Exchange-Traded Fund () in the United States.
🔻ETF Developments Fueling the Rally
The momentum began when a proposed spot Litecoin ETF appeared on the Depository Trust and Clearing Corporation (DTCC) system under the ticker "LTCC." While this listing does not equate to regulatory approval, it signifies that preparations are underway for potential trading, pending the U.S. Securities and Exchange Commission’s (SEC) decision.
Further bolstering investor sentiment, the SEC has formally acknowledged filings to list both XRP and Litecoin ETFs. This acknowledgment initiates a review process, opening a 21-day public comment period. Such procedural advancements are often viewed as positive indicators of potential approval, adding to the growing anticipation within the market.
🔻Surge in Network Activity
Beyond regulatory developments, Litecoin’s on-chain activity has seen a substantial uptick. Data reveals that daily transaction volumes have reached approximately $9.6 billion over the past week, a significant increase from the $2.8 billion recorded in late August 2024. This 243% surge in transaction volume underscores heightened network utility and user engagement, factors that often correlate with positive price movements.
🔻Market Performance and Future Outlook
As of February 21, 2025, Litecoin is trading at approximately $134.73, reflecting a 5.9% increase from the previous close. The intraday high reached $138.76, with a low of $126.46, indicating robust trading activity and investor interest.
Litecoin’s recent price surge is a testament to the dynamic interplay between regulatory developments and intrinsic network growth. The coming weeks will be pivotal in determining whether this momentum can be sustained, particularly in light of impending regulatory decisions.
$LTC
#
589
·
--
Bullish
#XVG/USDT ANALYSIS
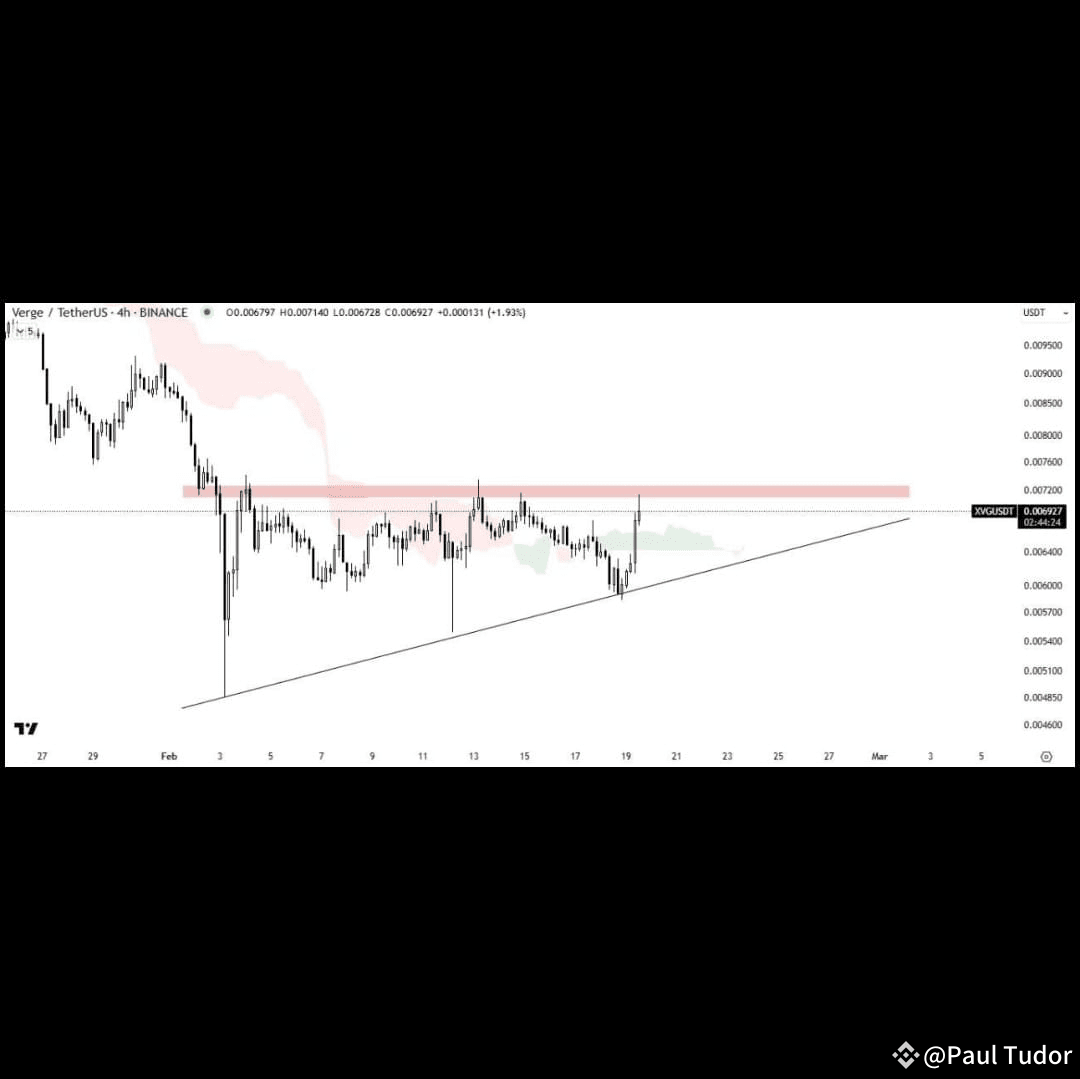
$XVG is trading within an ascending triangle pattern and is currently facing rejection at the horizontal supply zone.
The Ichimoku Cloud is providing strong support, indicating bullish strength. A decisive breakout from the pattern could confirm a bullish trend.
#FTXrepayment #xvg #BTC #CardanoETFTalk
$BTC
{spot}(BTCUSDT)
$XVG
{spot}(XVGUSDT)
#XVG/USDT ANALYSIS
$XVG is trading within an ascending triangle pattern and is currently facing rejection at the horizontal supply zone.
The Ichimoku Cloud is providing strong support, indicating bullish strength. A decisive breakout from the pattern could confirm a bullish trend.
#FTXrepayment #xvg #BTC #CardanoETFTalk
$BTC
$XVG
$XVG is trading within an ascending triangle pattern and is currently facing rejection at the horizontal supply zone.
The Ichimoku Cloud is providing strong support, indicating bullish strength. A decisive breakout from the pattern could confirm a bullish trend.
#FTXrepayment #xvg #BTC #CardanoETFTalk
$BTC
$XVG
13
·
--
4
·
--
Bullish
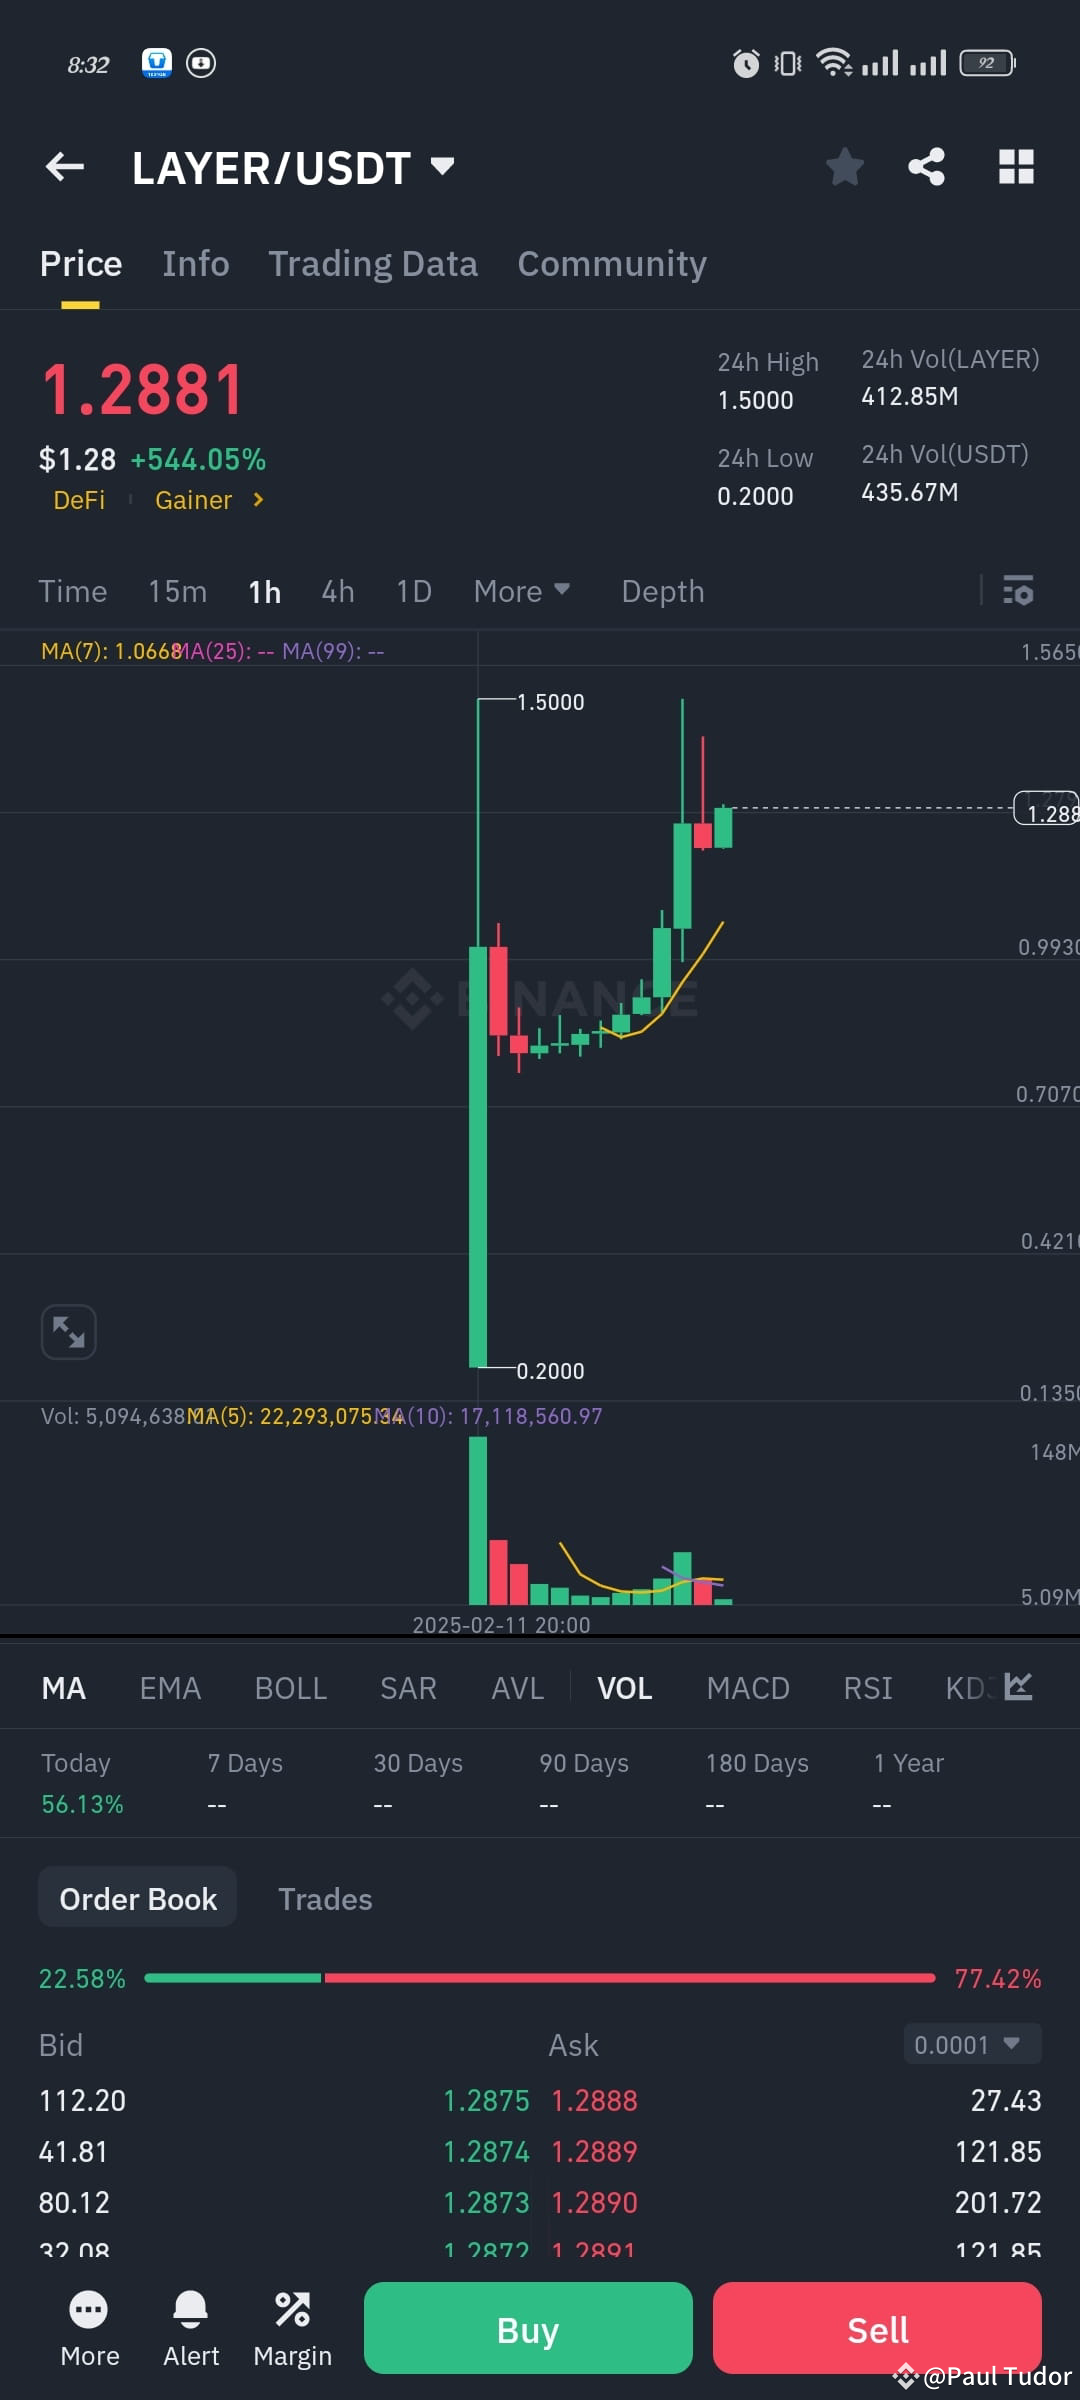
#layer token buy and hold.
Binance, a leading cryptocurrency exchange, has officially listed Solayer’s native token, $LAYER, enhancing its accessibility to a global audience. Deposits for $LAYER became available in January 2025, with trading commencing shortly thereafter. 
In addition to the exchange listing, Binance Wallet has integrated support for the Layer Genesis Drop. Eligible users who staked $SOL and accumulated points can verify their airdrop eligibility within the wallet’s Discover page. Starting February 11, 2025, users can claim their Layer tokens directly through Binance and engage in immediate trading, leveraging real-time K-line charts for informed decision-making. 
Solayer is a blockchain platform designed to tackle scalability challenges through advanced hardware acceleration. Its InfiniSVM architecture enables high-throughput and near-zero latency, processing over 1,000,000 transactions per second with network bandwidth exceeding 100 Gbps. This design scales the Solana Virtual Machine (SVM) to support next-generation decentralized applications (dApps) while maintaining strong security. Through its innovative restaking feature, users can leverage their staked assets as collateral, optimizing asset use and enhancing Solana network security while offering greater reward opportunities. 
#USJobsDrop #BinanceAlphaAlert #1000CHEEMS&TSTOnBinance #layer
$LAYER
{spot}(LAYERUSDT)
#layer token buy and hold.
Binance, a leading cryptocurrency exchange, has officially listed Solayer’s native token, $LAYER , enhancing its accessibility to a global audience. Deposits for $LAYER became available in January 2025, with trading commencing shortly thereafter. 
In addition to the exchange listing, Binance Wallet has integrated support for the Layer Genesis Drop. Eligible users who staked $SOL and accumulated points can verify their airdrop eligibility within the wallet’s Discover page. Starting February 11, 2025, users can claim their Layer tokens directly through Binance and engage in immediate trading, leveraging real-time K-line charts for informed decision-making. 
Solayer is a blockchain platform designed to tackle scalability challenges through advanced hardware acceleration. Its InfiniSVM architecture enables high-throughput and near-zero latency, processing over 1,000,000 transactions per second with network bandwidth exceeding 100 Gbps. This design scales the Solana Virtual Machine (SVM) to support next-generation decentralized applications (dApps) while maintaining strong security. Through its innovative restaking feature, users can leverage their staked assets as collateral, optimizing asset use and enhancing Solana network security while offering greater reward opportunities. 
#USJobsDrop #BinanceAlphaAlert #1000CHEEMS&TSTOnBinance #layer
$LAYER
Binance, a leading cryptocurrency exchange, has officially listed Solayer’s native token, $LAYER , enhancing its accessibility to a global audience. Deposits for $LAYER became available in January 2025, with trading commencing shortly thereafter. 
In addition to the exchange listing, Binance Wallet has integrated support for the Layer Genesis Drop. Eligible users who staked $SOL and accumulated points can verify their airdrop eligibility within the wallet’s Discover page. Starting February 11, 2025, users can claim their Layer tokens directly through Binance and engage in immediate trading, leveraging real-time K-line charts for informed decision-making. 
Solayer is a blockchain platform designed to tackle scalability challenges through advanced hardware acceleration. Its InfiniSVM architecture enables high-throughput and near-zero latency, processing over 1,000,000 transactions per second with network bandwidth exceeding 100 Gbps. This design scales the Solana Virtual Machine (SVM) to support next-generation decentralized applications (dApps) while maintaining strong security. Through its innovative restaking feature, users can leverage their staked assets as collateral, optimizing asset use and enhancing Solana network security while offering greater reward opportunities. 
#USJobsDrop #BinanceAlphaAlert #1000CHEEMS&TSTOnBinance #layer
$LAYER
1.6k
·
--
Bullish
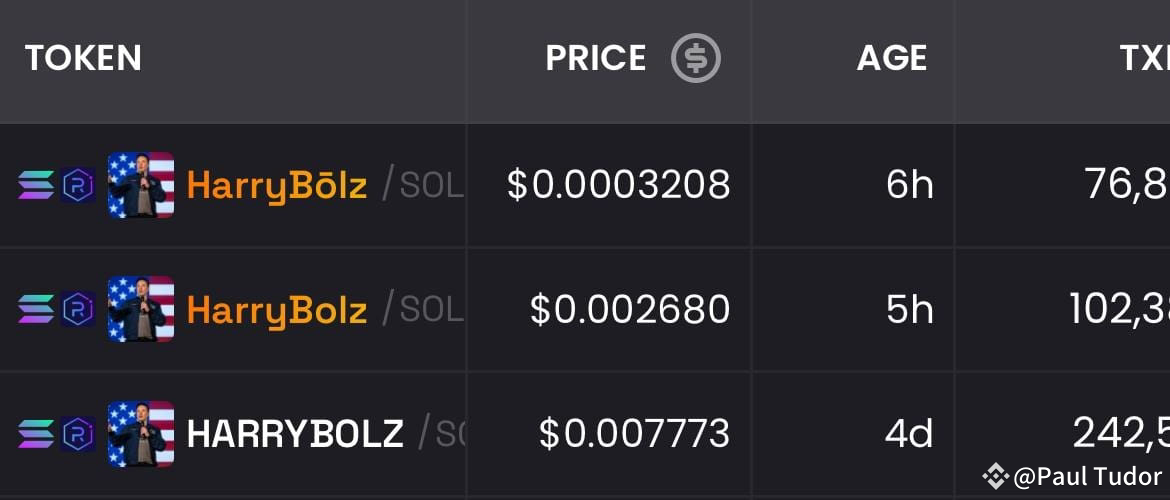
🚨BREAKING : Elon Musk change The name 😂 Meme coin 🚨
#ElonMusk #HarryBolz #USJobsDrop #BinanceAlphaAlert #BTCNextATH?
$SOL
{spot}(SOLUSDT)
🚨BREAKING : Elon Musk change The name 😂 Meme coin 🚨
#ElonMusk #HarryBolz #USJobsDrop #BinanceAlphaAlert #BTCNextATH?
$SOL
#ElonMusk #HarryBolz #USJobsDrop #BinanceAlphaAlert #BTCNextATH?
$SOL
2
1
1
1.9k
·
--
Bullish
Can Pepe Coin Price Hit $0.000017
As 1.8T PEPE Transacts in Loss?
Pepe Coin price shows signs of recovery after a bearish week, raising speculation about a potential move to $0.000017. The market has seen renewed optimism, with Bitcoin (BTC) approaching $100,000. Meanwhile, PEPE is holding above a crucial support level despite 1.8 trillion tokens transacting at a loss, fueling discussions about its next price direction.
Will PEPE Hit $0.000017 as 1.8T Tokens Move at a Loss?
The Pepe Coin price has shown increased volatility as its daily on-chain transaction volume in loss reaches 1.38 trillion PEPE. This figure reflects the total amount of PEPE transacted at a loss within a single day, indicating heightened selling pressure. When large token volumes are moved at a loss, it often signals panic selling or investor capitulation. This trend can contribute to downward price momentum as more holders exit their positions to cut losses.
Pepe Coin Eyes Major Breakout: Key Levels to Watch
The price of Pepe coin is at $0.00001044, reflecting a 9.43% increase within the current trading session. The memecoin has entered a crucial phase, with a significant resistance level at $0.0000117. If PEPE successfully flips this barrier into support, this projects a potential rally of 50%, driving prices toward $0.00001785.
Conversely, if the price fails to sustain current levels and breaks below $0.00000925, downside pressure could intensify. Such a move could result in a 26% drop, dragging Pepe’s value down to $0.00000688. The composite volume profile suggests heavy accumulation within the marked range, further emphasizing the importance of these price levels.
#USJobsDrop #USJobsDrop #BTC #BinanceAlphaAlert #PEPE
$PEPE
{spot}(PEPEUSDT)
Can Pepe Coin Price Hit $0.000017
As 1.8T PEPE Transacts in Loss?
Pepe Coin price shows signs of recovery after a bearish week, raising speculation about a potential move to $0.000017. The market has seen renewed optimism, with Bitcoin (BTC) approaching $100,000. Meanwhile, PEPE is holding above a crucial support level despite 1.8 trillion tokens transacting at a loss, fueling discussions about its next price direction.
Will PEPE Hit $0.000017 as 1.8T Tokens Move at a Loss?
The Pepe Coin price has shown increased volatility as its daily on-chain transaction volume in loss reaches 1.38 trillion PEPE. This figure reflects the total amount of PEPE transacted at a loss within a single day, indicating heightened selling pressure. When large token volumes are moved at a loss, it often signals panic selling or investor capitulation. This trend can contribute to downward price momentum as more holders exit their positions to cut losses.
Pepe Coin Eyes Major Breakout: Key Levels to Watch
The price of Pepe coin is at $0.00001044, reflecting a 9.43% increase within the current trading session. The memecoin has entered a crucial phase, with a significant resistance level at $0.0000117. If PEPE successfully flips this barrier into support, this projects a potential rally of 50%, driving prices toward $0.00001785.
Conversely, if the price fails to sustain current levels and breaks below $0.00000925, downside pressure could intensify. Such a move could result in a 26% drop, dragging Pepe’s value down to $0.00000688. The composite volume profile suggests heavy accumulation within the marked range, further emphasizing the importance of these price levels.
#USJobsDrop #USJobsDrop #BTC #BinanceAlphaAlert #PEPE
$PEPE
As 1.8T PEPE Transacts in Loss?
Pepe Coin price shows signs of recovery after a bearish week, raising speculation about a potential move to $0.000017. The market has seen renewed optimism, with Bitcoin (BTC) approaching $100,000. Meanwhile, PEPE is holding above a crucial support level despite 1.8 trillion tokens transacting at a loss, fueling discussions about its next price direction.
Will PEPE Hit $0.000017 as 1.8T Tokens Move at a Loss?
The Pepe Coin price has shown increased volatility as its daily on-chain transaction volume in loss reaches 1.38 trillion PEPE. This figure reflects the total amount of PEPE transacted at a loss within a single day, indicating heightened selling pressure. When large token volumes are moved at a loss, it often signals panic selling or investor capitulation. This trend can contribute to downward price momentum as more holders exit their positions to cut losses.
Pepe Coin Eyes Major Breakout: Key Levels to Watch
The price of Pepe coin is at $0.00001044, reflecting a 9.43% increase within the current trading session. The memecoin has entered a crucial phase, with a significant resistance level at $0.0000117. If PEPE successfully flips this barrier into support, this projects a potential rally of 50%, driving prices toward $0.00001785.
Conversely, if the price fails to sustain current levels and breaks below $0.00000925, downside pressure could intensify. Such a move could result in a 26% drop, dragging Pepe’s value down to $0.00000688. The composite volume profile suggests heavy accumulation within the marked range, further emphasizing the importance of these price levels.
#USJobsDrop #USJobsDrop #BTC #BinanceAlphaAlert #PEPE
$PEPE

496
·
--
Bullish
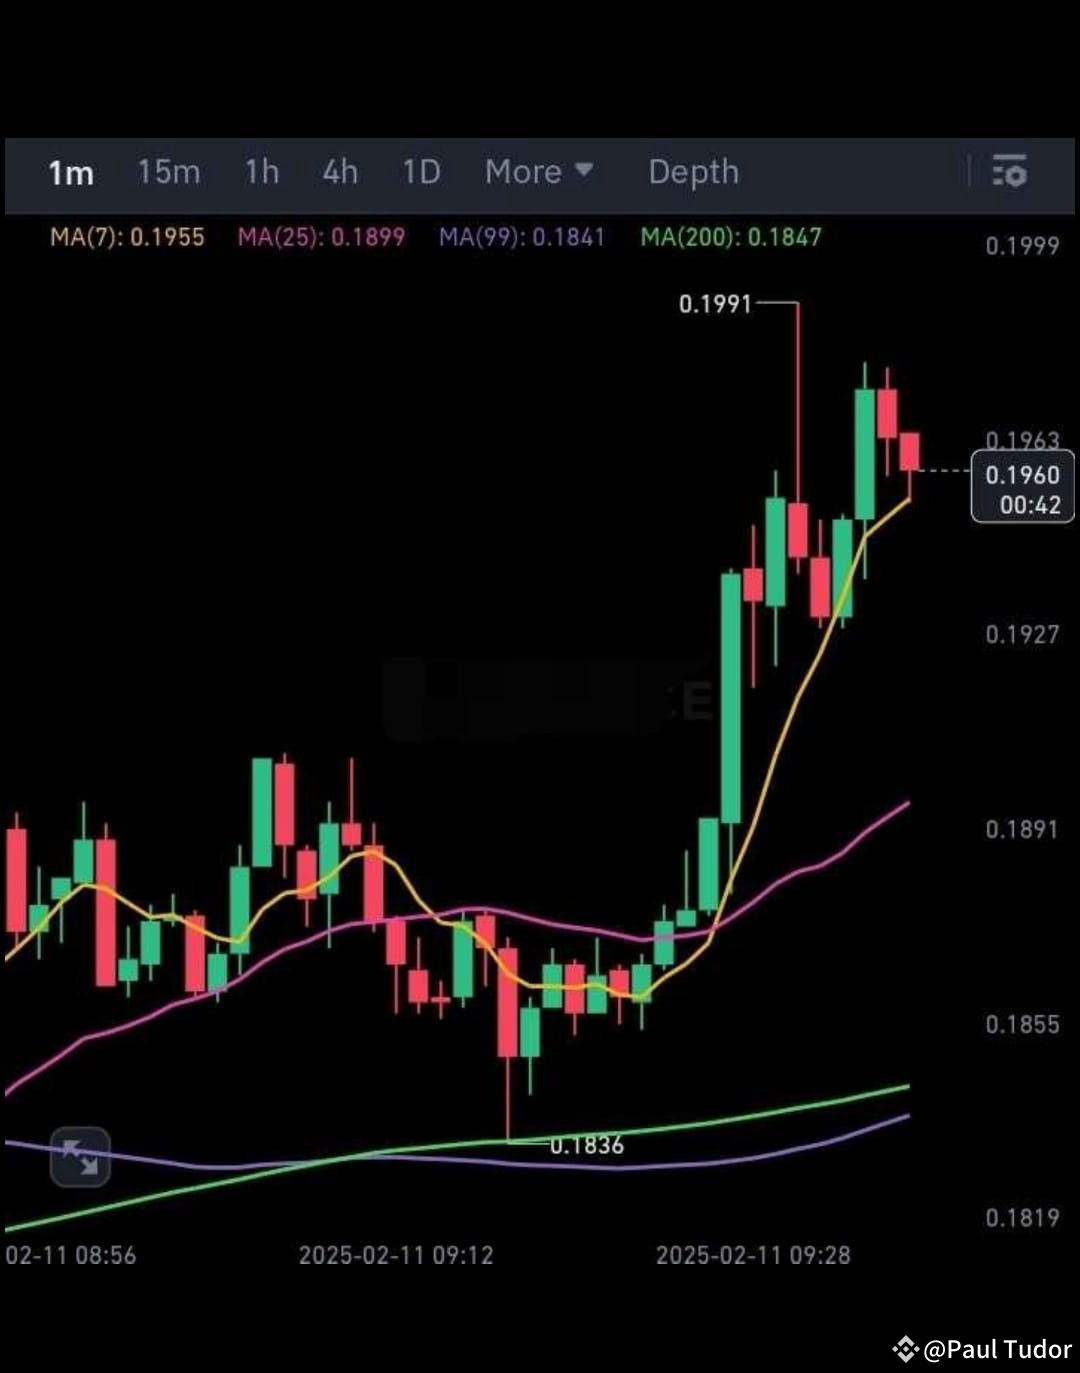
$TST /USDT
LONG
ENTRY-1770, 1690, 1600
TARGETS-1820, 1880 1930, 2000, 2100, 2400, 3000
LEVERAGE - cross 15x
STOPLOSS - 1530
#AITokensBounce #BTCStateReserves #1000CHEEMS&TSTOnBinance #BinanceAlphaAlert #USJoblessClaimsRise
$TST
{spot}(TSTUSDT)
$TST /USDT
LONG
ENTRY-1770, 1690, 1600
TARGETS-1820, 1880 1930, 2000, 2100, 2400, 3000
LEVERAGE - cross 15x
STOPLOSS - 1530
#AITokensBounce #BTCStateReserves #1000CHEEMS&TSTOnBinance #BinanceAlphaAlert #USJoblessClaimsRise
$TST
LONG
ENTRY-1770, 1690, 1600
TARGETS-1820, 1880 1930, 2000, 2100, 2400, 3000
LEVERAGE - cross 15x
STOPLOSS - 1530
#AITokensBounce #BTCStateReserves #1000CHEEMS&TSTOnBinance #BinanceAlphaAlert #USJoblessClaimsRise
$TST
5.4k
·
--
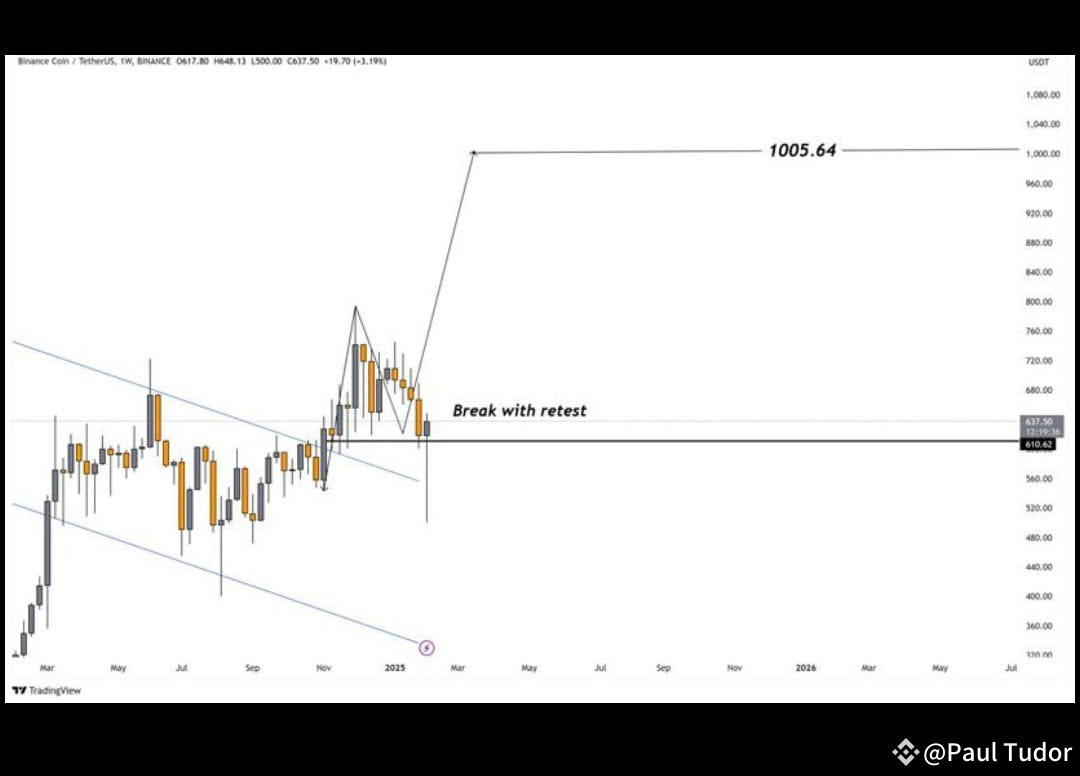
$BNB – Major Breakout Confirmation?
📊 Current Price: $635.27
📈 Key Breakout Level: $610.62 (Confirmed Retest)
🔍 Technical Analysis:
✅ Falling Wedge Breakout – Clear trend shift to bullish momentum
✅ Break + Retest Pattern – Confirmation of support at $610
✅ Higher Highs Forming – Trend structure remains intact
🎯 Price Target:
🚀 Target: $1005.64
#BNBChainMeme #1000CHEEMS&TSTOnBinance #BinanceAlphaAlert #BTCNextATH? #BTCHovers100k
$BNB
{spot}(BNBUSDT)
$BTC
{spot}(BTCUSDT)
$BNB – Major Breakout Confirmation?
📊 Current Price: $635.27
📈 Key Breakout Level: $610.62 (Confirmed Retest)
🔍 Technical Analysis:
✅ Falling Wedge Breakout – Clear trend shift to bullish momentum
✅ Break + Retest Pattern – Confirmation of support at $610
✅ Higher Highs Forming – Trend structure remains intact
🎯 Price Target:
🚀 Target: $1005.64
#BNBChainMeme #1000CHEEMS&TSTOnBinance #BinanceAlphaAlert #BTCNextATH? #BTCHovers100k
$BNB
$BTC
📊 Current Price: $635.27
📈 Key Breakout Level: $610.62 (Confirmed Retest)
🔍 Technical Analysis:
✅ Falling Wedge Breakout – Clear trend shift to bullish momentum
✅ Break + Retest Pattern – Confirmation of support at $610
✅ Higher Highs Forming – Trend structure remains intact
🎯 Price Target:
🚀 Target: $1005.64
#BNBChainMeme #1000CHEEMS&TSTOnBinance #BinanceAlphaAlert #BTCNextATH? #BTCHovers100k
$BNB
$BTC
62
·
--
Bearish
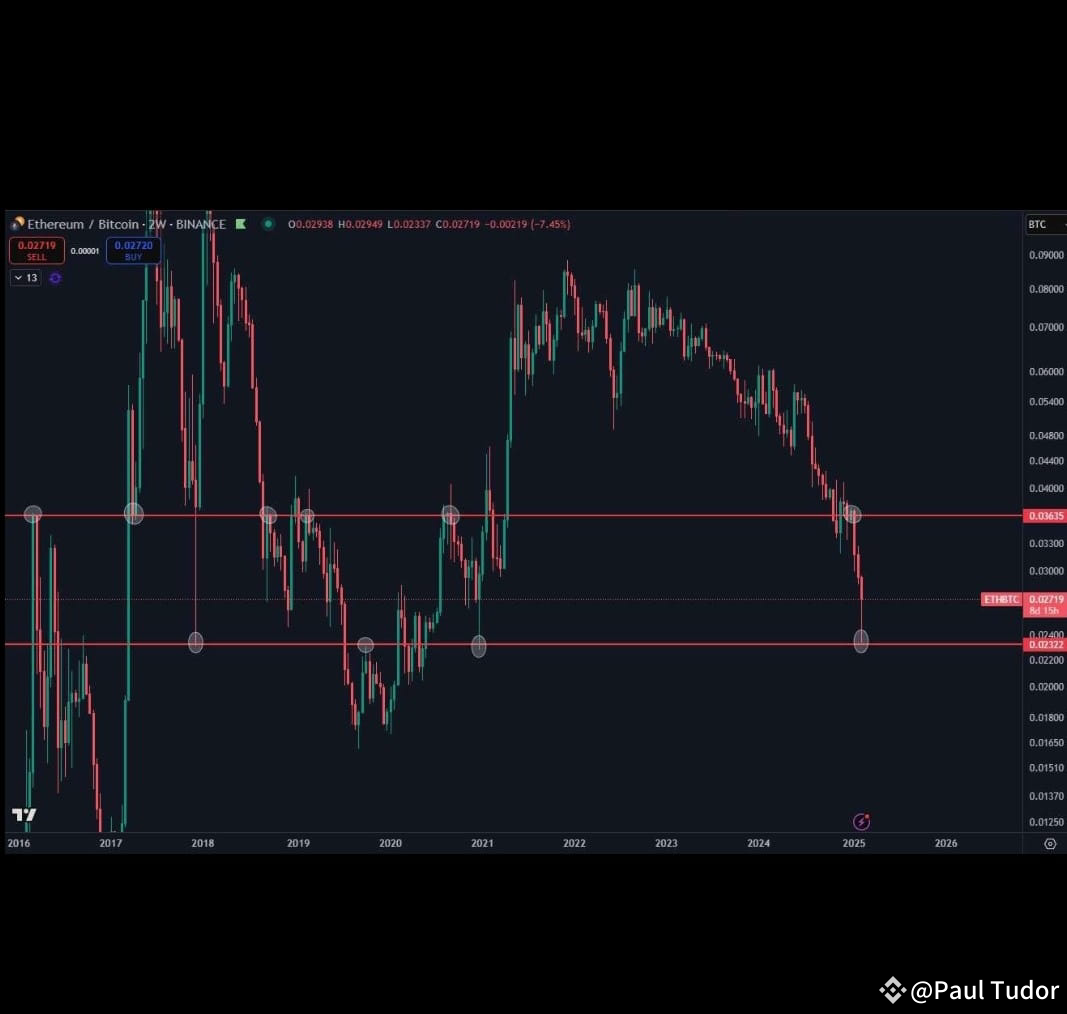
$ETH Has traded back down to 2016-2020 levels relative to $BTC.
I think the time to get excited again is when this retakes 0.036 at the very minimum.
For me, ETH is still the most logical place for real & serious applications like RWA, DeFi etc. It's obviously less fit for other uses like a meme coin casino.
With that, L2s are value extracting from this which is another issue.
Regardless, chart tapped an interesting level, would not be surprised to see this sit between 0.023-0.036 for quite a while.
#ETH
$ETH
{spot}(ETHUSDT)
$ETH Has traded back down to 2016-2020 levels relative to $BTC.
I think the time to get excited again is when this retakes 0.036 at the very minimum.
For me, ETH is still the most logical place for real & serious applications like RWA, DeFi etc. It's obviously less fit for other uses like a meme coin casino.
With that, L2s are value extracting from this which is another issue.
Regardless, chart tapped an interesting level, would not be surprised to see this sit between 0.023-0.036 for quite a while.
#ETH
$ETH
I think the time to get excited again is when this retakes 0.036 at the very minimum.
For me, ETH is still the most logical place for real & serious applications like RWA, DeFi etc. It's obviously less fit for other uses like a meme coin casino.
With that, L2s are value extracting from this which is another issue.
Regardless, chart tapped an interesting level, would not be surprised to see this sit between 0.023-0.036 for quite a while.
#ETH
$ETH
676
·
--
Article
BTC Faces Critical Selling Pressure as Buyers Struggle to Balance MarketOver 2,000 BTC are queued for sale, creating high selling pressure in the market.
Buyers have been slow to act, making the market vulnerable to sharp price changes.
A strong catalyst is essential to balance supply and demand and drive prices higher.
Bitcoin's market dynamics are in focus as analyst Dom highlights concerns within the BTC spot orderbook. Selling pressure has intensified in the $30,000–$40,000 range, with passive buyers such as institutional investors, including Michael Saylor's entities and ETFs, stepping in. The primary question is whether these buyers can hold the line and stabilize the market amid increasing selling activity.
Spot Orderbook Hits Dangerous Levels
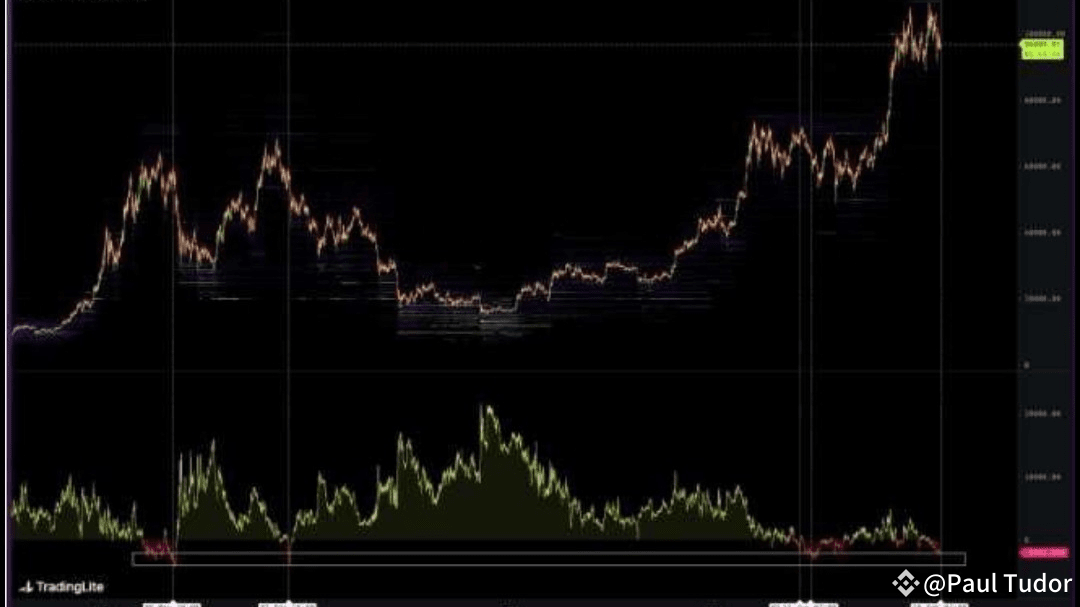
According to Dom, the spot order book has reached "dangerous" territory, a condition observed only four times in the last 1,800 days. Over 2,000 BTC are queued for sale, outnumbering buy orders within a tight 50% range of price activity. This imbalance reflects liquidity stress, which could lead to sudden volatility if the market remains saturated with sell orders.
The technical chart reveals this accumulation of sell orders around key price levels, emphasizing the risk of a sharp pullback. Historically, such sell-side dominance often precedes notable corrections unless met with an equal or greater influx of buying pressure.
Buyers Missing in Action
Despite Bitcoin's recovery from its previous lows, the absence of strong buying momentum remains a concern. Historical patterns indicate that BTC has relied on significant catalysts to push higher, but this hasn't been evident in recent months. The peaks and valleys in the price chart suggest that the market is waiting for a decisive move, with buyers reluctant to commit at current levels.
Dom asserts that breaking higher will require a robust influx of buyers, an event that has not been observed for months. This lack of participation suggests that traders are cautious, waiting for external drivers such as institutional inflows or favorable macroeconomic events to signal the next move.
Auction Market Theory: Predicting the Next Move
Dom frames the current situation through Auction Market Theory, emphasizing that imbalances in order flow can drive rapid price shifts. If the sell-side pressure continues without a corresponding increase in demand, BTC could face a sharp decline. Conversely, a strong inflow of buyers could stabilize the market and propel Bitcoin to new highs.
Conclusion: Buyers or Sellers—Who Will Prevail?
Bitcoin's future hinges on the delicate balance between supply and demand. If passive traders hold their ground and new additions emerge, BTC could see a rally. However, failure to attract sufficient buying interest could result in a sharp correction. As traders monitor the orderbook, the question remains: who will take control—buyers or sellers?
#BTC
$BTC
{spot}(BTCUSDT)
#ETH
BTC Faces Critical Selling Pressure as Buyers Struggle to Balance Market
Over 2,000 BTC are queued for sale, creating high selling pressure in the market.
Buyers have been slow to act, making the market vulnerable to sharp price changes.
A strong catalyst is essential to balance supply and demand and drive prices higher.
Bitcoin's market dynamics are in focus as analyst Dom highlights concerns within the BTC spot orderbook. Selling pressure has intensified in the $30,000–$40,000 range, with passive buyers such as institutional investors, including Michael Saylor's entities and ETFs, stepping in. The primary question is whether these buyers can hold the line and stabilize the market amid increasing selling activity.
Spot Orderbook Hits Dangerous Levels
According to Dom, the spot order book has reached "dangerous" territory, a condition observed only four times in the last 1,800 days. Over 2,000 BTC are queued for sale, outnumbering buy orders within a tight 50% range of price activity. This imbalance reflects liquidity stress, which could lead to sudden volatility if the market remains saturated with sell orders.
The technical chart reveals this accumulation of sell orders around key price levels, emphasizing the risk of a sharp pullback. Historically, such sell-side dominance often precedes notable corrections unless met with an equal or greater influx of buying pressure.
Buyers Missing in Action
Despite Bitcoin's recovery from its previous lows, the absence of strong buying momentum remains a concern. Historical patterns indicate that BTC has relied on significant catalysts to push higher, but this hasn't been evident in recent months. The peaks and valleys in the price chart suggest that the market is waiting for a decisive move, with buyers reluctant to commit at current levels.
Dom asserts that breaking higher will require a robust influx of buyers, an event that has not been observed for months. This lack of participation suggests that traders are cautious, waiting for external drivers such as institutional inflows or favorable macroeconomic events to signal the next move.
Auction Market Theory: Predicting the Next Move
Dom frames the current situation through Auction Market Theory, emphasizing that imbalances in order flow can drive rapid price shifts. If the sell-side pressure continues without a corresponding increase in demand, BTC could face a sharp decline. Conversely, a strong inflow of buyers could stabilize the market and propel Bitcoin to new highs.
Conclusion: Buyers or Sellers—Who Will Prevail?
Bitcoin's future hinges on the delicate balance between supply and demand. If passive traders hold their ground and new additions emerge, BTC could see a rally. However, failure to attract sufficient buying interest could result in a sharp correction. As traders monitor the orderbook, the question remains: who will take control—buyers or sellers?
#BTC
$BTC
#ETH
Buyers have been slow to act, making the market vulnerable to sharp price changes.
A strong catalyst is essential to balance supply and demand and drive prices higher.
Bitcoin's market dynamics are in focus as analyst Dom highlights concerns within the BTC spot orderbook. Selling pressure has intensified in the $30,000–$40,000 range, with passive buyers such as institutional investors, including Michael Saylor's entities and ETFs, stepping in. The primary question is whether these buyers can hold the line and stabilize the market amid increasing selling activity.
Spot Orderbook Hits Dangerous Levels
According to Dom, the spot order book has reached "dangerous" territory, a condition observed only four times in the last 1,800 days. Over 2,000 BTC are queued for sale, outnumbering buy orders within a tight 50% range of price activity. This imbalance reflects liquidity stress, which could lead to sudden volatility if the market remains saturated with sell orders.
The technical chart reveals this accumulation of sell orders around key price levels, emphasizing the risk of a sharp pullback. Historically, such sell-side dominance often precedes notable corrections unless met with an equal or greater influx of buying pressure.
Buyers Missing in Action
Despite Bitcoin's recovery from its previous lows, the absence of strong buying momentum remains a concern. Historical patterns indicate that BTC has relied on significant catalysts to push higher, but this hasn't been evident in recent months. The peaks and valleys in the price chart suggest that the market is waiting for a decisive move, with buyers reluctant to commit at current levels.
Dom asserts that breaking higher will require a robust influx of buyers, an event that has not been observed for months. This lack of participation suggests that traders are cautious, waiting for external drivers such as institutional inflows or favorable macroeconomic events to signal the next move.
Auction Market Theory: Predicting the Next Move
Dom frames the current situation through Auction Market Theory, emphasizing that imbalances in order flow can drive rapid price shifts. If the sell-side pressure continues without a corresponding increase in demand, BTC could face a sharp decline. Conversely, a strong inflow of buyers could stabilize the market and propel Bitcoin to new highs.
Conclusion: Buyers or Sellers—Who Will Prevail?
Bitcoin's future hinges on the delicate balance between supply and demand. If passive traders hold their ground and new additions emerge, BTC could see a rally. However, failure to attract sufficient buying interest could result in a sharp correction. As traders monitor the orderbook, the question remains: who will take control—buyers or sellers?
#BTC
$BTC
#ETH
107
·
--
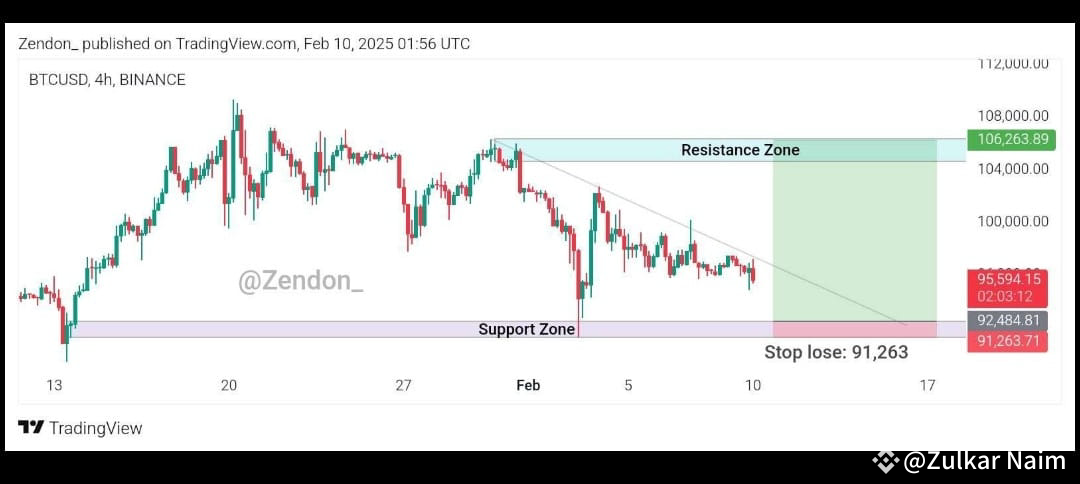
$BTC is consolidating near the support zone around $91,263, with a descending trendline acting as resistance. A breakout above this trendline could trigger a bullish move toward the $106,263 resistance zone.
Trade Setup:
Entry: Around the current price, aiming for a breakout.
Stop-Loss: Below $91,263 to manage risk.
Target: $106,263+ if momentum holds.
BTC needs to break and hold above the trendline for confirmation. If it rejects, expect another retest of the support zone.
#BTC $BTC
{spot}(BTCUSDT)
$BTC is consolidating near the support zone around $91,263, with a descending trendline acting as resistance. A breakout above this trendline could trigger a bullish move toward the $106,263 resistance zone.
Trade Setup:
Entry: Around the current price, aiming for a breakout.
Stop-Loss: Below $91,263 to manage risk.
Target: $106,263+ if momentum holds.
BTC needs to break and hold above the trendline for confirmation. If it rejects, expect another retest of the support zone.
#BTC $BTC
Trade Setup:
Entry: Around the current price, aiming for a breakout.
Stop-Loss: Below $91,263 to manage risk.
Target: $106,263+ if momentum holds.
BTC needs to break and hold above the trendline for confirmation. If it rejects, expect another retest of the support zone.
#BTC $BTC
2
802
·
--
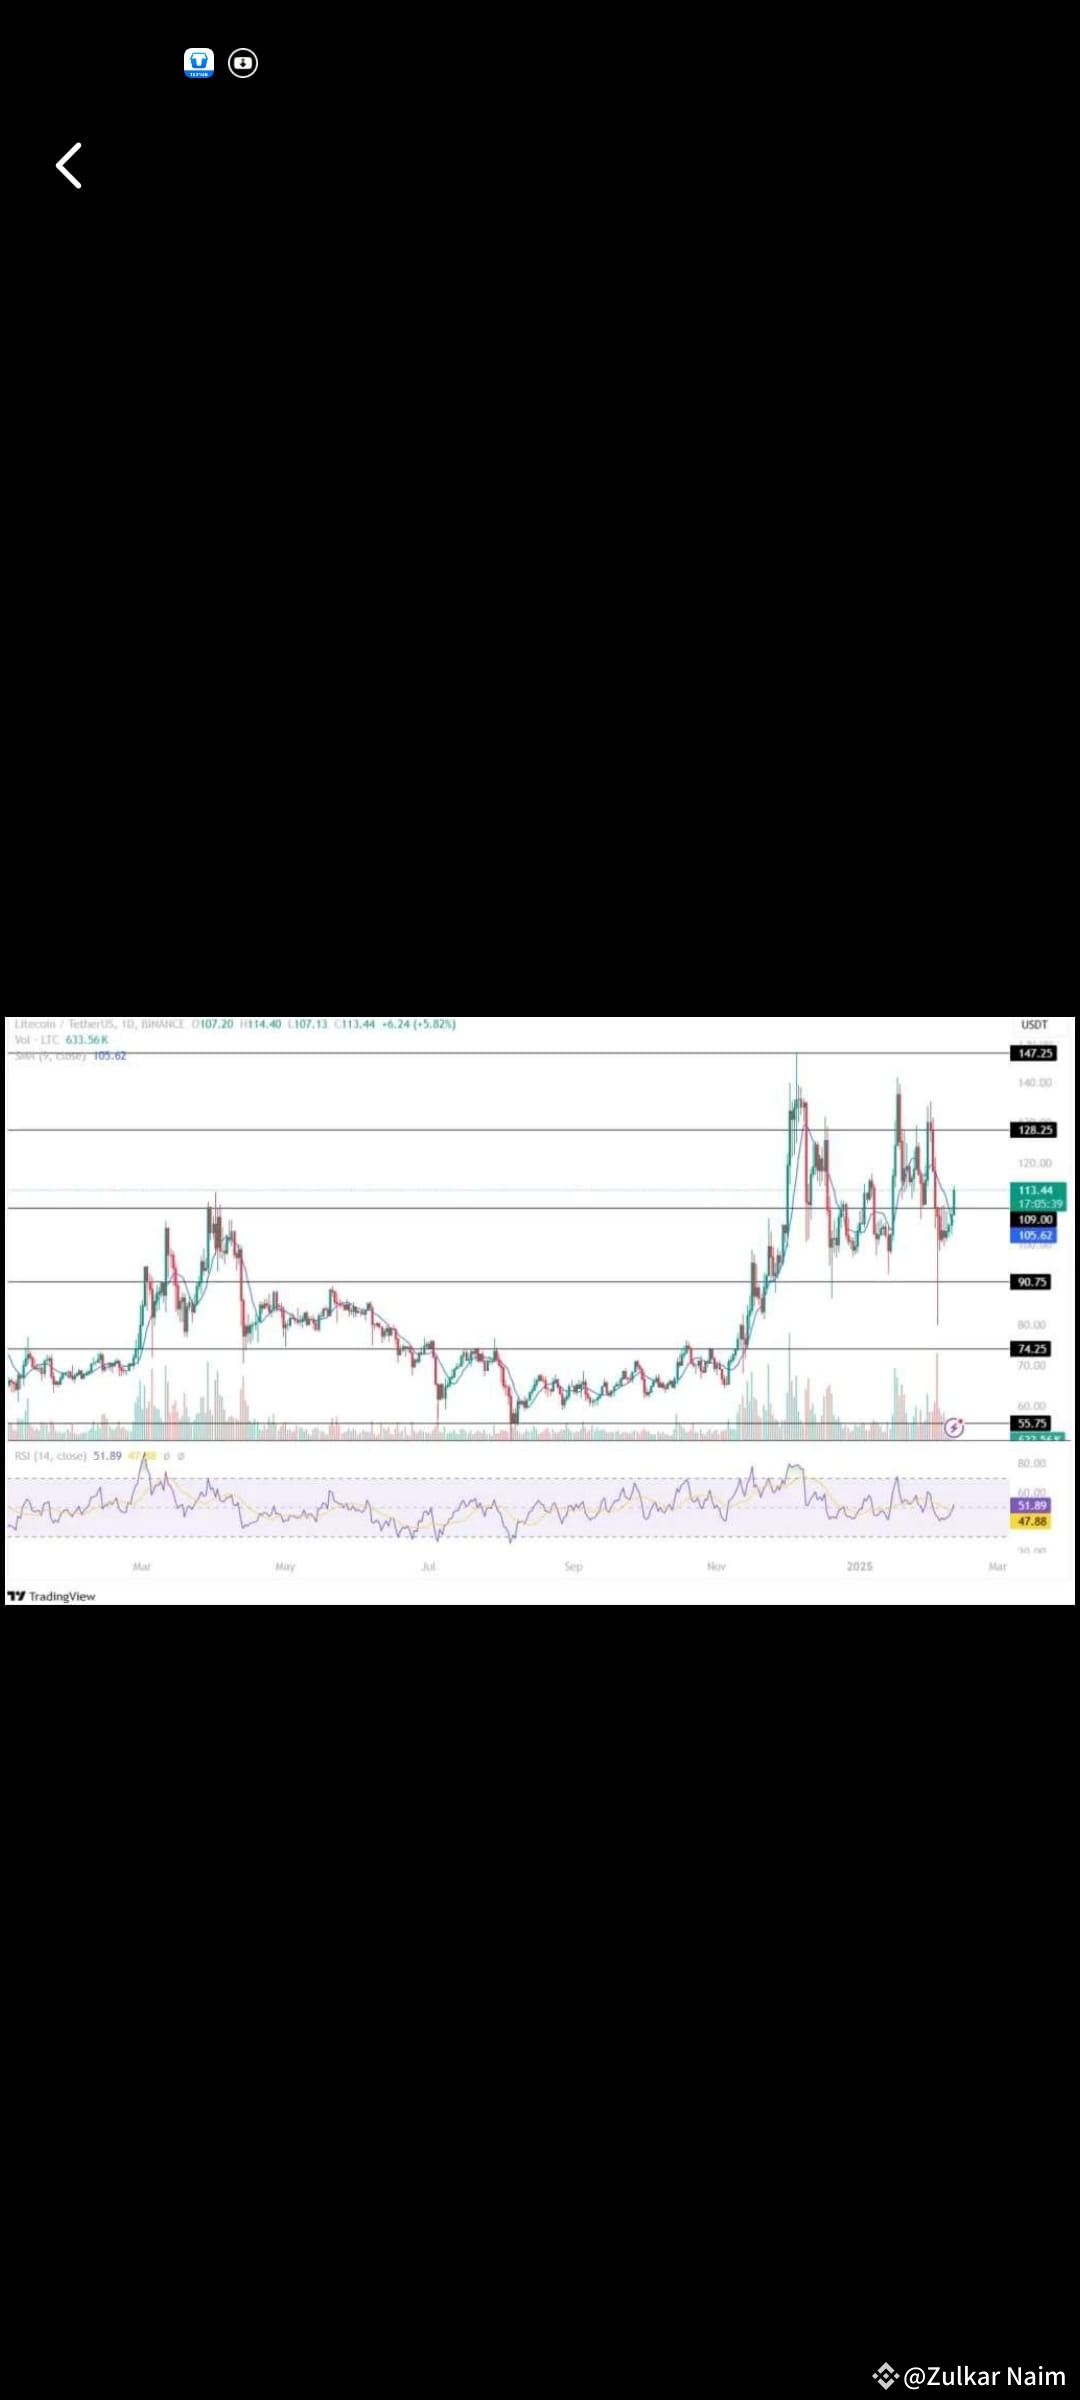
Despite increased bearish price action with Bitcoin price struggling below the $100k mark, the Litecoin price has maintained its bullish momentum by breaking out of its important resistance level in the daily time frame. This suggests an increase in the bullish action for the altcoin.
Considering the present market sentiments, is this a good time to invest in Litecoin? Or did you miss the boat? In this article, we bring you the technical sentiments and possible short-term Litecoin price analysis to understand the market trends.
LTC Price Reclaims Its Important Resistance Level!
The price of Litecoin has added 5.56% to its valuation over the past 24 hours with a trading volume of $981.16 million. Furthermore, it has surged 24.36% in the last seven days and has a YTD return of ~8%. With a market cap of $8.536 billion, it has secured the 19th position.
The Relative Strength Index (RSI) records a sharp rise in the daily time frame with its average trendline experiencing a bullish crossover. This suggests an increase in the buying-over-selling pressure for the altcoin in the crypto space.
On the other hand, the SMA indicator displays a positive convergence in the Litecoin price chart. This highlights a positive outlook for the 19th largest crypto token this week.
Will LTC Price Reclaim The $150 Mark?
Maintaining the price above its support level of $109 could set the stage for the price of Litecoin token to retest its resistance level of $128.25. Furthermore, if the bullish sentiment sustains, this could push the price of this altcoin toward its upper resistance level of $147.25 this month.
On the flip side, if the bears outrun the bulls, the price could retest its immediate support level of $109. Moreover, if the bears dominate the crypto market, this may pull the price toward its lower support level of $100 in the coming time.
#LTC📈
#Dyor
$LTC
Despite increased bearish price action with Bitcoin price struggling below the $100k mark, the Litecoin price has maintained its bullish momentum by breaking out of its important resistance level in the daily time frame. This suggests an increase in the bullish action for the altcoin.
Considering the present market sentiments, is this a good time to invest in Litecoin? Or did you miss the boat? In this article, we bring you the technical sentiments and possible short-term Litecoin price analysis to understand the market trends.
LTC Price Reclaims Its Important Resistance Level!
The price of Litecoin has added 5.56% to its valuation over the past 24 hours with a trading volume of $981.16 million. Furthermore, it has surged 24.36% in the last seven days and has a YTD return of ~8%. With a market cap of $8.536 billion, it has secured the 19th position.
The Relative Strength Index (RSI) records a sharp rise in the daily time frame with its average trendline experiencing a bullish crossover. This suggests an increase in the buying-over-selling pressure for the altcoin in the crypto space.
On the other hand, the SMA indicator displays a positive convergence in the Litecoin price chart. This highlights a positive outlook for the 19th largest crypto token this week.
Will LTC Price Reclaim The $150 Mark?
Maintaining the price above its support level of $109 could set the stage for the price of Litecoin token to retest its resistance level of $128.25. Furthermore, if the bullish sentiment sustains, this could push the price of this altcoin toward its upper resistance level of $147.25 this month.
On the flip side, if the bears outrun the bulls, the price could retest its immediate support level of $109. Moreover, if the bears dominate the crypto market, this may pull the price toward its lower support level of $100 in the coming time.
#LTC📈
#Dyor
$LTC
Considering the present market sentiments, is this a good time to invest in Litecoin? Or did you miss the boat? In this article, we bring you the technical sentiments and possible short-term Litecoin price analysis to understand the market trends.
LTC Price Reclaims Its Important Resistance Level!
The price of Litecoin has added 5.56% to its valuation over the past 24 hours with a trading volume of $981.16 million. Furthermore, it has surged 24.36% in the last seven days and has a YTD return of ~8%. With a market cap of $8.536 billion, it has secured the 19th position.
The Relative Strength Index (RSI) records a sharp rise in the daily time frame with its average trendline experiencing a bullish crossover. This suggests an increase in the buying-over-selling pressure for the altcoin in the crypto space.
On the other hand, the SMA indicator displays a positive convergence in the Litecoin price chart. This highlights a positive outlook for the 19th largest crypto token this week.
Will LTC Price Reclaim The $150 Mark?
Maintaining the price above its support level of $109 could set the stage for the price of Litecoin token to retest its resistance level of $128.25. Furthermore, if the bullish sentiment sustains, this could push the price of this altcoin toward its upper resistance level of $147.25 this month.
On the flip side, if the bears outrun the bulls, the price could retest its immediate support level of $109. Moreover, if the bears dominate the crypto market, this may pull the price toward its lower support level of $100 in the coming time.
#LTC📈
#Dyor
$LTC
1
1.5k
Log in to explore more content
Join global crypto users on Binance Square
⚡️ Get latest and useful information about crypto.
💬 Trusted by the world’s largest crypto exchange.
👍 Discover real insights from verified creators.
Email / Phone number
Trending Topics
FedRateWatch
495,176 views
2,500 Discussing
Share & Win Traffic Reward in our Trending Hashtag Campaign
✨Topic: FOMC September, What's The Fed's Next Move?
👉How to Join:
Publish a short post or article with hashtag #FedRateWatch
Create content based on the below angles:
- August core CPI rose 0.3% month-over-month, and the odds of a 25bp hike this week are now close to 90%. Do you anticipate a rate hike this week? Is it a one-off, or the start of a longer hiking cycle?
- If the hike lands, how does it play out for BTC, tech stocks, and gold? Bullish or bearish?
- How are you planning to trade next? Share your BTC, stocks or gold trade/holdings with our trade sharing widget.
⏰Campaign Period:
- 2026-09-15 11:00 - 2026-09-17 3:00 UTC
🎁Reward:
- Qualified posts that comply with the above guidelines and contain more than 100 words will be reviewed and may receive a random traffic boost of 500 to 3,000 views. You will receive a notification from your feed secretary if your post is selected.
- Get a chance to have your article featured on Binance Square Official
Need ideas for your post? Visit the topic page #FedRateWatch or the Square Guide on How to Post for Better Reach.
Binance Square Official
·362 Likes
·784.9k views
BitcoinSlidesTo$76000
15,715 views
105 Discussing
BitcoinReboundsTo$79K
59,683 views
396 Discussing