
张烁峰的剧本日记
2.4k Posts

张烁峰的剧本日记
深耕BTC,ETH!道路且长,我愿作为一盏照亮韭菜的灯火,为你点亮币圈的前路,带你一起遨游加密的星辰大海!
Frequent Trader
1.2 Years
75 Following
1.0K+ Followers
2.2K+ Liked
Posts
All
Quotes
Videos
Live
PINNED
Everyone can add friends by entering in the search box:
Input > Chat Room > Copy ID: 1129067177
Steps to add friends 🎈 see images 1, 2, 3
Let's not get separated, okay? I will accompany you on this path of Binance.
#加密市场观察
Input > Chat Room > Copy ID: 1129067177
Steps to add friends 🎈 see images 1, 2, 3
Let's not get separated, okay? I will accompany you on this path of Binance.
#加密市场观察




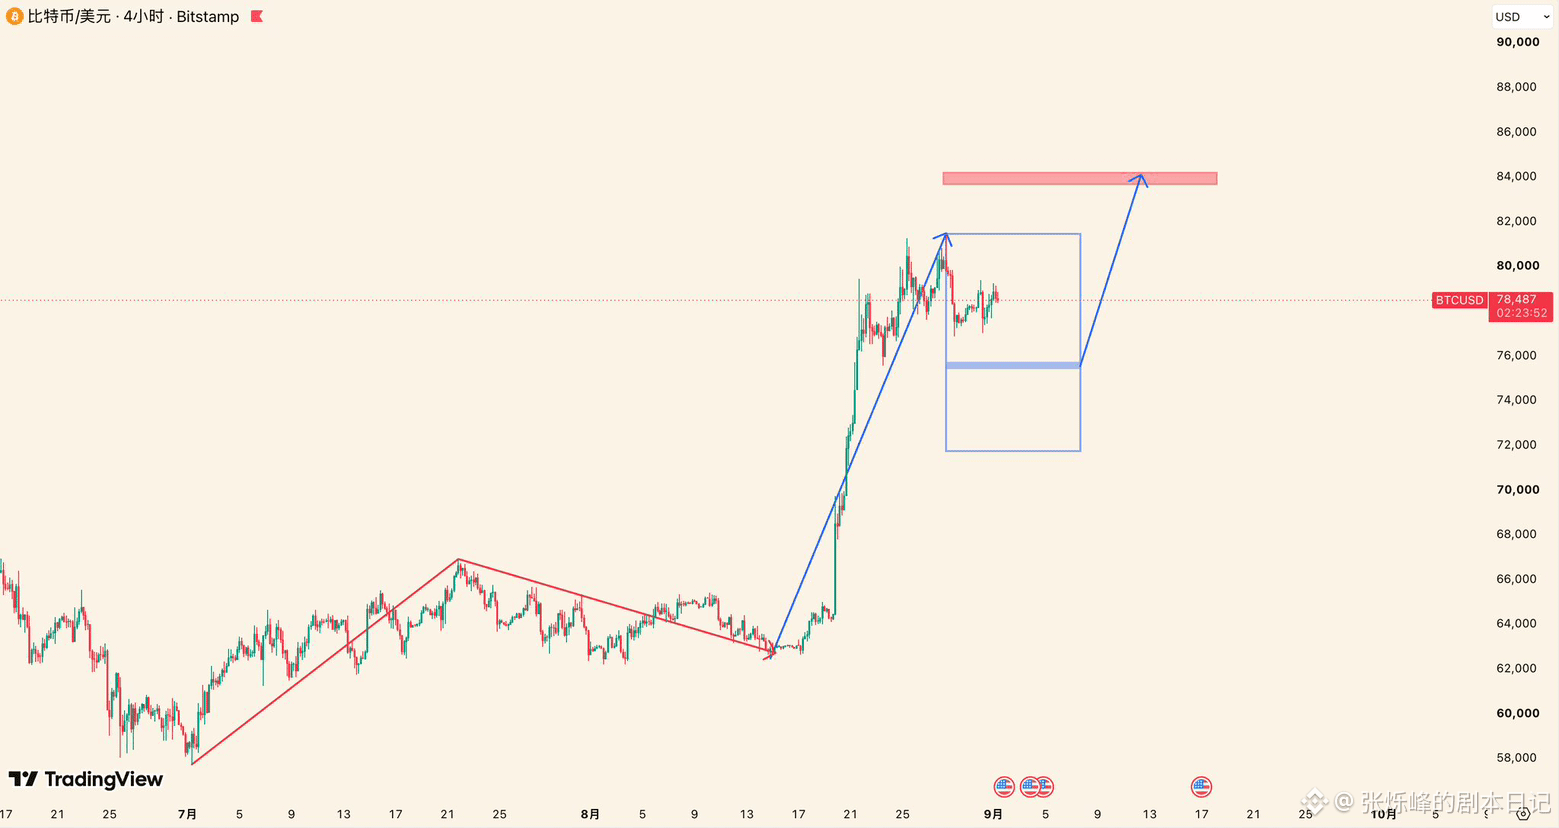
We mentioned in our August 28 tweet that the BTC uptrend that began on August 17 has ended (the blue segment in Figure 1) and that it is time to start running a pullback against it. Now the decline has already reached 5%; what should we watch for next?
As long as the pullback can find its endpoint by the end of this week—for example, finding a bottom above 75,400 and then starting the next leg up—there’s no doubt we will soon see BTC test the prior high of 82,850 and the important resistance zone above it at 83,700–84,200.
Can the low of August 29 at 76,888 serve as the endpoint for the pullback? If afterward BTC does not push lower, and instead holds above 79,600 and continues rising, then assuming 76,888 is the adjustment endpoint, we would remain cautious until then.
Since the rally that began on July 1—was it merely a rebound, or did 57,800 form the bear-market bottom? Is this the first wave of advance in the bull market? We believe we’ll have the answer at the latest during the week of September 10, in terms of Gann timing.
Over the past year, we’ve used Gann theory and nearly nailed BTC’s key turning points, including but not limited to 126,100 on December 6, 2025; 80,600 on November 21; 97,900 on January 14, 2026; February 1; May 6; and July 1... Will September be another time we hit it? Stay tuned—we’ll verify it together.#比特币8月上涨23%跑赢黄金股市 $BTC
As long as the pullback can find its endpoint by the end of this week—for example, finding a bottom above 75,400 and then starting the next leg up—there’s no doubt we will soon see BTC test the prior high of 82,850 and the important resistance zone above it at 83,700–84,200.
Can the low of August 29 at 76,888 serve as the endpoint for the pullback? If afterward BTC does not push lower, and instead holds above 79,600 and continues rising, then assuming 76,888 is the adjustment endpoint, we would remain cautious until then.
Since the rally that began on July 1—was it merely a rebound, or did 57,800 form the bear-market bottom? Is this the first wave of advance in the bull market? We believe we’ll have the answer at the latest during the week of September 10, in terms of Gann timing.
Over the past year, we’ve used Gann theory and nearly nailed BTC’s key turning points, including but not limited to 126,100 on December 6, 2025; 80,600 on November 21; 97,900 on January 14, 2026; February 1; May 6; and July 1... Will September be another time we hit it? Stay tuned—we’ll verify it together.#比特币8月上涨23%跑赢黄金股市 $BTC
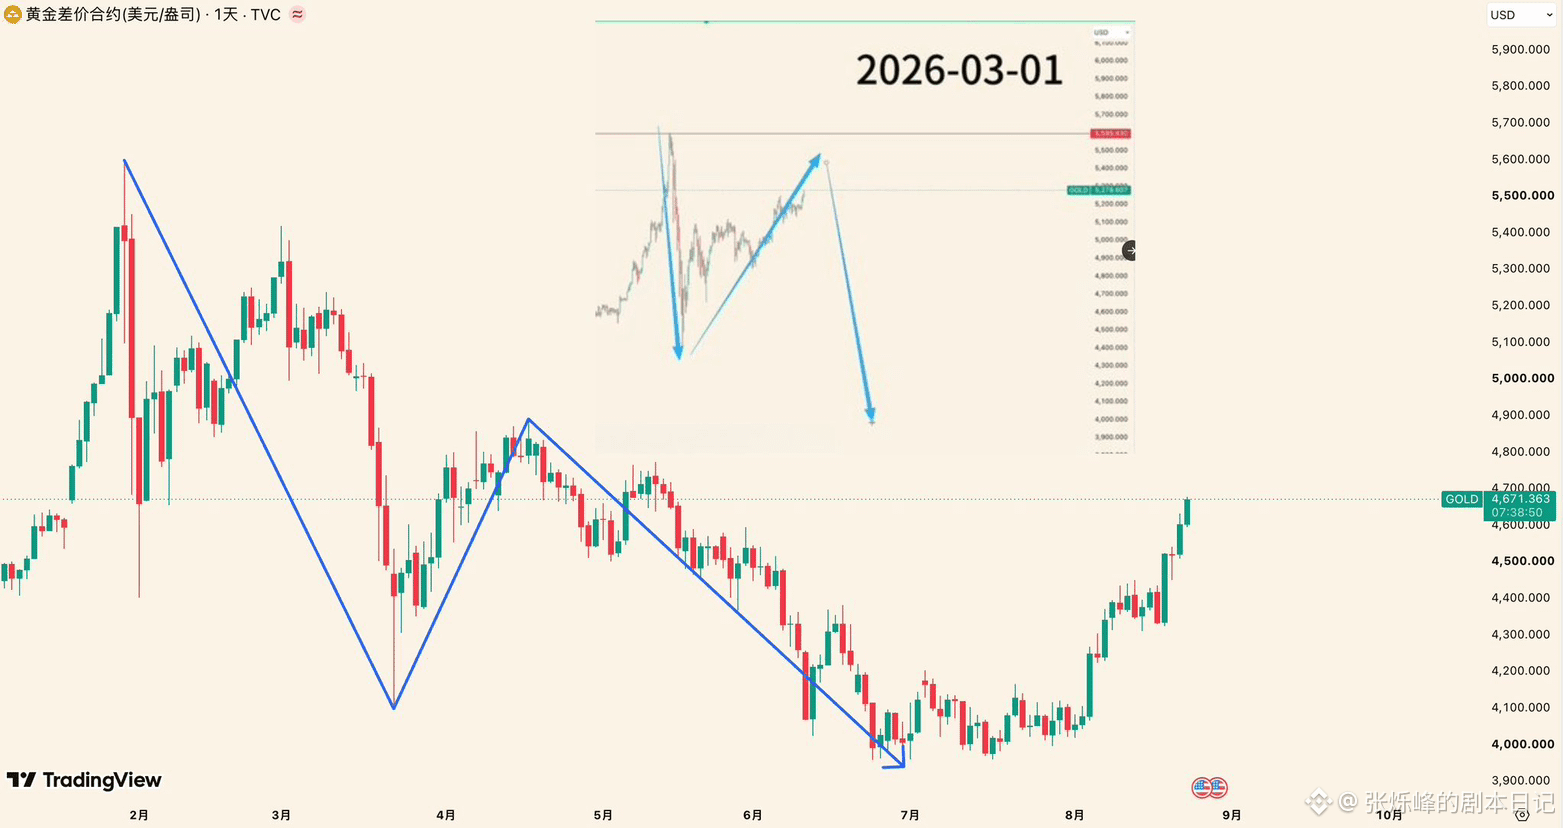
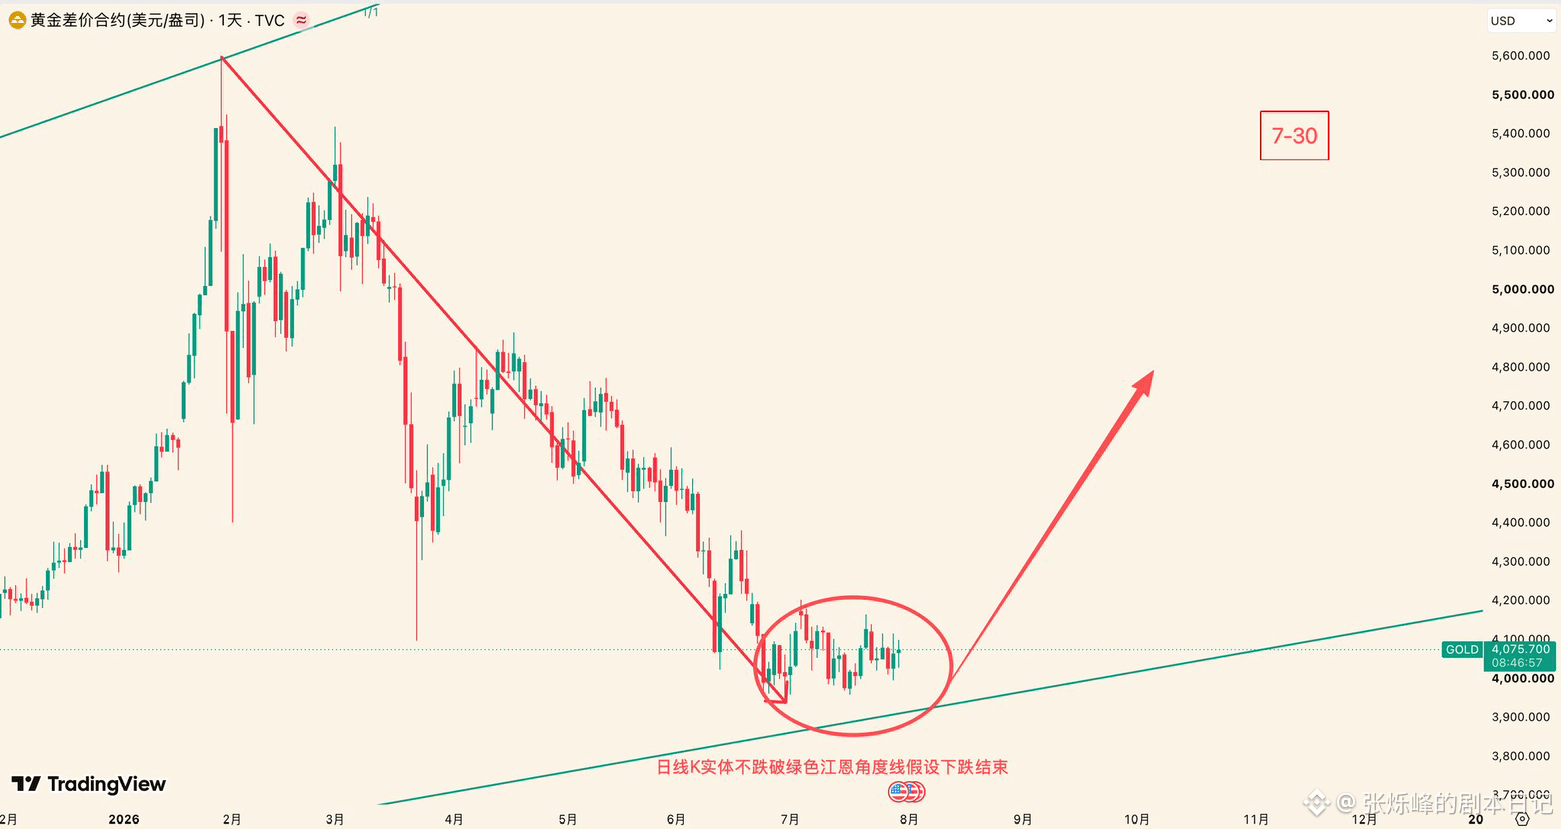
On August 24, we specifically published an article that divided the large- and small-degree structure for XAU gold, and made it clear that the ongoing rebound at the phase level is about to end. After that, gold fell 7.19% from its high. After March 1 and July 30, we once again hit a gold trend move!
For those who didn’t see my update before August 24, or saw it but didn’t pay attention—if you’re stuck on longs at higher levels, is there no way to get out?
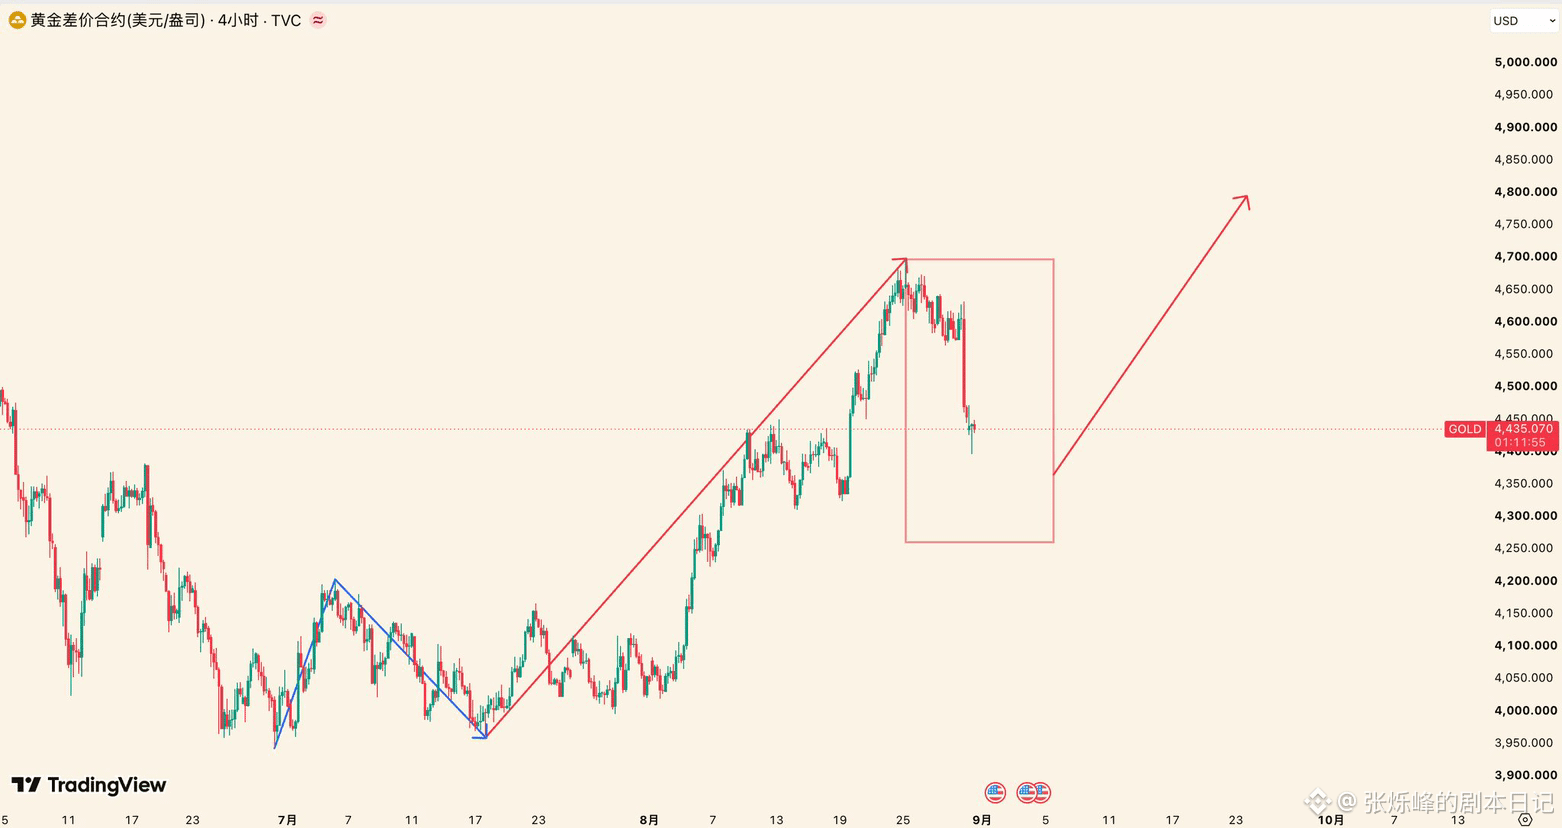
As shown in Figure 3, the decline starting from 4697 can temporarily be considered a pullback against the rise of the red segment in Figure 3. Along this path, today’s low at 4396 and the 4340 area are the key support levels we need to focus on.
4268 is the lifeline. If three consecutive daily candlesticks close below this level, the likelihood of a deeper pullback increases—possibly expanding further and even developing into a new downtrend. Before breaking this level, the decline that began from 4697 should be treated as a pullback. After the pullback ends, there should still be another leg up, including a high above 4697—at which point we will complete the entire rebound that began from 3942.
You should know that, as shown in Figures 1 and 2, starting from March 2026, every major turning point in the key market moves that we almost nailed—of course including last week’s phase-level high at 4697. Going forward, we will continue tracking gold’s price action to look for trading opportunities. Everyone, please stay tuned. #黄金早盘触及4444美元 $XAU
For those who didn’t see my update before August 24, or saw it but didn’t pay attention—if you’re stuck on longs at higher levels, is there no way to get out?
As shown in Figure 3, the decline starting from 4697 can temporarily be considered a pullback against the rise of the red segment in Figure 3. Along this path, today’s low at 4396 and the 4340 area are the key support levels we need to focus on.
4268 is the lifeline. If three consecutive daily candlesticks close below this level, the likelihood of a deeper pullback increases—possibly expanding further and even developing into a new downtrend. Before breaking this level, the decline that began from 4697 should be treated as a pullback. After the pullback ends, there should still be another leg up, including a high above 4697—at which point we will complete the entire rebound that began from 3942.
You should know that, as shown in Figures 1 and 2, starting from March 2026, every major turning point in the key market moves that we almost nailed—of course including last week’s phase-level high at 4697. Going forward, we will continue tracking gold’s price action to look for trading opportunities. Everyone, please stay tuned. #黄金早盘触及4444美元 $XAU
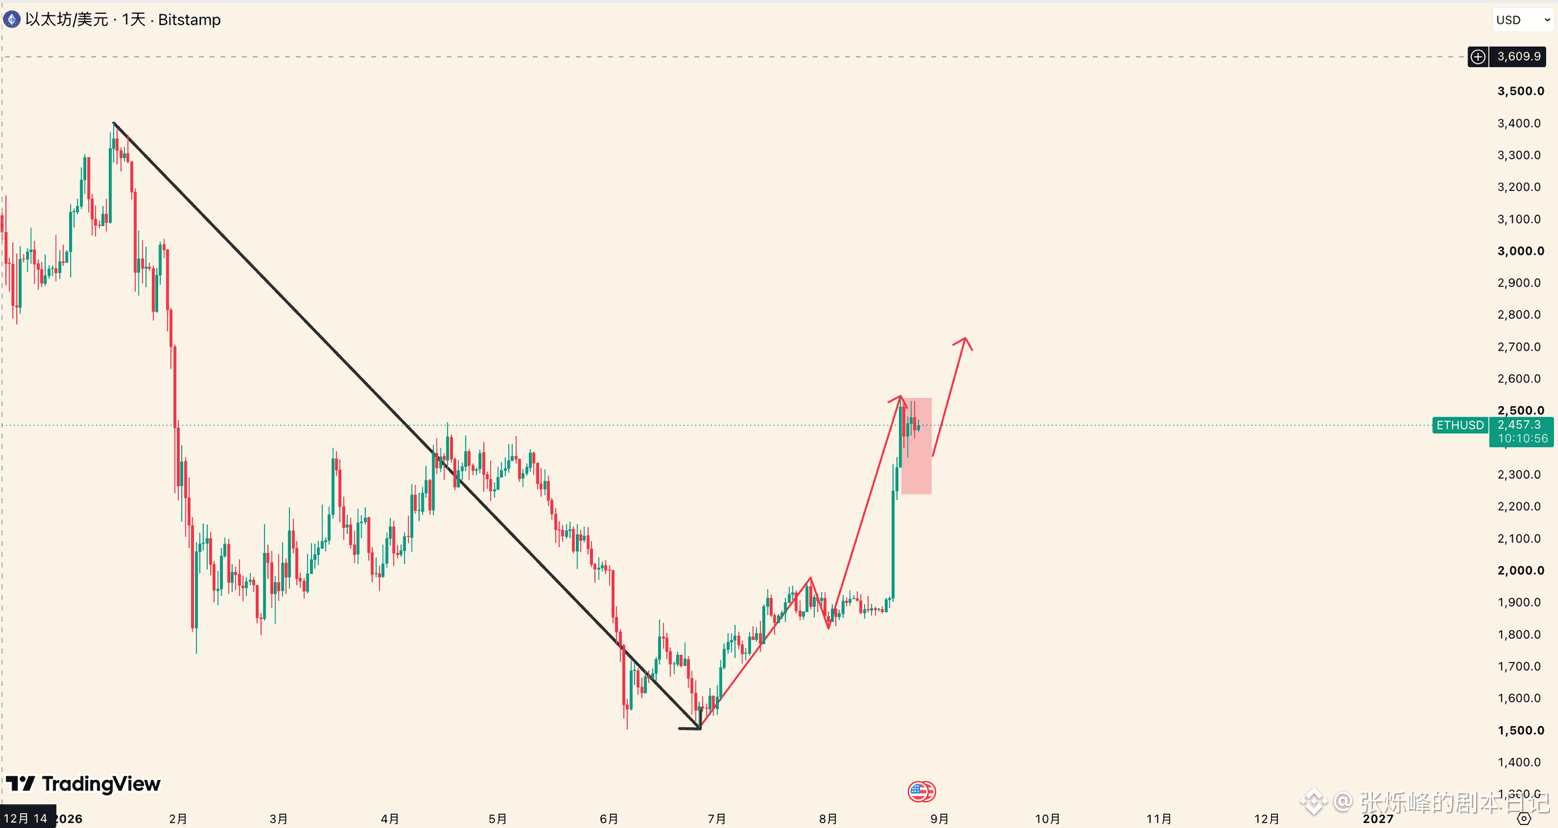
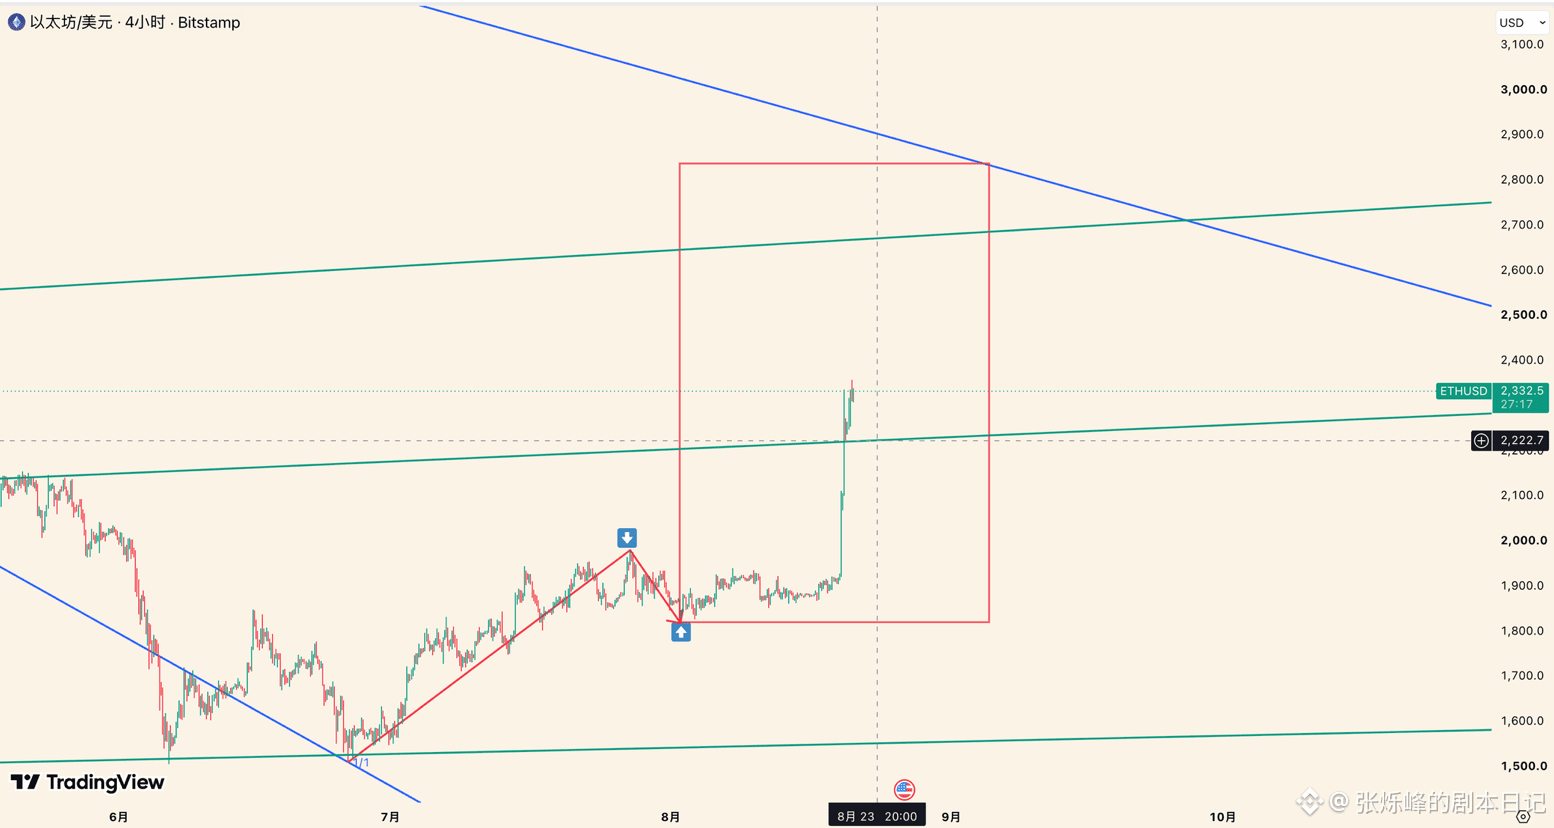
On June 1st, it was clearly stated that $ETH would fall to around the 1500 level, and the timing for the low point was given as late June to early July. Then on July 1st, after ETH dropped to 1505, another reminder was made that a phase low had appeared. Now, ETH’s rebound has continued for 76 days and the increase has reached 69%. Is it finished? What should we look at next?
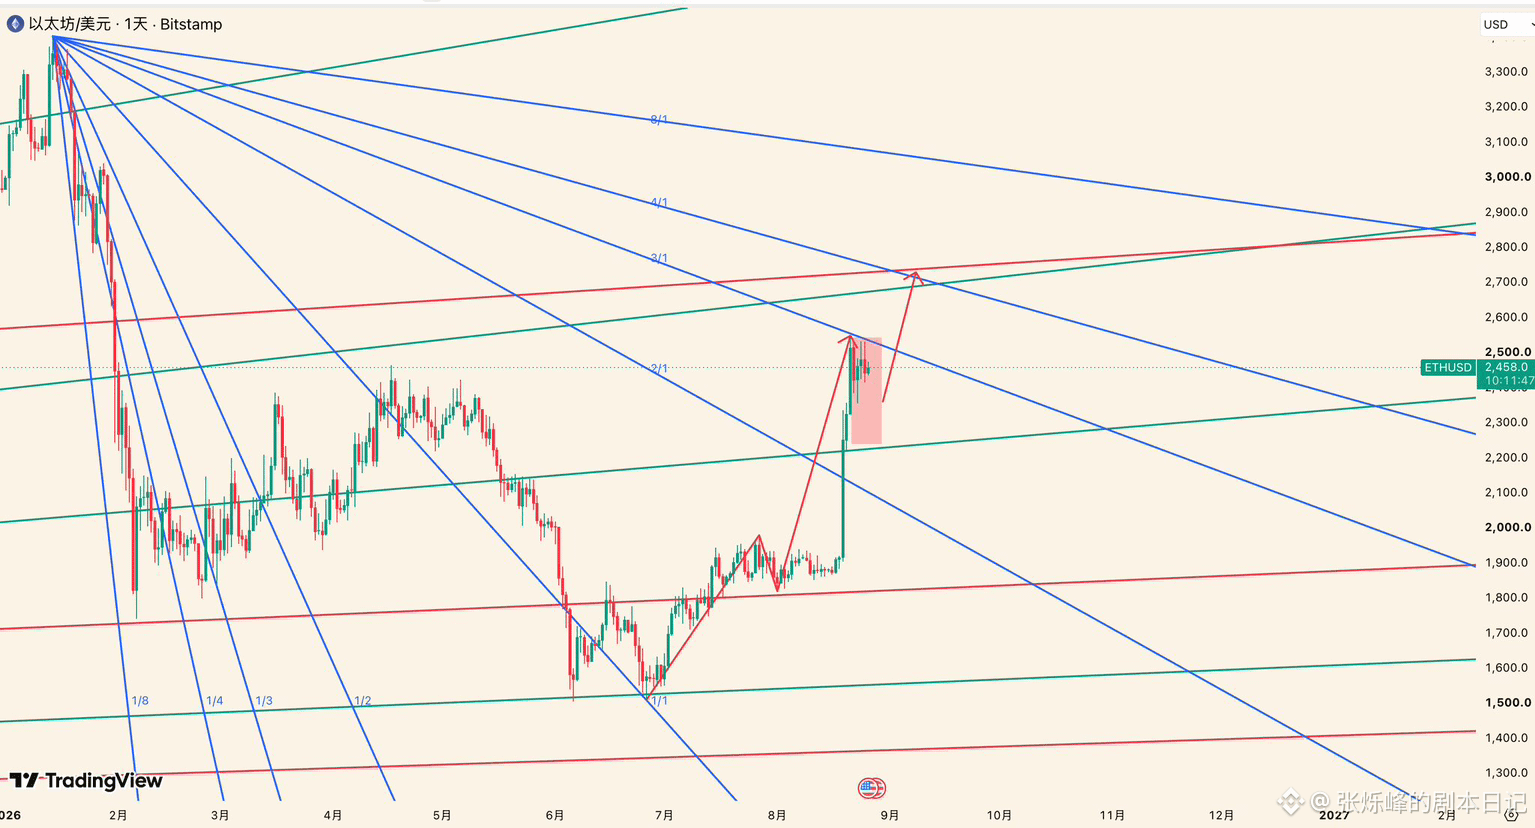
As shown in Figure 1, the rally from 1505 can temporarily be regarded as a rebound against the black segment’s decline. Most likely, this rebound has not yet ended. The movement running from the high at 2546 on August 22 is a correction targeting the earlier uptrend. After the correction is over, it will continue upward to test the key resistance zone at 2680–2740.
If the key resistance level can be broken afterward, the rebound’s magnitude will expand to a rebound against the entire decline from 4955 to 1505. If this happens, it would be an optimistic signal and has guiding significance for the market outlook in the fourth quarter.#ETH走势分析 $ETH
As shown in Figure 1, the rally from 1505 can temporarily be regarded as a rebound against the black segment’s decline. Most likely, this rebound has not yet ended. The movement running from the high at 2546 on August 22 is a correction targeting the earlier uptrend. After the correction is over, it will continue upward to test the key resistance zone at 2680–2740.
If the key resistance level can be broken afterward, the rebound’s magnitude will expand to a rebound against the entire decline from 4955 to 1505. If this happens, it would be an optimistic signal and has guiding significance for the market outlook in the fourth quarter.#ETH走势分析 $ETH
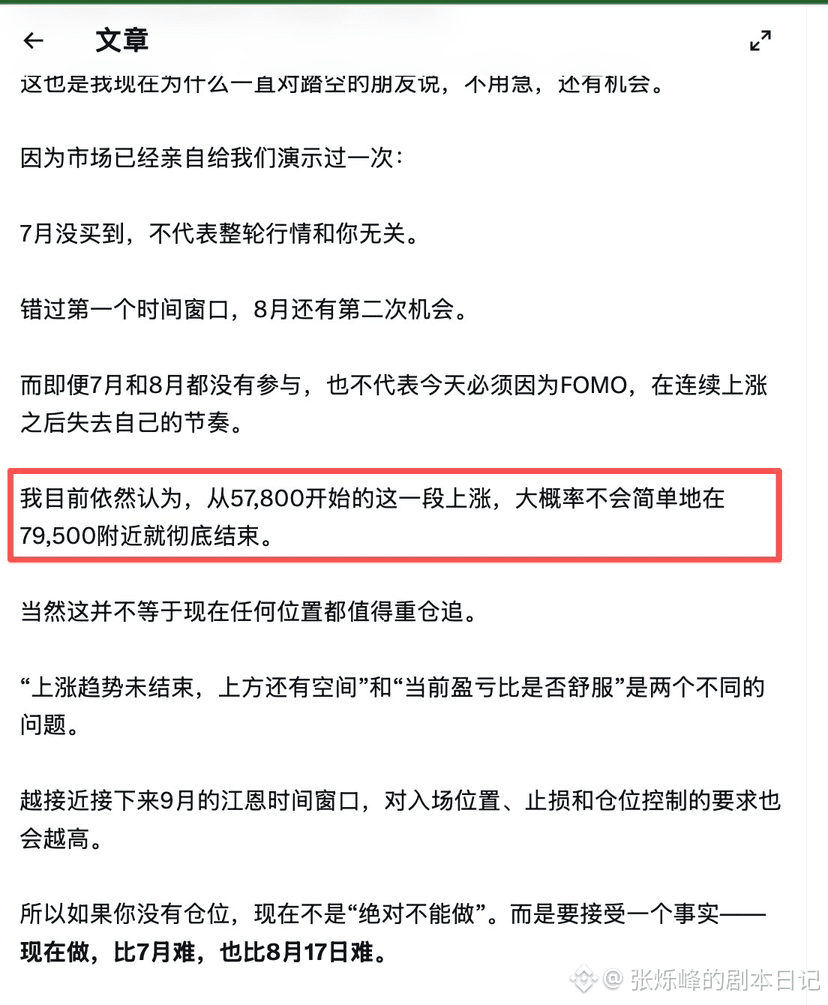
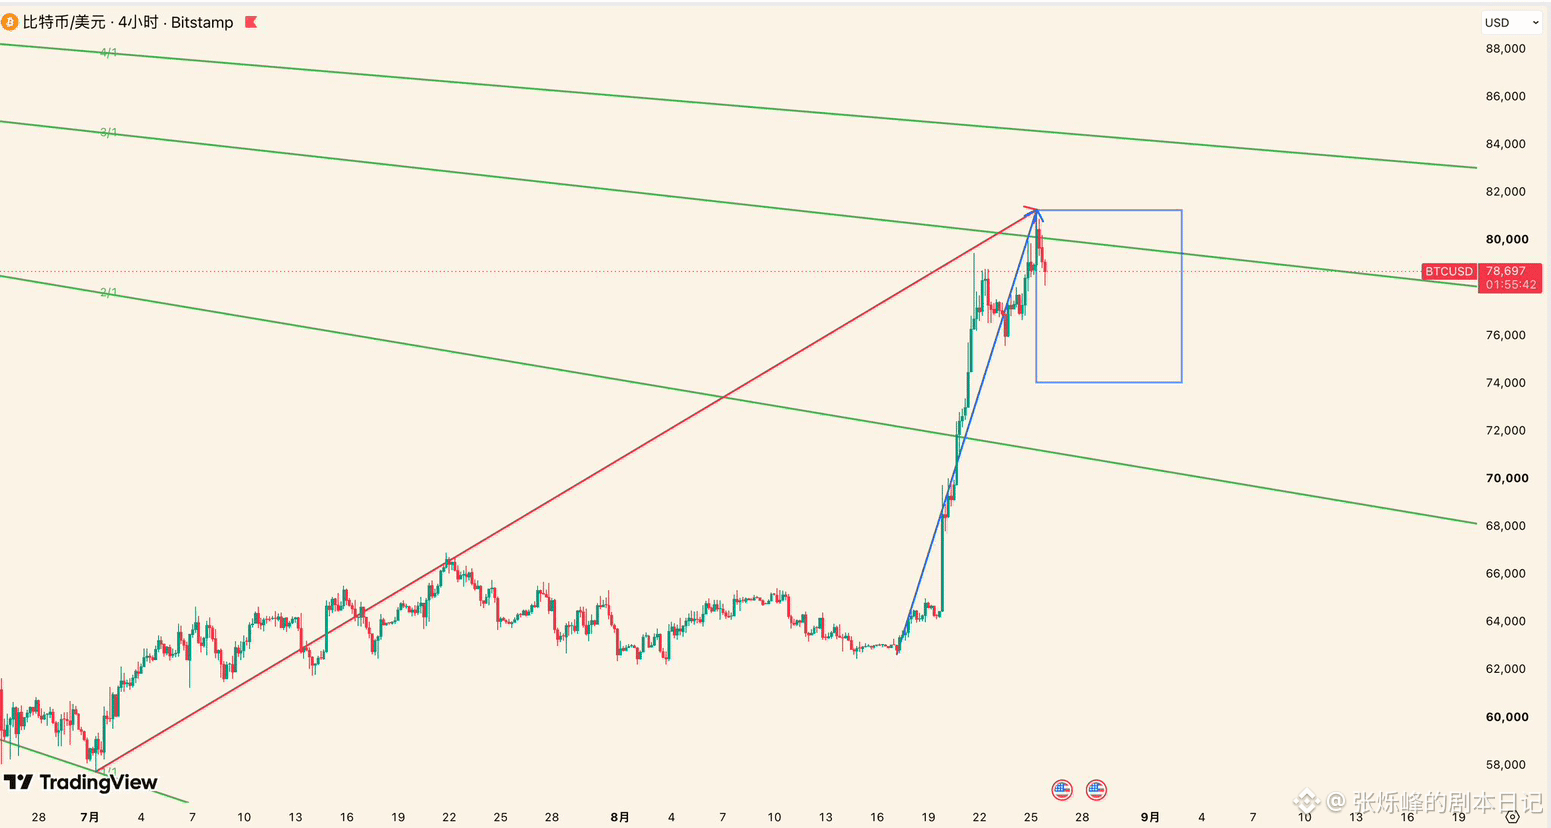
The BTC stage low point proposed in June occurred on JUNE 1 according to Gann time. After that, BTC rose from 57,800 on July 1 to 79,500. In an article dated August 22, it was explicitly stated that BTC’s rise would not stop at 79,500. Then on August 25, a new high of 81,272 appeared.
Is BTC’s rally over now? Will it continue rising? To give a direct conclusion—most likely, the rally that started from 57,800 has not yet ended.
The decline from 81,272 should be temporarily viewed as a small pullback within the larger uptrend, not a pullback against the entire blue segment or the entire red segment shown in the chart. In the next few days, it should break through and stabilize above 80,000 as soon as possible. If it holds above that level, the rally will still have momentum.
If it keeps failing to break above 80,000, and instead falls below 77,220, then it will most likely begin running a pullback targeting the rally in the blue segment. Along that path, after finding the end point of the pullback, it is still expected to rise into the week of September 5.
The most recent resistance level above is 82,000. The watershed for the market is 84,000. Whether 84,000 can be broken will determine the market trend for the next four months—the earlier the breakout, the better.$BTC
#加密恐惧贪婪指数升至74
Is BTC’s rally over now? Will it continue rising? To give a direct conclusion—most likely, the rally that started from 57,800 has not yet ended.
The decline from 81,272 should be temporarily viewed as a small pullback within the larger uptrend, not a pullback against the entire blue segment or the entire red segment shown in the chart. In the next few days, it should break through and stabilize above 80,000 as soon as possible. If it holds above that level, the rally will still have momentum.
If it keeps failing to break above 80,000, and instead falls below 77,220, then it will most likely begin running a pullback targeting the rally in the blue segment. Along that path, after finding the end point of the pullback, it is still expected to rise into the week of September 5.
The most recent resistance level above is 82,000. The watershed for the market is 84,000. Whether 84,000 can be broken will determine the market trend for the next four months—the earlier the breakout, the better.$BTC
#加密恐惧贪婪指数升至74
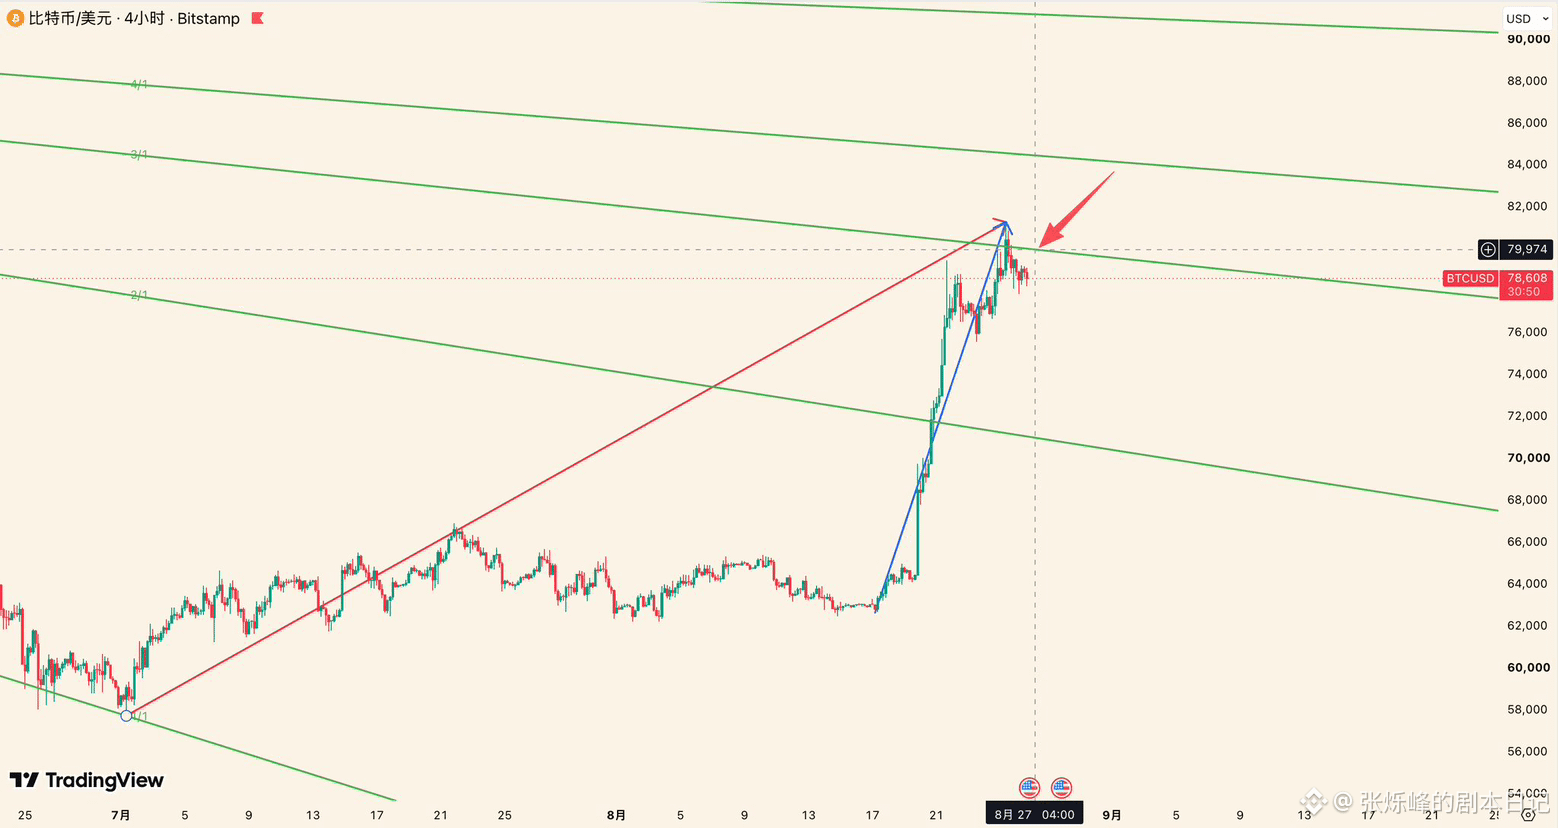
Since we proposed July 1 as the stage low at the end of June, BTC’s rise has already reached 40%+! The appearance of a major market turning point is getting closer and closer—what should we do next?
As shown in Figure 1, in the Aug 22 article I clearly stated that BTC’s rally would not stop at 79,500, and today we saw a new high—81,272.
After rising to 81,272, it quickly pulled back. The Green Gann angle line 3/1 (80,100) is the nearest resistance level. If over the next two days we can see BTC’s daily chart hold steady above this level, it would indicate that the uptrend still has momentum and it may soon test the next resistance at 82,000, and even test the core resistance zone around 84,000—on which case the high-point timing may come earlier.
If it cannot hold above, then it will start running in a range—at minimum, a pullback targeting the blue segment rise shown in Figure 2. 74,000 is a key watershed level. If price breaks below it, the pullback could expand into a retracement targeting the entire rise of the red segment.
Today is already Aug 25. Each day, each hour, keeps bringing us closer to our high-point observation time, and the rebound structure starting from 57,800 is approaching completion.
For longs, the only favorable scenario is for price to continue rising quickly. Aside from that—whether it’s a pullback for the blue segment, a larger pullback, or sideways consolidation—none of these are favorable for longs. Because they would increase the probability that the rebound from 57,800 is part of the decline from 98,000 to 57,800. As mentioned last week, along this path Q4 might still see a low point. #比特币受阻于81000美元50周均线 $BTC
As shown in Figure 1, in the Aug 22 article I clearly stated that BTC’s rally would not stop at 79,500, and today we saw a new high—81,272.
After rising to 81,272, it quickly pulled back. The Green Gann angle line 3/1 (80,100) is the nearest resistance level. If over the next two days we can see BTC’s daily chart hold steady above this level, it would indicate that the uptrend still has momentum and it may soon test the next resistance at 82,000, and even test the core resistance zone around 84,000—on which case the high-point timing may come earlier.
If it cannot hold above, then it will start running in a range—at minimum, a pullback targeting the blue segment rise shown in Figure 2. 74,000 is a key watershed level. If price breaks below it, the pullback could expand into a retracement targeting the entire rise of the red segment.
Today is already Aug 25. Each day, each hour, keeps bringing us closer to our high-point observation time, and the rebound structure starting from 57,800 is approaching completion.
For longs, the only favorable scenario is for price to continue rising quickly. Aside from that—whether it’s a pullback for the blue segment, a larger pullback, or sideways consolidation—none of these are favorable for longs. Because they would increase the probability that the rebound from 57,800 is part of the decline from 98,000 to 57,800. As mentioned last week, along this path Q4 might still see a low point. #比特币受阻于81000美元50周均线 $BTC
Bitcoin’s encrypted cow is coming—storing the fire out? BTC and ETH strongly break through, SNDK and SPCX will usher in a key milestone next week:#比特币创2023年3月来最强周涨幅 $BTC $ETH $XAU #xau
Is ETH rebounding or is a bull run coming? How much room is left up there? Keep an eye on this line:
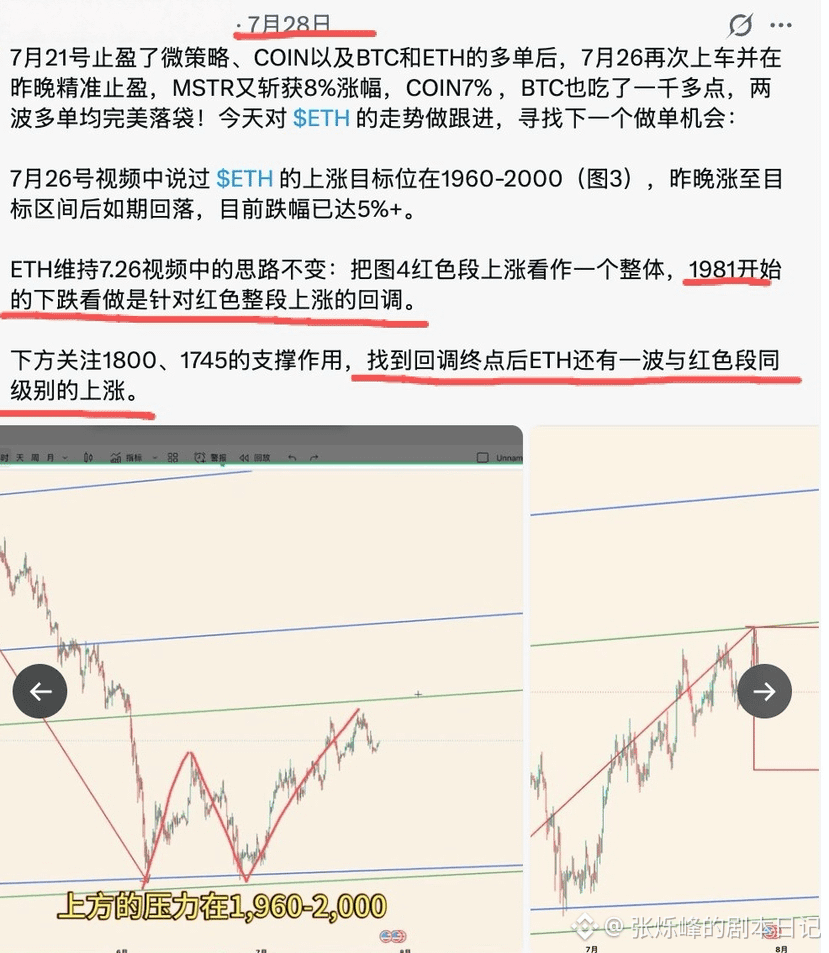
As early as in my tweet on July 28, I made my position clear—I said that from 1981 it was a pullback, and once the pullback ended, ETH would continue to rise. (Chart 1)
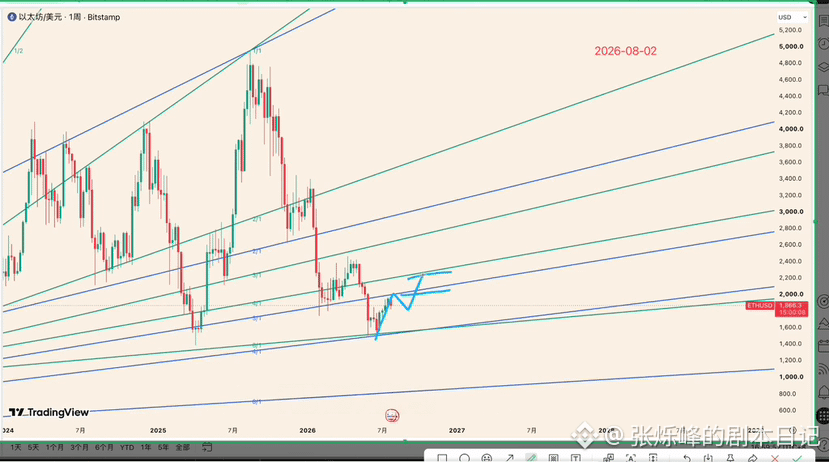
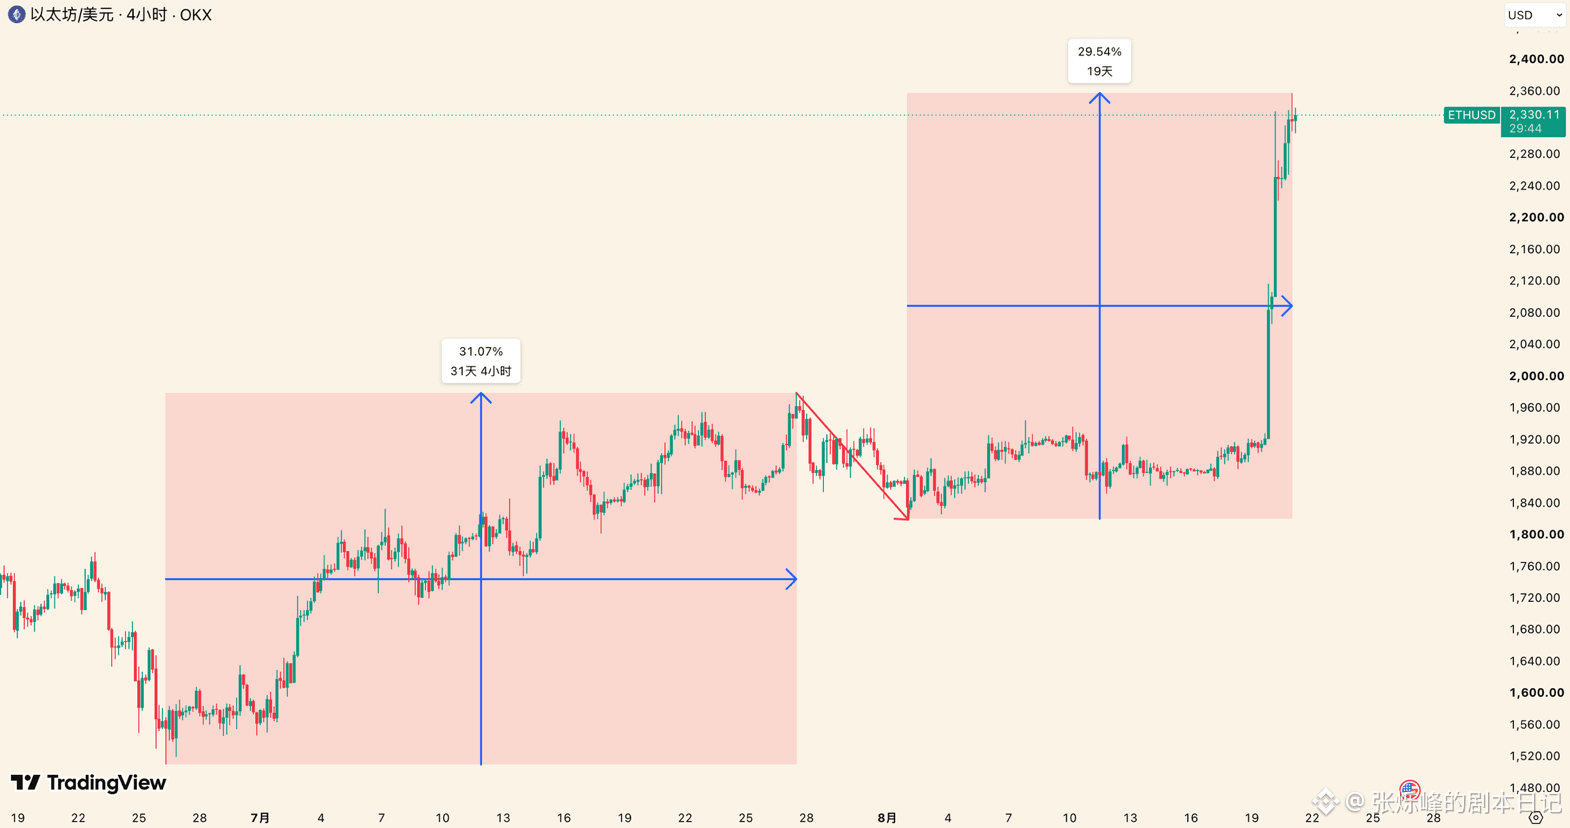
Then, in my video analysis on August 2, I provided a detailed breakdown of this view, including my expectations for ETH’s price action (Chart 2). Now, this has already been verified (Chart 3).
Judging from both the duration and the magnitude of the rally, it is entirely reasonable to treat the two upswings shown in Chart 3 as being on the same level. So, has the rally from 1820 ended? When could it end?
The closest observation point above us is 2355.8. If the daily K-line can close above this level, the upward move still has momentum. If price is at this level and below, and it faces pressure, it may trigger a pullback.
As shown in Chart 4, the key level below to watch is 4222. As long as there are no three consecutive daily K-line bodies that close below this level, any declines can be considered a pullback within the broader uptrend. That pullback would be relatively minor and would not break the upward trend. Only after this level is subsequently confirmed to have failed can we say the rally is coming to an end, and that a pullback targeting the entire uptrend that began from 1820 may occur.
For the higher-level judgment, I’m still sticking to the viewpoint from my August 2 video: the rally starting from 1500 has a high probability of being a major-level rebound, and we are already at the transition point from the late stage of a bear market toward the shift between bear and bull.
Trading is very subjective, but I still prefer to express my subjective viewpoint in a more objective way—just for your reference. $ETH
#ETH走势分析
As early as in my tweet on July 28, I made my position clear—I said that from 1981 it was a pullback, and once the pullback ended, ETH would continue to rise. (Chart 1)
Then, in my video analysis on August 2, I provided a detailed breakdown of this view, including my expectations for ETH’s price action (Chart 2). Now, this has already been verified (Chart 3).
Judging from both the duration and the magnitude of the rally, it is entirely reasonable to treat the two upswings shown in Chart 3 as being on the same level. So, has the rally from 1820 ended? When could it end?
The closest observation point above us is 2355.8. If the daily K-line can close above this level, the upward move still has momentum. If price is at this level and below, and it faces pressure, it may trigger a pullback.
As shown in Chart 4, the key level below to watch is 4222. As long as there are no three consecutive daily K-line bodies that close below this level, any declines can be considered a pullback within the broader uptrend. That pullback would be relatively minor and would not break the upward trend. Only after this level is subsequently confirmed to have failed can we say the rally is coming to an end, and that a pullback targeting the entire uptrend that began from 1820 may occur.
For the higher-level judgment, I’m still sticking to the viewpoint from my August 2 video: the rally starting from 1500 has a high probability of being a major-level rebound, and we are already at the transition point from the late stage of a bear market toward the shift between bear and bull.
Trading is very subjective, but I still prefer to express my subjective viewpoint in a more objective way—just for your reference. $ETH
#ETH走势分析
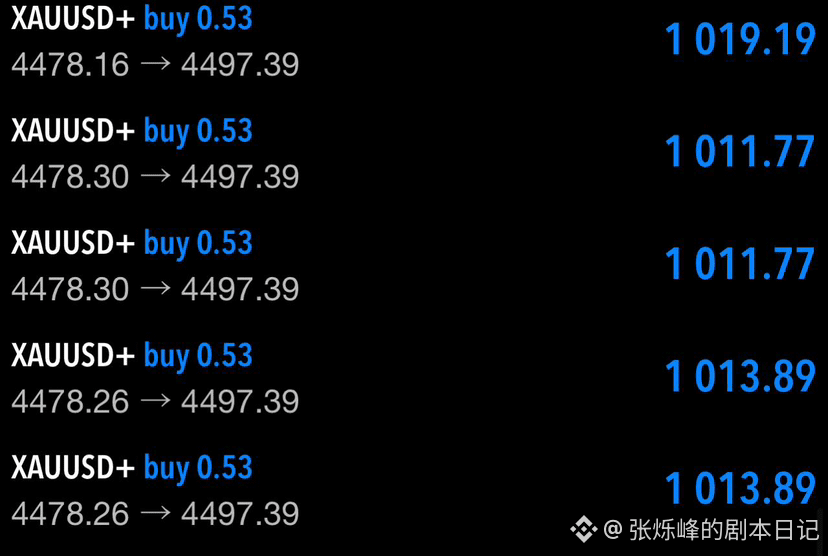
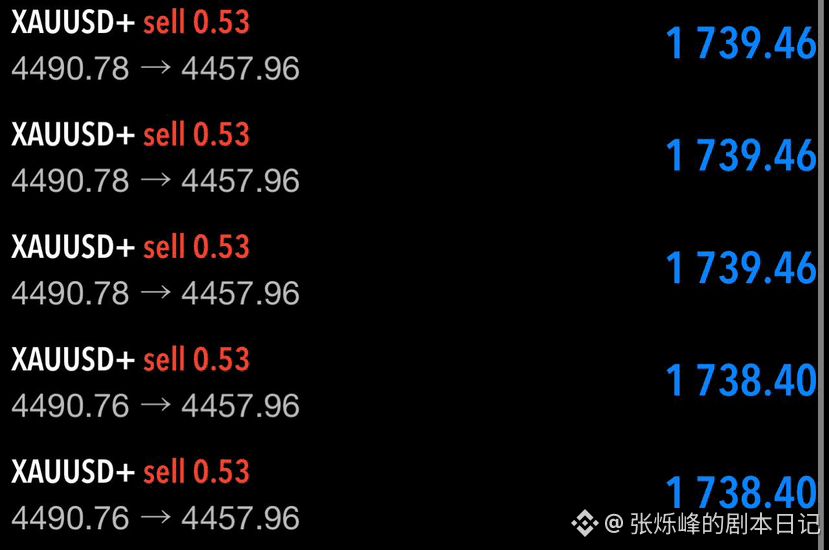
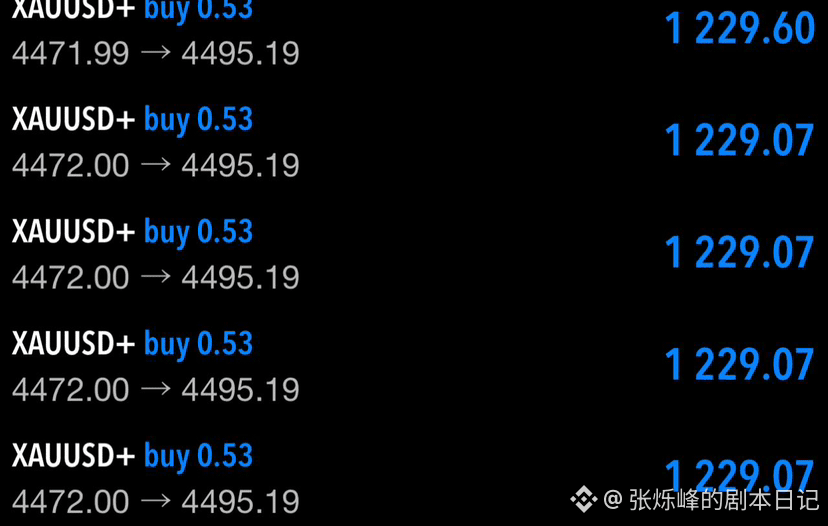
In yesterday’s tweets, we said that XAU should rise at least to the resistance range 4520–4578.
Now gold is once again attacking this resistance zone. Friends holding long positions in gold should watch how this breakout plays out.
#xau $XAU #Gold
Now gold is once again attacking this resistance zone. Friends holding long positions in gold should watch how this breakout plays out.
#xau $XAU #Gold
张烁峰的剧本日记
·
--
XAU Gold Market Analysis 2026.08.19
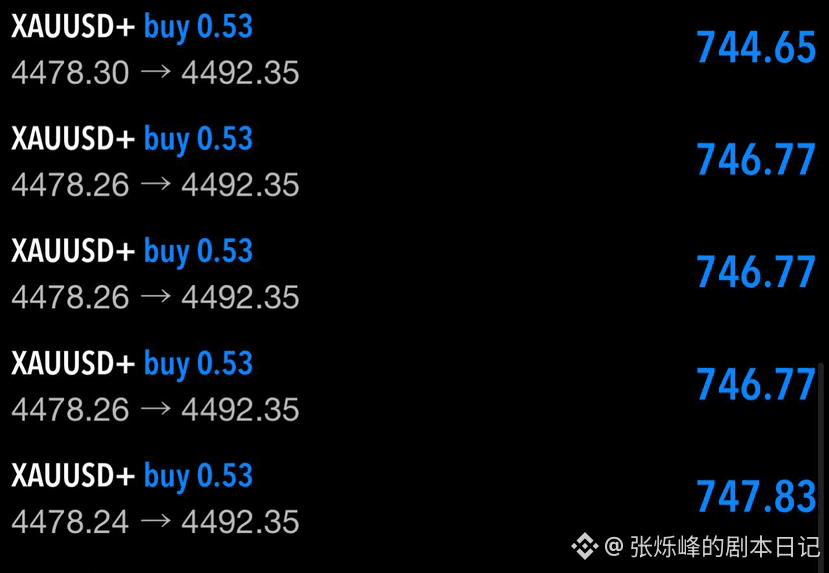
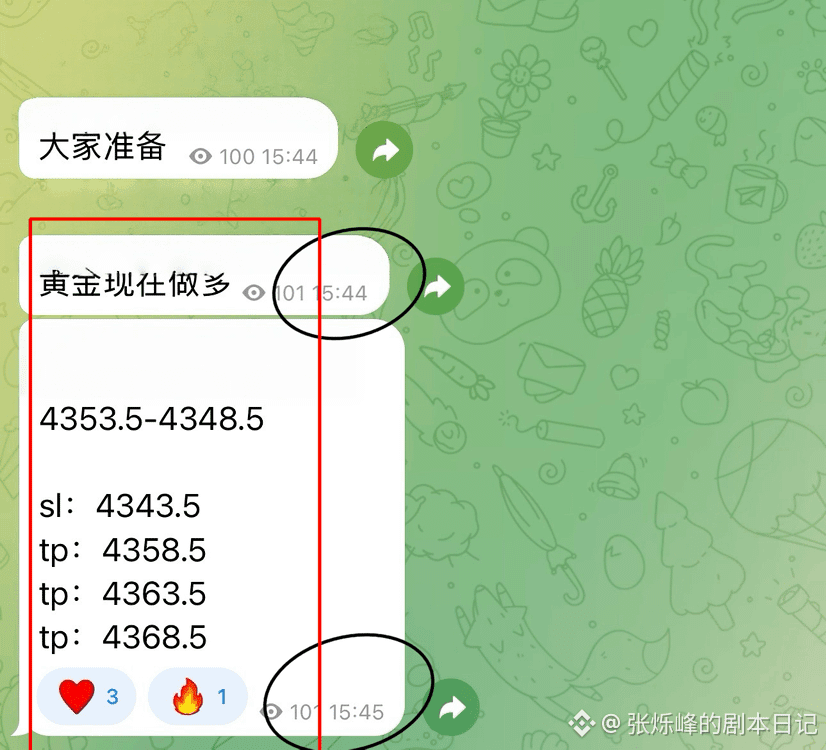
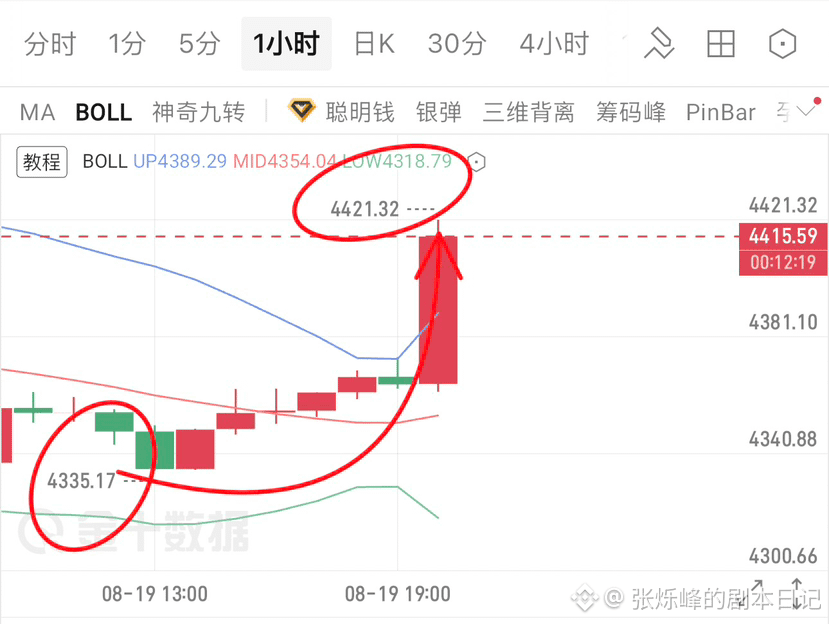
As a blogger who, in March 2026, indicated that gold should start falling and then precisely nailed the following 90-day market (Figure 1), and also as an independent trader who pointed out the start of a major-scale rebound at 4,000 (Figure 2). Today, from both the higher timeframe and lower timeframe perspectives, I’ll talk with everyone about gold’s outlook going forward:
As shown in Figure 3, what started running from 5595 is a pullback targeting the rise in the period beginning with 1643. This pullback belongs to the same monthly-line level as Pullback 1 in Figure 3, which lasted 7,183 days, and also as Pullback 2, which accumulated a drawdown of 45.19%.
Does this mean that the pullback starting from 5595 also needs to last for many years? Straight to the conclusion—I believe this round of pullback may become the shortest-duration, smallest-drawdown monthly-line level pullback in gold’s history. After the pullback ends, gold will rise to 6974.62+
As shown in Figure 3, what started running from 5595 is a pullback targeting the rise in the period beginning with 1643. This pullback belongs to the same monthly-line level as Pullback 1 in Figure 3, which lasted 7,183 days, and also as Pullback 2, which accumulated a drawdown of 45.19%.
Does this mean that the pullback starting from 5595 also needs to last for many years? Straight to the conclusion—I believe this round of pullback may become the shortest-duration, smallest-drawdown monthly-line level pullback in gold’s history. After the pullback ends, gold will rise to 6974.62+
Encrypted concept stocks surged broadly, is CRCL getting better? In three minutes, understand the outlook for CRCL over the next three months: $CRCL #crcl
BTC Major Update!2026.08.20
At the end of June, we precisely captured the turning point of 82,850 downward moves—the Gann low point timing on July 1. After that, BTC bottomed out at 57,800, and as of now the increase has reached 20%+.
Old friends should remember: I repeatedly emphasized that before the stage high-point timing in late August to early September, the rebound from 57,800 would not be over. Today, we provide a more precise location for this important Gann high-point timing:
I believe the Gann high point/turning point time corresponding to 57,800 will most likely fall in the week of September 6 or September 10. If it’s the former, it would occur in the second half of the week; if it’s the latter, then it would be in the first half. (The specific day will be determined based on the pace of the market action. Real-time analysis will be updated in the internal channel.)
This judgment is based on the time proportion rules in Gann theory and our structural breakdown of BTC from 57,800:
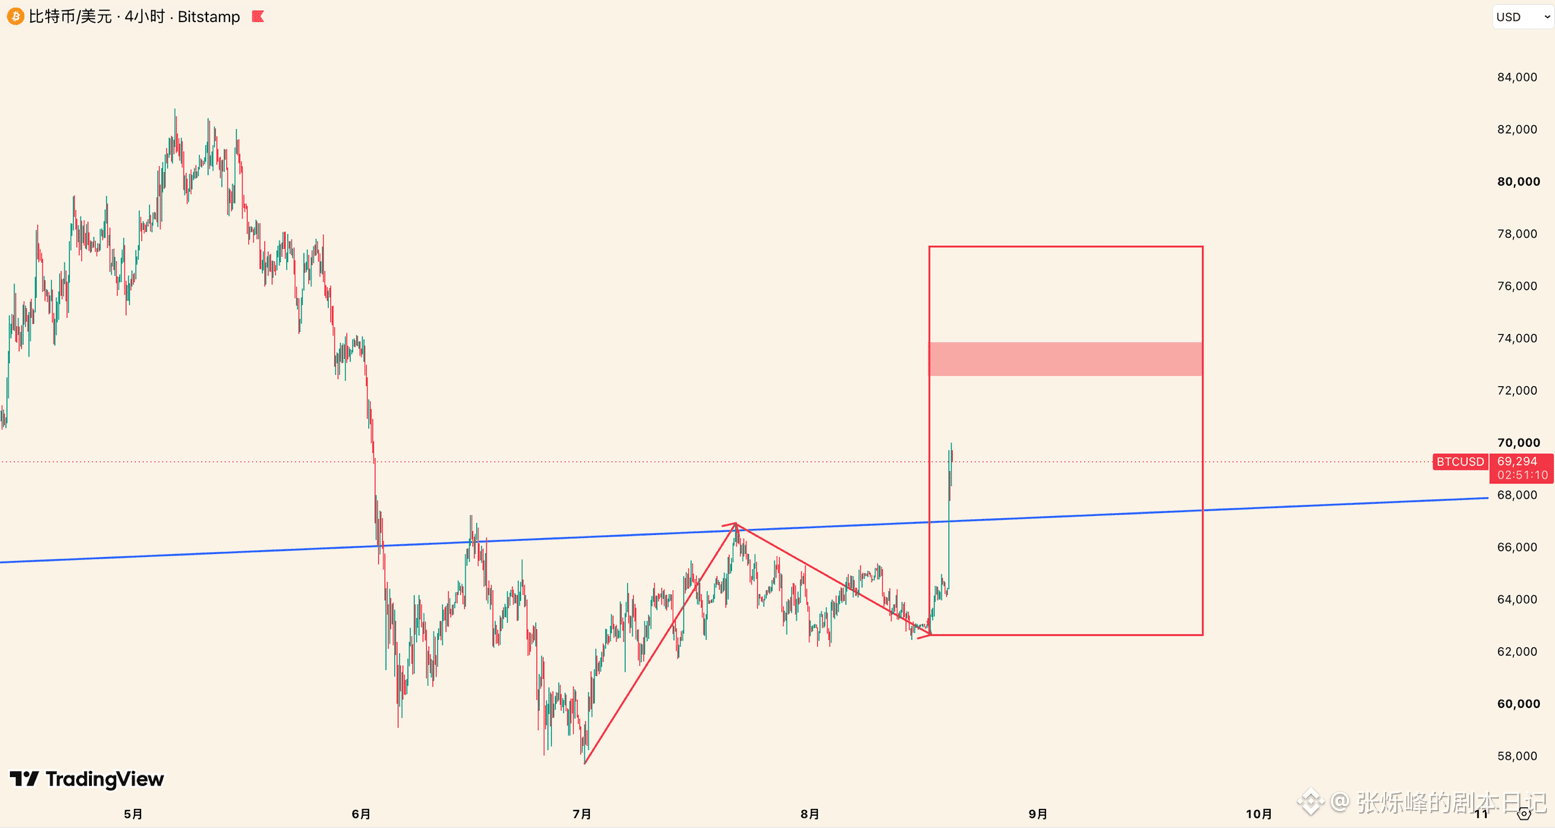
As shown in Figure 1, 57,800–66,956 is an uptrend. When BTC rose to above 66,900, I indicated that this area needed a pullback—but it was only a pullback. The earliest it could end was before August 17. After that, there was another leg of upward movement. This view has already been validated.
In the August 17 post, I said that if it broke above 65,400, the right-side confirmation would indicate the pullback had ended. The subsequent upward movement is similar to the 57,800–66,956 range. Why couldn’t that day confirm? The core reason is that BTC was moving sideways; the extreme time chart didn’t show a reaction, so we couldn’t make a conclusion—we could only confirm from the right side.
Fortunately, at that time, MSTR already showed signs that its adjustment had ended. So the group promptly notified members to enter the position with the clearer MSTR structure—and of course, MSTR didn’t disappoint.
The next plan is simple: As long as BTC does not show three consecutive daily candlesticks with real bodies breaking below the blue Gann angle line at 67,100, we treat it as a pullback in the upswing from 62,500. Pullbacks during an uptrend are normal and will not change the uptrend.
The key resistance zone above to reference is 72,700–73,900. The Gann time to watch is the week of September 6/September 10. #BTC走势分析 $BTC
At the end of June, we precisely captured the turning point of 82,850 downward moves—the Gann low point timing on July 1. After that, BTC bottomed out at 57,800, and as of now the increase has reached 20%+.
Old friends should remember: I repeatedly emphasized that before the stage high-point timing in late August to early September, the rebound from 57,800 would not be over. Today, we provide a more precise location for this important Gann high-point timing:
I believe the Gann high point/turning point time corresponding to 57,800 will most likely fall in the week of September 6 or September 10. If it’s the former, it would occur in the second half of the week; if it’s the latter, then it would be in the first half. (The specific day will be determined based on the pace of the market action. Real-time analysis will be updated in the internal channel.)
This judgment is based on the time proportion rules in Gann theory and our structural breakdown of BTC from 57,800:
As shown in Figure 1, 57,800–66,956 is an uptrend. When BTC rose to above 66,900, I indicated that this area needed a pullback—but it was only a pullback. The earliest it could end was before August 17. After that, there was another leg of upward movement. This view has already been validated.
In the August 17 post, I said that if it broke above 65,400, the right-side confirmation would indicate the pullback had ended. The subsequent upward movement is similar to the 57,800–66,956 range. Why couldn’t that day confirm? The core reason is that BTC was moving sideways; the extreme time chart didn’t show a reaction, so we couldn’t make a conclusion—we could only confirm from the right side.
Fortunately, at that time, MSTR already showed signs that its adjustment had ended. So the group promptly notified members to enter the position with the clearer MSTR structure—and of course, MSTR didn’t disappoint.
The next plan is simple: As long as BTC does not show three consecutive daily candlesticks with real bodies breaking below the blue Gann angle line at 67,100, we treat it as a pullback in the upswing from 62,500. Pullbacks during an uptrend are normal and will not change the uptrend.
The key resistance zone above to reference is 72,700–73,900. The Gann time to watch is the week of September 6/September 10. #BTC走势分析 $BTC


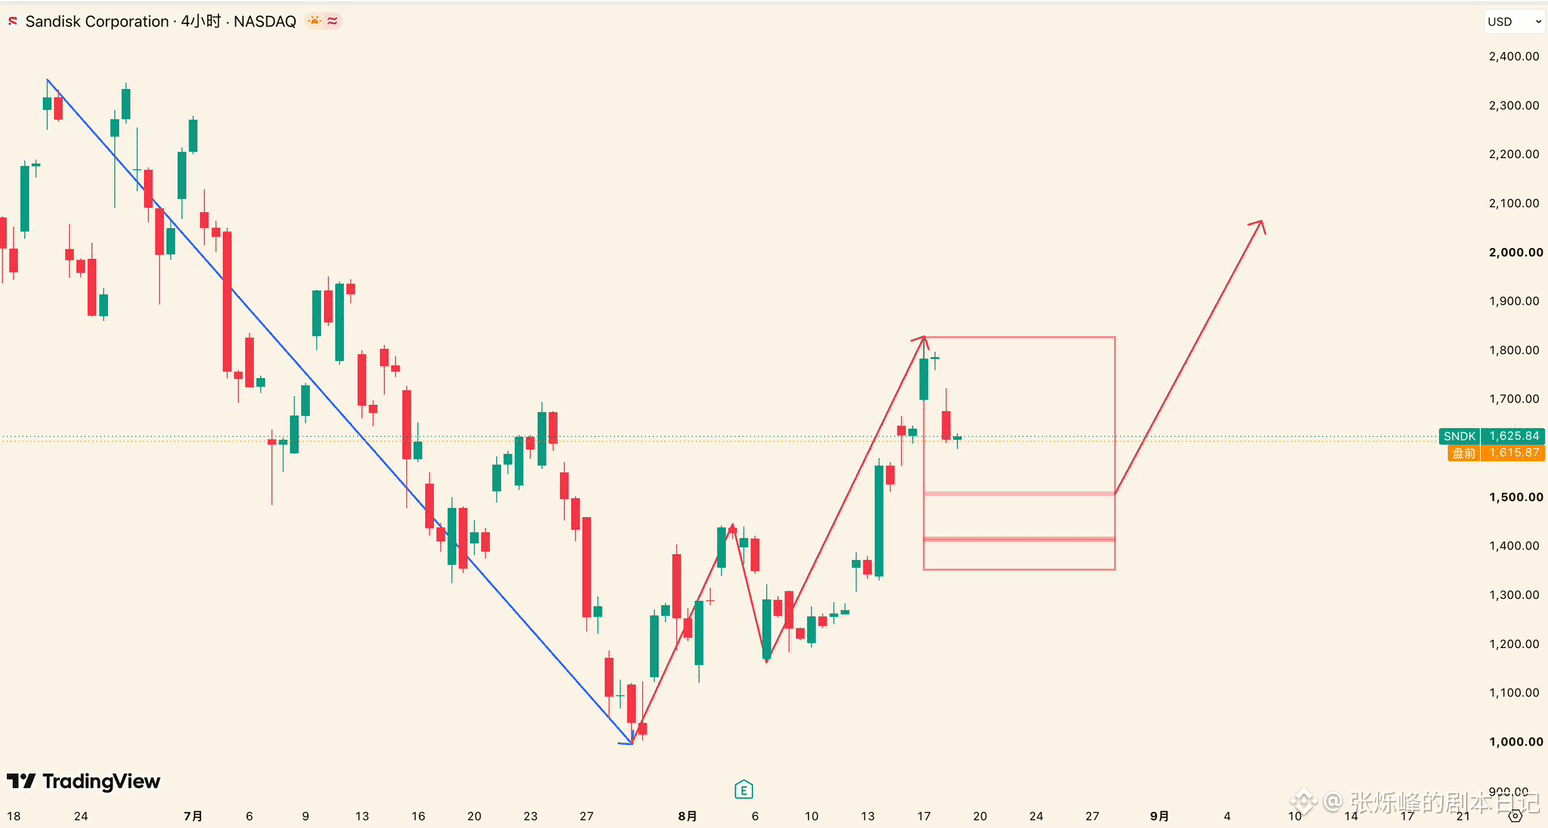
SNDK's rebound that started from 998.19 is very likely not over yet. What is currently happening is just a pullback within this rebound, not a callback for the entire rebound.
If we can confirm that support works at levels like 1512 and 1413, there may be a good opportunity to get in. This is the standard right-side entry for going long—with a clear stop-loss and a reasonable risk-reward ratio.
Has the pullback ended? As long as today's daily K cannot close above 1740, my subjective view is that the pullback has not ended. But that doesn’t mean that I don’t need to chase shorts right now, immediately, or at once. I will wait patiently for it to enter my strike zone.
What if SNDK simply refuses to pull back and keeps rising? Then let it go. Missing a move that doesn’t belong to your own setup is far better than—out of fear of missing out—making a trade you’re not confident in. Wait for the next clear structure to appear, then make a strategy based on the chart.
My habit has always been to think through the best expectations and the worst possible outcomes before building a position. Only place the bet after you’re able to endure the worst-case scenario.
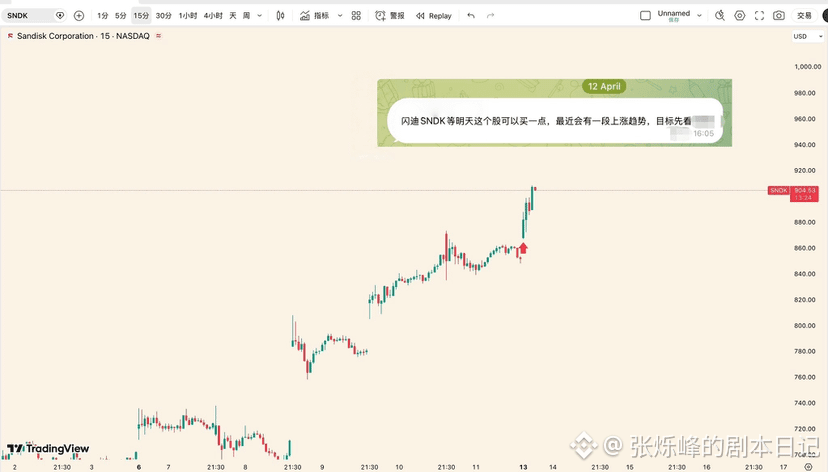
For example, when I notified everyone to get on board with SNDK on April 12, 2026, I had already prepared both for the upside expectation of reaching 1800+ and also for the possibility of dropping below 860. If it went right—then it was a huge win. If it went wrong—the stop-loss was still acceptable.
What truly matters in trading is never demanding that the market must follow your script, but rather that no matter which answer the market ultimately gives, you can accept it.
But what are most people like? They start by assuming a script—believing the market must run exactly that way—then they look for all kinds of news and various teachers’ viewpoints to validate it, giving themselves psychological comfort. When their emotions run hot, they place a heavy bet. Then they pray that the market will run according to their expectation.
Is that you? $SNDK #sndk
If we can confirm that support works at levels like 1512 and 1413, there may be a good opportunity to get in. This is the standard right-side entry for going long—with a clear stop-loss and a reasonable risk-reward ratio.
Has the pullback ended? As long as today's daily K cannot close above 1740, my subjective view is that the pullback has not ended. But that doesn’t mean that I don’t need to chase shorts right now, immediately, or at once. I will wait patiently for it to enter my strike zone.
What if SNDK simply refuses to pull back and keeps rising? Then let it go. Missing a move that doesn’t belong to your own setup is far better than—out of fear of missing out—making a trade you’re not confident in. Wait for the next clear structure to appear, then make a strategy based on the chart.
My habit has always been to think through the best expectations and the worst possible outcomes before building a position. Only place the bet after you’re able to endure the worst-case scenario.
For example, when I notified everyone to get on board with SNDK on April 12, 2026, I had already prepared both for the upside expectation of reaching 1800+ and also for the possibility of dropping below 860. If it went right—then it was a huge win. If it went wrong—the stop-loss was still acceptable.
What truly matters in trading is never demanding that the market must follow your script, but rather that no matter which answer the market ultimately gives, you can accept it.
But what are most people like? They start by assuming a script—believing the market must run exactly that way—then they look for all kinds of news and various teachers’ viewpoints to validate it, giving themselves psychological comfort. When their emotions run hot, they place a heavy bet. Then they pray that the market will run according to their expectation.
Is that you? $SNDK #sndk
Log in to explore more content