
Dorie Masar ZPMW
86 Posts

Dorie Masar ZPMW
43 Following
40 Followers
0 Liked
Posts
All
Quotes
BigWhale Trading
·
--
GOLD IS ABOUT TO REPEAT 1979 — AND THIS IS THE PART PEOPLE IGNORE
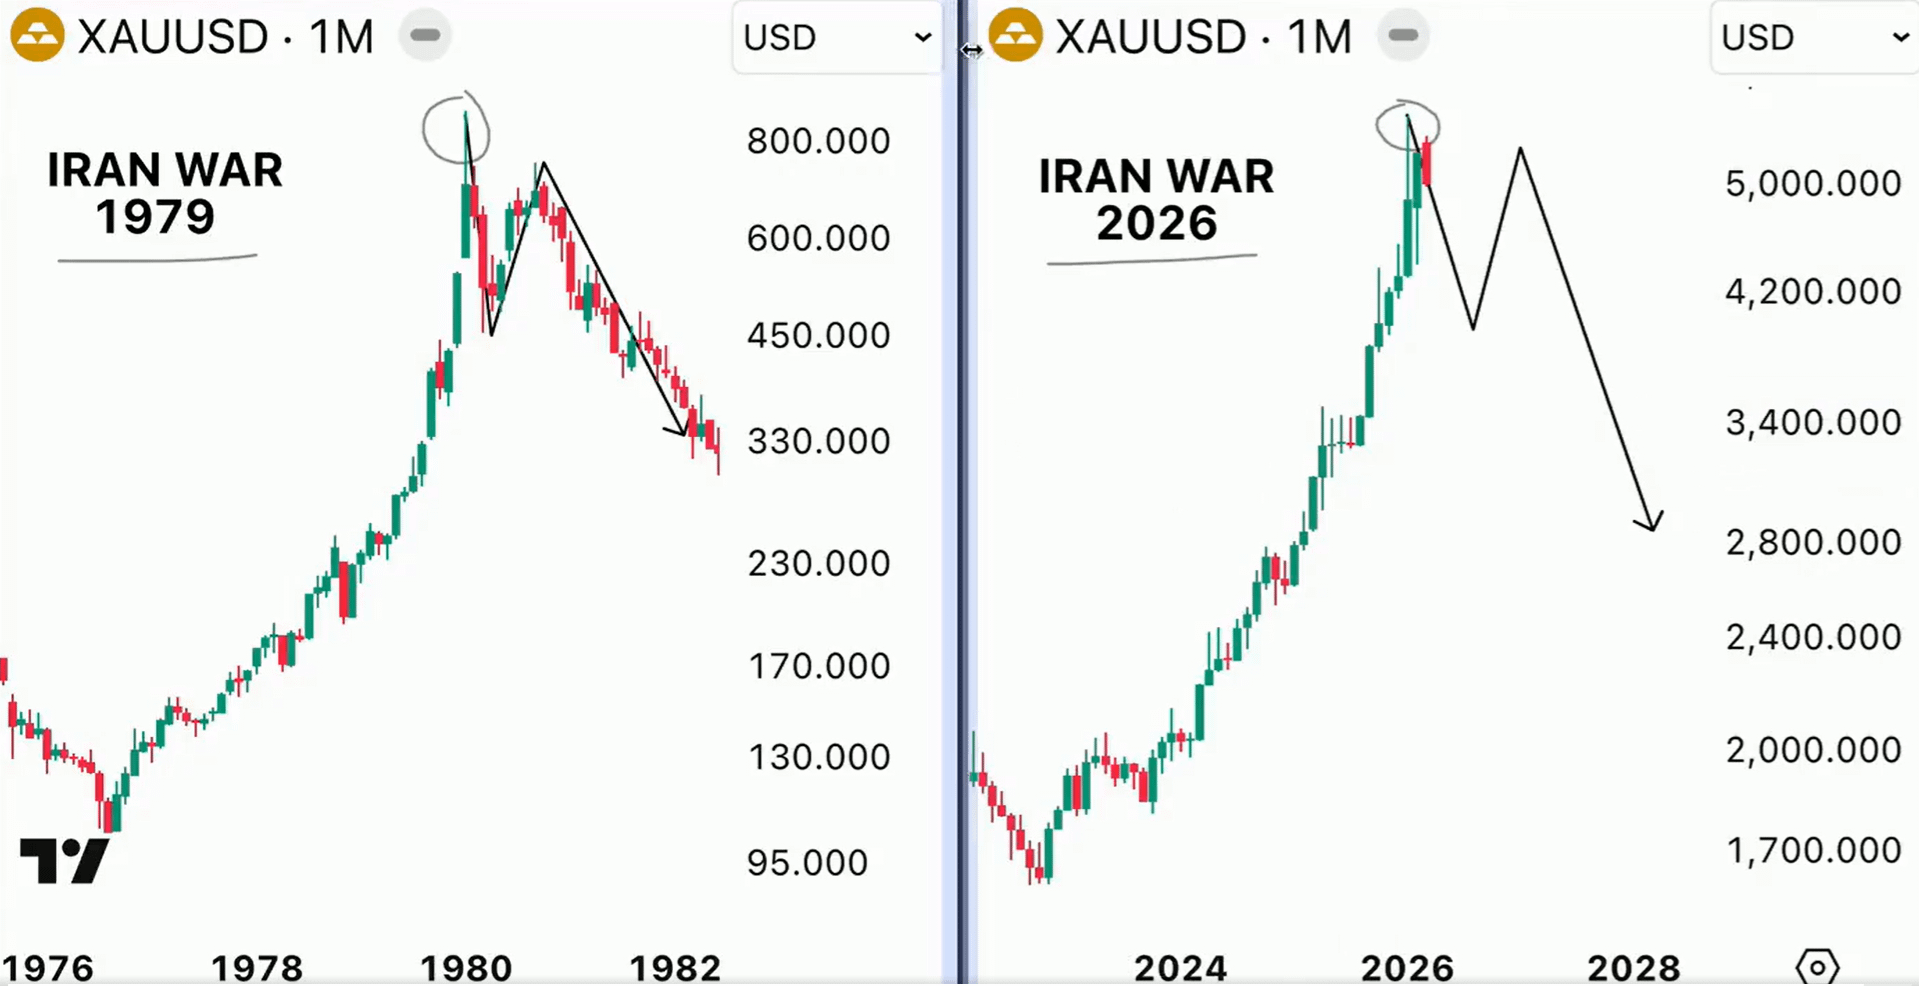
Everyone remembers the first half of 1979 Oil Crisis: war tensions, oil exploding, gold going parabolic from ~$200 to $850. It looked like the beginning of a new era.
But the real story came after.
The Federal Reserve lost control of inflation, then overcorrected. Rates were pushed toward 20%, liquidity was drained, and gold didn’t protect people… it collapsed from $850 to $300.
Now look at today.
2026 setup is starting to rhyme:
Iran conflict escalating
Oil pushing higher again
Supply stress building
Inflation quietly returning
This is where most people get it wrong.
They think gold is safety.
Gold is only safe until central banks react.
Here’s the trap:
As long as liquidity is loose → gold rises
But when inflation forces tightening → gold becomes the victim
If oil keeps pushing inflation higher, central banks — led by the Federal Reserve — may have no choice but to stay restrictive or even tighten again.
That’s when the shift happens.
Not during the crisis
But after it
Think about positioning:
Retail is buying gold for safety
Narrative is strong
Confidence is building
That’s exactly when risk is highest.
If history rhymes, the sequence is simple:
Crisis → gold rally
Policy reaction → liquidity drain
Then → sharp repricing down
Gold doesn’t crash when fear is high
It crashes when policy turns against it
And we are getting closer to that moment than most people realize
Follow for early signals before the shift happens
Everyone remembers the first half of 1979 Oil Crisis: war tensions, oil exploding, gold going parabolic from ~$200 to $850. It looked like the beginning of a new era.
But the real story came after.
The Federal Reserve lost control of inflation, then overcorrected. Rates were pushed toward 20%, liquidity was drained, and gold didn’t protect people… it collapsed from $850 to $300.
Now look at today.
2026 setup is starting to rhyme:
Iran conflict escalating
Oil pushing higher again
Supply stress building
Inflation quietly returning
This is where most people get it wrong.
They think gold is safety.
Gold is only safe until central banks react.
Here’s the trap:
As long as liquidity is loose → gold rises
But when inflation forces tightening → gold becomes the victim
If oil keeps pushing inflation higher, central banks — led by the Federal Reserve — may have no choice but to stay restrictive or even tighten again.
That’s when the shift happens.
Not during the crisis
But after it
Think about positioning:
Retail is buying gold for safety
Narrative is strong
Confidence is building
That’s exactly when risk is highest.
If history rhymes, the sequence is simple:
Crisis → gold rally
Policy reaction → liquidity drain
Then → sharp repricing down
Gold doesn’t crash when fear is high
It crashes when policy turns against it
And we are getting closer to that moment than most people realize
Follow for early signals before the shift happens
Quoted content has been removed


闪电客-霖哥
·
--
#合约养家
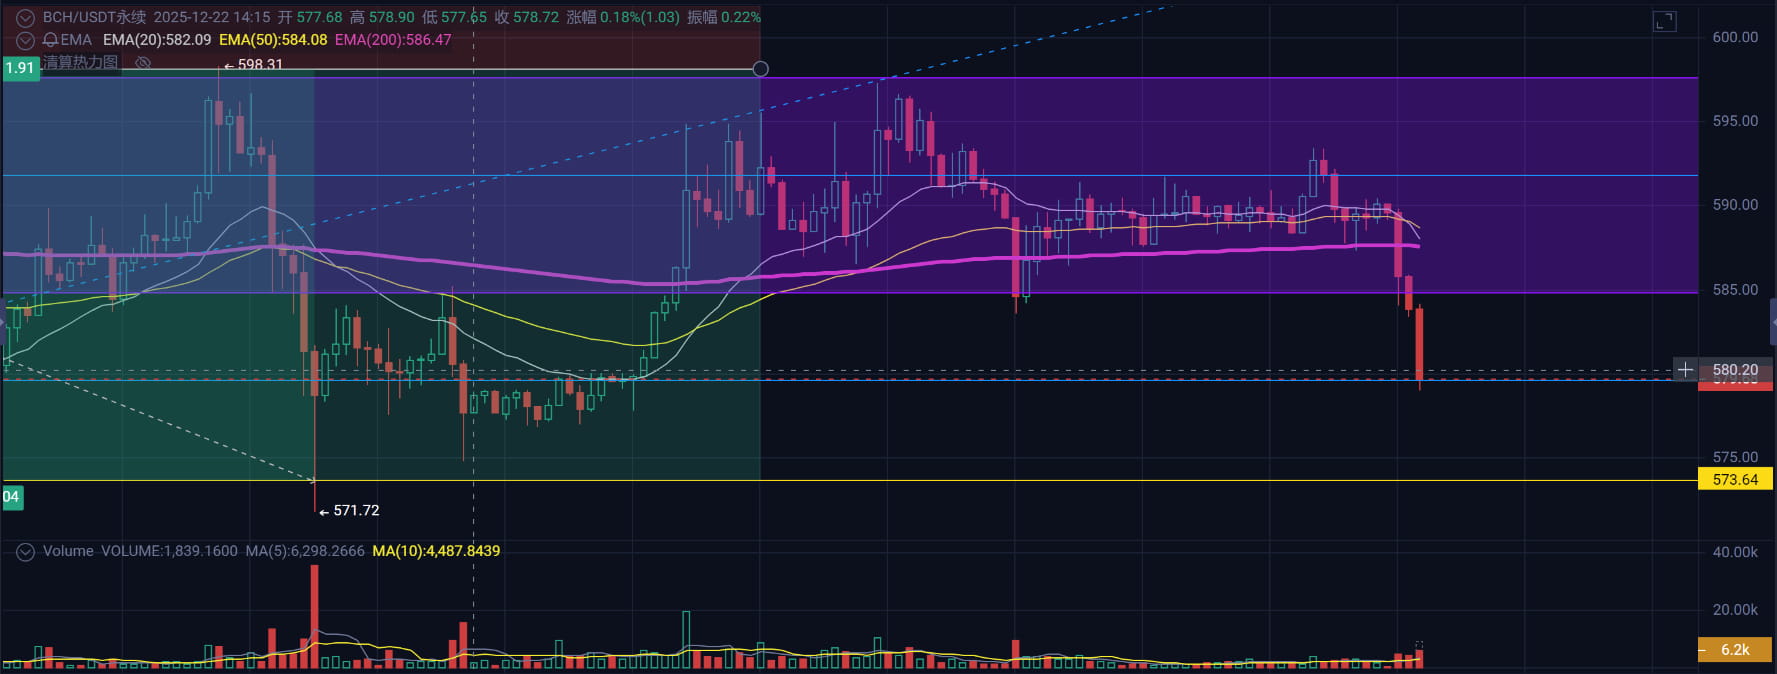
📚It is said that $BCH and $ZEC are the same and will give everyone 💰, and it turns out to be true. This market situation is indeed difficult for spot traders, but for futures traders, making swings can yield a lot of profit 😁. As long as you have time to monitor the market and set proper take profit and stop loss, overall you can still achieve good returns in a month. I have already shared my account for everyone to try!
📚It is said that $BCH and $ZEC are the same and will give everyone 💰, and it turns out to be true. This market situation is indeed difficult for spot traders, but for futures traders, making swings can yield a lot of profit 😁. As long as you have time to monitor the market and set proper take profit and stop loss, overall you can still achieve good returns in a month. I have already shared my account for everyone to try!

Silvan 亮哥
·
--
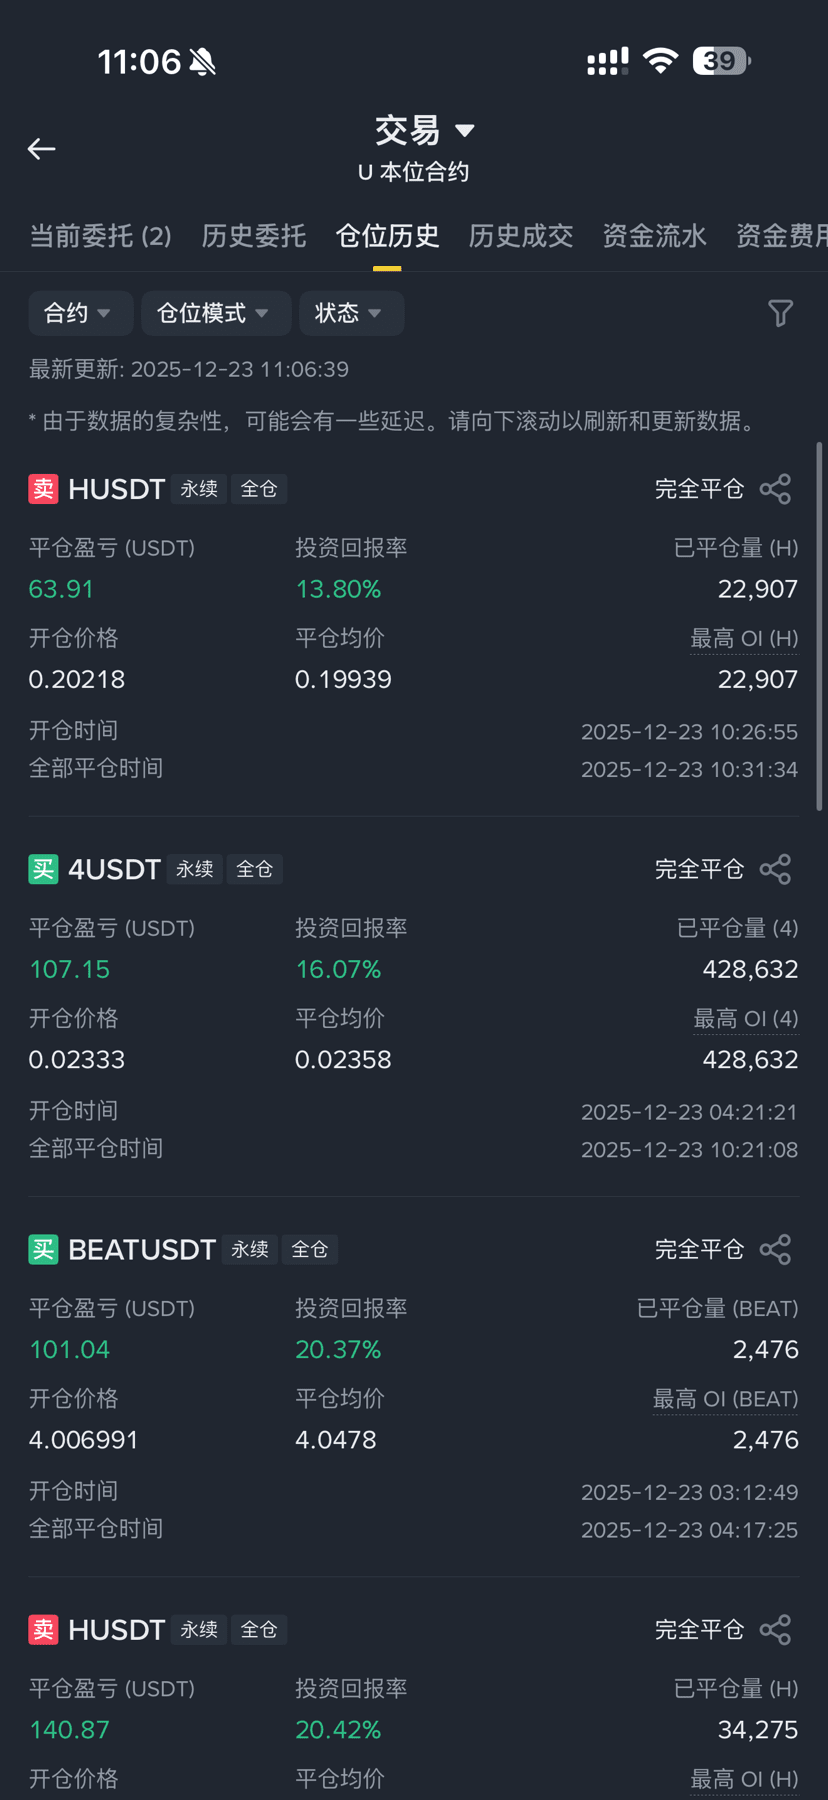
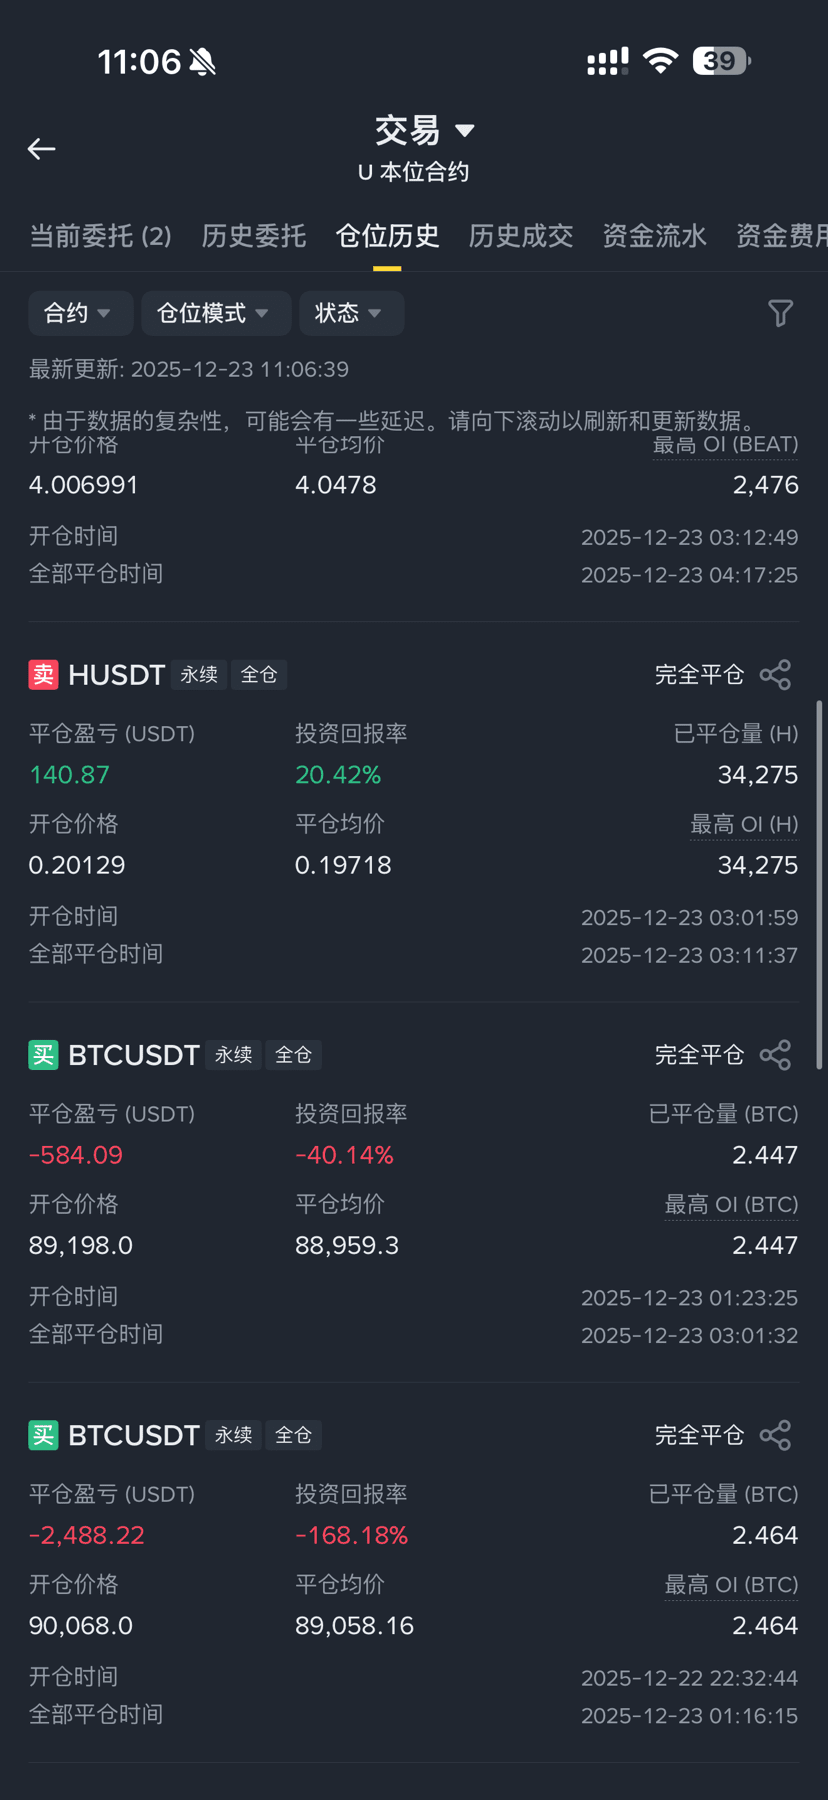
BearishThe pain of profit drawdown 😣, who understands, the real trading these days is really tough, $BTC

QAZAXLI3535
·
--
BullishSubscribe to our Twitter account and let's grow together.
@QAZAXLI3535 #QAZAXLI3535 #bitcoin $BNB
@QAZAXLI3535 #QAZAXLI3535 #bitcoin $BNB

Skiff cc
·
--
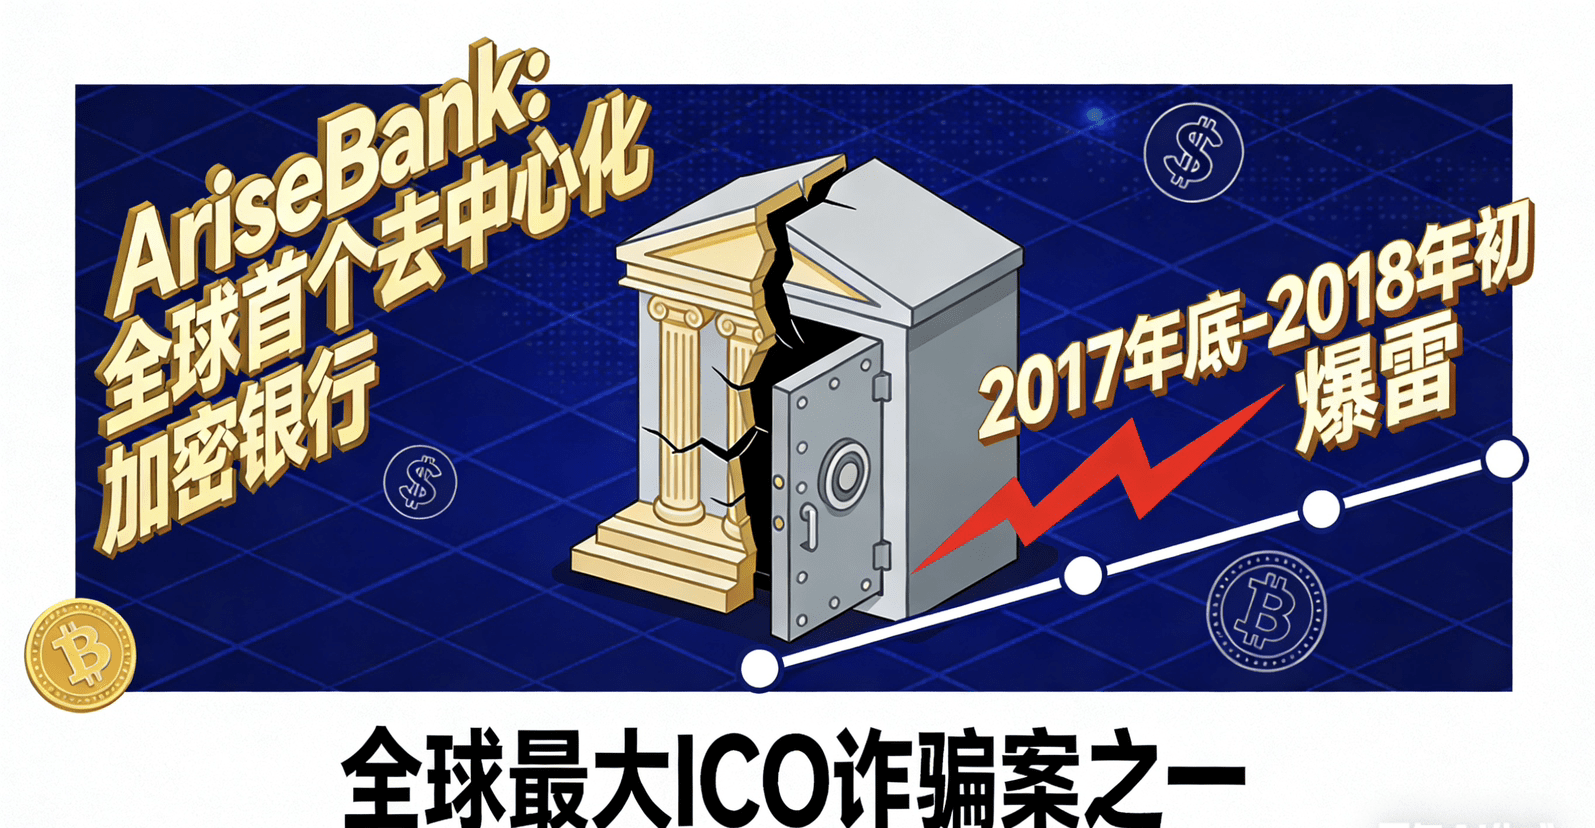
AriseBank claims to be the "world's first decentralized cryptocurrency bank," launched an ICO fundraising from the end of 2017 to the beginning of 2018, ultimately embezzling over $6 million, making it one of the most sensational ICO fraud cases of that year.
The project was led by CEO Jared Rice Sr and COO Stanley Ford, who deliberately concealed their criminal records and created a false impression of being "legitimate and trustworthy" through forged authoritative endorsements. They publicly claimed to have obtained a legal banking license in the United States and could provide FDIC federal deposit insurance for user deposits, fabricating a capital-protected and interest-bearing cryptocurrency financial service to attract a large number of investors.
During the fundraising phase, AriseBank focused on issuing the token ARIS, promising that token holders could enjoy a series of exclusive rights related to bank deposits and payments, continuously amplifying the token's appreciation potential. But in fact, the project had neither real blockchain underlying technology support nor compliant financial business qualifications; the so-called "decentralized bank" was merely an empty shell concept.
The scam was quickly exposed, and the U.S. Securities and Exchange Commission (SEC) swiftly intervened, determining that its ICO activities were suspected of illegal securities issuance, and subsequently filed a lawsuit against the project team. Ultimately, AriseBank's ICO fundraising was urgently halted, the fraudulent actions of the operators were made public, and investors' funds were difficult to recover.
The project was led by CEO Jared Rice Sr and COO Stanley Ford, who deliberately concealed their criminal records and created a false impression of being "legitimate and trustworthy" through forged authoritative endorsements. They publicly claimed to have obtained a legal banking license in the United States and could provide FDIC federal deposit insurance for user deposits, fabricating a capital-protected and interest-bearing cryptocurrency financial service to attract a large number of investors.
During the fundraising phase, AriseBank focused on issuing the token ARIS, promising that token holders could enjoy a series of exclusive rights related to bank deposits and payments, continuously amplifying the token's appreciation potential. But in fact, the project had neither real blockchain underlying technology support nor compliant financial business qualifications; the so-called "decentralized bank" was merely an empty shell concept.
The scam was quickly exposed, and the U.S. Securities and Exchange Commission (SEC) swiftly intervened, determining that its ICO activities were suspected of illegal securities issuance, and subsequently filed a lawsuit against the project team. Ultimately, AriseBank's ICO fundraising was urgently halted, the fraudulent actions of the operators were made public, and investors' funds were difficult to recover.
Quoted content has been removed
BOBBERs
·
--
BullishBox for Christmas 🎁🎁 in advance merry christmas 🎄🎄🎄🎁 family 💐🎊🎊🎊 Boom 💥 boom
Quoted content has been removed

Yuliya_scor
·
--
Good night 😴
$$BTC
$$BTC
Quoted content has been removed
Uncle Scrooge Crypto
·
--
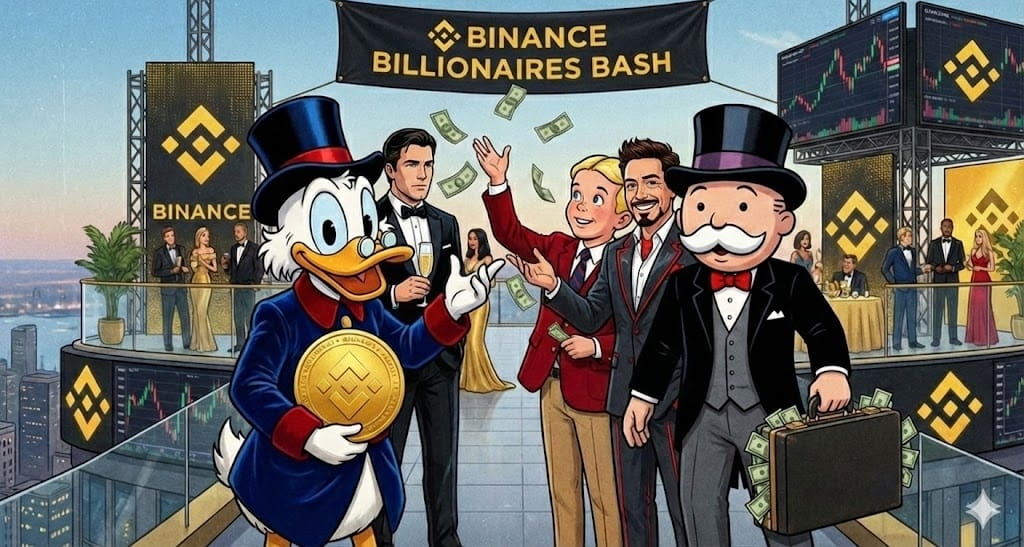
👉@BNB_Chain + @Uncle Scrooge Crypto = 🎁🎁🎁🎁🎁🎁🎁🎁🎁🎁🎁🎁🎁🎁🎁🎁🎁🎁🎁🎁🎁🎁
Have you ever stopped to analyze what truly supports the infrastructure of decentralized finance? While most eyes turn to the daily volatility of the charts, something much more robust happens behind the scenes of the BNB Chain. BNB has ceased to be just a "utility token" of an exchange to become the oxygen of a vast and pulsating digital ecosystem.
What makes BNB fascinating is not just its market presence, but its economic architecture. We are talking about an asset that incorporates a continuous burn mechanism (Auto-Burn), designed to reduce the total supply in a programmatic and transparent way. In a world where inflation erodes the value of traditional money, mathematical scarcity is a powerful argument that attracts long-term investors and technology visionaries.
But the real shine is in usability. From paying negligible gas fees in ultra-fast transactions to governance that decides the future of the network, BNB is the master key to dApps, NFT games, and the emerging decentralized storage (Greenfield). It is not just a currency; it is the infrastructure that allows Web3 to happen now, not in the future.
The question that remains for those observing the market is: are you positioned solely in speculation or in assets that build the foundation of the internet of tomorrow? Ignoring the real utility of BNB is ignoring the very evolution of blockchain.
#bnb $BNB @BNB_Chain
Have you ever stopped to analyze what truly supports the infrastructure of decentralized finance? While most eyes turn to the daily volatility of the charts, something much more robust happens behind the scenes of the BNB Chain. BNB has ceased to be just a "utility token" of an exchange to become the oxygen of a vast and pulsating digital ecosystem.
What makes BNB fascinating is not just its market presence, but its economic architecture. We are talking about an asset that incorporates a continuous burn mechanism (Auto-Burn), designed to reduce the total supply in a programmatic and transparent way. In a world where inflation erodes the value of traditional money, mathematical scarcity is a powerful argument that attracts long-term investors and technology visionaries.
But the real shine is in usability. From paying negligible gas fees in ultra-fast transactions to governance that decides the future of the network, BNB is the master key to dApps, NFT games, and the emerging decentralized storage (Greenfield). It is not just a currency; it is the infrastructure that allows Web3 to happen now, not in the future.
The question that remains for those observing the market is: are you positioned solely in speculation or in assets that build the foundation of the internet of tomorrow? Ignoring the real utility of BNB is ignoring the very evolution of blockchain.
#bnb $BNB @BNB_Chain
Quoted content has been removed

pàrkhã_khãñ51
·
--
#USNonFarmPayrollReport
#WriteToEarnUpgrade
#btc_bullish_soon_🍒
✨Is market stable ?.
💫✨Understanding Market Stability💫✨
✨Low Volatility A stable market is primarily characterized by low volatility, meaning prices are not changing dramatically. This suggests a more predictable and less risky environment.
💫✨Key Indicators Economic indicators like GDP growth, inflation, and unemployment rates are crucial for predicting financial stability. Healthy economic data often underpins a stable market.
✨💫Investor Sentiment Stability is also reflected in investor confidence and the absence of panic. Tools like the CBOE Volatility Index (VIX) gauge market fear.
✨💫 is a Stable Market✨💫
A stable financial market is one that can efficiently facilitate economic activities, like providing loans and investment opportunities, without being prone to sharp downturns. It's a system that can absorb shocks and continue to function smoothly. This doesn't mean prices are constant, but rather that their movements are not disruptive to the broader economy.
✨💫 Indicators of Stability✨💫
💫Low Volatility The most common way to measure market stability is through volatility, often calculated using standard deviation. Low volatility indicates smaller, more predictable price swings. The VIX, or 💫"fear gauge,"💫 is a popular tool for measuring expected 30-day volatility. 💫A VIX reading below 12 is often considered an indicator of low volatility.
✨Economic Fundamentals Strong and steady economic indicators are a sign of a healthy market. These include:
✨GDP Growth Reflects a thriving economy that can support corporate earnings.
✨Inflation Stable and predictable inflation helps in rational decision-making.
✨Unemployment Rates Low unemployment signals a strong economy and robust consumer spending power...
#Follow_Like_Comment
stay blessed 😇 love you all 💕
take care 💅
#WriteToEarnUpgrade
#btc_bullish_soon_🍒
✨Is market stable ?.
💫✨Understanding Market Stability💫✨
✨Low Volatility A stable market is primarily characterized by low volatility, meaning prices are not changing dramatically. This suggests a more predictable and less risky environment.
💫✨Key Indicators Economic indicators like GDP growth, inflation, and unemployment rates are crucial for predicting financial stability. Healthy economic data often underpins a stable market.
✨💫Investor Sentiment Stability is also reflected in investor confidence and the absence of panic. Tools like the CBOE Volatility Index (VIX) gauge market fear.
✨💫 is a Stable Market✨💫
A stable financial market is one that can efficiently facilitate economic activities, like providing loans and investment opportunities, without being prone to sharp downturns. It's a system that can absorb shocks and continue to function smoothly. This doesn't mean prices are constant, but rather that their movements are not disruptive to the broader economy.
✨💫 Indicators of Stability✨💫
💫Low Volatility The most common way to measure market stability is through volatility, often calculated using standard deviation. Low volatility indicates smaller, more predictable price swings. The VIX, or 💫"fear gauge,"💫 is a popular tool for measuring expected 30-day volatility. 💫A VIX reading below 12 is often considered an indicator of low volatility.
✨Economic Fundamentals Strong and steady economic indicators are a sign of a healthy market. These include:
✨GDP Growth Reflects a thriving economy that can support corporate earnings.
✨Inflation Stable and predictable inflation helps in rational decision-making.
✨Unemployment Rates Low unemployment signals a strong economy and robust consumer spending power...
#Follow_Like_Comment
stay blessed 😇 love you all 💕
take care 💅

Quoted content has been removed
Quoted content has been removed
Quoted content has been removed
Log in to explore more content