
ESSA KB
32 Posts

ESSA KB
Report
Block User
14 Following
7 Followers
28 Liked
Posts
·
--
##EVVA ⛔
This coin is crazy—set a stop-loss 📍
One whale controls its price and moves its market however they like
Watch out for it
##EVVA ⛔
This coin is crazy—set a stop-loss 📍
One whale controls its price and moves its market however they like
Watch out for it
This coin is crazy—set a stop-loss 📍
One whale controls its price and moves its market however they like
Watch out for it
36
·
--
Bullish
#BTC☀️
The market is fluctuating up and down 🔻✳️
Entering a buy or sell trade is risky 💱
{spot}(BTCUSDT)
Now is a great opportunity to buy Bitcoin
You never know when the breakout will happen 💥
#BTC☀️
The market is fluctuating up and down 🔻✳️
Entering a buy or sell trade is risky 💱
Now is a great opportunity to buy Bitcoin
You never know when the breakout will happen 💥
The market is fluctuating up and down 🔻✳️
Entering a buy or sell trade is risky 💱
Now is a great opportunity to buy Bitcoin
You never know when the breakout will happen 💥
1
60
·
--
Bullish
#pepe
spot📍
A correction and liquidity accumulation process, ready to take off
It’s going to surge strongly
#pepe
spot📍
A correction and liquidity accumulation process, ready to take off
It’s going to surge strongly
spot📍
A correction and liquidity accumulation process, ready to take off
It’s going to surge strongly
1
56
·
--

Article
EVAA【EVAAUSDT】 · Historical Review
### 1. Candlestick Pattern Interpretation
- 3.0578 area — Solid low with a hammer candle — Selling pressure ends, start of an attempted rise — Strong signal
- Mid-chart around 4.0345 — Three white soldiers — Uptrend continuation with a gradual increase in volume — Strong signal
- Peak at 5.6417 — Shooting star with a long upper shadow — Failed test of the peak, visible selling pressure — Moderate reversal signal
EVAA
【EVAAUSDT】 · Historical Review
### 1. Candlestick Pattern Interpretation
- 3.0578 area — Solid low with a hammer candle — Selling pressure ends, start of an attempted rise — Strong signal
- Mid-chart around 4.0345 — Three white soldiers — Uptrend continuation with a gradual increase in volume — Strong signal
- Peak at 5.6417 — Shooting star with a long upper shadow — Failed test of the peak, visible selling pressure — Moderate reversal signal
### 1. Candlestick Pattern Interpretation
- 3.0578 area — Solid low with a hammer candle — Selling pressure ends, start of an attempted rise — Strong signal
- Mid-chart around 4.0345 — Three white soldiers — Uptrend continuation with a gradual increase in volume — Strong signal
- Peak at 5.6417 — Shooting star with a long upper shadow — Failed test of the peak, visible selling pressure — Moderate reversal signal
1
254
·
--
Bearish
#PIPPIN short🔻💥
🪙 $PIPPIN/USDT – 👇👇👇
🎯 Entry: 0.019- 0.0197
❌ Stop Loss: 0.0217
💰 Target: 0.0184 - 0.0175-0.016
#PIPPIN short🔻💥
🪙 $PIPPIN/USDT – 👇👇👇
🎯 Entry: 0.019- 0.0197
❌ Stop Loss: 0.0217
💰 Target: 0.0184 - 0.0175-0.016
🪙 $PIPPIN/USDT – 👇👇👇
🎯 Entry: 0.019- 0.0197
❌ Stop Loss: 0.0217
💰 Target: 0.0184 - 0.0175-0.016
315
·
--

Article
#BTC【BTCUSDT】Historical Review
### Analysis of the Last Closing Candle at 63,010.1
Shape and Structure:
- Type: Long-bodied red bearish candle
- Open: approximately 64,100; close: 63,010.1
- Upper wick: relatively short — the price did not bounce much higher after opening
- Lower wick: relatively long — the price reached a low of around 62,600, then partially rebounded to close at 63,010
#BTC
【BTCUSDT】Historical Review
### Analysis of the Last Closing Candle at 63,010.1
Shape and Structure:
- Type: Long-bodied red bearish candle
- Open: approximately 64,100; close: 63,010.1
- Upper wick: relatively short — the price did not bounce much higher after opening
- Lower wick: relatively long — the price reached a low of around 62,600, then partially rebounded to close at 63,010
### Analysis of the Last Closing Candle at 63,010.1
Shape and Structure:
- Type: Long-bodied red bearish candle
- Open: approximately 64,100; close: 63,010.1
- Upper wick: relatively short — the price did not bounce much higher after opening
- Lower wick: relatively long — the price reached a low of around 62,600, then partially rebounded to close at 63,010
60
·
--
#EVAA SHORT 🔻💥
Now enter a sell position with confidence; the coin is definitely correcting around 3.85.
#EVAA SHORT 🔻💥
Now enter a sell position with confidence; the coin is definitely correcting around 3.85.
Now enter a sell position with confidence; the coin is definitely correcting around 3.85.
84
·
--
How do you see Bitcoin moving today?
How do you see Bitcoin moving today?
هابط
50%
صاعد
50%
2 votes • Voting closed
25
·
--
Bullish
#PIPPIN
Don't invest in a currency that's falling and wait for it to rise. After any drop, the attempt to recover happens near the area where it fell.
#PIPPIN
Don't invest in a currency that's falling and wait for it to rise. After any drop, the attempt to recover happens near the area where it fell.
Don't invest in a currency that's falling and wait for it to rise. After any drop, the attempt to recover happens near the area where it fell.
158
·
--
Bearish
#MMT SHORT 🔻💥
We're used to seeing any trending coin rise and then eventually start to fall
And this one will follow the others
SHORT🔻💥
#MMT SHORT 🔻💥
We're used to seeing any trending coin rise and then eventually start to fall
And this one will follow the others
SHORT🔻💥
We're used to seeing any trending coin rise and then eventually start to fall
And this one will follow the others
SHORT🔻💥
102
·
--
#BREV
This coin was trending yesterday.
It will continue fluctuating around the 0.11 area.
Trade it short/long for 48 hours, then it will drop to 0.086, and God knows best.
#BREV
This coin was trending yesterday.
It will continue fluctuating around the 0.11 area.
Trade it short/long for 48 hours, then it will drop to 0.086, and God knows best.
This coin was trending yesterday.
It will continue fluctuating around the 0.11 area.
Trade it short/long for 48 hours, then it will drop to 0.086, and God knows best.
1
369
·
--
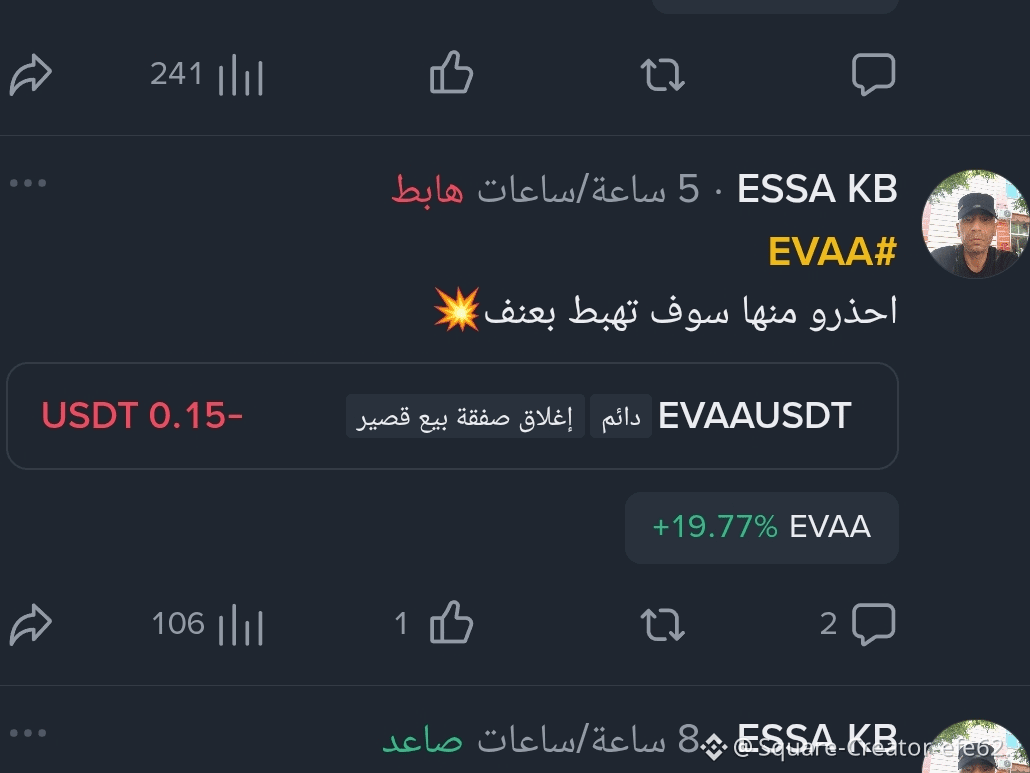
#EVAA
I warned you about it and said it was going to drop
#EVAA
I warned you about it and said it was going to drop
I warned you about it and said it was going to drop
1
131
Log in to explore more content
Join global crypto users on Binance Square
⚡️ Get latest and useful information about crypto.
💬 Trusted by the world’s largest crypto exchange.
👍 Discover real insights from verified creators.
Email / Phone number