
甜梦讲币
5.5k Posts

甜梦讲币
Report
Block User
8年币圈老韭菜,每日更新最新策略,每天发布最新咨询,币圈大小事皆能掌握,和悦带单。(公众号:听绾绾说,溦:RFNM8986)
4 Following
1.6K+ Followers
2.0K+ Liked
Posts
All
Quotes
Videos
PINNED
·
--
Private messaging method, scan the Binance QR code to proceed
Private messaging method, scan the Binance QR code to proceed

3
1
117
·
--
Investing in the crypto market is really that simple. You just need to do two things:
1. Fundamentally agree with the idea of “accumulating Bitcoin and Ethereum for the long term.”
2. Find a great trading blogger as a timing reference.
Then you can make only 1–2 moves per year to capture an opportunity for wealth growth that is roughly 4x over about every four years, with an annual compound growth rate of about 50%.
Everything else is noise. Why not spend your time on fitness, dating, and traveling?
Investing in the crypto market is really that simple. You just need to do two things:
1. Fundamentally agree with the idea of “accumulating Bitcoin and Ethereum for the long term.”
2. Find a great trading blogger as a timing reference.
Then you can make only 1–2 moves per year to capture an opportunity for wealth growth that is roughly 4x over about every four years, with an annual compound growth rate of about 50%.
Everything else is noise. Why not spend your time on fitness, dating, and traveling?
1. Fundamentally agree with the idea of “accumulating Bitcoin and Ethereum for the long term.”
2. Find a great trading blogger as a timing reference.
Then you can make only 1–2 moves per year to capture an opportunity for wealth growth that is roughly 4x over about every four years, with an annual compound growth rate of about 50%.
Everything else is noise. Why not spend your time on fitness, dating, and traveling?
80
·
--
TRUMP
Meme coins are pretty much useless—over the long term they just grind downward. Any short-term bounce is just Trump pulling strings to pump them. Stay away from coins like this; who knows, one day you’ll suddenly find yourself stuck in a short, and then it could suddenly rocket and liquidate you.
The underlying value is zero, the technicals are zero, there’s no good news—an all-around zero product
TRUMP
Meme coins are pretty much useless—over the long term they just grind downward. Any short-term bounce is just Trump pulling strings to pump them. Stay away from coins like this; who knows, one day you’ll suddenly find yourself stuck in a short, and then it could suddenly rocket and liquidate you.
The underlying value is zero, the technicals are zero, there’s no good news—an all-around zero product
Meme coins are pretty much useless—over the long term they just grind downward. Any short-term bounce is just Trump pulling strings to pump them. Stay away from coins like this; who knows, one day you’ll suddenly find yourself stuck in a short, and then it could suddenly rocket and liquidate you.
The underlying value is zero, the technicals are zero, there’s no good news—an all-around zero product
127
·
--
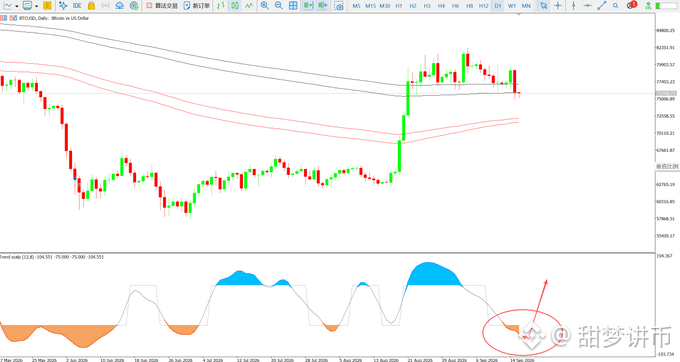
From the daily chart perspective, Bitcoin still needs to undergo some adjustment for a period of time. Once the adjustment is over, there may be a rebound. Yesterday, the risks were already highlighted: for many of the altcoins, a pullback is likely. BTC, ETH, and SOL have all corrected by around three to four percent, and Bitcoin has corrected by about one percent as well—these are all normal.
In the past few days, most coins on the RH chain have fallen by more than 90%. I think it’s only big BTC that still has a chance to bounce; otherwise, these coins would all have to go to zero.
In short, it’s still the same old saying: the market isn’t short of opportunities, but the market has changed. It’s no longer the kind of market where you can make money just by casually trying. Try to avoid major risks and large losses, and don’t indulge in fantasies about the market.
From the daily chart perspective, Bitcoin still needs to undergo some adjustment for a period of time. Once the adjustment is over, there may be a rebound. Yesterday, the risks were already highlighted: for many of the altcoins, a pullback is likely. BTC, ETH, and SOL have all corrected by around three to four percent, and Bitcoin has corrected by about one percent as well—these are all normal.
In the past few days, most coins on the RH chain have fallen by more than 90%. I think it’s only big BTC that still has a chance to bounce; otherwise, these coins would all have to go to zero.
In short, it’s still the same old saying: the market isn’t short of opportunities, but the market has changed. It’s no longer the kind of market where you can make money just by casually trying. Try to avoid major risks and large losses, and don’t indulge in fantasies about the market.
In the past few days, most coins on the RH chain have fallen by more than 90%. I think it’s only big BTC that still has a chance to bounce; otherwise, these coins would all have to go to zero.
In short, it’s still the same old saying: the market isn’t short of opportunities, but the market has changed. It’s no longer the kind of market where you can make money just by casually trying. Try to avoid major risks and large losses, and don’t indulge in fantasies about the market.
280
·
--
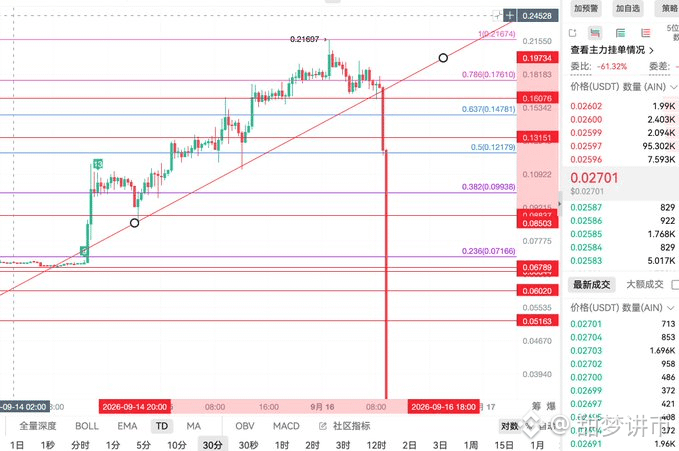
After breaking below yesterday’s upward trendline, the project team, in a way of abandoning the position, recklessly smashed the sell-off. The previous price was still 0.0953, and in just 10 minutes it is now 0.0338
After breaking below yesterday’s upward trendline, the project team, in a way of abandoning the position, recklessly smashed the sell-off. The previous price was still 0.0953, and in just 10 minutes it is now 0.0338
1
462
·
--
See translation
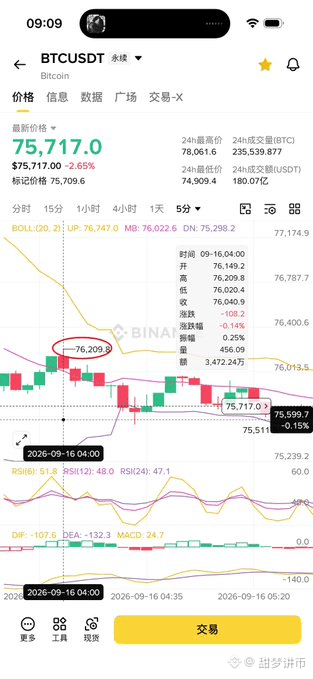
周二《清晰法案》缺10票通过,加密货币市场监管立法陷入停滞。同时油价飙升直逼110,比特币重挫。
btc:昨晚第五次回踩76000利空刺激破位。收盘价76200,低点下移到73755,日内压力76850。
周二《清晰法案》缺10票通过,加密货币市场监管立法陷入停滞。同时油价飙升直逼110,比特币重挫。
btc:昨晚第五次回踩76000利空刺激破位。收盘价76200,低点下移到73755,日内压力76850。
btc:昨晚第五次回踩76000利空刺激破位。收盘价76200,低点下移到73755,日内压力76850。
95
·
--
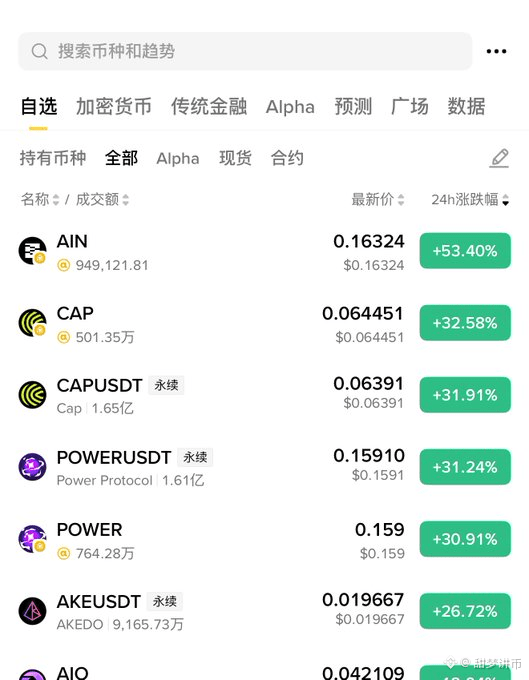
The story of these pool coins is still going on and won’t end so quickly. If they don’t have enough control, they’ll continue absorbing more liquidity.
Honestly, if it weren’t for these pool coins, how many people would still be willing to play on the secondary market or in derivatives? Maybe exchanges also need them—just don’t go too far!
The old narrative from institutions was basically always about how the project will be worth a lot more in the future.
But what retail investors care about now is: if I buy in, can I make money? No matter how amazing your project is, if I don’t earn, what does that have to do with me?
Everyone knows deep down that these pool coins will eventually get dumped. Yet people still choose to play anyway—they’d rather bet on this immediate pump than wait for years to see the project deliver on promises.
I think for a long time ahead, pool coins will still be the main character.
With the old story getting no takers and no new way of playing coming out, traders definitely won’t all just leave the scene.
The story of these pool coins is still going on and won’t end so quickly. If they don’t have enough control, they’ll continue absorbing more liquidity.
Honestly, if it weren’t for these pool coins, how many people would still be willing to play on the secondary market or in derivatives? Maybe exchanges also need them—just don’t go too far!
The old narrative from institutions was basically always about how the project will be worth a lot more in the future.
But what retail investors care about now is: if I buy in, can I make money? No matter how amazing your project is, if I don’t earn, what does that have to do with me?
Everyone knows deep down that these pool coins will eventually get dumped. Yet people still choose to play anyway—they’d rather bet on this immediate pump than wait for years to see the project deliver on promises.
I think for a long time ahead, pool coins will still be the main character.
With the old story getting no takers and no new way of playing coming out, traders definitely won’t all just leave the scene.
Honestly, if it weren’t for these pool coins, how many people would still be willing to play on the secondary market or in derivatives? Maybe exchanges also need them—just don’t go too far!
The old narrative from institutions was basically always about how the project will be worth a lot more in the future.
But what retail investors care about now is: if I buy in, can I make money? No matter how amazing your project is, if I don’t earn, what does that have to do with me?
Everyone knows deep down that these pool coins will eventually get dumped. Yet people still choose to play anyway—they’d rather bet on this immediate pump than wait for years to see the project deliver on promises.
I think for a long time ahead, pool coins will still be the main character.
With the old story getting no takers and no new way of playing coming out, traders definitely won’t all just leave the scene.
285
·
--
Niu Lai
Currently, Niu Lai’s highest market cap is 160 million. The chart is currently undergoing a pullback and adjustment. Judging from the market cap, I personally think Niu Lai’s potential will not stop at 160 million. In the next phase, it is likely to rise. My operational view for Niu Lai is:
If it breaks below 0.1, I will consider accumulating positions in batches—for example, building in stages at around 0.9/0.8. I plan to set up a mid- to long-term spot layout. Right now, I’m aiming to capture about a 3X return. I won’t touch the leveraged contracts. If there’s a big wick down, I can take the opportunity to buy.
Niu Lai
Currently, Niu Lai’s highest market cap is 160 million. The chart is currently undergoing a pullback and adjustment. Judging from the market cap, I personally think Niu Lai’s potential will not stop at 160 million. In the next phase, it is likely to rise. My operational view for Niu Lai is:
If it breaks below 0.1, I will consider accumulating positions in batches—for example, building in stages at around 0.9/0.8. I plan to set up a mid- to long-term spot layout. Right now, I’m aiming to capture about a 3X return. I won’t touch the leveraged contracts. If there’s a big wick down, I can take the opportunity to buy.
Currently, Niu Lai’s highest market cap is 160 million. The chart is currently undergoing a pullback and adjustment. Judging from the market cap, I personally think Niu Lai’s potential will not stop at 160 million. In the next phase, it is likely to rise. My operational view for Niu Lai is:
If it breaks below 0.1, I will consider accumulating positions in batches—for example, building in stages at around 0.9/0.8. I plan to set up a mid- to long-term spot layout. Right now, I’m aiming to capture about a 3X return. I won’t touch the leveraged contracts. If there’s a big wick down, I can take the opportunity to buy.
292
·
--
bsc is the best for making money because there are actually very few targets. As for the so-called “splitting/branching,” whether it’s opened by a trading bot or by different teachers, it doesn’t matter. The best choice is to not participate—but if something does run, you must be decisive about getting on board.
Some people say that being on alpha and then also on futures and spot limits how high it can go, but you can actually judge who will go up. Then making a 1–5m “hitting zone” to a 50m “distribution/exit zone” is enough. Mars, Niu Lai, 4stock—these are all examples. If you can’t get in at the low position, then at least do the narrative and become the bag-holding counterpart.
On bsc, really good storytelling is extremely lacking, but it’s also where the money can be concentrated to fuel the fire. Taking profit is also easier to do: alpha in one place—futures, spot, then keep a little moonbag on the side. If you carefully review past cycles, the only cases where there were actually two chances after spot had already put in the high are shib, pepe, and neiro. pnut doesn’t count because it just raced through for three days straight after opening. So no matter how great the narrative is, after it trades on Binance spot, sustaining a continued rally is still very difficult;
bsc is the best for making money because there are actually very few targets. As for the so-called “splitting/branching,” whether it’s opened by a trading bot or by different teachers, it doesn’t matter. The best choice is to not participate—but if something does run, you must be decisive about getting on board.
Some people say that being on alpha and then also on futures and spot limits how high it can go, but you can actually judge who will go up. Then making a 1–5m “hitting zone” to a 50m “distribution/exit zone” is enough. Mars, Niu Lai, 4stock—these are all examples. If you can’t get in at the low position, then at least do the narrative and become the bag-holding counterpart.
On bsc, really good storytelling is extremely lacking, but it’s also where the money can be concentrated to fuel the fire. Taking profit is also easier to do: alpha in one place—futures, spot, then keep a little moonbag on the side. If you carefully review past cycles, the only cases where there were actually two chances after spot had already put in the high are shib, pepe, and neiro. pnut doesn’t count because it just raced through for three days straight after opening. So no matter how great the narrative is, after it trades on Binance spot, sustaining a continued rally is still very difficult;
Some people say that being on alpha and then also on futures and spot limits how high it can go, but you can actually judge who will go up. Then making a 1–5m “hitting zone” to a 50m “distribution/exit zone” is enough. Mars, Niu Lai, 4stock—these are all examples. If you can’t get in at the low position, then at least do the narrative and become the bag-holding counterpart.
On bsc, really good storytelling is extremely lacking, but it’s also where the money can be concentrated to fuel the fire. Taking profit is also easier to do: alpha in one place—futures, spot, then keep a little moonbag on the side. If you carefully review past cycles, the only cases where there were actually two chances after spot had already put in the high are shib, pepe, and neiro. pnut doesn’t count because it just raced through for three days straight after opening. So no matter how great the narrative is, after it trades on Binance spot, sustaining a continued rally is still very difficult;
30
·
--
✅ The overall market here
The order book is still in a pressure range around 80,000. Around 4 a.m., when the big BTC reached 79,600, it still didn’t break through. It started pulling back, and the current pullback is around 77,000. Here, you can consider placing a low-long order around 76,000–76,400, with a stop loss at 75,500—less than a one-point stop.
As for the second one (alt), watch the support range around 2,460.
For the overall market, the probability of a big rise in the near term is low. The hype storyline is too cold, and the funds are overly split—U.S. stocks and on-chain activity have siphoned too much capital away.
✅ Spot and MEME sectors
Lately, I’ve been scared by insider-driven small coins. These evil market makers—spreading messages everywhere, damn it. Once you buy in, you start getting trapped; once you enter, you’re basically one move away from being liquidated. From now on, if you hear about an insider coin, observe it for a month first. Damn—every tactic is basically the same old routine.
At the moment, my spot holdings are basically only GAS.
ETH, BNB, SOL, OKB—other than that, I don’t dare to buy.
ARC chain goes live today—pay close attention; if there’s an opportunity, take it. For the X chain, look at the hype on Twitter/X; the expectation is that there’ll still be heat.
✅ The overall market here
The order book is still in a pressure range around 80,000. Around 4 a.m., when the big BTC reached 79,600, it still didn’t break through. It started pulling back, and the current pullback is around 77,000. Here, you can consider placing a low-long order around 76,000–76,400, with a stop loss at 75,500—less than a one-point stop.
As for the second one (alt), watch the support range around 2,460.
For the overall market, the probability of a big rise in the near term is low. The hype storyline is too cold, and the funds are overly split—U.S. stocks and on-chain activity have siphoned too much capital away.
✅ Spot and MEME sectors
Lately, I’ve been scared by insider-driven small coins. These evil market makers—spreading messages everywhere, damn it. Once you buy in, you start getting trapped; once you enter, you’re basically one move away from being liquidated. From now on, if you hear about an insider coin, observe it for a month first. Damn—every tactic is basically the same old routine.
At the moment, my spot holdings are basically only GAS.
ETH, BNB, SOL, OKB—other than that, I don’t dare to buy.
ARC chain goes live today—pay close attention; if there’s an opportunity, take it. For the X chain, look at the hype on Twitter/X; the expectation is that there’ll still be heat.
The order book is still in a pressure range around 80,000. Around 4 a.m., when the big BTC reached 79,600, it still didn’t break through. It started pulling back, and the current pullback is around 77,000. Here, you can consider placing a low-long order around 76,000–76,400, with a stop loss at 75,500—less than a one-point stop.
As for the second one (alt), watch the support range around 2,460.
For the overall market, the probability of a big rise in the near term is low. The hype storyline is too cold, and the funds are overly split—U.S. stocks and on-chain activity have siphoned too much capital away.
✅ Spot and MEME sectors
Lately, I’ve been scared by insider-driven small coins. These evil market makers—spreading messages everywhere, damn it. Once you buy in, you start getting trapped; once you enter, you’re basically one move away from being liquidated. From now on, if you hear about an insider coin, observe it for a month first. Damn—every tactic is basically the same old routine.
At the moment, my spot holdings are basically only GAS.
ETH, BNB, SOL, OKB—other than that, I don’t dare to buy.
ARC chain goes live today—pay close attention; if there’s an opportunity, take it. For the X chain, look at the hype on Twitter/X; the expectation is that there’ll still be heat.
320
·
--
The problem with Niu Lai right now is that
Mars next door has been constantly pushing out inventory.
Once it goes down, Niu Lai has to be brought down too, even from a new high.
When will we be able to have two spot assets break away from this kind of converging price action?
When will Niu Lai truly realize its value?
As for Mars—it's also really hard to hold steady.
The problem with Niu Lai right now is that
Mars next door has been constantly pushing out inventory.
Once it goes down, Niu Lai has to be brought down too, even from a new high.
When will we be able to have two spot assets break away from this kind of converging price action?
When will Niu Lai truly realize its value?
As for Mars—it's also really hard to hold steady.
Mars next door has been constantly pushing out inventory.
Once it goes down, Niu Lai has to be brought down too, even from a new high.
When will we be able to have two spot assets break away from this kind of converging price action?
When will Niu Lai truly realize its value?
As for Mars—it's also really hard to hold steady.
577
·
--
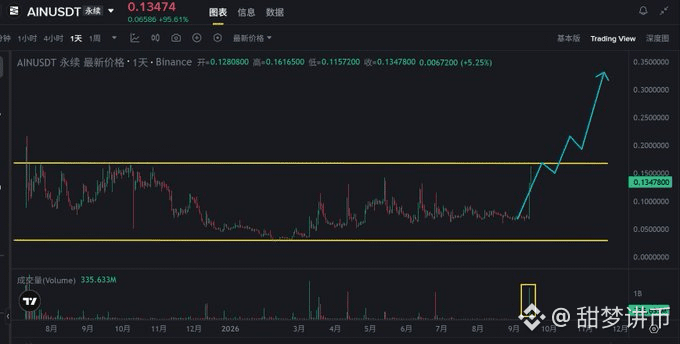
AIN
AIN coin’s price has quickly surged to around 0.162—i.e., the upper boundary of a box-range consolidation. One long upper wick has blown up the shorts for a round. While the main force is testing the overhead resistance, it is also freeing up the trapped positions around 0.165.
Is it still time to chase the price? Not yet, because there are quite a few trapped positions around 0.165. Wait until the price successfully breaks above 0.165 with increased volume—then the real show begins.
AIN
AIN coin’s price has quickly surged to around 0.162—i.e., the upper boundary of a box-range consolidation. One long upper wick has blown up the shorts for a round. While the main force is testing the overhead resistance, it is also freeing up the trapped positions around 0.165.
Is it still time to chase the price? Not yet, because there are quite a few trapped positions around 0.165. Wait until the price successfully breaks above 0.165 with increased volume—then the real show begins.
AIN coin’s price has quickly surged to around 0.162—i.e., the upper boundary of a box-range consolidation. One long upper wick has blown up the shorts for a round. While the main force is testing the overhead resistance, it is also freeing up the trapped positions around 0.165.
Is it still time to chase the price? Not yet, because there are quite a few trapped positions around 0.165. Wait until the price successfully breaks above 0.165 with increased volume—then the real show begins.
124
·
--
】How to Use Fibonacci Retracement Levels
Fibonacci retracement levels are a commonly used technical analysis tool that can help you identify support and resistance levels.
What is Fibonacci retracement:
1. Draw it from a clearly defined uptrend or downtrend
2. Draw the Fibonacci lines from the high to the low (or from the low to the high)
3. Key retracement levels: 0.236, 0.382, 0.5, 0.618, 0.786
Meaning of Fibonacci retracement levels:
1. 0.236: a shallow pullback, showing a strong trend characteristic
2. 0.382: a normal retracement, commonly seen support/resistance
3. 0.5: the midpoint dividing long and short territory; an important level
4. 0.618: a deep retracement; the golden ratio level and an important support/resistance
5. 0.786: an extremely deep retracement; a weak-trend characteristic
How to use Fibonacci retracement levels:
1. Retracements in an uptrend:
- Draw Fibonacci from the low to the high
- The 0.382, 0.5, and 0.618 levels are potential support areas
- When price reaches these levels, watch to see if it stabilizes
- After stabilization, you can consider going long
2. Retracements in a downtrend (bounces):
- Draw Fibonacci from the high to the low
- The 0.382, 0.5, and 0.618 levels are potential resistance areas
- When price reaches these levels, watch to see if it stalls
- After stalling, you can consider going short
Important notes on Fibonacci retracement levels:
1. Draw it between clear highs and lows; don’t draw it within small fluctuations
2. Combine it with other indicators to judge (volume, candlestick patterns)
3. Don’t be overly superstitious—0.5 and 0.618 tend to be more effective
4. Retracement levels are zones, not exact points
5. After price breaks a retracement level, it may continue to the next one
Remember: Fibonacci retracement levels are a tool for finding support and resistance. Combined with other indicators, the effect is even better.
】How to Use Fibonacci Retracement Levels
Fibonacci retracement levels are a commonly used technical analysis tool that can help you identify support and resistance levels.
What is Fibonacci retracement:
1. Draw it from a clearly defined uptrend or downtrend
2. Draw the Fibonacci lines from the high to the low (or from the low to the high)
3. Key retracement levels: 0.236, 0.382, 0.5, 0.618, 0.786
Meaning of Fibonacci retracement levels:
1. 0.236: a shallow pullback, showing a strong trend characteristic
2. 0.382: a normal retracement, commonly seen support/resistance
3. 0.5: the midpoint dividing long and short territory; an important level
4. 0.618: a deep retracement; the golden ratio level and an important support/resistance
5. 0.786: an extremely deep retracement; a weak-trend characteristic
How to use Fibonacci retracement levels:
1. Retracements in an uptrend:
- Draw Fibonacci from the low to the high
- The 0.382, 0.5, and 0.618 levels are potential support areas
- When price reaches these levels, watch to see if it stabilizes
- After stabilization, you can consider going long
2. Retracements in a downtrend (bounces):
- Draw Fibonacci from the high to the low
- The 0.382, 0.5, and 0.618 levels are potential resistance areas
- When price reaches these levels, watch to see if it stalls
- After stalling, you can consider going short
Important notes on Fibonacci retracement levels:
1. Draw it between clear highs and lows; don’t draw it within small fluctuations
2. Combine it with other indicators to judge (volume, candlestick patterns)
3. Don’t be overly superstitious—0.5 and 0.618 tend to be more effective
4. Retracement levels are zones, not exact points
5. After price breaks a retracement level, it may continue to the next one
Remember: Fibonacci retracement levels are a tool for finding support and resistance. Combined with other indicators, the effect is even better.
Fibonacci retracement levels are a commonly used technical analysis tool that can help you identify support and resistance levels.
What is Fibonacci retracement:
1. Draw it from a clearly defined uptrend or downtrend
2. Draw the Fibonacci lines from the high to the low (or from the low to the high)
3. Key retracement levels: 0.236, 0.382, 0.5, 0.618, 0.786
Meaning of Fibonacci retracement levels:
1. 0.236: a shallow pullback, showing a strong trend characteristic
2. 0.382: a normal retracement, commonly seen support/resistance
3. 0.5: the midpoint dividing long and short territory; an important level
4. 0.618: a deep retracement; the golden ratio level and an important support/resistance
5. 0.786: an extremely deep retracement; a weak-trend characteristic
How to use Fibonacci retracement levels:
1. Retracements in an uptrend:
- Draw Fibonacci from the low to the high
- The 0.382, 0.5, and 0.618 levels are potential support areas
- When price reaches these levels, watch to see if it stabilizes
- After stabilization, you can consider going long
2. Retracements in a downtrend (bounces):
- Draw Fibonacci from the high to the low
- The 0.382, 0.5, and 0.618 levels are potential resistance areas
- When price reaches these levels, watch to see if it stalls
- After stalling, you can consider going short
Important notes on Fibonacci retracement levels:
1. Draw it between clear highs and lows; don’t draw it within small fluctuations
2. Combine it with other indicators to judge (volume, candlestick patterns)
3. Don’t be overly superstitious—0.5 and 0.618 tend to be more effective
4. Retracement levels are zones, not exact points
5. After price breaks a retracement level, it may continue to the next one
Remember: Fibonacci retracement levels are a tool for finding support and resistance. Combined with other indicators, the effect is even better.
42
·
--
Three Trading Iron Laws Learned from Losses
After trading for 5 years and losing a lot of money, I came up with three iron laws:
Iron Law 1: Stop-loss is always right—even if you’re wrong, it’s still right
- A stop-loss may cause you to miss the move, but not using one can mean liquidation
- A stop-loss is a cost, not a loss
Iron Law 2: Position size determines life or death
- Light positions can weather volatility; heavy positions wipe you out with one shot
- Never go all in
Iron Law 3: Don’t do trades you’re not confident about
- Don’t trade what you can’t understand
- Don’t trade without a plan
- Don’t trade when you’re emotional
Three Trading Iron Laws Learned from Losses
After trading for 5 years and losing a lot of money, I came up with three iron laws:
Iron Law 1: Stop-loss is always right—even if you’re wrong, it’s still right
- A stop-loss may cause you to miss the move, but not using one can mean liquidation
- A stop-loss is a cost, not a loss
Iron Law 2: Position size determines life or death
- Light positions can weather volatility; heavy positions wipe you out with one shot
- Never go all in
Iron Law 3: Don’t do trades you’re not confident about
- Don’t trade what you can’t understand
- Don’t trade without a plan
- Don’t trade when you’re emotional
After trading for 5 years and losing a lot of money, I came up with three iron laws:
Iron Law 1: Stop-loss is always right—even if you’re wrong, it’s still right
- A stop-loss may cause you to miss the move, but not using one can mean liquidation
- A stop-loss is a cost, not a loss
Iron Law 2: Position size determines life or death
- Light positions can weather volatility; heavy positions wipe you out with one shot
- Never go all in
Iron Law 3: Don’t do trades you’re not confident about
- Don’t trade what you can’t understand
- Don’t trade without a plan
- Don’t trade when you’re emotional
66
·
--
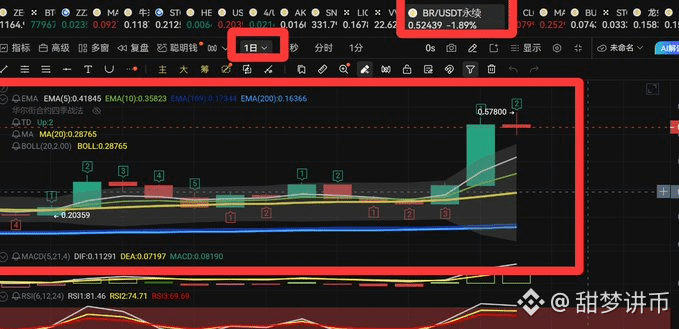
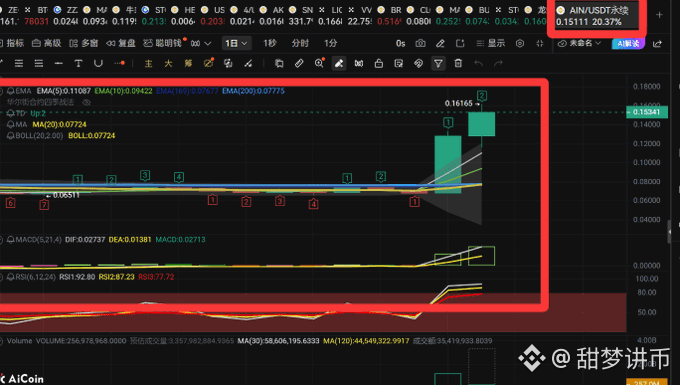
AINusdt surge coin. We short on highs with 1x leverage—when it rises 50%, we short! Use a 235 position ratio to play her!
BRusdt is also a surge coin you should focus on. Short on highs—everything is meant to cut your greens. On highs, only short, never go long. For every 50% rise, short on highs using the 235 position management strategy, with 1x leverage!
AINusdt surge coin. We short on highs with 1x leverage—when it rises 50%, we short! Use a 235 position ratio to play her!
BRusdt is also a surge coin you should focus on. Short on highs—everything is meant to cut your greens. On highs, only short, never go long. For every 50% rise, short on highs using the 235 position management strategy, with 1x leverage!
BRusdt is also a surge coin you should focus on. Short on highs—everything is meant to cut your greens. On highs, only short, never go long. For every 50% rise, short on highs using the 235 position management strategy, with 1x leverage!
267
·
--
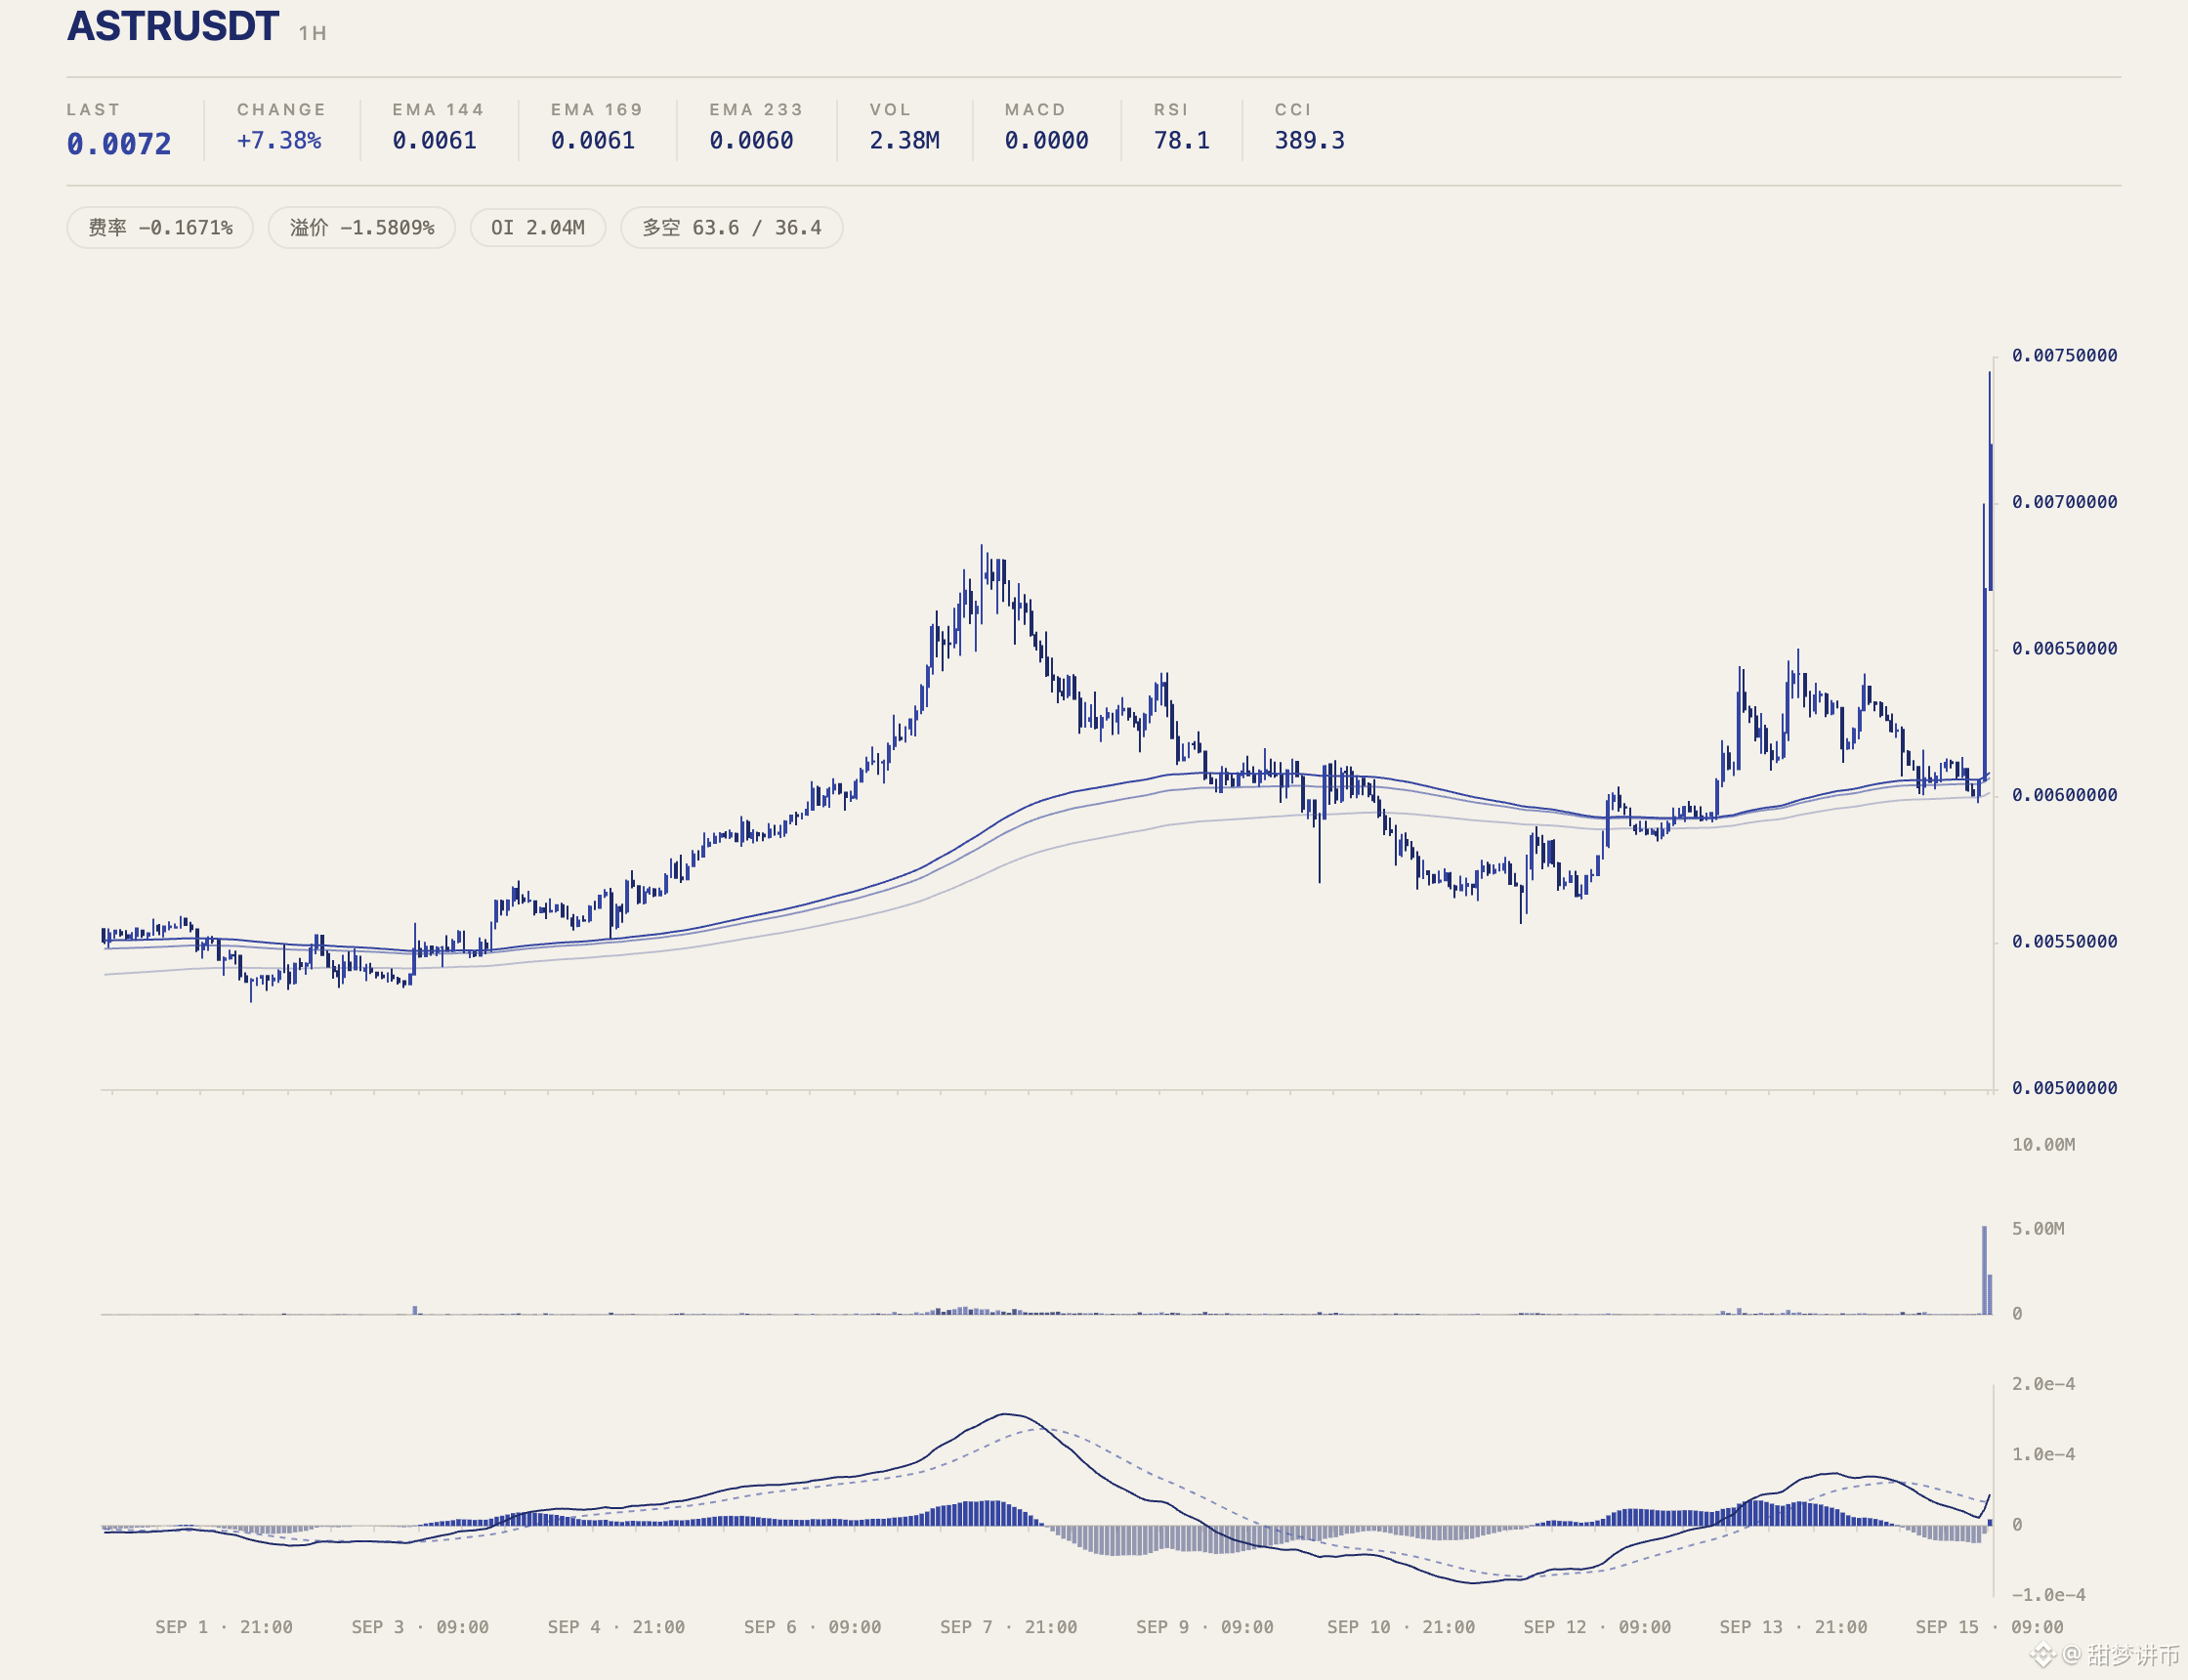
ASTR
The current price is 0.0067. The candlestick closes and simultaneously stands above the EMA144/169/233 moving averages—its structure has just begun to open.
The volume has surged to 91.14 times the average volume, synchronized with supportive coordination. This isn’t ordinary volume expansion; it’s confirmation of capital behavior.
RSI 70.18. With both structure and volume confirming, the only remaining variable is sustainability.
Trading plan—Bullish
Entry: 0.006708 – 0.006728
Stop loss: 0.006054
First target: 0.007714
Second target: 0.008378
Third target: 0.009374
ASTR
The current price is 0.0067. The candlestick closes and simultaneously stands above the EMA144/169/233 moving averages—its structure has just begun to open.
The volume has surged to 91.14 times the average volume, synchronized with supportive coordination. This isn’t ordinary volume expansion; it’s confirmation of capital behavior.
RSI 70.18. With both structure and volume confirming, the only remaining variable is sustainability.
Trading plan—Bullish
Entry: 0.006708 – 0.006728
Stop loss: 0.006054
First target: 0.007714
Second target: 0.008378
Third target: 0.009374
The current price is 0.0067. The candlestick closes and simultaneously stands above the EMA144/169/233 moving averages—its structure has just begun to open.
The volume has surged to 91.14 times the average volume, synchronized with supportive coordination. This isn’t ordinary volume expansion; it’s confirmation of capital behavior.
RSI 70.18. With both structure and volume confirming, the only remaining variable is sustainability.
Trading plan—Bullish
Entry: 0.006708 – 0.006728
Stop loss: 0.006054
First target: 0.007714
Second target: 0.008378
Third target: 0.009374
174
·
--
I always stick to the principle of not going short at the end of the day, unchanged. Starting in September, I basically became bearish less and I no longer roll out short-selling strategies; the short button has already been removed on my side. In the last few months, I’ve refined the mindset of going long on dips. Later, when the market enters a one-way upward move—the main uptrend—you’ll be able to take off by riding the momentum. This is the big picture. There’s no need to get stuck in quicksand at the bottom just because of a short-term short. I mentioned this multiple times as early as June–July. Many people didn’t listen. The last time, from 62,280 it was quickly pulled up to 74,000–82,000, and the shorts were wiped out in one go. At this point, it’s definitely time to prepare moment by moment for the long-term long trend. The major sell-off wave and this bear market ended back in June. From here on, we must抓住 the main uptrend—targets are very clear.
On the short term, alternating between shorting and low-long too quickly will make you easily get disoriented, and eventually you will definitely make a mistake. Then, overall, you won’t be profitable. Do only one direction—it’s less troublesome, don’t fuss around, and follow the larger trend. Buy on dips for stability; with 25x leverage at *16–18% (risk), you can basically ignore any short-term pullbacks of any magnitude. In a one-way upward trend, once daily rebounds start to show continuity, you can increase your position to 25–30%.
I always stick to the principle of not going short at the end of the day, unchanged. Starting in September, I basically became bearish less and I no longer roll out short-selling strategies; the short button has already been removed on my side. In the last few months, I’ve refined the mindset of going long on dips. Later, when the market enters a one-way upward move—the main uptrend—you’ll be able to take off by riding the momentum. This is the big picture. There’s no need to get stuck in quicksand at the bottom just because of a short-term short. I mentioned this multiple times as early as June–July. Many people didn’t listen. The last time, from 62,280 it was quickly pulled up to 74,000–82,000, and the shorts were wiped out in one go. At this point, it’s definitely time to prepare moment by moment for the long-term long trend. The major sell-off wave and this bear market ended back in June. From here on, we must抓住 the main uptrend—targets are very clear.
On the short term, alternating between shorting and low-long too quickly will make you easily get disoriented, and eventually you will definitely make a mistake. Then, overall, you won’t be profitable. Do only one direction—it’s less troublesome, don’t fuss around, and follow the larger trend. Buy on dips for stability; with 25x leverage at *16–18% (risk), you can basically ignore any short-term pullbacks of any magnitude. In a one-way upward trend, once daily rebounds start to show continuity, you can increase your position to 25–30%.
On the short term, alternating between shorting and low-long too quickly will make you easily get disoriented, and eventually you will definitely make a mistake. Then, overall, you won’t be profitable. Do only one direction—it’s less troublesome, don’t fuss around, and follow the larger trend. Buy on dips for stability; with 25x leverage at *16–18% (risk), you can basically ignore any short-term pullbacks of any magnitude. In a one-way upward trend, once daily rebounds start to show continuity, you can increase your position to 25–30%.
107
·
--
【BTC Market Analysis】1-hour Short-Term Trading Tips
The 1-hour timeframe is suitable for short-term trading, but there is a lot of noise, so you need to master the techniques.
Trading methods for the 1-hour timeframe:
1. First, look at the big picture:
- First, check the daily chart and the 4-hour chart to determine the main trend
- Trade in the direction of the main trend; for trades against the main trend, use a smaller position size or avoid them
2. Mark the key levels on the 1-hour chart:
- Support levels: the low from the prior period 1 hour ago, and the dense trading/volume area
- Resistance levels: the high from the prior period 1 hour ago, and the dense trading/volume area
3. Find entry signals:
- When price stabilizes at support + increases in volume during the rise, go long
- When price is rejected at resistance + increases in volume during the decline, go short
- Break through the key level + pull back to confirm, then follow through
4. Set strict stop-losses:
- The 1-hour timeframe has large fluctuations, so set your stop-loss properly
- Place the stop-loss on the other side of the key level—neither too close nor too far
- Once the price hits the stop-loss level, close the position unconditionally
Things to note for the 1-hour timeframe:
1. Don’t trade too frequently: there are many 1-hour signals, but there are also many fake signals
2. Don’t chase breakouts or panic-sell: wait for pullback confirmation before entering
3. Trade with a light position size: the 1-hour timeframe is volatile, so keep your position size light
4. Enter quickly, exit quickly: take profit and leave; don’t be greedy
5. Combine with the higher timeframe: trading with the main trend has a higher win rate
Remember: The 1-hour timeframe is suitable for short-term trading, but it has a lot of noise. Combine with the higher timeframe, set strict stop-losses, and trade with a light position size.
【BTC Market Analysis】1-hour Short-Term Trading Tips
The 1-hour timeframe is suitable for short-term trading, but there is a lot of noise, so you need to master the techniques.
Trading methods for the 1-hour timeframe:
1. First, look at the big picture:
- First, check the daily chart and the 4-hour chart to determine the main trend
- Trade in the direction of the main trend; for trades against the main trend, use a smaller position size or avoid them
2. Mark the key levels on the 1-hour chart:
- Support levels: the low from the prior period 1 hour ago, and the dense trading/volume area
- Resistance levels: the high from the prior period 1 hour ago, and the dense trading/volume area
3. Find entry signals:
- When price stabilizes at support + increases in volume during the rise, go long
- When price is rejected at resistance + increases in volume during the decline, go short
- Break through the key level + pull back to confirm, then follow through
4. Set strict stop-losses:
- The 1-hour timeframe has large fluctuations, so set your stop-loss properly
- Place the stop-loss on the other side of the key level—neither too close nor too far
- Once the price hits the stop-loss level, close the position unconditionally
Things to note for the 1-hour timeframe:
1. Don’t trade too frequently: there are many 1-hour signals, but there are also many fake signals
2. Don’t chase breakouts or panic-sell: wait for pullback confirmation before entering
3. Trade with a light position size: the 1-hour timeframe is volatile, so keep your position size light
4. Enter quickly, exit quickly: take profit and leave; don’t be greedy
5. Combine with the higher timeframe: trading with the main trend has a higher win rate
Remember: The 1-hour timeframe is suitable for short-term trading, but it has a lot of noise. Combine with the higher timeframe, set strict stop-losses, and trade with a light position size.
The 1-hour timeframe is suitable for short-term trading, but there is a lot of noise, so you need to master the techniques.
Trading methods for the 1-hour timeframe:
1. First, look at the big picture:
- First, check the daily chart and the 4-hour chart to determine the main trend
- Trade in the direction of the main trend; for trades against the main trend, use a smaller position size or avoid them
2. Mark the key levels on the 1-hour chart:
- Support levels: the low from the prior period 1 hour ago, and the dense trading/volume area
- Resistance levels: the high from the prior period 1 hour ago, and the dense trading/volume area
3. Find entry signals:
- When price stabilizes at support + increases in volume during the rise, go long
- When price is rejected at resistance + increases in volume during the decline, go short
- Break through the key level + pull back to confirm, then follow through
4. Set strict stop-losses:
- The 1-hour timeframe has large fluctuations, so set your stop-loss properly
- Place the stop-loss on the other side of the key level—neither too close nor too far
- Once the price hits the stop-loss level, close the position unconditionally
Things to note for the 1-hour timeframe:
1. Don’t trade too frequently: there are many 1-hour signals, but there are also many fake signals
2. Don’t chase breakouts or panic-sell: wait for pullback confirmation before entering
3. Trade with a light position size: the 1-hour timeframe is volatile, so keep your position size light
4. Enter quickly, exit quickly: take profit and leave; don’t be greedy
5. Combine with the higher timeframe: trading with the main trend has a higher win rate
Remember: The 1-hour timeframe is suitable for short-term trading, but it has a lot of noise. Combine with the higher timeframe, set strict stop-losses, and trade with a light position size.
92
·
--
【Trading Techniques】Bollinger Bands are a useful tool for judging volatility and support/resistance
Bollinger Bands are a useful tool for judging volatility and support/resistance.
Practical uses of Bollinger Bands:
1. Price reaches the upper band + bearish signal = short
2. Price reaches the lower band + bullish signal = buy long
3. Price moves along the upper band = strong uptrend; hold
4. Price moves along the lower band = strong downtrend; hold
5. Bollinger Bands narrow = reversal/turning point is imminent
6. Bollinger Bands open up = a trend is starting
Note:
- Bollinger Bands work well in a ranging (sideways) market
- In a trending market, price will move along the band; don’t trade against the trend
- Combine with other indicators for a higher win rate
【Trading Techniques】Bollinger Bands are a useful tool for judging volatility and support/resistance
Bollinger Bands are a useful tool for judging volatility and support/resistance.
Practical uses of Bollinger Bands:
1. Price reaches the upper band + bearish signal = short
2. Price reaches the lower band + bullish signal = buy long
3. Price moves along the upper band = strong uptrend; hold
4. Price moves along the lower band = strong downtrend; hold
5. Bollinger Bands narrow = reversal/turning point is imminent
6. Bollinger Bands open up = a trend is starting
Note:
- Bollinger Bands work well in a ranging (sideways) market
- In a trending market, price will move along the band; don’t trade against the trend
- Combine with other indicators for a higher win rate
Bollinger Bands are a useful tool for judging volatility and support/resistance.
Practical uses of Bollinger Bands:
1. Price reaches the upper band + bearish signal = short
2. Price reaches the lower band + bullish signal = buy long
3. Price moves along the upper band = strong uptrend; hold
4. Price moves along the lower band = strong downtrend; hold
5. Bollinger Bands narrow = reversal/turning point is imminent
6. Bollinger Bands open up = a trend is starting
Note:
- Bollinger Bands work well in a ranging (sideways) market
- In a trending market, price will move along the band; don’t trade against the trend
- Combine with other indicators for a higher win rate
37
·
--
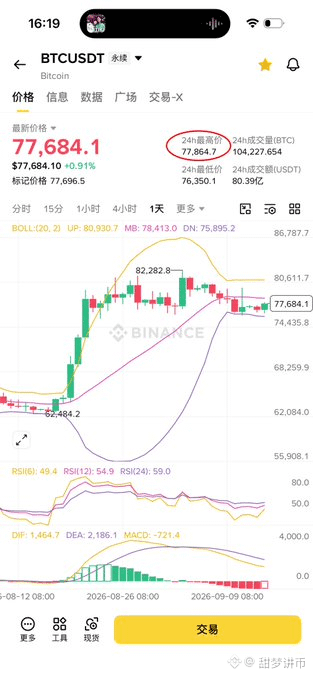
BTC peak at 77850 was reached; the bottom of the trading range is still 76450-76200. Only if the closing high is near 76200 does it indicate a pullback toward 74600-73755. So right now you can’t see a situation where it will dip back to 7.4-7.3w—no need to panic. From 76450-76200 you can continue entering longs on the dips. Even if you’re temporarily in a loss, it will be short-lived. A lower long rebound from below 76000, specifically 75750-75355, will also rise and cover 76200. Therefore defend farther out: buying into longs in batches below 77000 is relatively safe, and you’ll have opportunities to take profit. The big move will happen early Thursday morning—just add more and go long after it forms the golden low.
BTC peak at 77850 was reached; the bottom of the trading range is still 76450-76200. Only if the closing high is near 76200 does it indicate a pullback toward 74600-73755. So right now you can’t see a situation where it will dip back to 7.4-7.3w—no need to panic. From 76450-76200 you can continue entering longs on the dips. Even if you’re temporarily in a loss, it will be short-lived. A lower long rebound from below 76000, specifically 75750-75355, will also rise and cover 76200. Therefore defend farther out: buying into longs in batches below 77000 is relatively safe, and you’ll have opportunities to take profit. The big move will happen early Thursday morning—just add more and go long after it forms the golden low.
114
Log in to explore more content
Join global crypto users on Binance Square
⚡️ Get latest and useful information about crypto.
💬 Trusted by the world’s largest crypto exchange.
👍 Discover real insights from verified creators.
Email / Phone number
Trending Topics
FedRateWatch
692,784 views
3,301 Discussing
Share & Win Traffic Reward in our Trending Hashtag Campaign
✨Topic: FOMC September, What's The Fed's Next Move?
👉How to Join:
Publish a short post or article with hashtag #FedRateWatch
Create content based on the below angles:
- August core CPI rose 0.3% month-over-month, and the odds of a 25bp hike this week are now close to 90%. Do you anticipate a rate hike this week? Is it a one-off, or the start of a longer hiking cycle?
- If the hike lands, how does it play out for BTC, tech stocks, and gold? Bullish or bearish?
- How are you planning to trade next? Share your BTC, stocks or gold trade/holdings with our trade sharing widget.
⏰Campaign Period:
- 2026-09-15 11:00 - 2026-09-17 3:00 UTC
🎁Reward:
- Qualified posts that comply with the above guidelines and contain more than 100 words will be reviewed and may receive a random traffic boost of 500 to 3,000 views. You will receive a notification from your feed secretary if your post is selected.
- Get a chance to have your article featured on Binance Square Official
Need ideas for your post? Visit the topic page #FedRateWatch or the Square Guide on How to Post for Better Reach.
Binance Square Official
·427 Likes
·962.5k views
EthereumFallsBelow$2400
1,000 views
37 Discussing
USSenateBlocksClarityAct
5,338 views
182 Discussing