

Pe Mins
1.8k Posts

Pe Mins
Report
Block User
0 Following
10 Followers
5 Liked
Posts
·
--
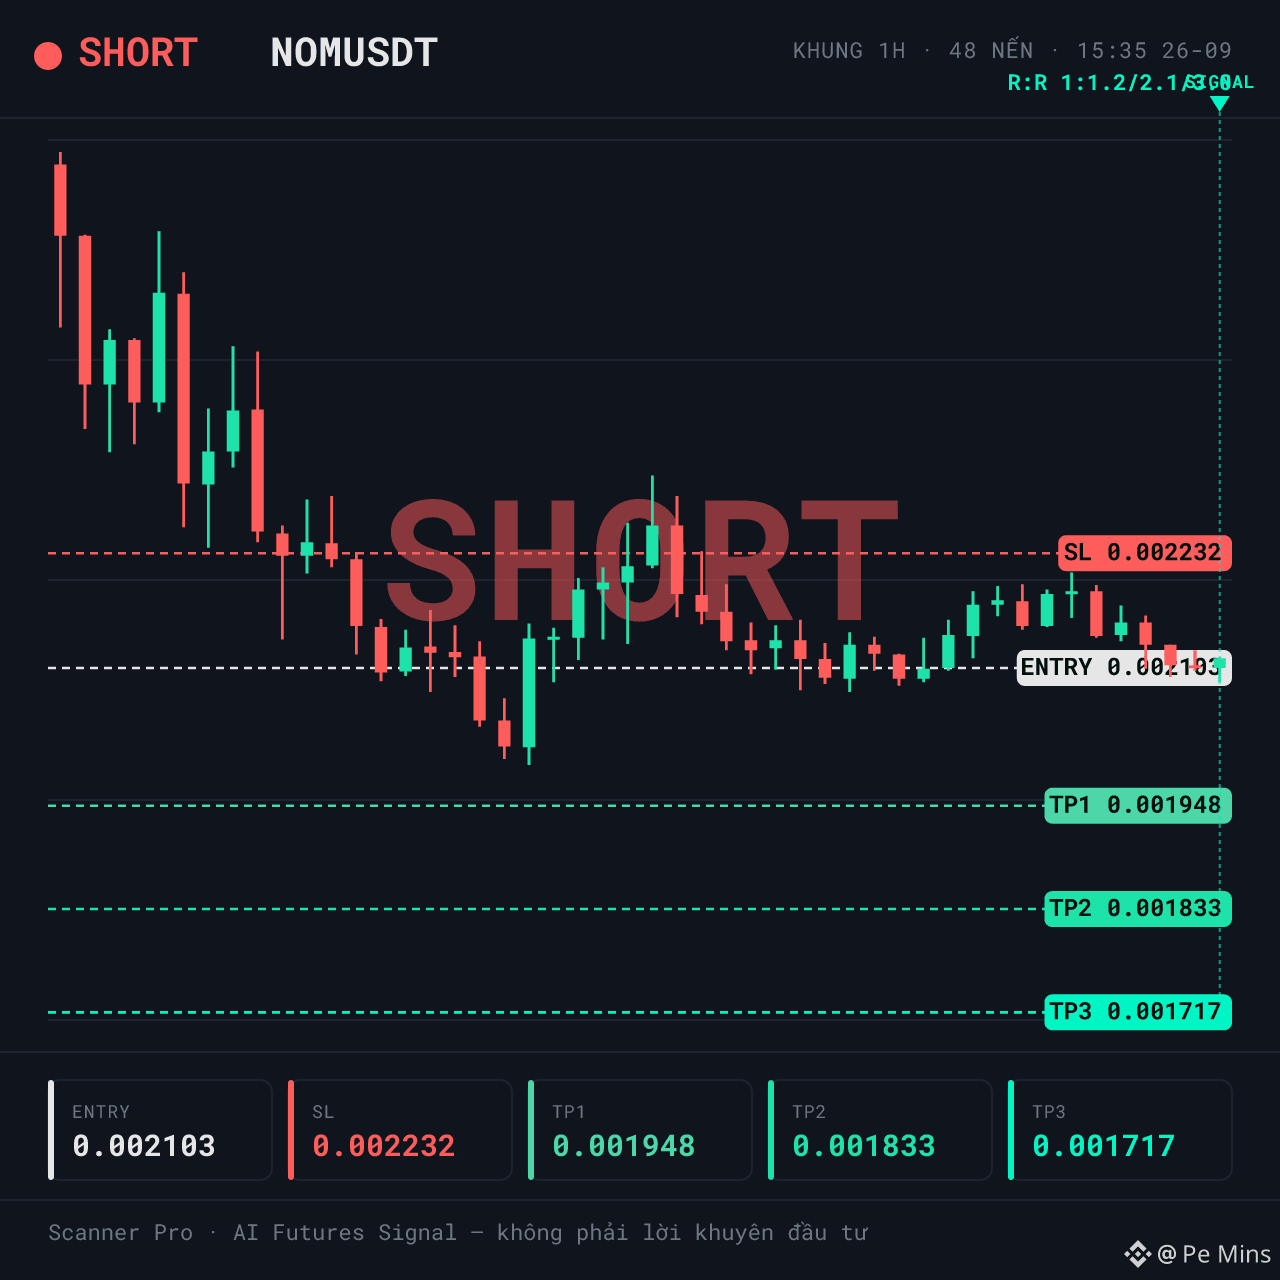
SHORT $NOM | 24h range is wide but volume has not been confirmed
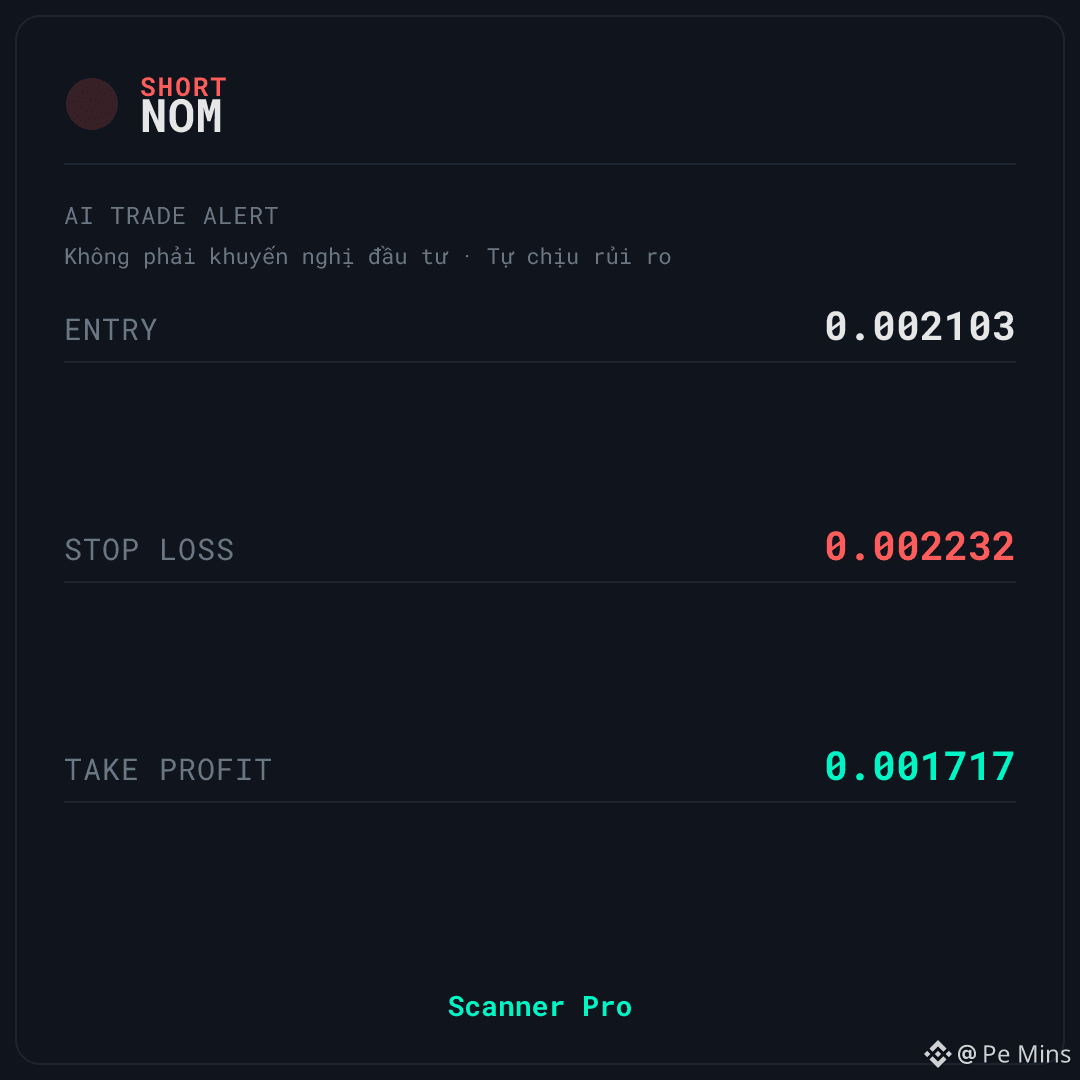
🚨 AI TRADE ALERT — $NOM
🔴 SHORT
📌 Entry: 0.0021 – 0.002106
🛑 Stop Loss: 0.002232
🎯 Take Profit: 0.001717
⏰ Valid for: 6 hours (15:35 – 21:35 VN) - Date: 26/09
$NOM is being tracked by Scanner Pro under the SHORT scenario when the price is deep within the low end of the 24h range. The market context is rated neutral; positive funding at 0.0050% indicates that the LONG side is paying fees to the SHORT side.
📊 CONTEXT & DATA
Funding is currently at 0.0050% — the LONG side is paying fees to the SHORT side, meaning the crowd is leaning opposite to this signal. This supports the SHORT direction.
Liquidity is rated high with 24h quote volume ~15.135.133 USDT, but the volume spike ratio is only 0.49x — the capital flow has not truly exploded to confirm a strong reversal. The 24h range is 11.5% — the market is tense rather than calm.
🚫 INVALIDATION POINT & RISK MANAGEMENT — $NOM
⚠️ Biggest risk: the price is sitting in the low zone of the 24h range (around 15%), so if bottom-buying demand appears, the SHORT scenario could be pushed against.
If the price closes above the stop-loss level on the signal card, the current SHORT scenario is no longer valid.
💡 Do you think this is a sign that the money is pulling out, or just a retest before price bounces back?
This is educational technical analysis content, not investment advice. Crypto trading carries high risk—you could lose all of your capital. Please do your own research and take responsibility for your decisions.
#Binance #Crypto #Futures
SHORT $NOM | 24h range is wide but volume has not been confirmed
🚨 AI TRADE ALERT — $NOM
🔴 SHORT
📌 Entry: 0.0021 – 0.002106
🛑 Stop Loss: 0.002232
🎯 Take Profit: 0.001717
⏰ Valid for: 6 hours (15:35 – 21:35 VN) - Date: 26/09
$NOM is being tracked by Scanner Pro under the SHORT scenario when the price is deep within the low end of the 24h range. The market context is rated neutral; positive funding at 0.0050% indicates that the LONG side is paying fees to the SHORT side.
📊 CONTEXT & DATA
Funding is currently at 0.0050% — the LONG side is paying fees to the SHORT side, meaning the crowd is leaning opposite to this signal. This supports the SHORT direction.
Liquidity is rated high with 24h quote volume ~15.135.133 USDT, but the volume spike ratio is only 0.49x — the capital flow has not truly exploded to confirm a strong reversal. The 24h range is 11.5% — the market is tense rather than calm.
🚫 INVALIDATION POINT & RISK MANAGEMENT — $NOM
⚠️ Biggest risk: the price is sitting in the low zone of the 24h range (around 15%), so if bottom-buying demand appears, the SHORT scenario could be pushed against.
If the price closes above the stop-loss level on the signal card, the current SHORT scenario is no longer valid.
💡 Do you think this is a sign that the money is pulling out, or just a retest before price bounces back?
This is educational technical analysis content, not investment advice. Crypto trading carries high risk—you could lose all of your capital. Please do your own research and take responsibility for your decisions.
#Binance #Crypto #Futures
🚨 AI TRADE ALERT — $NOM
🔴 SHORT
📌 Entry: 0.0021 – 0.002106
🛑 Stop Loss: 0.002232
🎯 Take Profit: 0.001717
⏰ Valid for: 6 hours (15:35 – 21:35 VN) - Date: 26/09
$NOM is being tracked by Scanner Pro under the SHORT scenario when the price is deep within the low end of the 24h range. The market context is rated neutral; positive funding at 0.0050% indicates that the LONG side is paying fees to the SHORT side.
📊 CONTEXT & DATA
Funding is currently at 0.0050% — the LONG side is paying fees to the SHORT side, meaning the crowd is leaning opposite to this signal. This supports the SHORT direction.
Liquidity is rated high with 24h quote volume ~15.135.133 USDT, but the volume spike ratio is only 0.49x — the capital flow has not truly exploded to confirm a strong reversal. The 24h range is 11.5% — the market is tense rather than calm.
🚫 INVALIDATION POINT & RISK MANAGEMENT — $NOM
⚠️ Biggest risk: the price is sitting in the low zone of the 24h range (around 15%), so if bottom-buying demand appears, the SHORT scenario could be pushed against.
If the price closes above the stop-loss level on the signal card, the current SHORT scenario is no longer valid.
💡 Do you think this is a sign that the money is pulling out, or just a retest before price bounces back?
This is educational technical analysis content, not investment advice. Crypto trading carries high risk—you could lose all of your capital. Please do your own research and take responsibility for your decisions.
#Binance #Crypto #Futures
5
·
--
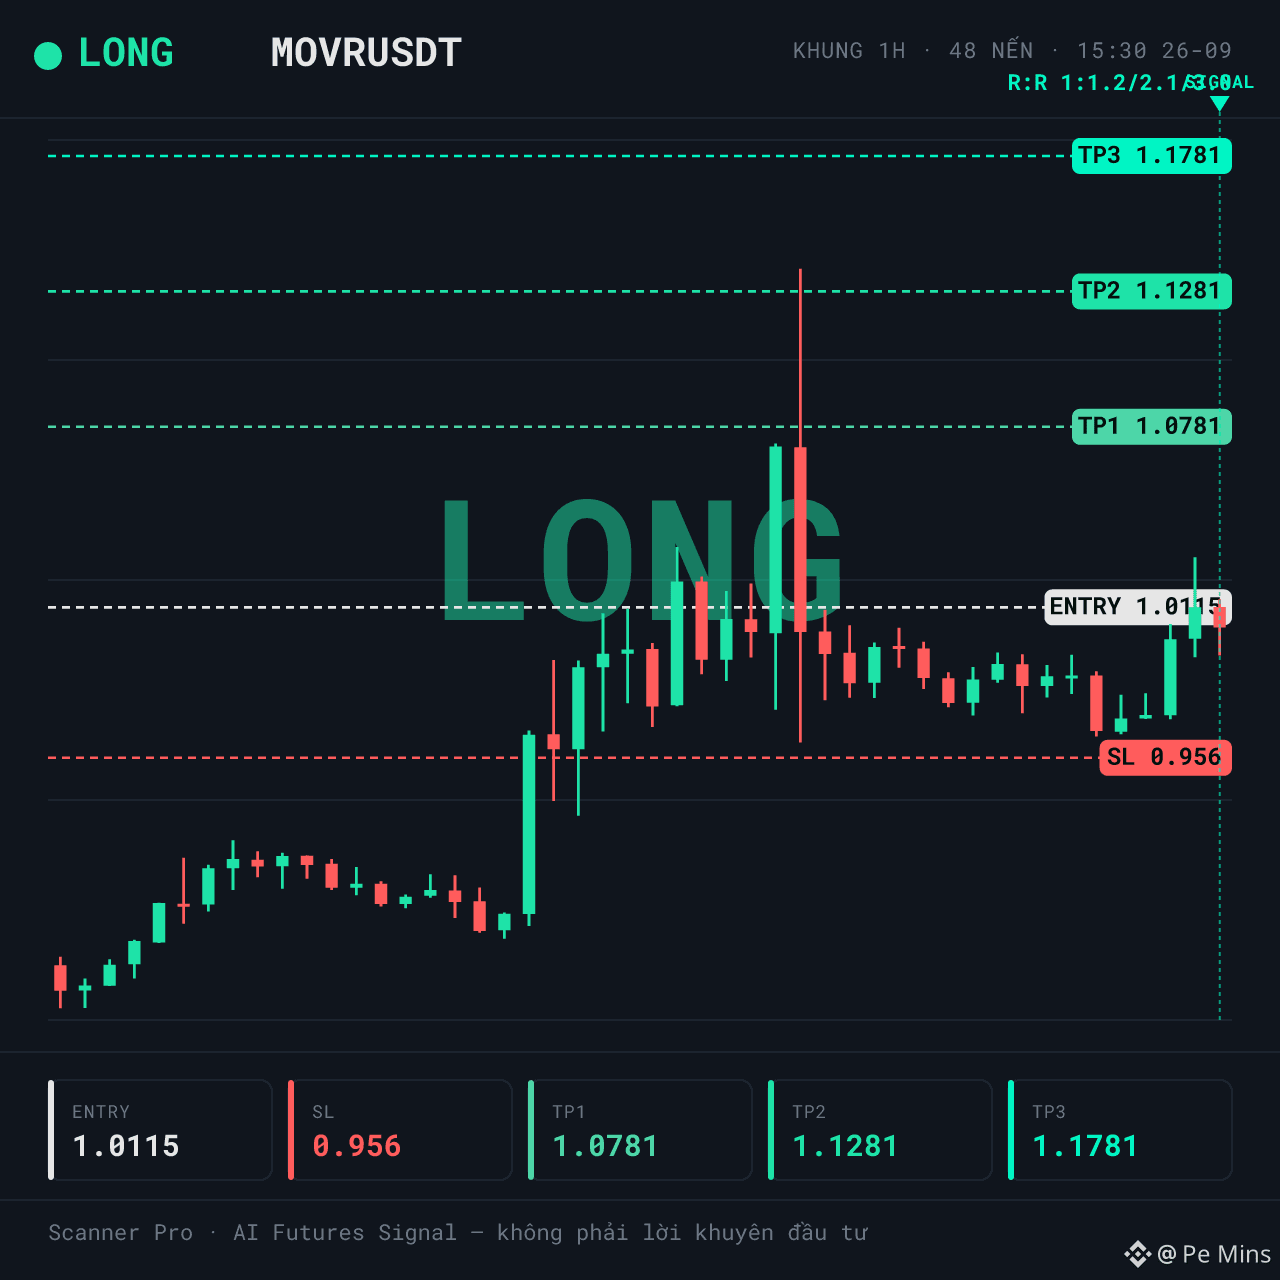
LONG $MOVR | Funding long: the buy side is paying the sell side fees
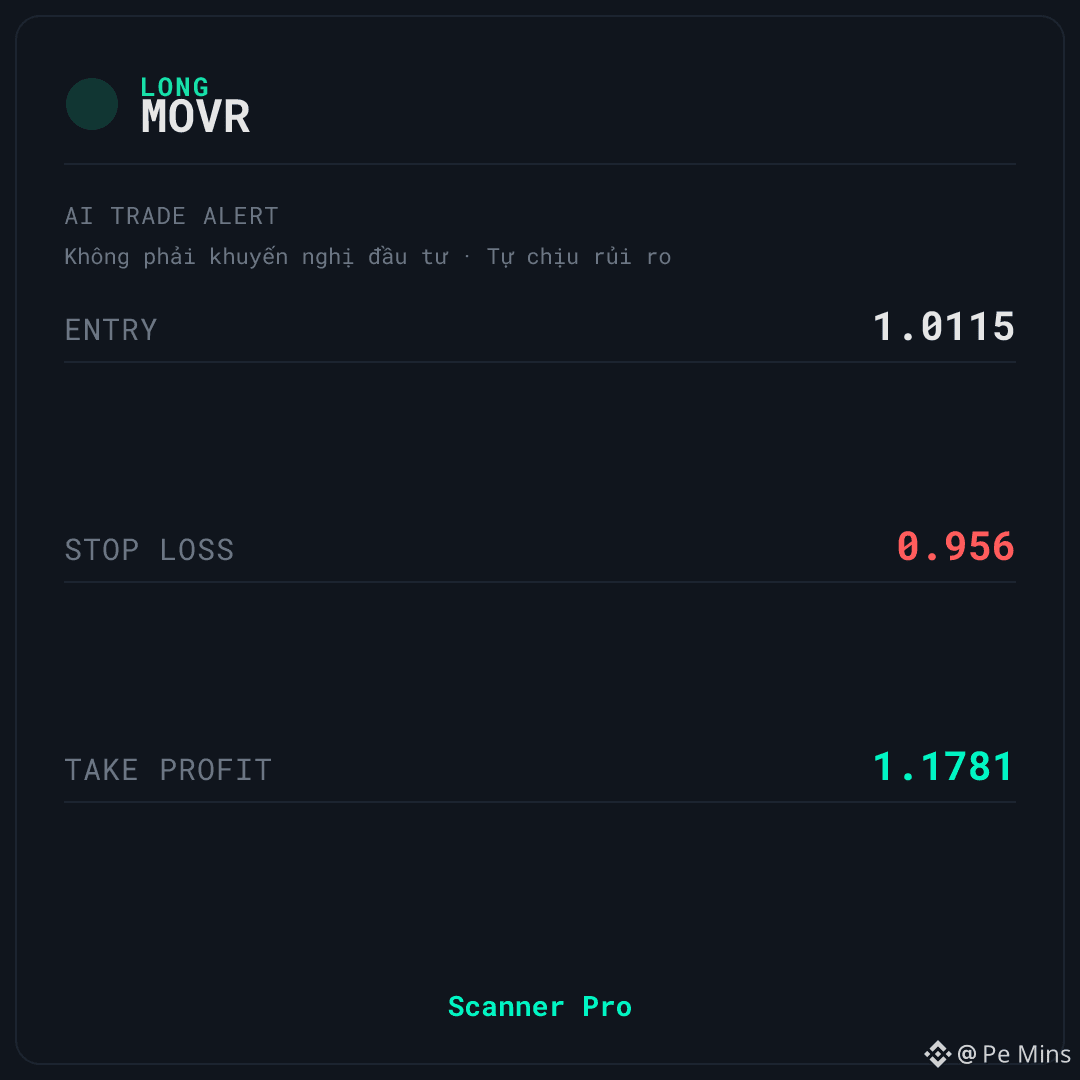
🚨 AI TRADE ALERT — $MOVR
🟢 LONG
📌 Entry: 1.01 – 1.013
🛑 Stop Loss: 0.956
🎯 Take Profit: 1.1781
⏰ Validity: 6 hours (15:30 – 21:30 VN) - Date: 26/09
$MOVR is being monitored by Scanner Pro on the LONG scenario when the price holds the structure within the 24-hour range. The 24h volume is around 25.3 million, and positive funding suggests the money flow is leaning in one direction.
📊 WHAT DATA IS SHOWING
Liquidity is high, with a 24h range of 17.4% — wide enough for a swing, but it also requires tight risk management. Funding 0.0050%: the LONG side is paying the SHORT side, meaning the crowd is leaning in the same direction as this signal.
That’s the downside that needs to be stated clearly: when the majority has to pay fees, counter-pressure can appear if buying force isn’t maintained. That’s why this signal should be viewed as a conditional scenario, not a one-way confirmation.
💡 SCENARIO & OPEN QUESTIONS — $MOVR
🚫 The biggest conflict: positive funding means the LONG side is paying the SHORT side — the side with more participants is also the one bearing the cost, a structure that can easily produce a shakeout move if additional capital doesn’t flow in.
If the price closes below the stop-loss level in the signal card, the current LONG scenario is no longer valid.
In your view, is this pullback a shakeout of the crowded position or a sign that money is withdrawing from this area?
This is educational technical analysis content, not investment advice. Crypto trading is high risk; you may lose all your capital. Do your own research and take responsibility for your decisions.
#Binance #Crypto #Futures
LONG $MOVR | Funding long: the buy side is paying the sell side fees
🚨 AI TRADE ALERT — $MOVR
🟢 LONG
📌 Entry: 1.01 – 1.013
🛑 Stop Loss: 0.956
🎯 Take Profit: 1.1781
⏰ Validity: 6 hours (15:30 – 21:30 VN) - Date: 26/09
$MOVR is being monitored by Scanner Pro on the LONG scenario when the price holds the structure within the 24-hour range. The 24h volume is around 25.3 million, and positive funding suggests the money flow is leaning in one direction.
📊 WHAT DATA IS SHOWING
Liquidity is high, with a 24h range of 17.4% — wide enough for a swing, but it also requires tight risk management. Funding 0.0050%: the LONG side is paying the SHORT side, meaning the crowd is leaning in the same direction as this signal.
That’s the downside that needs to be stated clearly: when the majority has to pay fees, counter-pressure can appear if buying force isn’t maintained. That’s why this signal should be viewed as a conditional scenario, not a one-way confirmation.
💡 SCENARIO & OPEN QUESTIONS — $MOVR
🚫 The biggest conflict: positive funding means the LONG side is paying the SHORT side — the side with more participants is also the one bearing the cost, a structure that can easily produce a shakeout move if additional capital doesn’t flow in.
If the price closes below the stop-loss level in the signal card, the current LONG scenario is no longer valid.
In your view, is this pullback a shakeout of the crowded position or a sign that money is withdrawing from this area?
This is educational technical analysis content, not investment advice. Crypto trading is high risk; you may lose all your capital. Do your own research and take responsibility for your decisions.
#Binance #Crypto #Futures
🚨 AI TRADE ALERT — $MOVR
🟢 LONG
📌 Entry: 1.01 – 1.013
🛑 Stop Loss: 0.956
🎯 Take Profit: 1.1781
⏰ Validity: 6 hours (15:30 – 21:30 VN) - Date: 26/09
$MOVR is being monitored by Scanner Pro on the LONG scenario when the price holds the structure within the 24-hour range. The 24h volume is around 25.3 million, and positive funding suggests the money flow is leaning in one direction.
📊 WHAT DATA IS SHOWING
Liquidity is high, with a 24h range of 17.4% — wide enough for a swing, but it also requires tight risk management. Funding 0.0050%: the LONG side is paying the SHORT side, meaning the crowd is leaning in the same direction as this signal.
That’s the downside that needs to be stated clearly: when the majority has to pay fees, counter-pressure can appear if buying force isn’t maintained. That’s why this signal should be viewed as a conditional scenario, not a one-way confirmation.
💡 SCENARIO & OPEN QUESTIONS — $MOVR
🚫 The biggest conflict: positive funding means the LONG side is paying the SHORT side — the side with more participants is also the one bearing the cost, a structure that can easily produce a shakeout move if additional capital doesn’t flow in.
If the price closes below the stop-loss level in the signal card, the current LONG scenario is no longer valid.
In your view, is this pullback a shakeout of the crowded position or a sign that money is withdrawing from this area?
This is educational technical analysis content, not investment advice. Crypto trading is high risk; you may lose all your capital. Do your own research and take responsibility for your decisions.
#Binance #Crypto #Futures
26
·
--
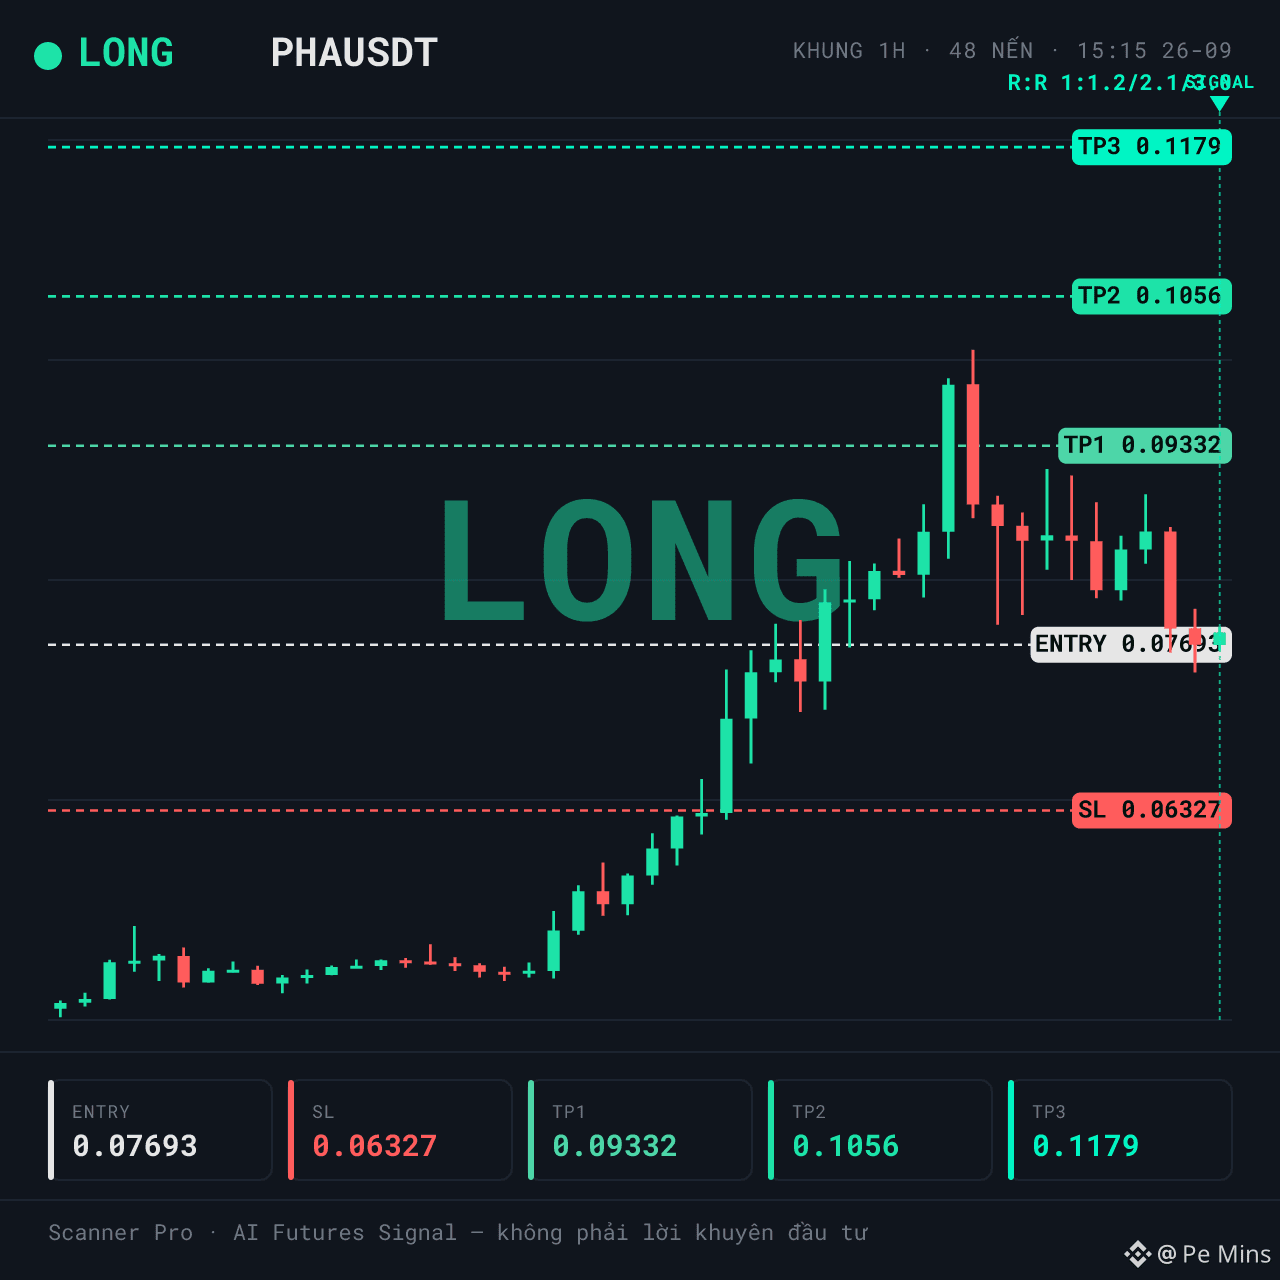
LONG $PHA | Funding in Vietnam: The long side is paying fees, the crowd is leaning in the same direction
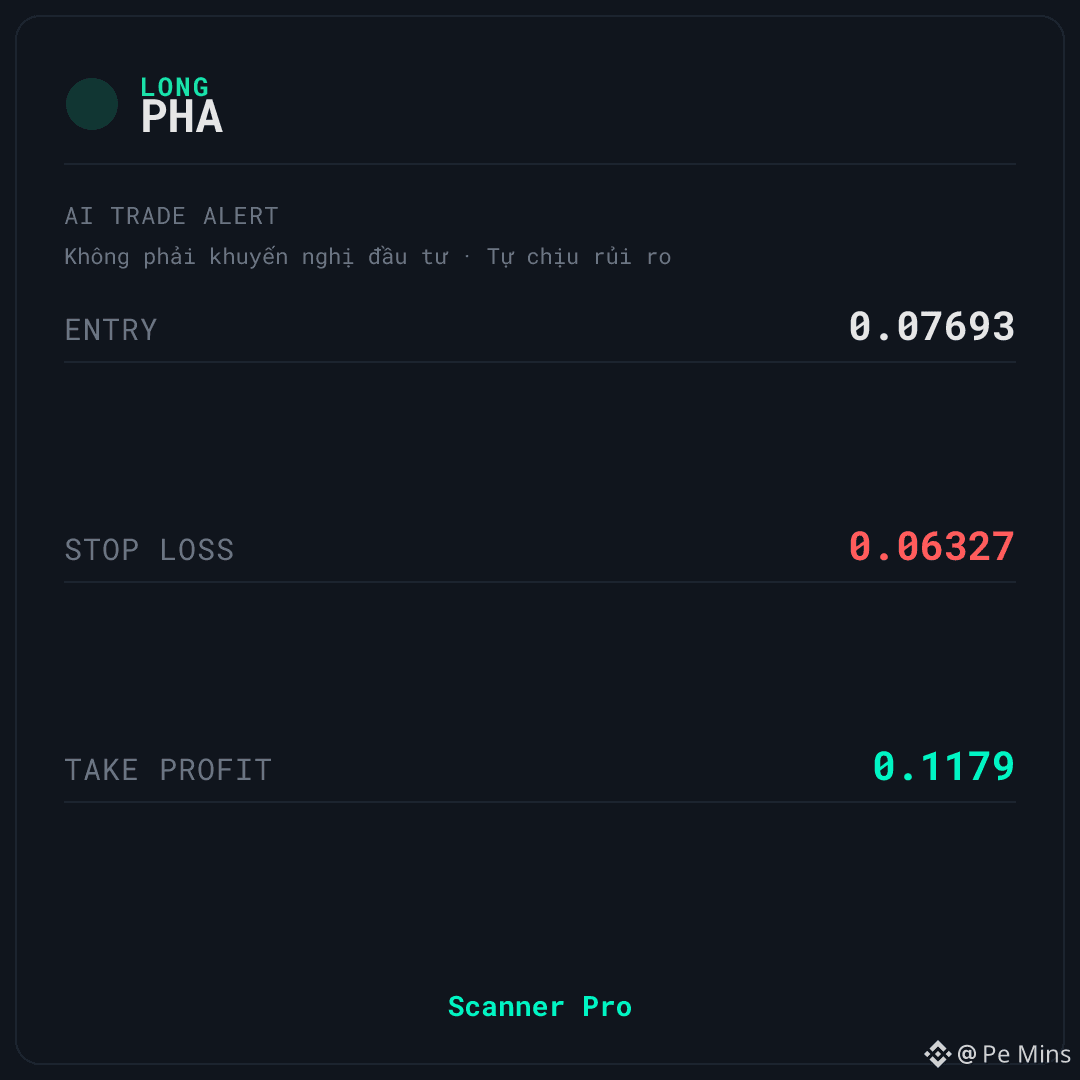
🚨 AI TRADE ALERT — $PHA
🟢 LONG
📌 Entry: 0.07681 – 0.07705
🛑 Stop Loss: 0.06327
🎯 Take Profit: 0.1179
⏰ Validity: 6 hours (15:15 – 21:15 VN) - Date: 26/09
$PHA is being monitored by Scanner Pro for a LONG setup after a strong rebound from the current price zone. The backdrop is classified as bullish with high liquidity, but the funding data shows that the buyers (long side) are paying fees.
📊 WHAT THE DATA IS SHOWING
Liquidity is high: 24h quote volume ~659.747.069 USDT, volume spike ratio 0.10x — capital has not truly exploded yet despite the price bouncing quite strongly.
Funding 0.0050%: the LONG side is paying fees to the SHORT side, meaning the market is leaning long. This is a downside because the crowd is standing on the same side as the signal and must pay fees to maintain positions.
💡 SCENARIO & OPEN QUESTIONS — $PHA
⚠️ Biggest conflict: price is at the upper end of the 24h range (58.8%), plus the fact that the long side is paying funding — these two factors make the chasing-buy scenario less attractive.
🚫 If the price closes below the stop-loss level on the signal card, the current LONG scenario is no longer valid.
In your view, is this breakout the real inflow of capital, or just a pull ahead of time before the long side pays the price?
This is educational technical analysis content, not investment advice. Cryptocurrency trading carries high risk—you may lose all of your capital. Please research on your own and take responsibility for your decisions.
#Binance #Crypto #Futures
LONG $PHA | Funding in Vietnam: The long side is paying fees, the crowd is leaning in the same direction
🚨 AI TRADE ALERT — $PHA
🟢 LONG
📌 Entry: 0.07681 – 0.07705
🛑 Stop Loss: 0.06327
🎯 Take Profit: 0.1179
⏰ Validity: 6 hours (15:15 – 21:15 VN) - Date: 26/09
$PHA is being monitored by Scanner Pro for a LONG setup after a strong rebound from the current price zone. The backdrop is classified as bullish with high liquidity, but the funding data shows that the buyers (long side) are paying fees.
📊 WHAT THE DATA IS SHOWING
Liquidity is high: 24h quote volume ~659.747.069 USDT, volume spike ratio 0.10x — capital has not truly exploded yet despite the price bouncing quite strongly.
Funding 0.0050%: the LONG side is paying fees to the SHORT side, meaning the market is leaning long. This is a downside because the crowd is standing on the same side as the signal and must pay fees to maintain positions.
💡 SCENARIO & OPEN QUESTIONS — $PHA
⚠️ Biggest conflict: price is at the upper end of the 24h range (58.8%), plus the fact that the long side is paying funding — these two factors make the chasing-buy scenario less attractive.
🚫 If the price closes below the stop-loss level on the signal card, the current LONG scenario is no longer valid.
In your view, is this breakout the real inflow of capital, or just a pull ahead of time before the long side pays the price?
This is educational technical analysis content, not investment advice. Cryptocurrency trading carries high risk—you may lose all of your capital. Please research on your own and take responsibility for your decisions.
#Binance #Crypto #Futures
🚨 AI TRADE ALERT — $PHA
🟢 LONG
📌 Entry: 0.07681 – 0.07705
🛑 Stop Loss: 0.06327
🎯 Take Profit: 0.1179
⏰ Validity: 6 hours (15:15 – 21:15 VN) - Date: 26/09
$PHA is being monitored by Scanner Pro for a LONG setup after a strong rebound from the current price zone. The backdrop is classified as bullish with high liquidity, but the funding data shows that the buyers (long side) are paying fees.
📊 WHAT THE DATA IS SHOWING
Liquidity is high: 24h quote volume ~659.747.069 USDT, volume spike ratio 0.10x — capital has not truly exploded yet despite the price bouncing quite strongly.
Funding 0.0050%: the LONG side is paying fees to the SHORT side, meaning the market is leaning long. This is a downside because the crowd is standing on the same side as the signal and must pay fees to maintain positions.
💡 SCENARIO & OPEN QUESTIONS — $PHA
⚠️ Biggest conflict: price is at the upper end of the 24h range (58.8%), plus the fact that the long side is paying funding — these two factors make the chasing-buy scenario less attractive.
🚫 If the price closes below the stop-loss level on the signal card, the current LONG scenario is no longer valid.
In your view, is this breakout the real inflow of capital, or just a pull ahead of time before the long side pays the price?
This is educational technical analysis content, not investment advice. Cryptocurrency trading carries high risk—you may lose all of your capital. Please research on your own and take responsibility for your decisions.
#Binance #Crypto #Futures
2
·
--
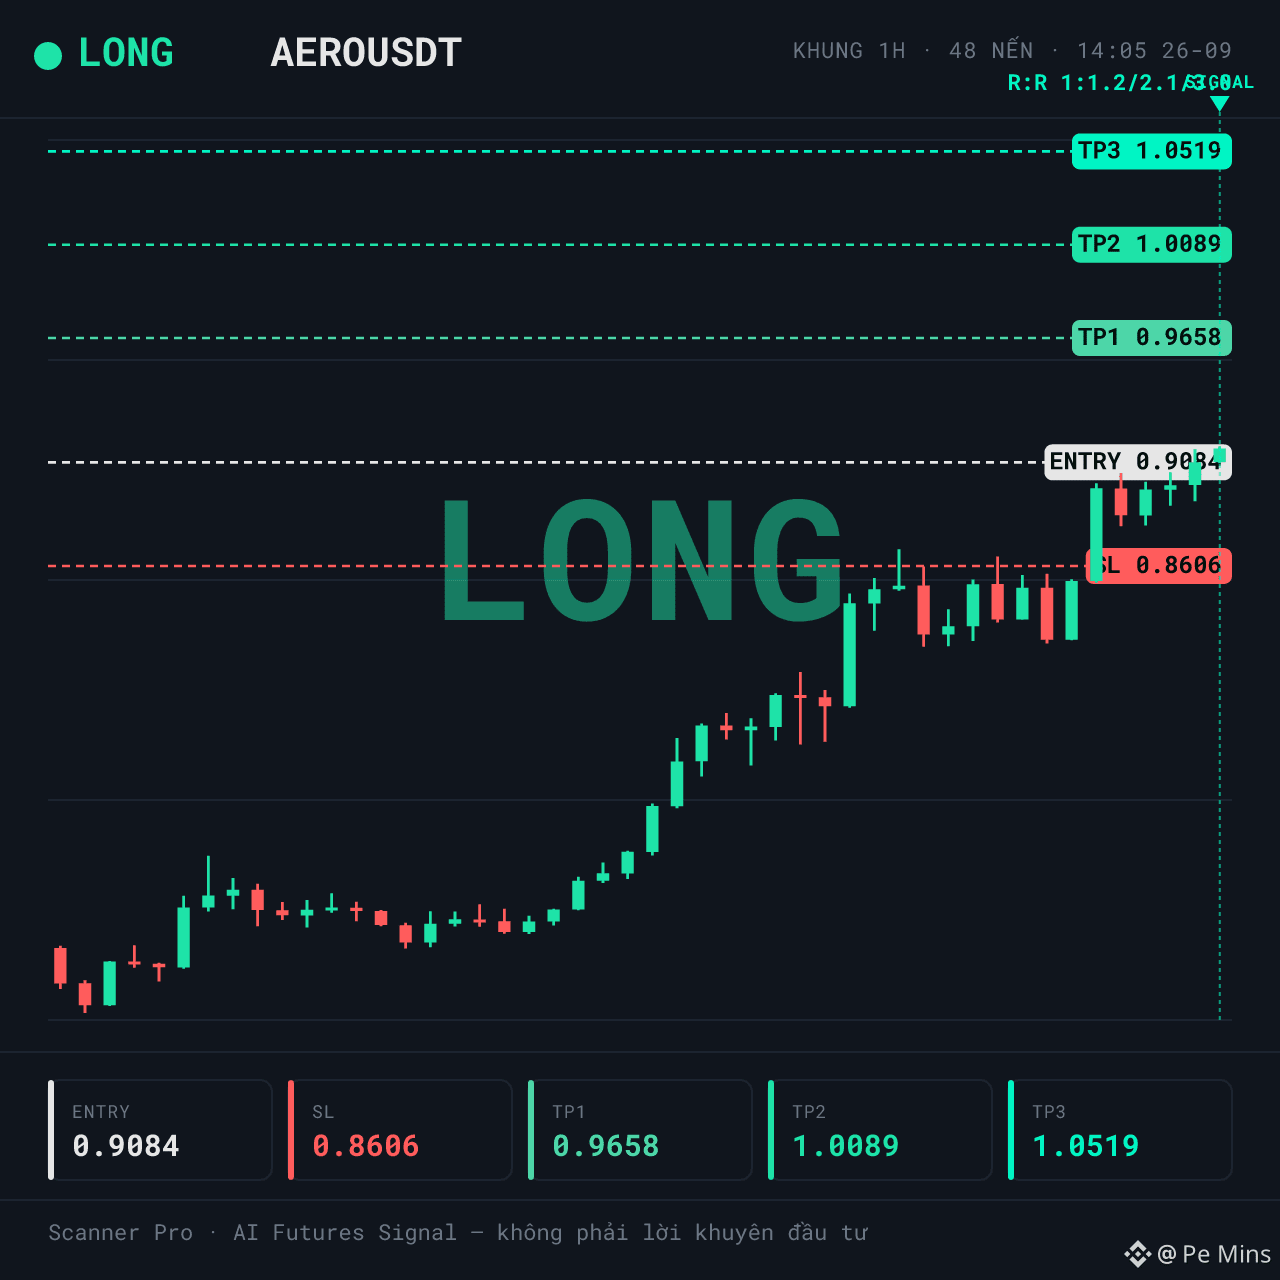
LONG $AERO | 24h Amplitude 21.7% — is the market tense or calm?
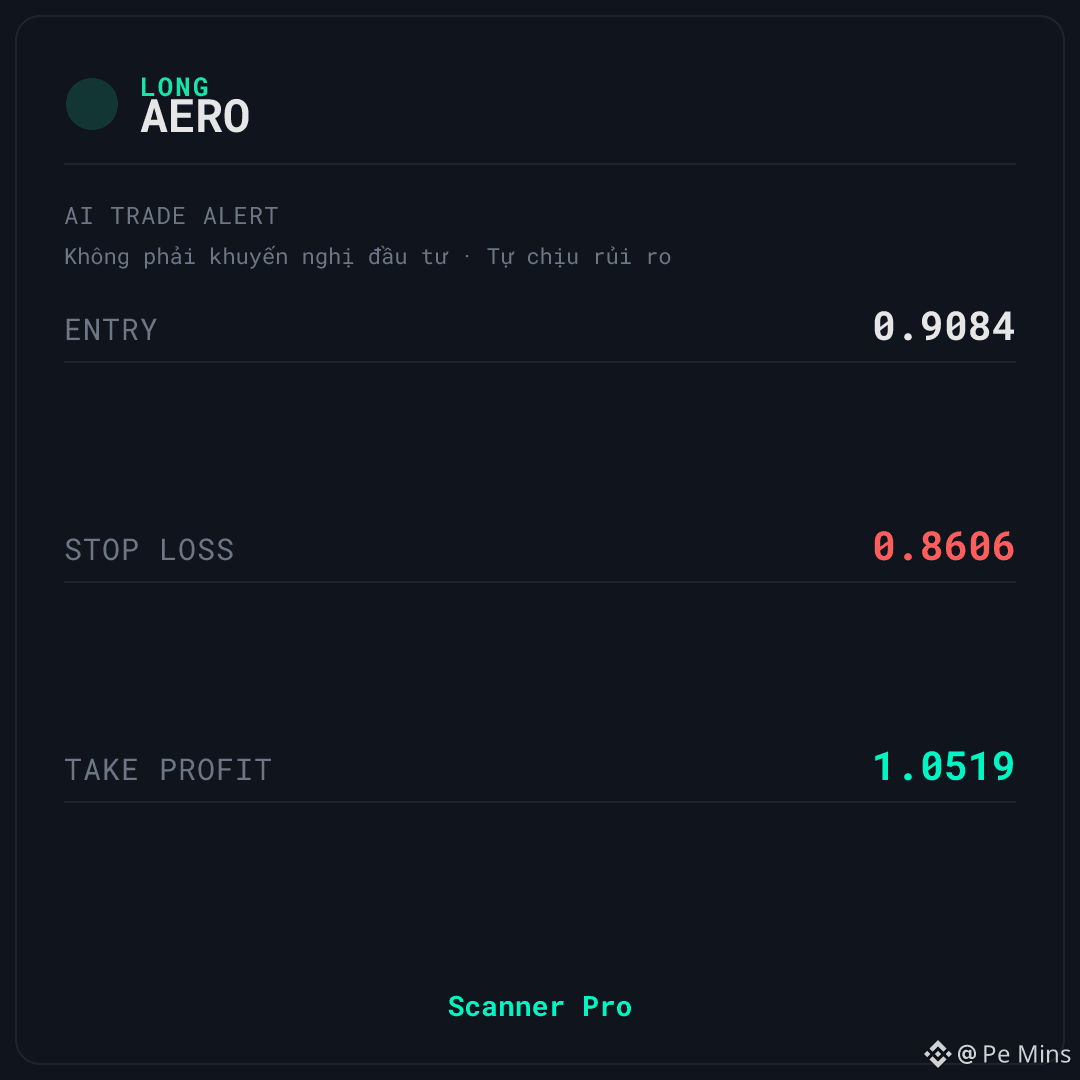
🚨 AI TRADE ALERT — $AERO
🟢 LONG
📌 Entry: 0.907 – 0.9098
🛑 Stop Loss: 0.8606
🎯 Take Profit: 1.0519
⏰ Valid for: 6 hours (14:05 – 20:05 VN) - Date: 26/09
$AERO is being tracked by Scanner Pro following the LONG scenario when the price reacts positively around the entry zone. The backdrop is categorized as an uptrend, with high liquidity, and a 24h amplitude of 21.7%.
📊 CONTEXT & DATA
Liquidity is high: 24h quote volume ~109,351,648 USDT, though the volume spike ratio is only 0.06x — money flow hasn’t really exploded. Funding is 0.0050%: the LONG side is paying fees to the SHORT side, meaning the crowd is leaning WITH this signal, and the other side has to pay — this is a DISADVANTAGE point, let’s be straight.
Price is sitting at 100% of the 24h amplitude, i.e., the top of the range — there isn’t much room to rise in the short term. A 21.7% amplitude indicates the market is tense, not calm.
🚫 INVALIDITY & RISK MANAGEMENT — $AERO
🚫 The biggest unfavorable point: price is at the highest end of the 24h range, combined with momentum that’s gotten hot — 1h RSI 73.99 is no longer a supporting factor for a buy-the-dip chase scenario.
If the price closes below the stop-loss level on the signal card, the current LONG scenario is no longer valid.
💡 In your view, is this a sign that the money flow is actively pushing the price, or just a temporary surge within the amplitude before it cools down?
This is educational technical analysis content, not investment advice. Cryptocurrency trading carries high risk; you may lose all of your capital. Do your own research and take responsibility for your decisions.
#Binance #Crypto #Futures
LONG $AERO | 24h Amplitude 21.7% — is the market tense or calm?
🚨 AI TRADE ALERT — $AERO
🟢 LONG
📌 Entry: 0.907 – 0.9098
🛑 Stop Loss: 0.8606
🎯 Take Profit: 1.0519
⏰ Valid for: 6 hours (14:05 – 20:05 VN) - Date: 26/09
$AERO is being tracked by Scanner Pro following the LONG scenario when the price reacts positively around the entry zone. The backdrop is categorized as an uptrend, with high liquidity, and a 24h amplitude of 21.7%.
📊 CONTEXT & DATA
Liquidity is high: 24h quote volume ~109,351,648 USDT, though the volume spike ratio is only 0.06x — money flow hasn’t really exploded. Funding is 0.0050%: the LONG side is paying fees to the SHORT side, meaning the crowd is leaning WITH this signal, and the other side has to pay — this is a DISADVANTAGE point, let’s be straight.
Price is sitting at 100% of the 24h amplitude, i.e., the top of the range — there isn’t much room to rise in the short term. A 21.7% amplitude indicates the market is tense, not calm.
🚫 INVALIDITY & RISK MANAGEMENT — $AERO
🚫 The biggest unfavorable point: price is at the highest end of the 24h range, combined with momentum that’s gotten hot — 1h RSI 73.99 is no longer a supporting factor for a buy-the-dip chase scenario.
If the price closes below the stop-loss level on the signal card, the current LONG scenario is no longer valid.
💡 In your view, is this a sign that the money flow is actively pushing the price, or just a temporary surge within the amplitude before it cools down?
This is educational technical analysis content, not investment advice. Cryptocurrency trading carries high risk; you may lose all of your capital. Do your own research and take responsibility for your decisions.
#Binance #Crypto #Futures
🚨 AI TRADE ALERT — $AERO
🟢 LONG
📌 Entry: 0.907 – 0.9098
🛑 Stop Loss: 0.8606
🎯 Take Profit: 1.0519
⏰ Valid for: 6 hours (14:05 – 20:05 VN) - Date: 26/09
$AERO is being tracked by Scanner Pro following the LONG scenario when the price reacts positively around the entry zone. The backdrop is categorized as an uptrend, with high liquidity, and a 24h amplitude of 21.7%.
📊 CONTEXT & DATA
Liquidity is high: 24h quote volume ~109,351,648 USDT, though the volume spike ratio is only 0.06x — money flow hasn’t really exploded. Funding is 0.0050%: the LONG side is paying fees to the SHORT side, meaning the crowd is leaning WITH this signal, and the other side has to pay — this is a DISADVANTAGE point, let’s be straight.
Price is sitting at 100% of the 24h amplitude, i.e., the top of the range — there isn’t much room to rise in the short term. A 21.7% amplitude indicates the market is tense, not calm.
🚫 INVALIDITY & RISK MANAGEMENT — $AERO
🚫 The biggest unfavorable point: price is at the highest end of the 24h range, combined with momentum that’s gotten hot — 1h RSI 73.99 is no longer a supporting factor for a buy-the-dip chase scenario.
If the price closes below the stop-loss level on the signal card, the current LONG scenario is no longer valid.
💡 In your view, is this a sign that the money flow is actively pushing the price, or just a temporary surge within the amplitude before it cools down?
This is educational technical analysis content, not investment advice. Cryptocurrency trading carries high risk; you may lose all of your capital. Do your own research and take responsibility for your decisions.
#Binance #Crypto #Futures
3
·
--
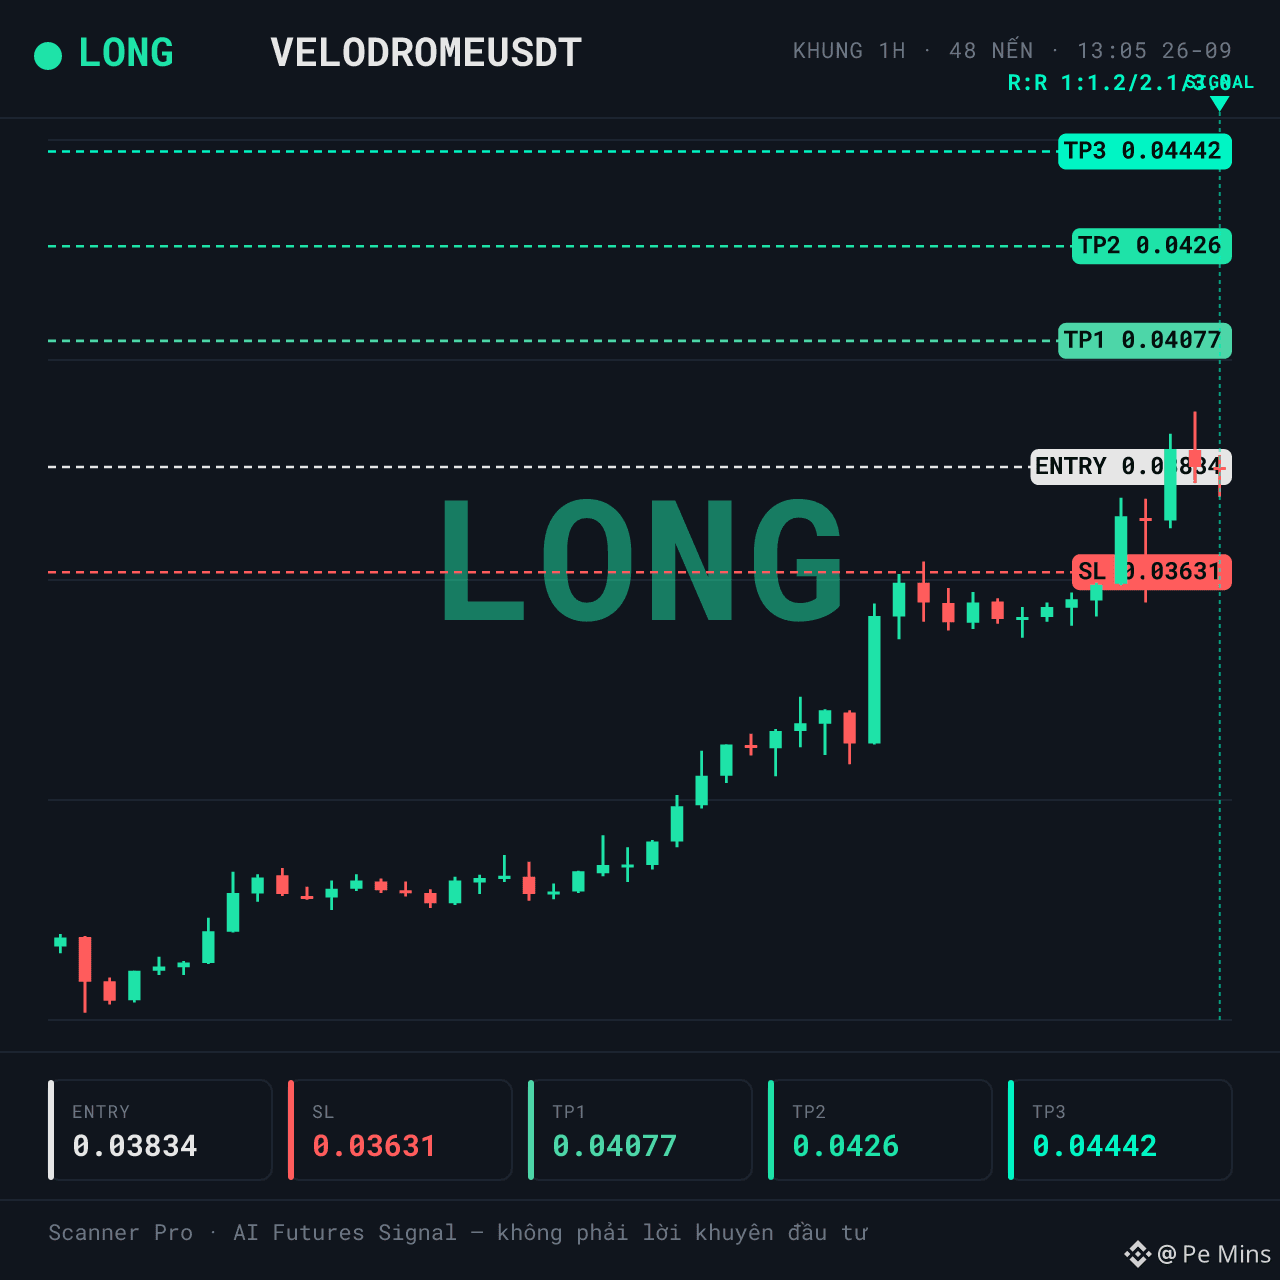
LONG $VELODROME | High liquidity, but volume has not caught up
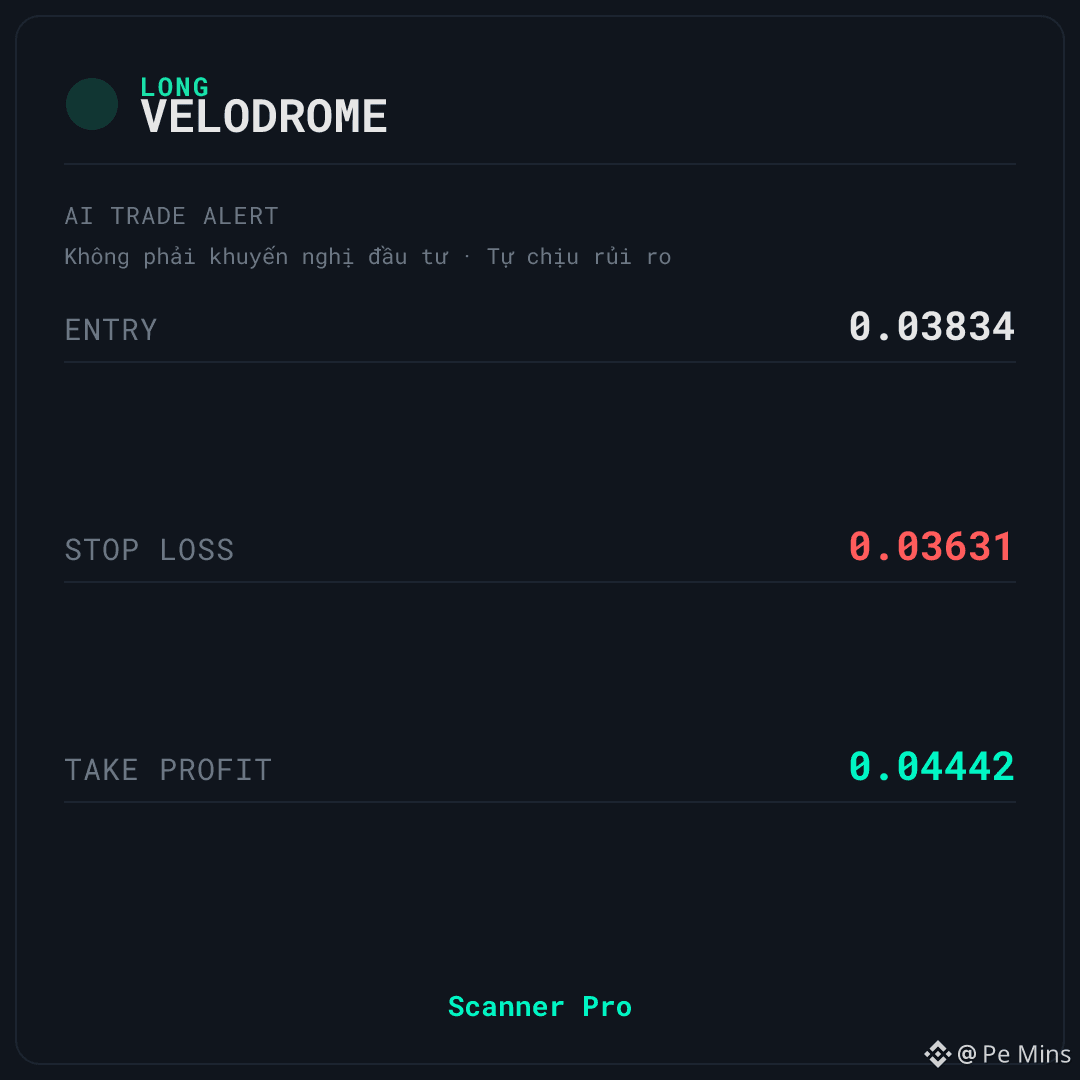
🚨 AI TRADE ALERT — $VELODROME
🟢 LONG
📌 Entry: 0.03828 – 0.0384
🛑 Stop Loss: 0.03631
🎯 Take Profit: 0.04442
⏰ Valid for: 6 hours (13:05 – 19:05 VN) - Date: 26/09
$VELODROME is being monitored by Scanner Pro for the LONG scenario when price holds firmly near the upper range of the 24h band. Liquidity is high, but the volume spike ratio is only 0.28x — capital has not truly stepped in yet.
📊 WHY IT’S WORTH NOTING
Market liquidity is rated high, with 24h quote volume ~12,468,151 USDT. This is a foundation that helps reduce the risk of slippage when orders are filled at the current price zone.
However, the volume spike ratio is only 0.28x — trading volume has not surged proportionally with the uptrend. Funding at 0.0051% indicates the LONG side is paying the SHORT side, meaning the market is leaning toward LONG.
⚠️ SETUP & RISK — $VELODROME
🚫 Biggest downside: the crowd is leaning in the SAME direction as this signal, and that side is paying a fee — this is the risk that needs monitoring, not a supporting factor. Also, price is currently in the upper part (86%) of the 24h range, so additional upside room may be limited.
If price closes below the stop-loss level shown on the signal card, the current LONG scenario is no longer valid.
In your view, is this real money flowing in, or just a price pull within a thick liquidity zone?
This is educational technical analysis content, not investment advice. Crypto trading involves high risk, and you may lose all of your capital. Please do your own research and take responsibility for your decisions.
#Binance #Crypto #Futures
LONG $VELODROME | High liquidity, but volume has not caught up
🚨 AI TRADE ALERT — $VELODROME
🟢 LONG
📌 Entry: 0.03828 – 0.0384
🛑 Stop Loss: 0.03631
🎯 Take Profit: 0.04442
⏰ Valid for: 6 hours (13:05 – 19:05 VN) - Date: 26/09
$VELODROME is being monitored by Scanner Pro for the LONG scenario when price holds firmly near the upper range of the 24h band. Liquidity is high, but the volume spike ratio is only 0.28x — capital has not truly stepped in yet.
📊 WHY IT’S WORTH NOTING
Market liquidity is rated high, with 24h quote volume ~12,468,151 USDT. This is a foundation that helps reduce the risk of slippage when orders are filled at the current price zone.
However, the volume spike ratio is only 0.28x — trading volume has not surged proportionally with the uptrend. Funding at 0.0051% indicates the LONG side is paying the SHORT side, meaning the market is leaning toward LONG.
⚠️ SETUP & RISK — $VELODROME
🚫 Biggest downside: the crowd is leaning in the SAME direction as this signal, and that side is paying a fee — this is the risk that needs monitoring, not a supporting factor. Also, price is currently in the upper part (86%) of the 24h range, so additional upside room may be limited.
If price closes below the stop-loss level shown on the signal card, the current LONG scenario is no longer valid.
In your view, is this real money flowing in, or just a price pull within a thick liquidity zone?
This is educational technical analysis content, not investment advice. Crypto trading involves high risk, and you may lose all of your capital. Please do your own research and take responsibility for your decisions.
#Binance #Crypto #Futures
🚨 AI TRADE ALERT — $VELODROME
🟢 LONG
📌 Entry: 0.03828 – 0.0384
🛑 Stop Loss: 0.03631
🎯 Take Profit: 0.04442
⏰ Valid for: 6 hours (13:05 – 19:05 VN) - Date: 26/09
$VELODROME is being monitored by Scanner Pro for the LONG scenario when price holds firmly near the upper range of the 24h band. Liquidity is high, but the volume spike ratio is only 0.28x — capital has not truly stepped in yet.
📊 WHY IT’S WORTH NOTING
Market liquidity is rated high, with 24h quote volume ~12,468,151 USDT. This is a foundation that helps reduce the risk of slippage when orders are filled at the current price zone.
However, the volume spike ratio is only 0.28x — trading volume has not surged proportionally with the uptrend. Funding at 0.0051% indicates the LONG side is paying the SHORT side, meaning the market is leaning toward LONG.
⚠️ SETUP & RISK — $VELODROME
🚫 Biggest downside: the crowd is leaning in the SAME direction as this signal, and that side is paying a fee — this is the risk that needs monitoring, not a supporting factor. Also, price is currently in the upper part (86%) of the 24h range, so additional upside room may be limited.
If price closes below the stop-loss level shown on the signal card, the current LONG scenario is no longer valid.
In your view, is this real money flowing in, or just a price pull within a thick liquidity zone?
This is educational technical analysis content, not investment advice. Crypto trading involves high risk, and you may lose all of your capital. Please do your own research and take responsibility for your decisions.
#Binance #Crypto #Futures
1
·
--
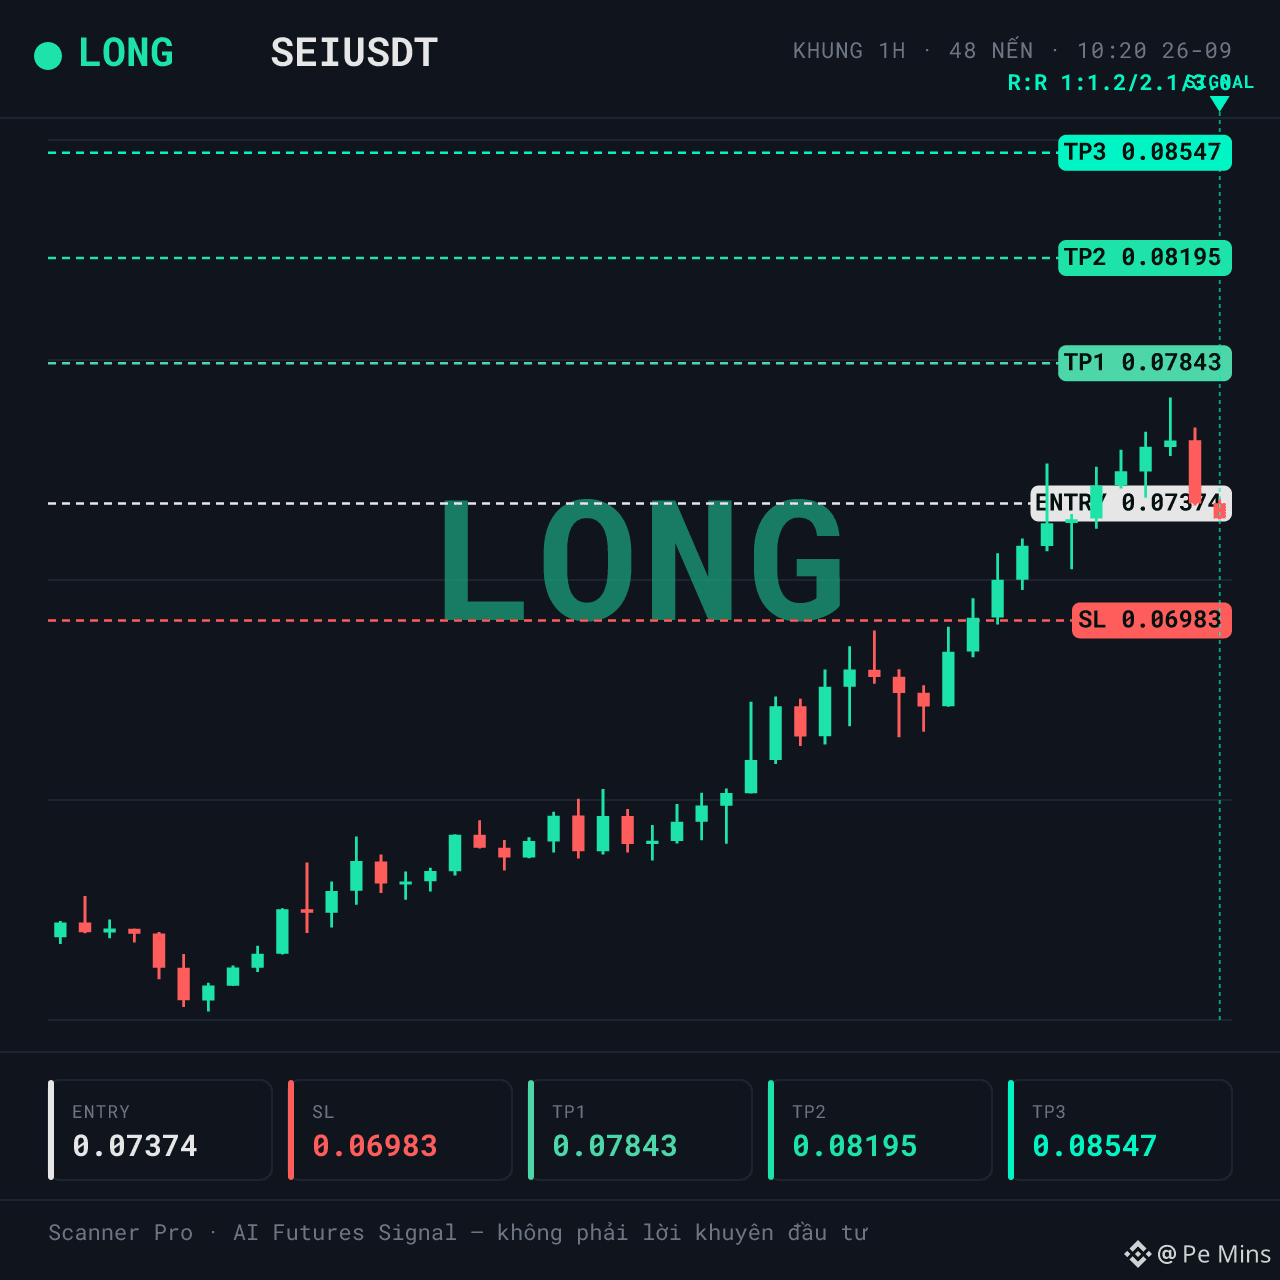
LONG $SEI | Volume spike 0,27x — the inflow has not confirmed the upward momentum
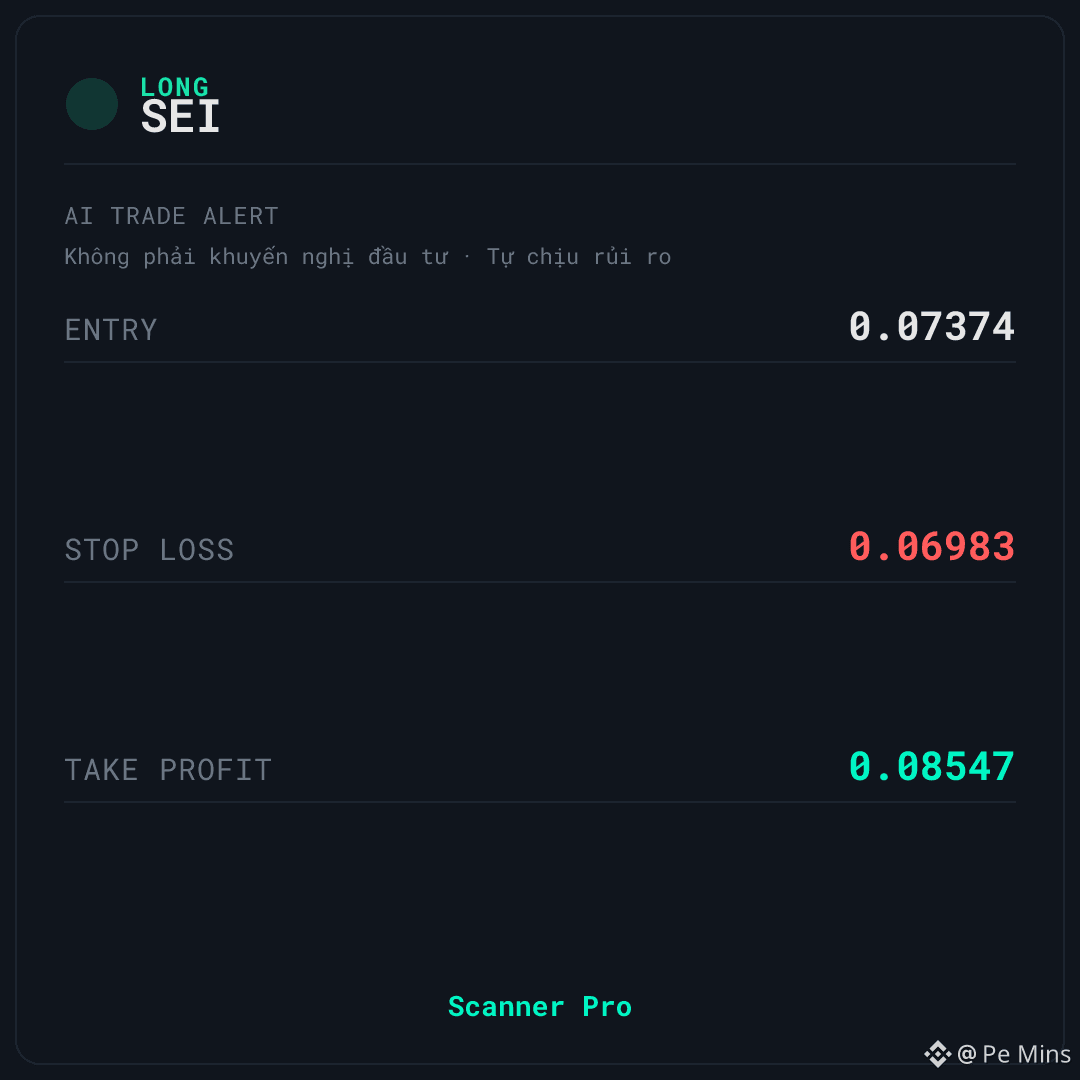
🚨 AI TRADE ALERT — $SEI
🟢 LONG
📌 Entry: 0.07363 – 0.07385
🛑 Stop Loss: 0.06983
🎯 Take Profit: 0.08547
⏰ Valid for: 6 hours (10:20 – 16:20 VN) - Date: 26/09
$SEI is being tracked by Scanner Pro under the LONG scenario when price holds above the entry zone and the 1h momentum remains tilted upward. The market context is classified as bullish, but the volume spike ratio is only 0,27x, suggesting that the money flow has not truly joined in.
📊 CONTEXT & DATA
Market liquidity is assessed as strong, with 24h quote volume ~114.641.817 USDT — a notable volume level indicating that capital is still maintaining a certain presence. However, the volume spike ratio is only 0,27x, meaning the current volume has not produced a breakout-confirming burst.
Funding at 0,0100%: the LONG side is paying the SHORT side, meaning the crowd is leaning in the same direction as this signal. Price position within the 24h range is at 74% — not in the low end, and not at the peak.
🚫 INVALID LEVEL & RISK MANAGEMENT — $SEI
⚠️ The biggest downside: positive funding indicates the LONG side is crowded and has to pay — this is a risk to monitor, not a supportive signal. In addition, the 1h RSI at 67,03 has turned hot and is no longer a supportive factor for the buy scenario.
If price closes below the stop-loss level on the signal card, the current LONG scenario is no longer valid.
💡 What do you think— with a volume spike ratio of only 0,27x, is this accumulation before a breakout, or is the capital gradually pulling out from this area?
This is educational technical analysis content, not investment advice. Crypto trading carries high risk; you may lose all your capital. Do your own research and take responsibility for your decisions.
#Binance #Crypto #Futures
LONG $SEI | Volume spike 0,27x — the inflow has not confirmed the upward momentum
🚨 AI TRADE ALERT — $SEI
🟢 LONG
📌 Entry: 0.07363 – 0.07385
🛑 Stop Loss: 0.06983
🎯 Take Profit: 0.08547
⏰ Valid for: 6 hours (10:20 – 16:20 VN) - Date: 26/09
$SEI is being tracked by Scanner Pro under the LONG scenario when price holds above the entry zone and the 1h momentum remains tilted upward. The market context is classified as bullish, but the volume spike ratio is only 0,27x, suggesting that the money flow has not truly joined in.
📊 CONTEXT & DATA
Market liquidity is assessed as strong, with 24h quote volume ~114.641.817 USDT — a notable volume level indicating that capital is still maintaining a certain presence. However, the volume spike ratio is only 0,27x, meaning the current volume has not produced a breakout-confirming burst.
Funding at 0,0100%: the LONG side is paying the SHORT side, meaning the crowd is leaning in the same direction as this signal. Price position within the 24h range is at 74% — not in the low end, and not at the peak.
🚫 INVALID LEVEL & RISK MANAGEMENT — $SEI
⚠️ The biggest downside: positive funding indicates the LONG side is crowded and has to pay — this is a risk to monitor, not a supportive signal. In addition, the 1h RSI at 67,03 has turned hot and is no longer a supportive factor for the buy scenario.
If price closes below the stop-loss level on the signal card, the current LONG scenario is no longer valid.
💡 What do you think— with a volume spike ratio of only 0,27x, is this accumulation before a breakout, or is the capital gradually pulling out from this area?
This is educational technical analysis content, not investment advice. Crypto trading carries high risk; you may lose all your capital. Do your own research and take responsibility for your decisions.
#Binance #Crypto #Futures
🚨 AI TRADE ALERT — $SEI
🟢 LONG
📌 Entry: 0.07363 – 0.07385
🛑 Stop Loss: 0.06983
🎯 Take Profit: 0.08547
⏰ Valid for: 6 hours (10:20 – 16:20 VN) - Date: 26/09
$SEI is being tracked by Scanner Pro under the LONG scenario when price holds above the entry zone and the 1h momentum remains tilted upward. The market context is classified as bullish, but the volume spike ratio is only 0,27x, suggesting that the money flow has not truly joined in.
📊 CONTEXT & DATA
Market liquidity is assessed as strong, with 24h quote volume ~114.641.817 USDT — a notable volume level indicating that capital is still maintaining a certain presence. However, the volume spike ratio is only 0,27x, meaning the current volume has not produced a breakout-confirming burst.
Funding at 0,0100%: the LONG side is paying the SHORT side, meaning the crowd is leaning in the same direction as this signal. Price position within the 24h range is at 74% — not in the low end, and not at the peak.
🚫 INVALID LEVEL & RISK MANAGEMENT — $SEI
⚠️ The biggest downside: positive funding indicates the LONG side is crowded and has to pay — this is a risk to monitor, not a supportive signal. In addition, the 1h RSI at 67,03 has turned hot and is no longer a supportive factor for the buy scenario.
If price closes below the stop-loss level on the signal card, the current LONG scenario is no longer valid.
💡 What do you think— with a volume spike ratio of only 0,27x, is this accumulation before a breakout, or is the capital gradually pulling out from this area?
This is educational technical analysis content, not investment advice. Crypto trading carries high risk; you may lose all your capital. Do your own research and take responsibility for your decisions.
#Binance #Crypto #Futures
30
·
--
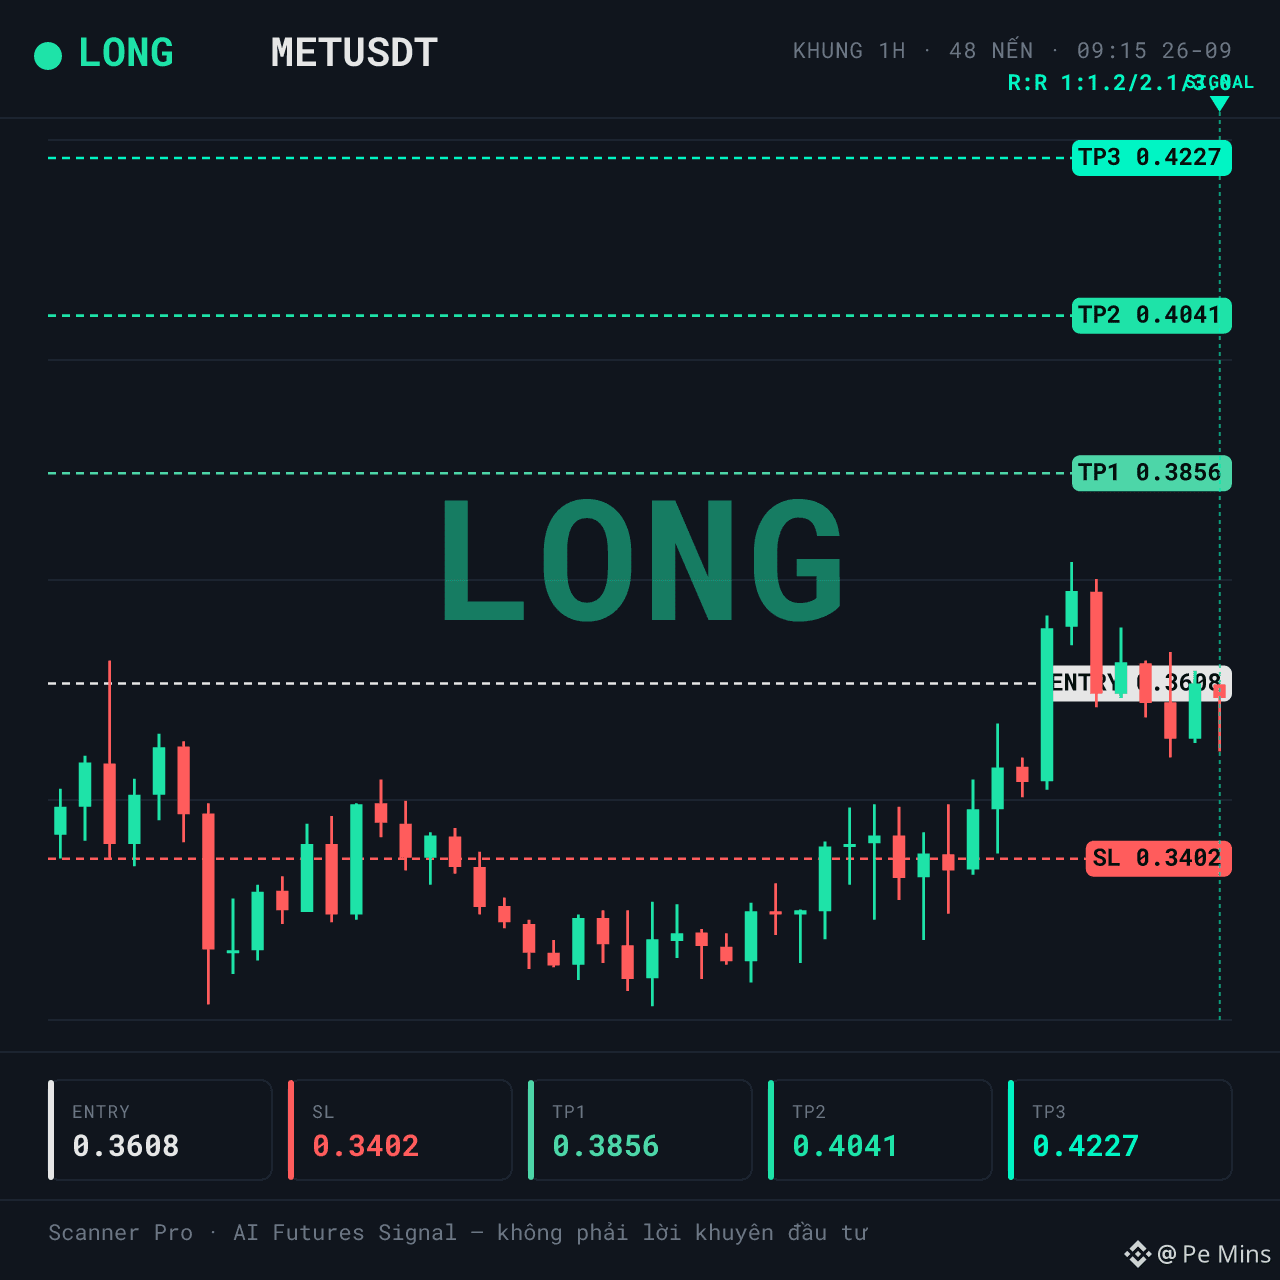
LONG $MET | Price at 69% of the 24h range — the crowd leaning to the same side is paying the bill
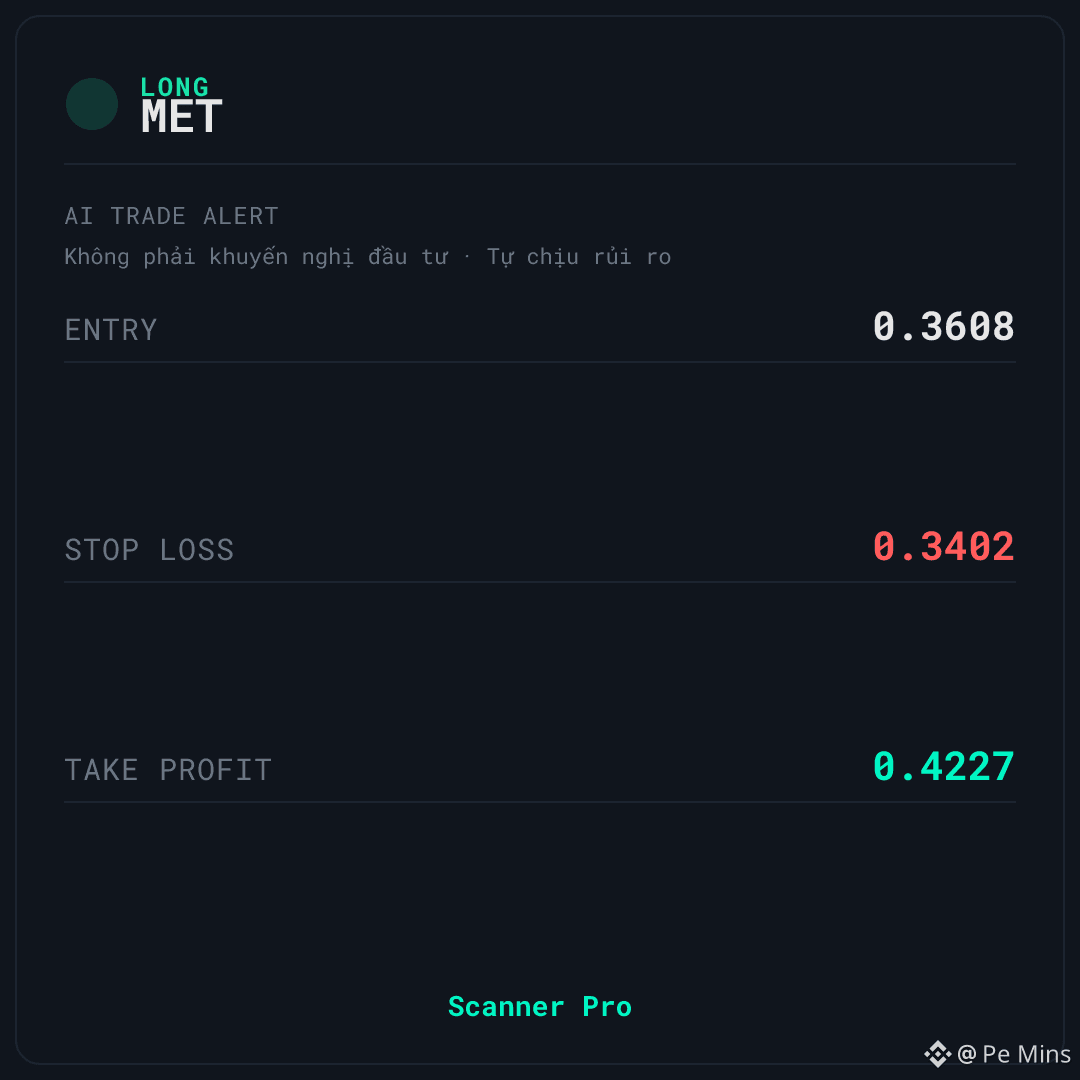
🚨 AI TRADE ALERT — $MET
🟢 LONG
📌 Entry: 0.3603 – 0.3613
🛑 Stop Loss: 0.3402
🎯 Take Profit: 0.4227
⏰ Valid for: 6 hours (09:15 – 15:15 VN) - Date: 26/09
$MET is being tracked by Scanner Pro for a LONG scenario when the price holds a high position within the session’s range. 24h liquidity is around 21.7 million, slightly positive funding — the flow of capital is leaning to one side.
📊 WHY IT’S WORTH NOTING
Price is at 69% of the 24h range — the upper part of the trading band, indicating that the buyers are still holding their advantage after the 7.65% up-move. 24h quoted volume is ~21,751,346 USDT, volume spike ratio 0.38x — money flow hasn’t truly exploded, but it’s staying steady.
Funding 0.0001%: the LONG side is paying the SHORT side, meaning the market is leaning long. This is a downside to watch because the crowd is standing on the same side as this setup.
⚠️ SETUP & RISK — $MET
🚫 Biggest risk: the LONG side is crowded and paying funding, while price is already at the high end of the 24h range — upside room may get squeezed if buying pressure doesn’t hold.
If price closes below the stop-loss level on the signal card, the current LONG scenario is no longer valid.
💡 Do you think this 69% range is a support base for the price to break higher, or a distribution point that forces the buying side to pay the price?
This is educational technical analysis content, not investment advice. Crypto trading carries high risk; you may lose all your capital. Do your own research and take responsibility for your decisions.
#Binance #Crypto #Futures
LONG $MET | Price at 69% of the 24h range — the crowd leaning to the same side is paying the bill
🚨 AI TRADE ALERT — $MET
🟢 LONG
📌 Entry: 0.3603 – 0.3613
🛑 Stop Loss: 0.3402
🎯 Take Profit: 0.4227
⏰ Valid for: 6 hours (09:15 – 15:15 VN) - Date: 26/09
$MET is being tracked by Scanner Pro for a LONG scenario when the price holds a high position within the session’s range. 24h liquidity is around 21.7 million, slightly positive funding — the flow of capital is leaning to one side.
📊 WHY IT’S WORTH NOTING
Price is at 69% of the 24h range — the upper part of the trading band, indicating that the buyers are still holding their advantage after the 7.65% up-move. 24h quoted volume is ~21,751,346 USDT, volume spike ratio 0.38x — money flow hasn’t truly exploded, but it’s staying steady.
Funding 0.0001%: the LONG side is paying the SHORT side, meaning the market is leaning long. This is a downside to watch because the crowd is standing on the same side as this setup.
⚠️ SETUP & RISK — $MET
🚫 Biggest risk: the LONG side is crowded and paying funding, while price is already at the high end of the 24h range — upside room may get squeezed if buying pressure doesn’t hold.
If price closes below the stop-loss level on the signal card, the current LONG scenario is no longer valid.
💡 Do you think this 69% range is a support base for the price to break higher, or a distribution point that forces the buying side to pay the price?
This is educational technical analysis content, not investment advice. Crypto trading carries high risk; you may lose all your capital. Do your own research and take responsibility for your decisions.
#Binance #Crypto #Futures
🚨 AI TRADE ALERT — $MET
🟢 LONG
📌 Entry: 0.3603 – 0.3613
🛑 Stop Loss: 0.3402
🎯 Take Profit: 0.4227
⏰ Valid for: 6 hours (09:15 – 15:15 VN) - Date: 26/09
$MET is being tracked by Scanner Pro for a LONG scenario when the price holds a high position within the session’s range. 24h liquidity is around 21.7 million, slightly positive funding — the flow of capital is leaning to one side.
📊 WHY IT’S WORTH NOTING
Price is at 69% of the 24h range — the upper part of the trading band, indicating that the buyers are still holding their advantage after the 7.65% up-move. 24h quoted volume is ~21,751,346 USDT, volume spike ratio 0.38x — money flow hasn’t truly exploded, but it’s staying steady.
Funding 0.0001%: the LONG side is paying the SHORT side, meaning the market is leaning long. This is a downside to watch because the crowd is standing on the same side as this setup.
⚠️ SETUP & RISK — $MET
🚫 Biggest risk: the LONG side is crowded and paying funding, while price is already at the high end of the 24h range — upside room may get squeezed if buying pressure doesn’t hold.
If price closes below the stop-loss level on the signal card, the current LONG scenario is no longer valid.
💡 Do you think this 69% range is a support base for the price to break higher, or a distribution point that forces the buying side to pay the price?
This is educational technical analysis content, not investment advice. Crypto trading carries high risk; you may lose all your capital. Do your own research and take responsibility for your decisions.
#Binance #Crypto #Futures
39
·
--
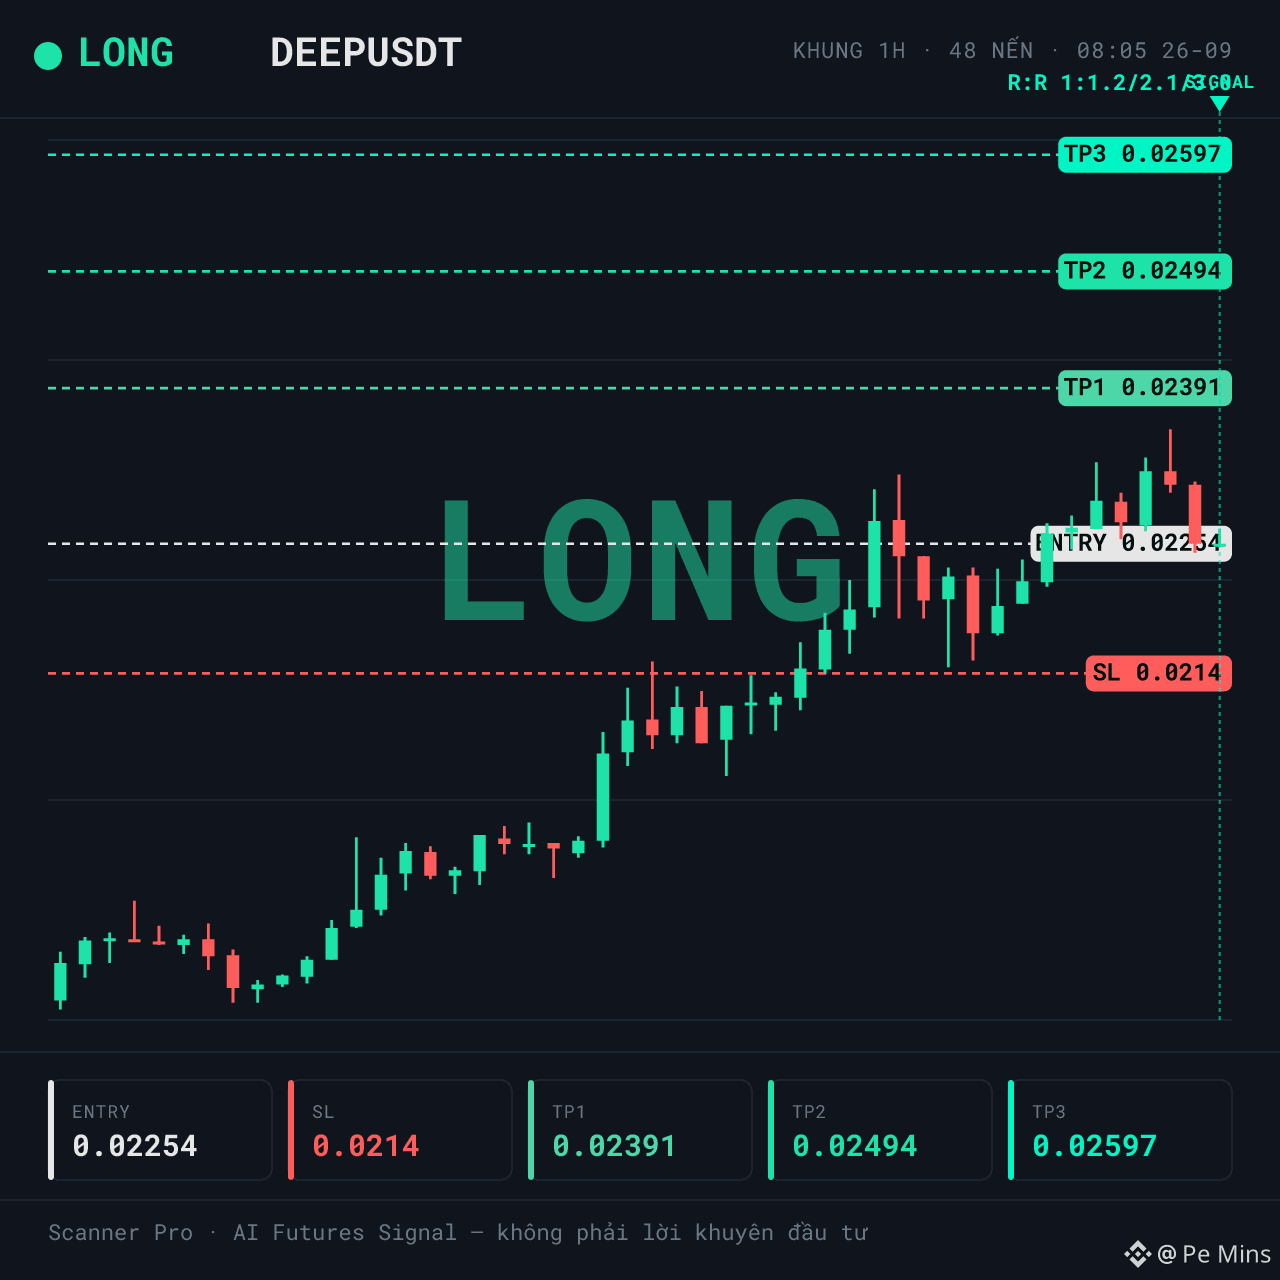
LONG $DEEP | Liquidity is thick, but the cash flow is leaning to one side
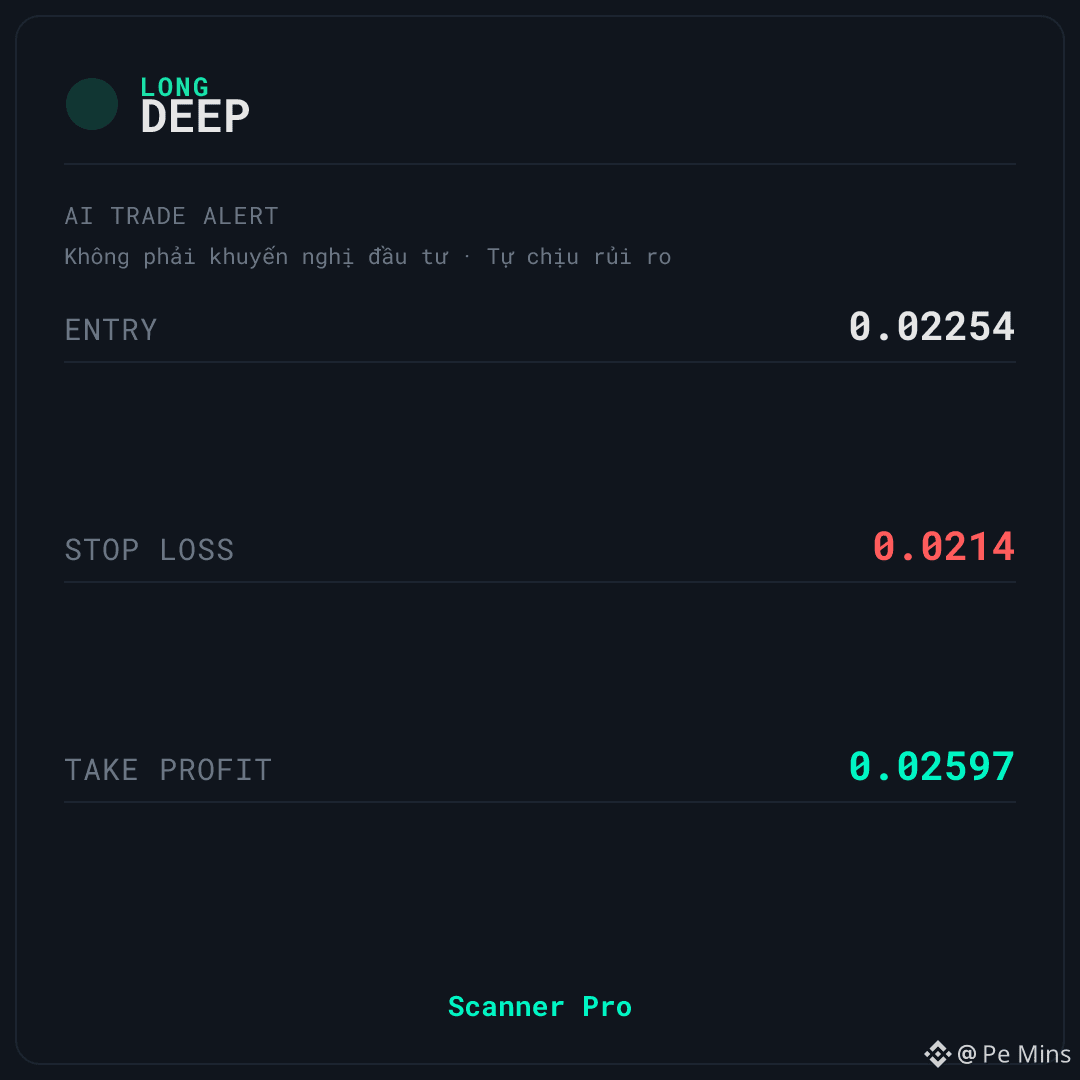
🚨 AI TRADE ALERT — $DEEP
🟢 LONG
📌 Entry: 0.02251 – 0.02257
🛑 Stop Loss: 0.0214
🎯 Take Profit: 0.02597
⏰ Validity: 6 hours (08:05 – 14:05 VN) - Date: 26/09
$DEEP is being tracked by Scanner Pro for a LONG setup when the price reacts positively in the context of an uptrend. The 24h volume is about 12.49 million, but the volume spike ratio is only 0.03x — the money flow has not really erupted.
📊 WHY IT’S WORTH NOTING
Market liquidity is considered strong, which helps reduce the risk of slippage when orders are matched. However, the 24h trading volume is only around ~12,490,369 USDT with a volume spike ratio of 0.03x — there are no signs of a strong, decisive entry of funds.
Current funding is 0.0050%: the LONG side is paying the SHORT side, meaning the crowd is leaning in the same direction as the signal. This is a disadvantage to keep in mind, because when the crowd is crowded, they often have to pay fees and can be vulnerable if the price moves against them.
⚠️ SETUP & RISK — $DEEP
The biggest risk is that the cash flow is leaning toward LONG while volume does not confirm — a volume spike ratio of only 0.03x suggests there isn’t a large wave of funds entering. Additionally, the price is at 67% of the 24h range, higher than the average area; upside room may be limited if buying pressure doesn’t hold.
If the price closes below the stop-loss level on the signal card, the current LONG scenario is no longer valid.
What do you think—does this look like real accumulation, or just a technical retracement before the money flow withdraws?
This is educational technical analysis content, not investment advice. Crypto trading is highly risky, and you may lose all your capital. Please do your own research and take responsibility for your decisions.
#Binance #Crypto #Futures
LONG $DEEP | Liquidity is thick, but the cash flow is leaning to one side
🚨 AI TRADE ALERT — $DEEP
🟢 LONG
📌 Entry: 0.02251 – 0.02257
🛑 Stop Loss: 0.0214
🎯 Take Profit: 0.02597
⏰ Validity: 6 hours (08:05 – 14:05 VN) - Date: 26/09
$DEEP is being tracked by Scanner Pro for a LONG setup when the price reacts positively in the context of an uptrend. The 24h volume is about 12.49 million, but the volume spike ratio is only 0.03x — the money flow has not really erupted.
📊 WHY IT’S WORTH NOTING
Market liquidity is considered strong, which helps reduce the risk of slippage when orders are matched. However, the 24h trading volume is only around ~12,490,369 USDT with a volume spike ratio of 0.03x — there are no signs of a strong, decisive entry of funds.
Current funding is 0.0050%: the LONG side is paying the SHORT side, meaning the crowd is leaning in the same direction as the signal. This is a disadvantage to keep in mind, because when the crowd is crowded, they often have to pay fees and can be vulnerable if the price moves against them.
⚠️ SETUP & RISK — $DEEP
The biggest risk is that the cash flow is leaning toward LONG while volume does not confirm — a volume spike ratio of only 0.03x suggests there isn’t a large wave of funds entering. Additionally, the price is at 67% of the 24h range, higher than the average area; upside room may be limited if buying pressure doesn’t hold.
If the price closes below the stop-loss level on the signal card, the current LONG scenario is no longer valid.
What do you think—does this look like real accumulation, or just a technical retracement before the money flow withdraws?
This is educational technical analysis content, not investment advice. Crypto trading is highly risky, and you may lose all your capital. Please do your own research and take responsibility for your decisions.
#Binance #Crypto #Futures
🚨 AI TRADE ALERT — $DEEP
🟢 LONG
📌 Entry: 0.02251 – 0.02257
🛑 Stop Loss: 0.0214
🎯 Take Profit: 0.02597
⏰ Validity: 6 hours (08:05 – 14:05 VN) - Date: 26/09
$DEEP is being tracked by Scanner Pro for a LONG setup when the price reacts positively in the context of an uptrend. The 24h volume is about 12.49 million, but the volume spike ratio is only 0.03x — the money flow has not really erupted.
📊 WHY IT’S WORTH NOTING
Market liquidity is considered strong, which helps reduce the risk of slippage when orders are matched. However, the 24h trading volume is only around ~12,490,369 USDT with a volume spike ratio of 0.03x — there are no signs of a strong, decisive entry of funds.
Current funding is 0.0050%: the LONG side is paying the SHORT side, meaning the crowd is leaning in the same direction as the signal. This is a disadvantage to keep in mind, because when the crowd is crowded, they often have to pay fees and can be vulnerable if the price moves against them.
⚠️ SETUP & RISK — $DEEP
The biggest risk is that the cash flow is leaning toward LONG while volume does not confirm — a volume spike ratio of only 0.03x suggests there isn’t a large wave of funds entering. Additionally, the price is at 67% of the 24h range, higher than the average area; upside room may be limited if buying pressure doesn’t hold.
If the price closes below the stop-loss level on the signal card, the current LONG scenario is no longer valid.
What do you think—does this look like real accumulation, or just a technical retracement before the money flow withdraws?
This is educational technical analysis content, not investment advice. Crypto trading is highly risky, and you may lose all your capital. Please do your own research and take responsibility for your decisions.
#Binance #Crypto #Futures
50
·
--
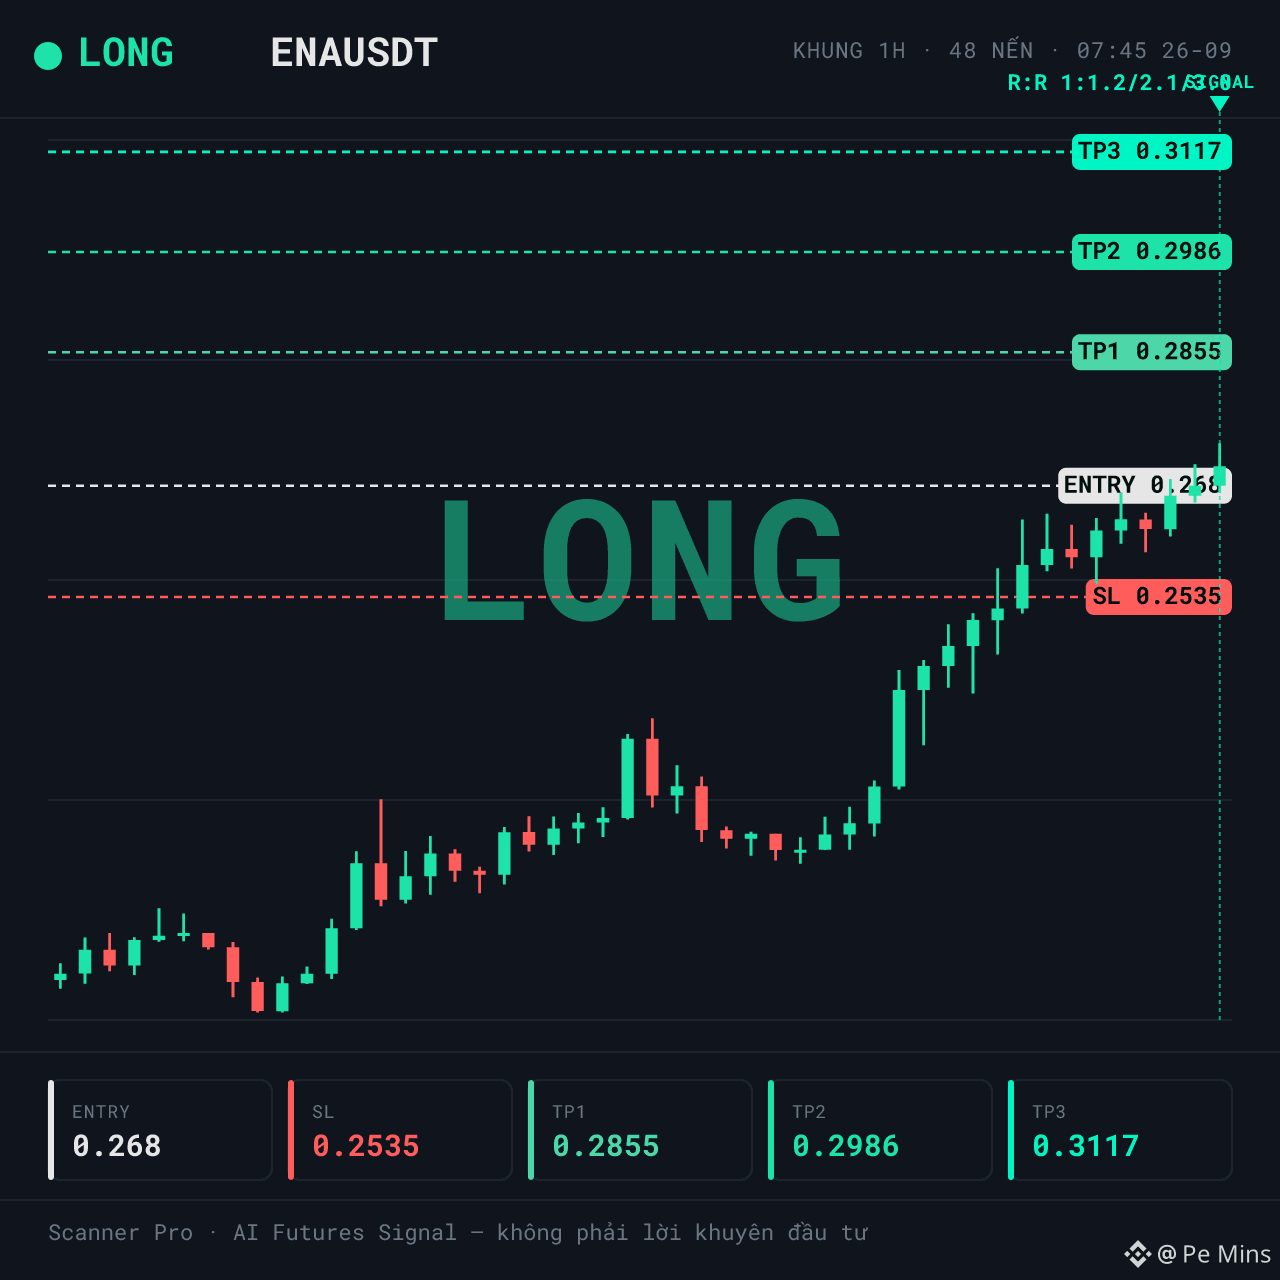
LONG $ENA | Area of invalidation far away, but the long side has to pay fees
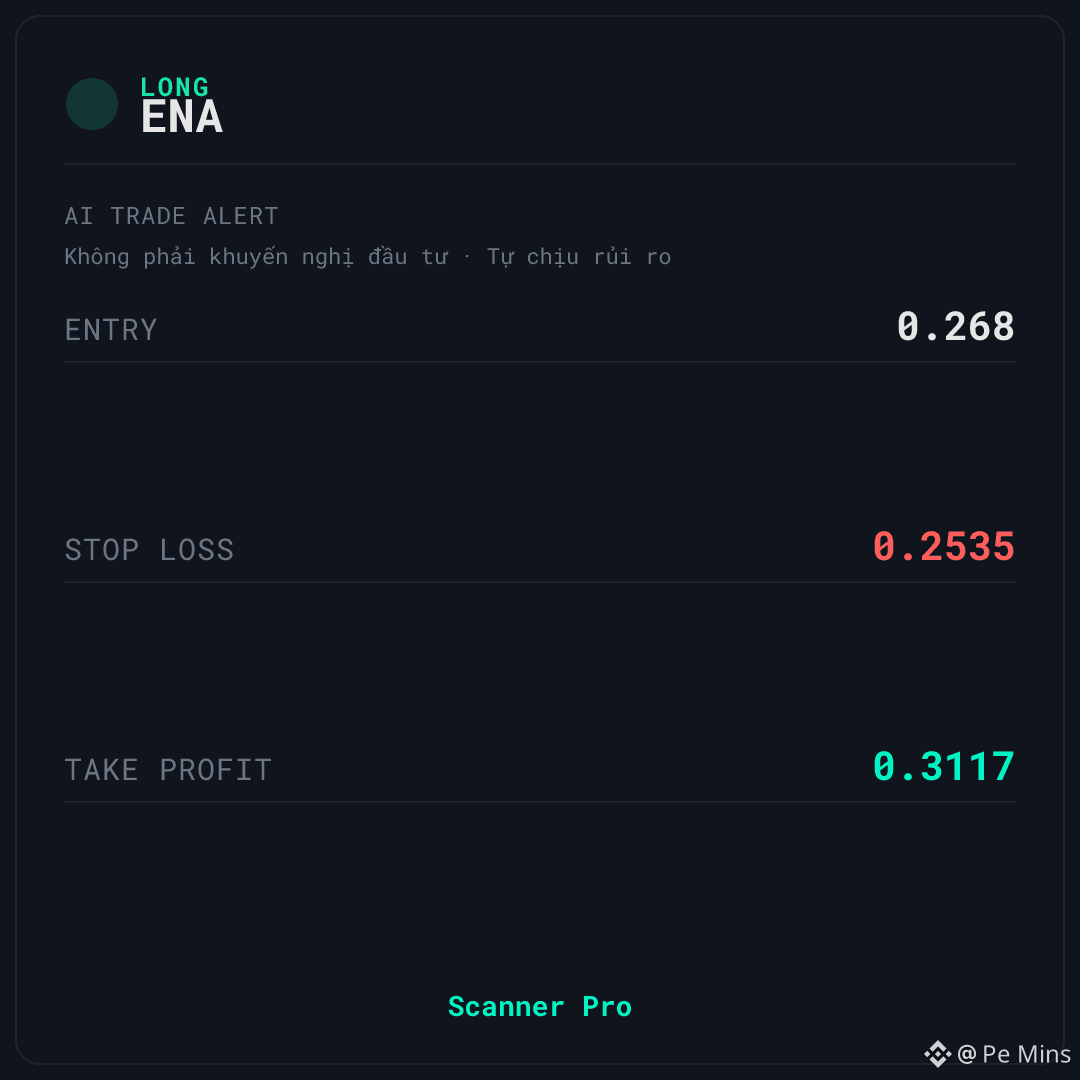
🚨 AI TRADE ALERT — $ENA
🟢 LONG
📌 Entry: 0.2676 – 0.2684
🛑 Stop Loss: 0.2535
🎯 Take Profit: 0.3117
⏰ Validity: 6 hours (07:45 – 13:45 VN) - Date: 26/09
$ENA đang được Scanner Pro theo dõi theo kịch bản LONG khi giá giữ trên vùng entry và động lượng 1h ở mức cao. Bối cảnh được xếp loại tăng, thanh khoản cao, funding 0,0050%.
📊 WHAT IS HAPPENING
24h volume around 623.4 million USDT with a volume spike ratio of 0.91x — the capital flow hasn’t really exploded, but it’s still high. Price is at 95% of the 24h range, meaning it’s close to the session high, while the fluctuation range is up to 20.3%. The distance from the current price down to the invalidation zone is fairly wide, giving a profit/risk ratio of 3:1 according to the signal card.
⚠️ RISKS TO KNOW FIRST — $ENA
🚫 The biggest downside: positive funding of 0.0050% means the LONG side is paying the SHORT side — the crowd is aligned with this signal and is having to bear the cost, which is a risk to monitor. In addition, the 1h momentum has moved into the overbought zone, so it’s no longer a supportive factor for the buy scenario, and the price is in the upper area of the 24h range. If price closes below the stop-loss level on the signal card, the current LONG setup is no longer valid. Do you think the buyers can hold this zone, or will they need a deeper retest to absorb selling pressure?
This is educational technical analysis content, not investment advice. Cryptocurrency trading carries high risk; you may lose all of your capital. Do your own research and take responsibility for your decisions.
#Binance #Crypto #Futures
LONG $ENA | Area of invalidation far away, but the long side has to pay fees
🚨 AI TRADE ALERT — $ENA
🟢 LONG
📌 Entry: 0.2676 – 0.2684
🛑 Stop Loss: 0.2535
🎯 Take Profit: 0.3117
⏰ Validity: 6 hours (07:45 – 13:45 VN) - Date: 26/09
$ENA đang được Scanner Pro theo dõi theo kịch bản LONG khi giá giữ trên vùng entry và động lượng 1h ở mức cao. Bối cảnh được xếp loại tăng, thanh khoản cao, funding 0,0050%.
📊 WHAT IS HAPPENING
24h volume around 623.4 million USDT with a volume spike ratio of 0.91x — the capital flow hasn’t really exploded, but it’s still high. Price is at 95% of the 24h range, meaning it’s close to the session high, while the fluctuation range is up to 20.3%. The distance from the current price down to the invalidation zone is fairly wide, giving a profit/risk ratio of 3:1 according to the signal card.
⚠️ RISKS TO KNOW FIRST — $ENA
🚫 The biggest downside: positive funding of 0.0050% means the LONG side is paying the SHORT side — the crowd is aligned with this signal and is having to bear the cost, which is a risk to monitor. In addition, the 1h momentum has moved into the overbought zone, so it’s no longer a supportive factor for the buy scenario, and the price is in the upper area of the 24h range. If price closes below the stop-loss level on the signal card, the current LONG setup is no longer valid. Do you think the buyers can hold this zone, or will they need a deeper retest to absorb selling pressure?
This is educational technical analysis content, not investment advice. Cryptocurrency trading carries high risk; you may lose all of your capital. Do your own research and take responsibility for your decisions.
#Binance #Crypto #Futures
🚨 AI TRADE ALERT — $ENA
🟢 LONG
📌 Entry: 0.2676 – 0.2684
🛑 Stop Loss: 0.2535
🎯 Take Profit: 0.3117
⏰ Validity: 6 hours (07:45 – 13:45 VN) - Date: 26/09
$ENA đang được Scanner Pro theo dõi theo kịch bản LONG khi giá giữ trên vùng entry và động lượng 1h ở mức cao. Bối cảnh được xếp loại tăng, thanh khoản cao, funding 0,0050%.
📊 WHAT IS HAPPENING
24h volume around 623.4 million USDT with a volume spike ratio of 0.91x — the capital flow hasn’t really exploded, but it’s still high. Price is at 95% of the 24h range, meaning it’s close to the session high, while the fluctuation range is up to 20.3%. The distance from the current price down to the invalidation zone is fairly wide, giving a profit/risk ratio of 3:1 according to the signal card.
⚠️ RISKS TO KNOW FIRST — $ENA
🚫 The biggest downside: positive funding of 0.0050% means the LONG side is paying the SHORT side — the crowd is aligned with this signal and is having to bear the cost, which is a risk to monitor. In addition, the 1h momentum has moved into the overbought zone, so it’s no longer a supportive factor for the buy scenario, and the price is in the upper area of the 24h range. If price closes below the stop-loss level on the signal card, the current LONG setup is no longer valid. Do you think the buyers can hold this zone, or will they need a deeper retest to absorb selling pressure?
This is educational technical analysis content, not investment advice. Cryptocurrency trading carries high risk; you may lose all of your capital. Do your own research and take responsibility for your decisions.
#Binance #Crypto #Futures
93
·
--
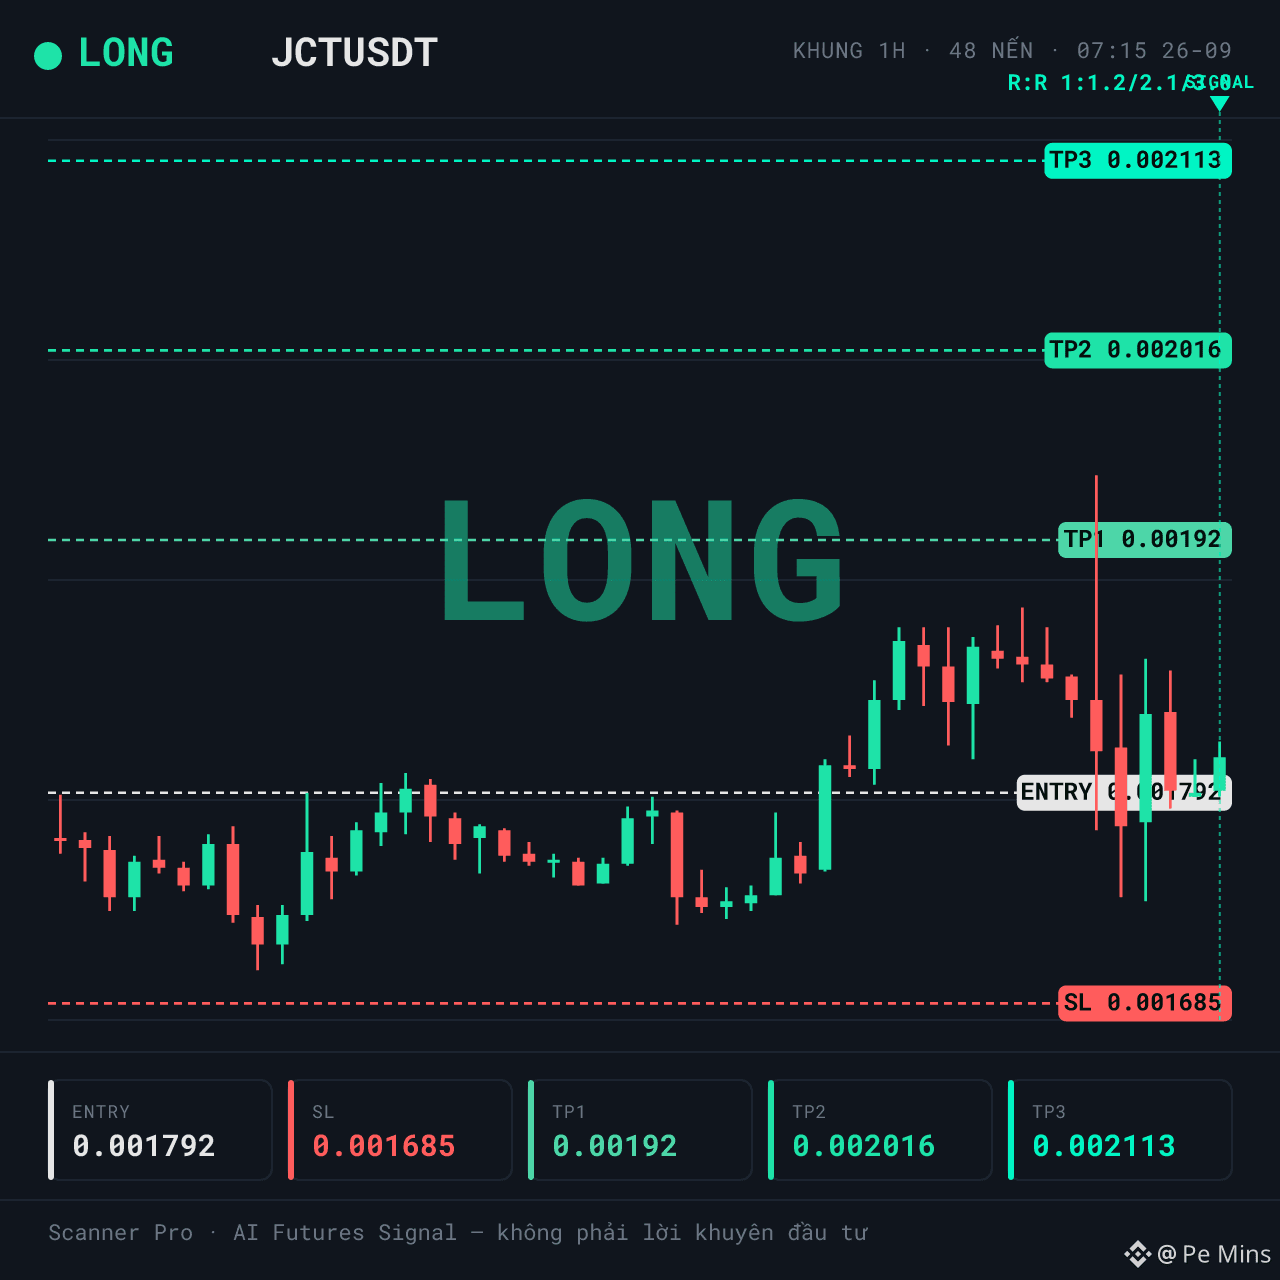
LONG $JCT | Volume spike ratio 0.19x — cash flow has not been confirmed
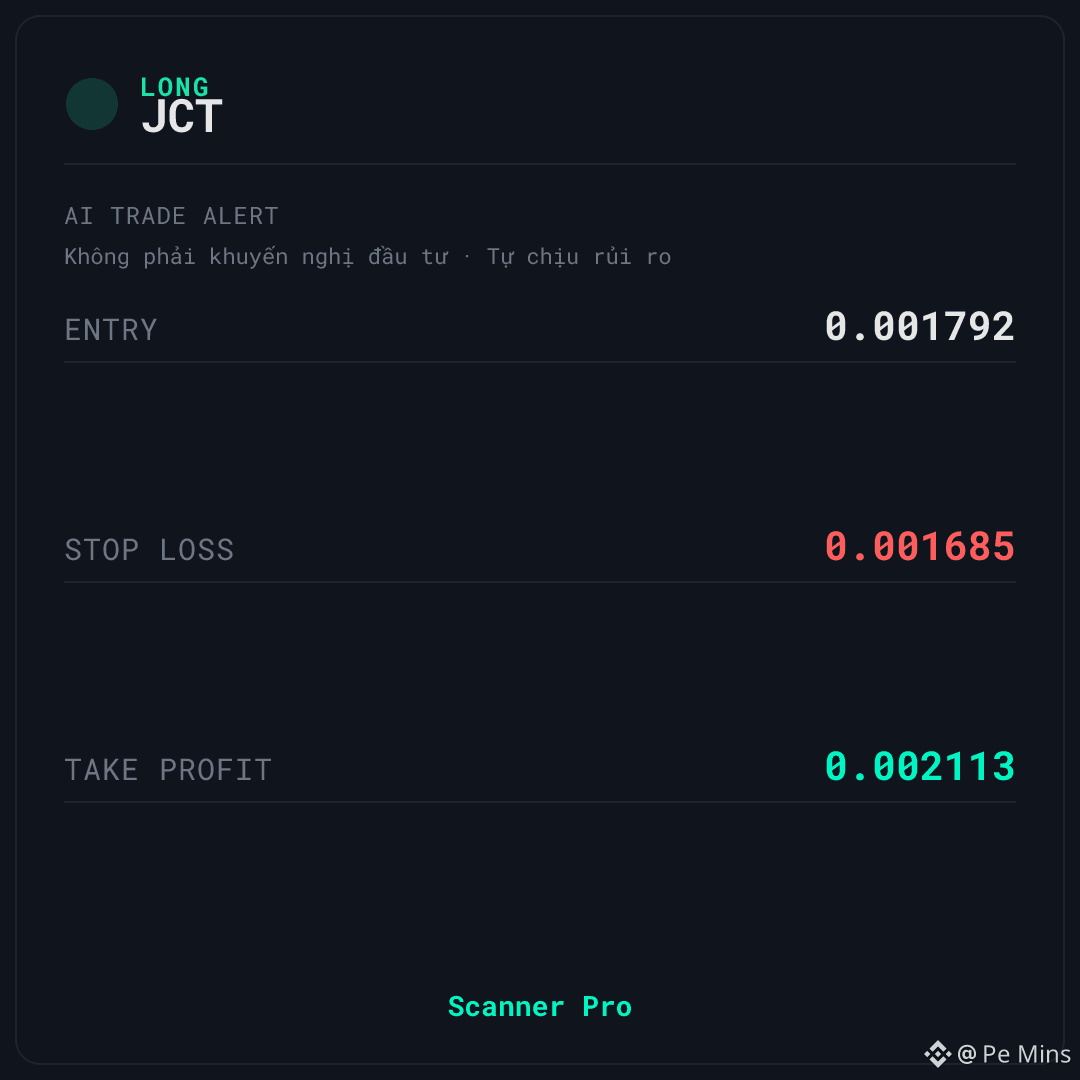
🚨 AI TRADE ALERT — $JCT
🟢 LONG
📌 Entry: 0.001789 – 0.001795
🛑 Stop Loss: 0.001685
🎯 Take Profit: 0.002113
⏰ Validity: 6 hours (07:15 – 13:15 VN) - Date: 26/09
$JCT is being tracked by Scanner Pro for the LONG scenario when the price reacts and holds above the entry zone. The volume spike ratio is only 0.19x, which is far lower than the usual breakout rhythm.
📊 CONTEXT & DATA
24h liquidity is around the average level with quote volume ~3.135.460 USDT, but the volume spike ratio is only 0.19x — inflow has not really surged yet. The price is currently at 38% of the 24h range, meaning it is not in the high-stress zone of the 12.6% band.
Funding at 0.1471% suggests the LONG side is paying fees to the SHORT side, leaning the market toward LONG. The setup is classified as neutral, which fits with observing price action rather than chasing movement.
🚫 INVALIDATION & RISK MANAGEMENT — $JCT
⚠️ The biggest downside: the crowd is leaning in THE SAME direction as the LONG signal, and that very side is the one paying funding — this is a risk to monitor, not a supportive factor.
🚫 If price closes below the stop-loss level on the signal card, the current LONG scenario is no longer valid.
💡 In your view, does a volume spike ratio of 0.19x reflect that capital is waiting, or that buying pressure has run out?
This is educational technical analysis content, not investment advice. Cryptocurrency trading carries high risk, and you may lose all your capital. Do your own research and take responsibility for your decisions.
#Binance #Crypto #Futures
LONG $JCT | Volume spike ratio 0.19x — cash flow has not been confirmed
🚨 AI TRADE ALERT — $JCT
🟢 LONG
📌 Entry: 0.001789 – 0.001795
🛑 Stop Loss: 0.001685
🎯 Take Profit: 0.002113
⏰ Validity: 6 hours (07:15 – 13:15 VN) - Date: 26/09
$JCT is being tracked by Scanner Pro for the LONG scenario when the price reacts and holds above the entry zone. The volume spike ratio is only 0.19x, which is far lower than the usual breakout rhythm.
📊 CONTEXT & DATA
24h liquidity is around the average level with quote volume ~3.135.460 USDT, but the volume spike ratio is only 0.19x — inflow has not really surged yet. The price is currently at 38% of the 24h range, meaning it is not in the high-stress zone of the 12.6% band.
Funding at 0.1471% suggests the LONG side is paying fees to the SHORT side, leaning the market toward LONG. The setup is classified as neutral, which fits with observing price action rather than chasing movement.
🚫 INVALIDATION & RISK MANAGEMENT — $JCT
⚠️ The biggest downside: the crowd is leaning in THE SAME direction as the LONG signal, and that very side is the one paying funding — this is a risk to monitor, not a supportive factor.
🚫 If price closes below the stop-loss level on the signal card, the current LONG scenario is no longer valid.
💡 In your view, does a volume spike ratio of 0.19x reflect that capital is waiting, or that buying pressure has run out?
This is educational technical analysis content, not investment advice. Cryptocurrency trading carries high risk, and you may lose all your capital. Do your own research and take responsibility for your decisions.
#Binance #Crypto #Futures
🚨 AI TRADE ALERT — $JCT
🟢 LONG
📌 Entry: 0.001789 – 0.001795
🛑 Stop Loss: 0.001685
🎯 Take Profit: 0.002113
⏰ Validity: 6 hours (07:15 – 13:15 VN) - Date: 26/09
$JCT is being tracked by Scanner Pro for the LONG scenario when the price reacts and holds above the entry zone. The volume spike ratio is only 0.19x, which is far lower than the usual breakout rhythm.
📊 CONTEXT & DATA
24h liquidity is around the average level with quote volume ~3.135.460 USDT, but the volume spike ratio is only 0.19x — inflow has not really surged yet. The price is currently at 38% of the 24h range, meaning it is not in the high-stress zone of the 12.6% band.
Funding at 0.1471% suggests the LONG side is paying fees to the SHORT side, leaning the market toward LONG. The setup is classified as neutral, which fits with observing price action rather than chasing movement.
🚫 INVALIDATION & RISK MANAGEMENT — $JCT
⚠️ The biggest downside: the crowd is leaning in THE SAME direction as the LONG signal, and that very side is the one paying funding — this is a risk to monitor, not a supportive factor.
🚫 If price closes below the stop-loss level on the signal card, the current LONG scenario is no longer valid.
💡 In your view, does a volume spike ratio of 0.19x reflect that capital is waiting, or that buying pressure has run out?
This is educational technical analysis content, not investment advice. Cryptocurrency trading carries high risk, and you may lose all your capital. Do your own research and take responsibility for your decisions.
#Binance #Crypto #Futures
79
·
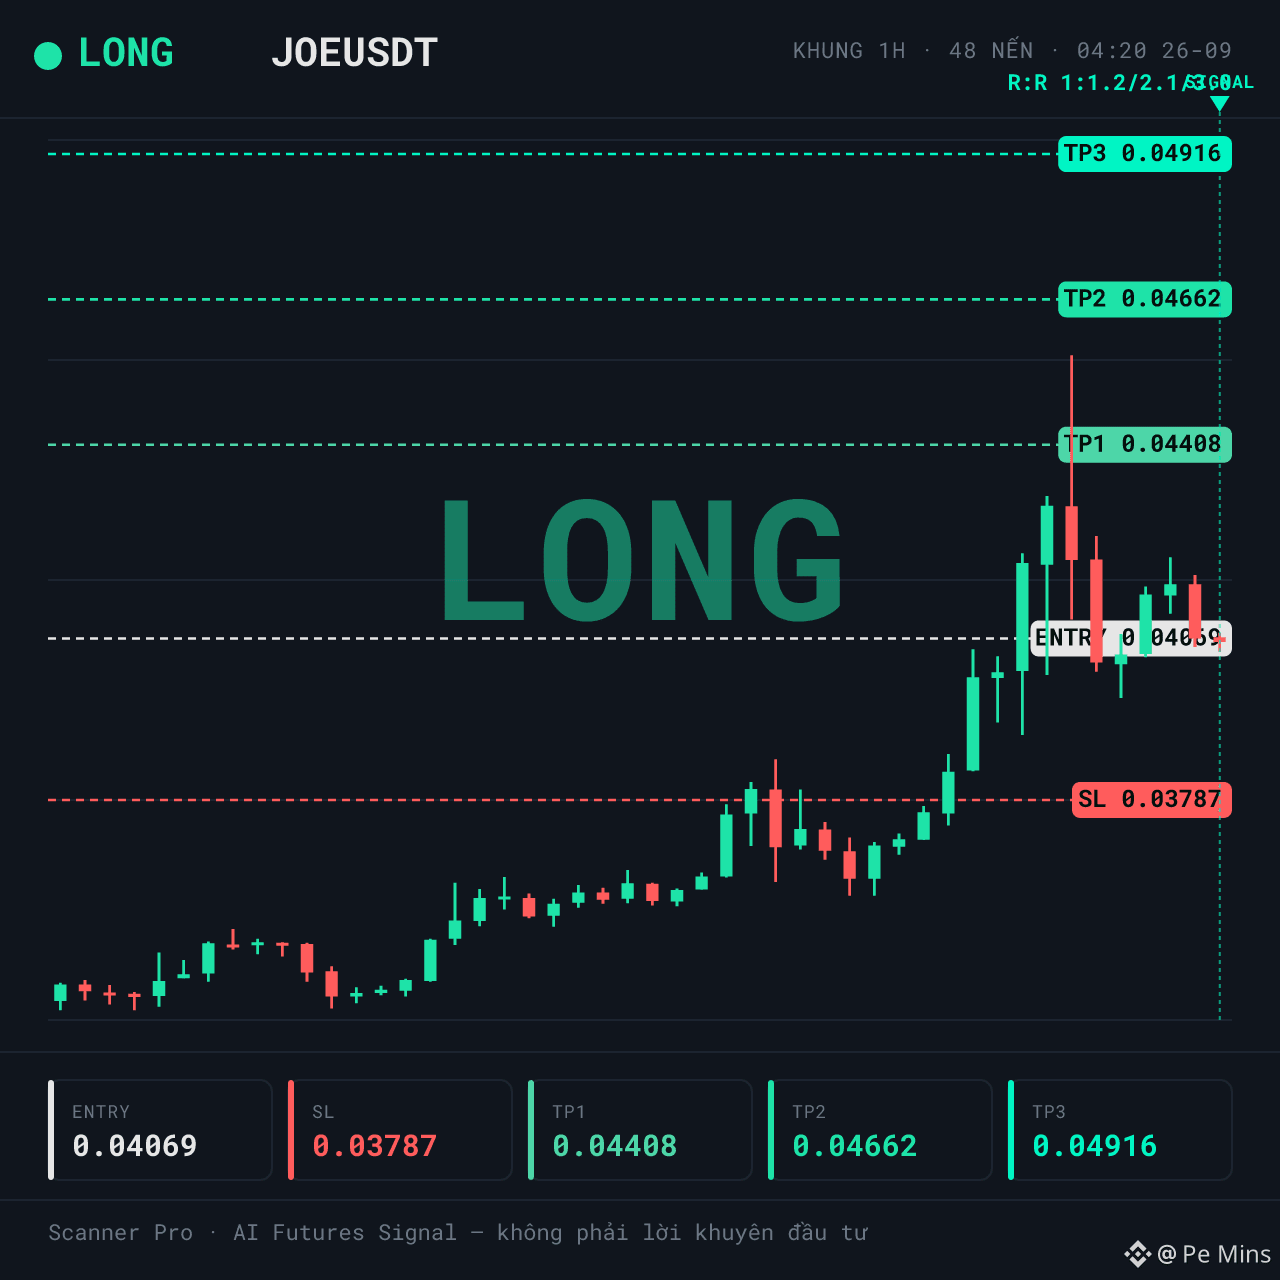
--
LONG $JOE | The market is trending up, but the flow of funds is leaning to one side
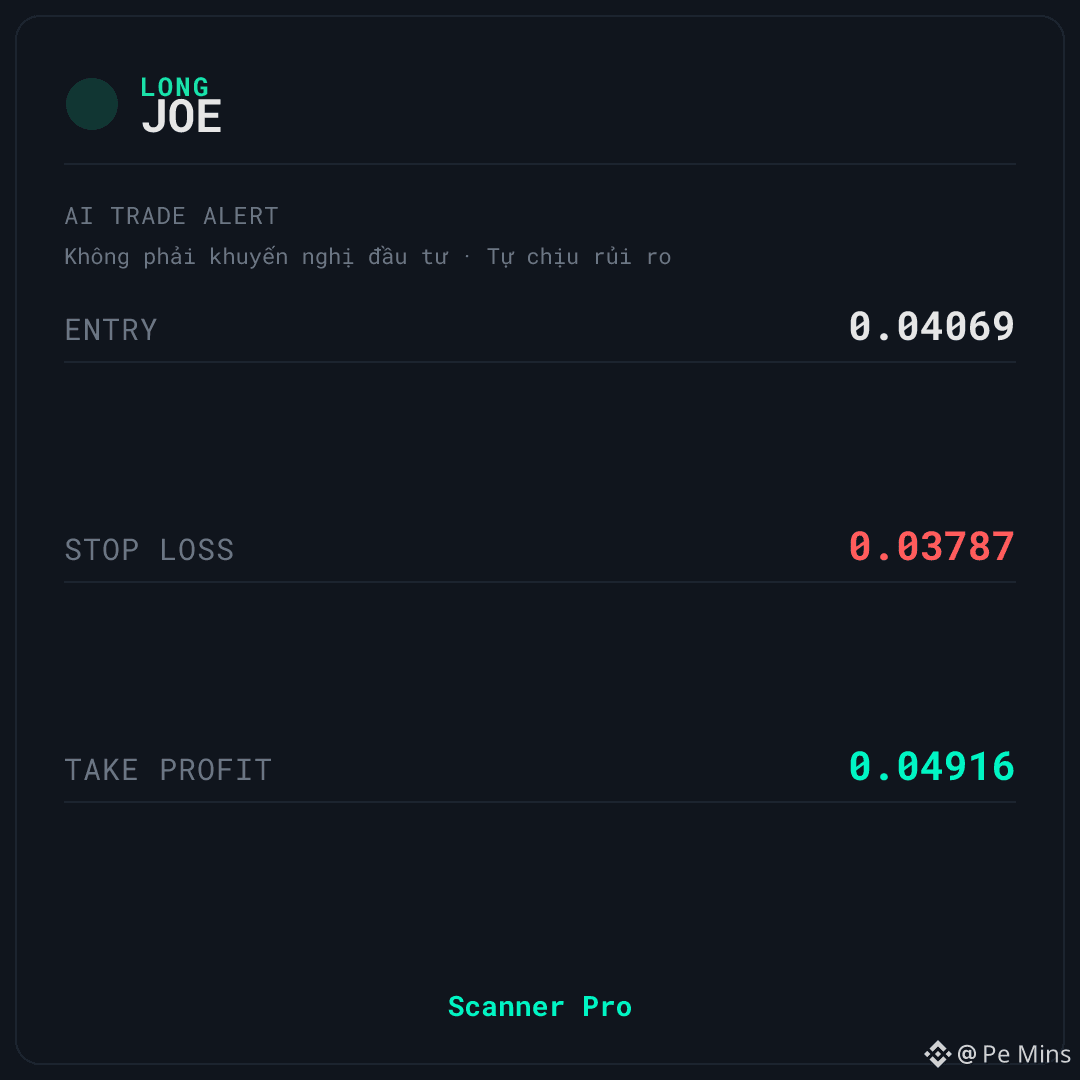
🚨 AI TRADE ALERT — $JOE
🟢 LONG
📌 Entry: 0.04063 – 0.04075
🛑 Stop Loss: 0.03787
🎯 Take Profit: 0.04916
⏰ Valid for: 6 hours (04:20 – 10:20 VN) - Date: 26/09
$JOE is being monitored by Scanner Pro for a LONG setup when the price reacts by holding the entry zone and maintaining structure within the 24-hour range. The overall context is an uptrend, but positive funding indicates that the LONG side is paying a fee to the SHORT side.
📊 WHAT’S HAPPENING
The 24h volume is around ~12,516,947 USDT, but the volume spike ratio is only 0.10x — the capital flow hasn’t really exploded. Price is at 48% of the 24h range, meaning it hasn’t been pushed into the day’s stressed zone. The context is classified as an uptrend, which matches the LONG scenario being tracked. The key point is funding at 0.0084%: the LONG side is paying the SHORT side, meaning the crowd is positioned on the same side as the signal — this is a disadvantage that needs to be watched.
⚠️ RISKS TO KNOW BEFOREHAND — $JOE
🚫 The side paying funding aligns with the order direction, meaning buyers are more crowded and must pay the fee — the risk is if the capital flow can’t maintain momentum. The 1h momentum at 59.15 hasn’t entered an overbought zone yet, but it’s also not too early. If the price closes below the stop-loss level on the signal card, the current LONG setup is no longer valid. Do you think this is genuinely real money entering, or just a price-holding move before a deeper retest?
This is educational technical analysis content, not investment advice. Crypto trading is high-risk, and you may lose all your capital. Do your own research and take responsibility for your decisions.
#Binance #Crypto #Futures
LONG $JOE | The market is trending up, but the flow of funds is leaning to one side
🚨 AI TRADE ALERT — $JOE
🟢 LONG
📌 Entry: 0.04063 – 0.04075
🛑 Stop Loss: 0.03787
🎯 Take Profit: 0.04916
⏰ Valid for: 6 hours (04:20 – 10:20 VN) - Date: 26/09
$JOE is being monitored by Scanner Pro for a LONG setup when the price reacts by holding the entry zone and maintaining structure within the 24-hour range. The overall context is an uptrend, but positive funding indicates that the LONG side is paying a fee to the SHORT side.
📊 WHAT’S HAPPENING
The 24h volume is around ~12,516,947 USDT, but the volume spike ratio is only 0.10x — the capital flow hasn’t really exploded. Price is at 48% of the 24h range, meaning it hasn’t been pushed into the day’s stressed zone. The context is classified as an uptrend, which matches the LONG scenario being tracked. The key point is funding at 0.0084%: the LONG side is paying the SHORT side, meaning the crowd is positioned on the same side as the signal — this is a disadvantage that needs to be watched.
⚠️ RISKS TO KNOW BEFOREHAND — $JOE
🚫 The side paying funding aligns with the order direction, meaning buyers are more crowded and must pay the fee — the risk is if the capital flow can’t maintain momentum. The 1h momentum at 59.15 hasn’t entered an overbought zone yet, but it’s also not too early. If the price closes below the stop-loss level on the signal card, the current LONG setup is no longer valid. Do you think this is genuinely real money entering, or just a price-holding move before a deeper retest?
This is educational technical analysis content, not investment advice. Crypto trading is high-risk, and you may lose all your capital. Do your own research and take responsibility for your decisions.
#Binance #Crypto #Futures
🚨 AI TRADE ALERT — $JOE
🟢 LONG
📌 Entry: 0.04063 – 0.04075
🛑 Stop Loss: 0.03787
🎯 Take Profit: 0.04916
⏰ Valid for: 6 hours (04:20 – 10:20 VN) - Date: 26/09
$JOE is being monitored by Scanner Pro for a LONG setup when the price reacts by holding the entry zone and maintaining structure within the 24-hour range. The overall context is an uptrend, but positive funding indicates that the LONG side is paying a fee to the SHORT side.
📊 WHAT’S HAPPENING
The 24h volume is around ~12,516,947 USDT, but the volume spike ratio is only 0.10x — the capital flow hasn’t really exploded. Price is at 48% of the 24h range, meaning it hasn’t been pushed into the day’s stressed zone. The context is classified as an uptrend, which matches the LONG scenario being tracked. The key point is funding at 0.0084%: the LONG side is paying the SHORT side, meaning the crowd is positioned on the same side as the signal — this is a disadvantage that needs to be watched.
⚠️ RISKS TO KNOW BEFOREHAND — $JOE
🚫 The side paying funding aligns with the order direction, meaning buyers are more crowded and must pay the fee — the risk is if the capital flow can’t maintain momentum. The 1h momentum at 59.15 hasn’t entered an overbought zone yet, but it’s also not too early. If the price closes below the stop-loss level on the signal card, the current LONG setup is no longer valid. Do you think this is genuinely real money entering, or just a price-holding move before a deeper retest?
This is educational technical analysis content, not investment advice. Crypto trading is high-risk, and you may lose all your capital. Do your own research and take responsibility for your decisions.
#Binance #Crypto #Futures
2
·
--
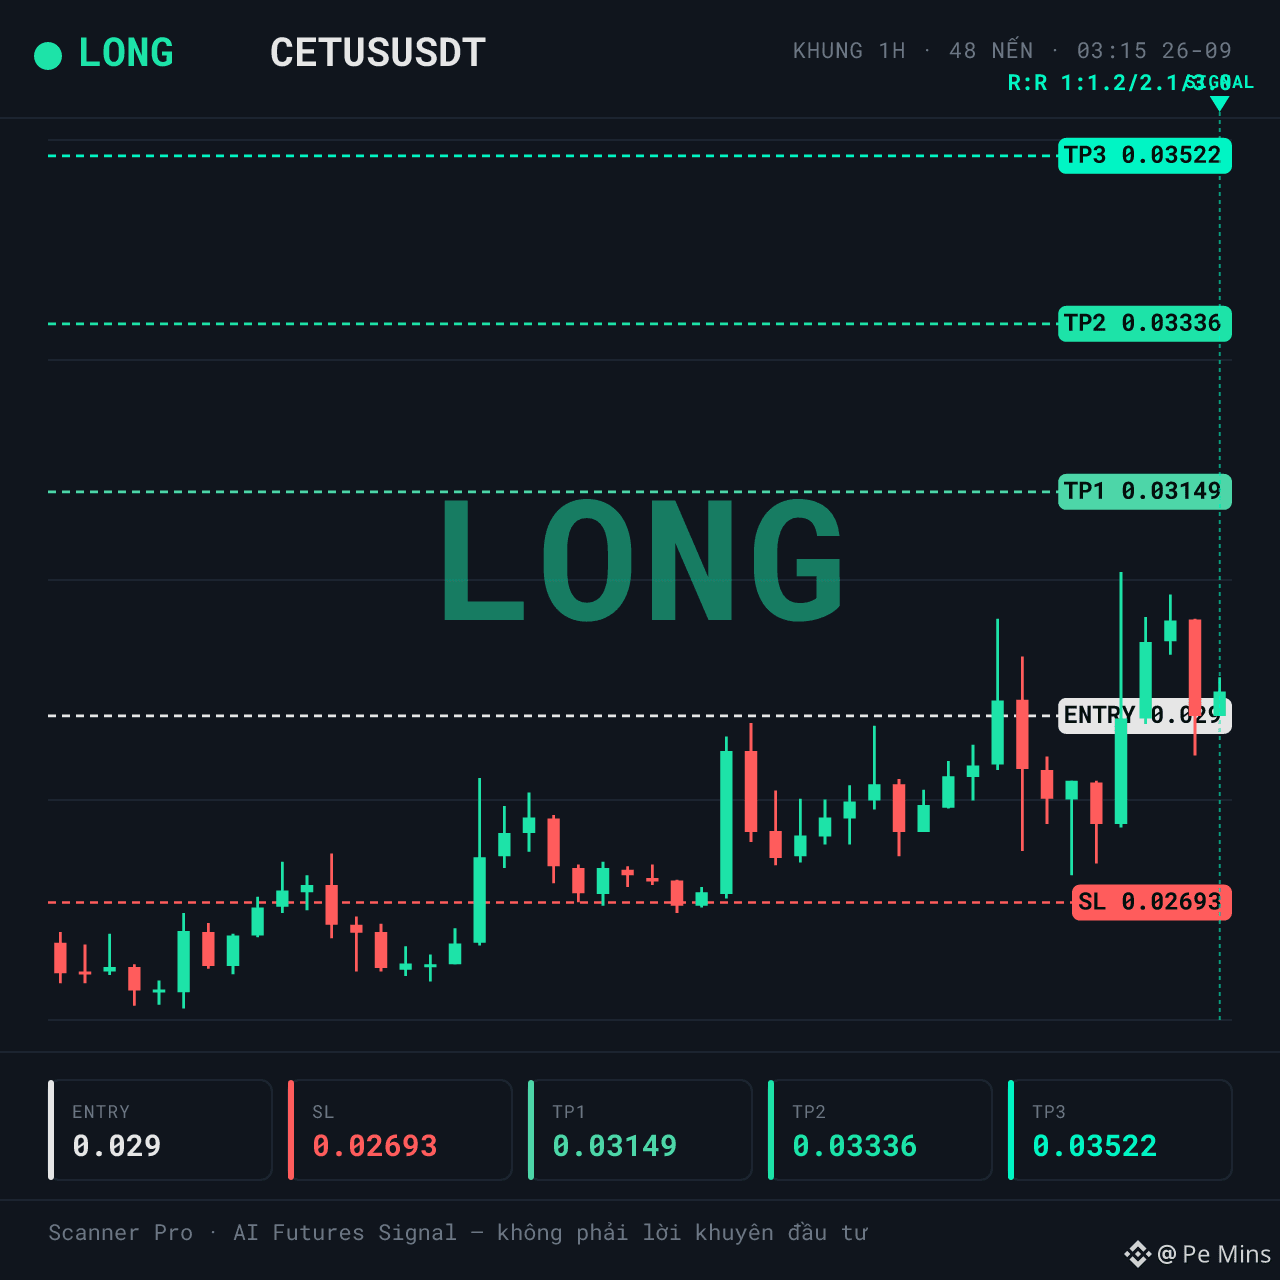
LONG $CETUS | The deactivation zone is quite far from the current price
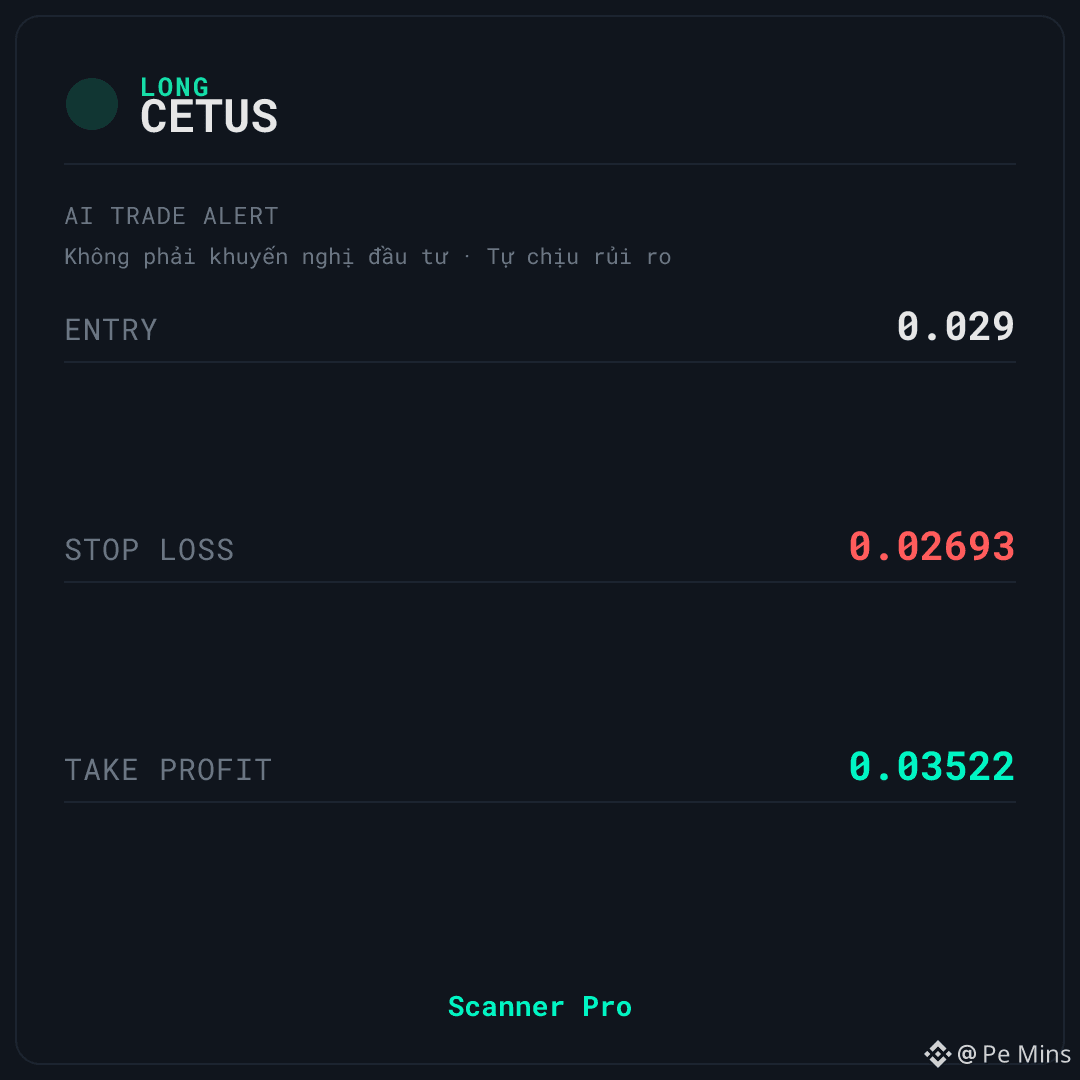
🚨 AI TRADE ALERT — $CETUS
🟢 LONG
📌 Entry: 0.02896 – 0.02904
🛑 Stop Loss: 0.02693
🎯 Take Profit: 0.03522
⏰ Valid for: 6 hours (03:15 – 09:15 VN) - Date: 26/09
$CETUS is being monitored by Scanner Pro according to the LONG scenario when the price reacts and holds the short-term support zone. 24h volume is around 6,836,742 USDT with a volume spike ratio of only 0.14x—capital flows have not truly surged.
📊 WHAT IS HAPPENING
Price is sitting at about 65% of the 24h range—meaning the upper half of the trading band. This position suggests that buying pressure is still holding the base. The backdrop is classified as an uptrend, with 24h volatility at 12.9%.
Funding of 0.0050% indicates that the LONG side is paying the SHORT side, meaning the crowd is leaning toward buying. This data should be read as a disadvantage rather than confirmation.
⚠️ RISK TO KNOW BEFORE — $CETUS
🚫 Biggest downside: the order direction matches the side that is most crowded, and that side is currently paying fees—risk remains if capital flows cannot maintain momentum. In addition, momentum has gotten hot and is no longer a supportive factor for the buy scenario.
If the price closes below the stop-loss level on the signal card, the current LONG scenario is no longer valid.
Do you think the money flow is truly entering, or just a technical pullback before the price needs a deeper retest?
This is an educational technical analysis, not investment advice. Cryptocurrency trading is highly risky—you could lose all your capital. Please research on your own and take responsibility for your decisions.
#Binance #Crypto #Futures
LONG $CETUS | The deactivation zone is quite far from the current price
🚨 AI TRADE ALERT — $CETUS
🟢 LONG
📌 Entry: 0.02896 – 0.02904
🛑 Stop Loss: 0.02693
🎯 Take Profit: 0.03522
⏰ Valid for: 6 hours (03:15 – 09:15 VN) - Date: 26/09
$CETUS is being monitored by Scanner Pro according to the LONG scenario when the price reacts and holds the short-term support zone. 24h volume is around 6,836,742 USDT with a volume spike ratio of only 0.14x—capital flows have not truly surged.
📊 WHAT IS HAPPENING
Price is sitting at about 65% of the 24h range—meaning the upper half of the trading band. This position suggests that buying pressure is still holding the base. The backdrop is classified as an uptrend, with 24h volatility at 12.9%.
Funding of 0.0050% indicates that the LONG side is paying the SHORT side, meaning the crowd is leaning toward buying. This data should be read as a disadvantage rather than confirmation.
⚠️ RISK TO KNOW BEFORE — $CETUS
🚫 Biggest downside: the order direction matches the side that is most crowded, and that side is currently paying fees—risk remains if capital flows cannot maintain momentum. In addition, momentum has gotten hot and is no longer a supportive factor for the buy scenario.
If the price closes below the stop-loss level on the signal card, the current LONG scenario is no longer valid.
Do you think the money flow is truly entering, or just a technical pullback before the price needs a deeper retest?
This is an educational technical analysis, not investment advice. Cryptocurrency trading is highly risky—you could lose all your capital. Please research on your own and take responsibility for your decisions.
#Binance #Crypto #Futures
🚨 AI TRADE ALERT — $CETUS
🟢 LONG
📌 Entry: 0.02896 – 0.02904
🛑 Stop Loss: 0.02693
🎯 Take Profit: 0.03522
⏰ Valid for: 6 hours (03:15 – 09:15 VN) - Date: 26/09
$CETUS is being monitored by Scanner Pro according to the LONG scenario when the price reacts and holds the short-term support zone. 24h volume is around 6,836,742 USDT with a volume spike ratio of only 0.14x—capital flows have not truly surged.
📊 WHAT IS HAPPENING
Price is sitting at about 65% of the 24h range—meaning the upper half of the trading band. This position suggests that buying pressure is still holding the base. The backdrop is classified as an uptrend, with 24h volatility at 12.9%.
Funding of 0.0050% indicates that the LONG side is paying the SHORT side, meaning the crowd is leaning toward buying. This data should be read as a disadvantage rather than confirmation.
⚠️ RISK TO KNOW BEFORE — $CETUS
🚫 Biggest downside: the order direction matches the side that is most crowded, and that side is currently paying fees—risk remains if capital flows cannot maintain momentum. In addition, momentum has gotten hot and is no longer a supportive factor for the buy scenario.
If the price closes below the stop-loss level on the signal card, the current LONG scenario is no longer valid.
Do you think the money flow is truly entering, or just a technical pullback before the price needs a deeper retest?
This is an educational technical analysis, not investment advice. Cryptocurrency trading is highly risky—you could lose all your capital. Please research on your own and take responsibility for your decisions.
#Binance #Crypto #Futures
·
--
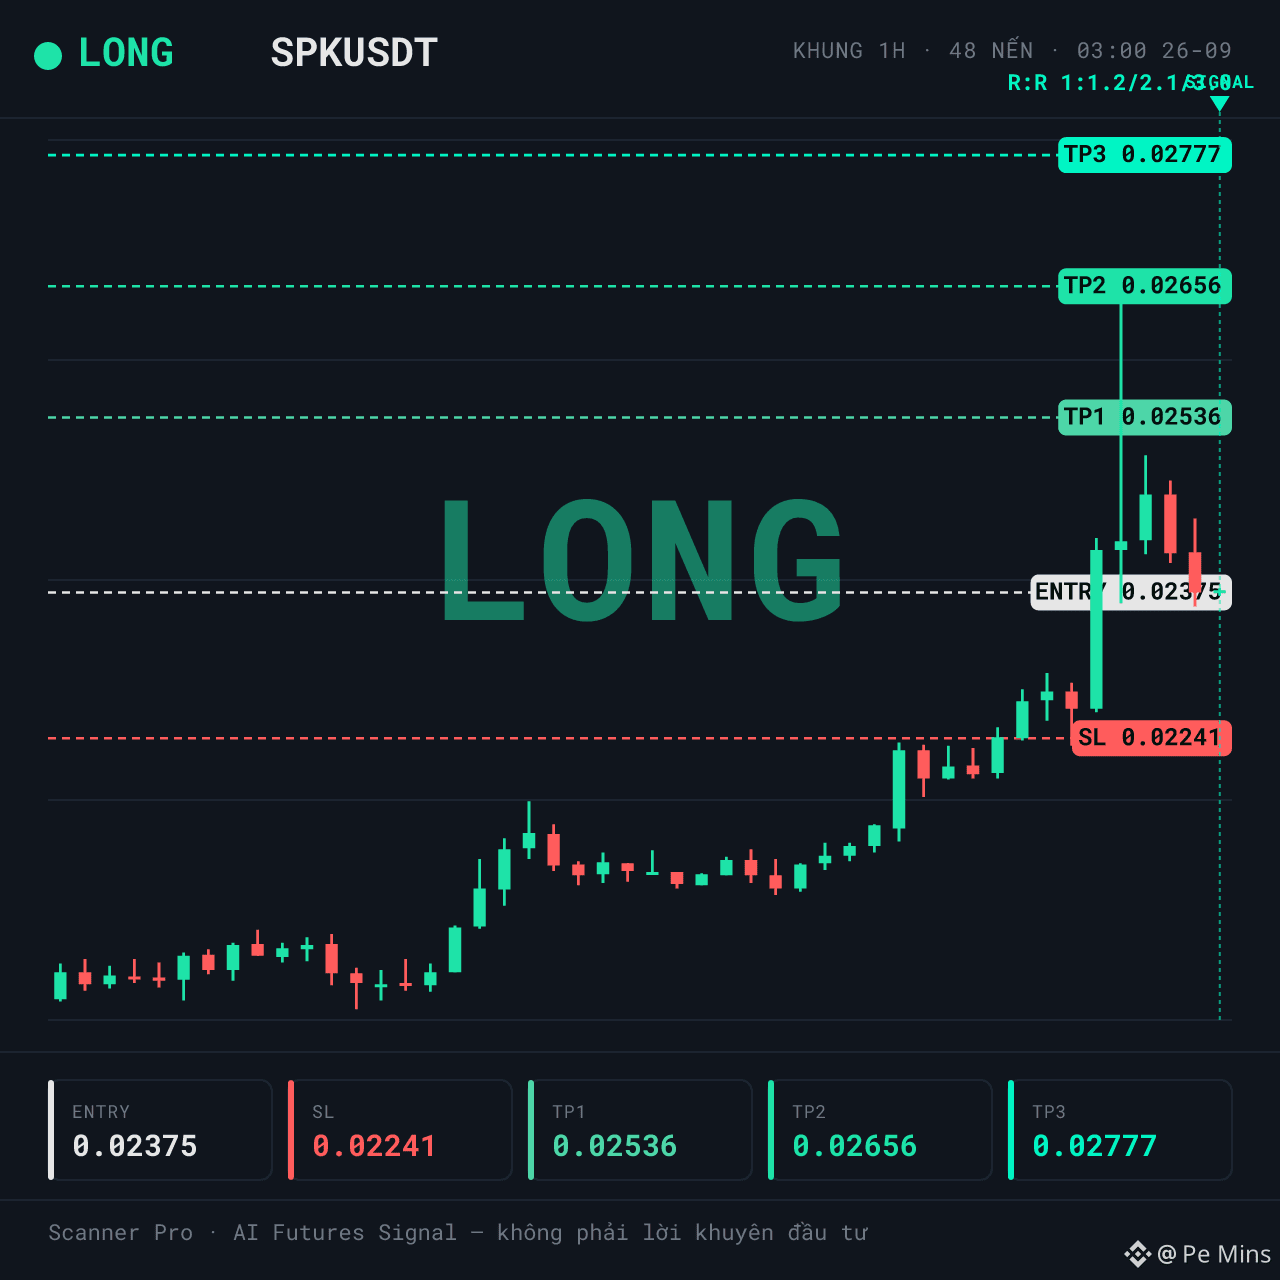
LONG $SPK | Bullish backdrop, but the crowd is leaning the same way
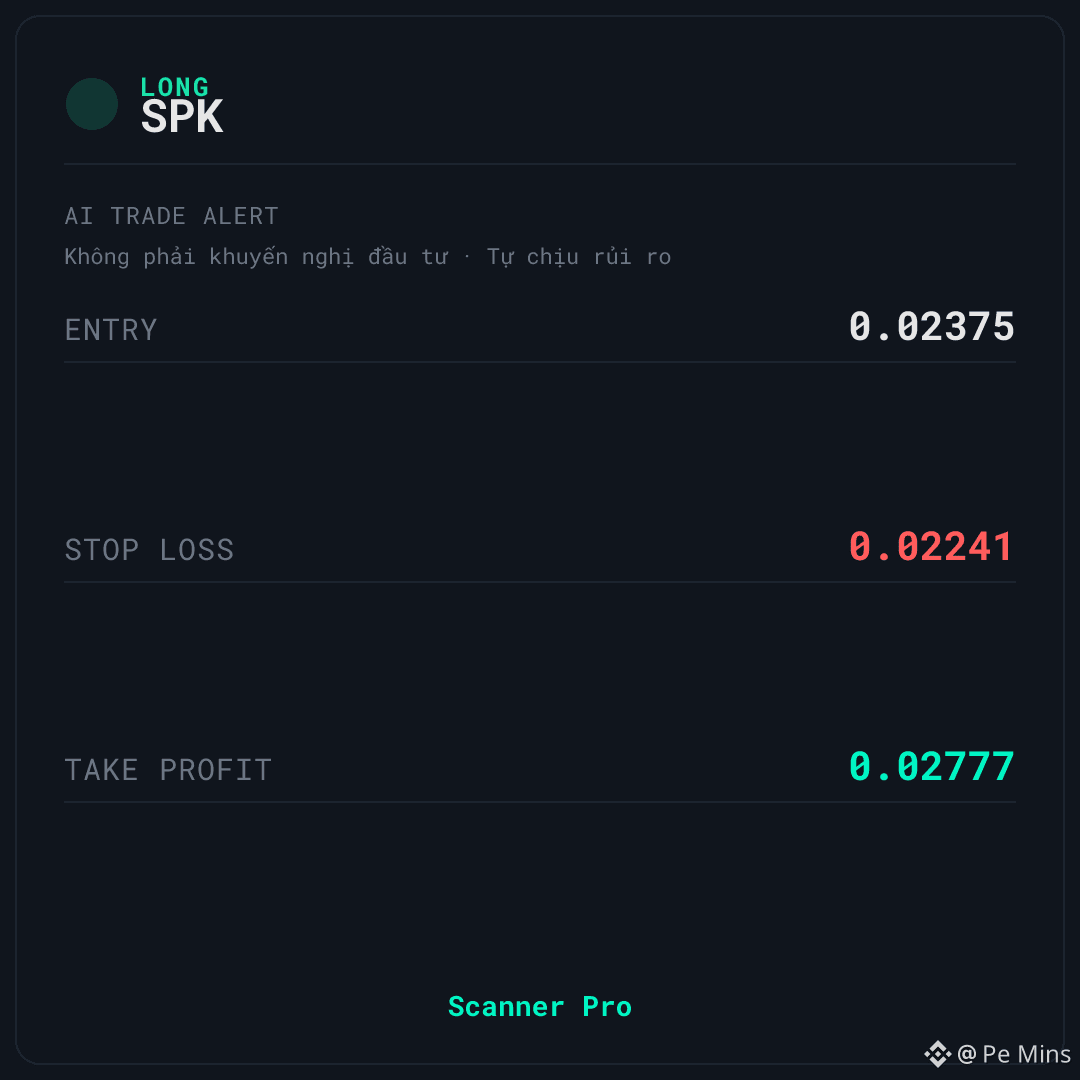
🚨 AI TRADE ALERT — $SPK
🟢 LONG
📌 Entry: 0.02371 – 0.02379
🛑 Stop Loss: 0.02241
🎯 Take Profit: 0.02777
⏰ Valid for: 6 hours (03:00 – 09:00 VN) - Date: 26/09
$SPK is being monitored by Scanner Pro under the LONG scenario when price holds steady around the current area. The market backdrop is classified as bullish, with high liquidity, but the LONG side is paying funding fees.
📊 WHAT’S GOING ON
Liquidity is high, with 24h matched volume of about 22,676,209 USDT. The overall backdrop is classified as bullish; price is sitting around the middle of the 24h range (51%) — not clearly tilted to either side.
The most noteworthy point is the funding stream: funding at 0.0050%, and the party paying the fee is the LONG side. The crowd is leaning in the same direction as the signal—an unfavorable data point that needs to be faced directly, not ignored.
⚠️ RISK TO KNOW BEFOREHAND — $SPK
🚫 The LONG side is paying the SHORT side, meaning the position is crowded on the exact side that this scenario follows—an obvious disadvantage.
💡 The 1-hour momentum has already risen to around 66.7, hotter than the neutral level, so the upward momentum is no longer a clean support for chasing buys.
If price closes below the stop-loss level on the signal card, the current LONG scenario is no longer valid.
In your view, which side—buyers or sellers—has the advantage in the current price zone?
This is educational technical analysis content, not investment advice. Crypto trading carries high risk—you could lose all of your capital. Do your own research and be responsible for your decisions.
#Binance #Crypto #Futures
LONG $SPK | Bullish backdrop, but the crowd is leaning the same way
🚨 AI TRADE ALERT — $SPK
🟢 LONG
📌 Entry: 0.02371 – 0.02379
🛑 Stop Loss: 0.02241
🎯 Take Profit: 0.02777
⏰ Valid for: 6 hours (03:00 – 09:00 VN) - Date: 26/09
$SPK is being monitored by Scanner Pro under the LONG scenario when price holds steady around the current area. The market backdrop is classified as bullish, with high liquidity, but the LONG side is paying funding fees.
📊 WHAT’S GOING ON
Liquidity is high, with 24h matched volume of about 22,676,209 USDT. The overall backdrop is classified as bullish; price is sitting around the middle of the 24h range (51%) — not clearly tilted to either side.
The most noteworthy point is the funding stream: funding at 0.0050%, and the party paying the fee is the LONG side. The crowd is leaning in the same direction as the signal—an unfavorable data point that needs to be faced directly, not ignored.
⚠️ RISK TO KNOW BEFOREHAND — $SPK
🚫 The LONG side is paying the SHORT side, meaning the position is crowded on the exact side that this scenario follows—an obvious disadvantage.
💡 The 1-hour momentum has already risen to around 66.7, hotter than the neutral level, so the upward momentum is no longer a clean support for chasing buys.
If price closes below the stop-loss level on the signal card, the current LONG scenario is no longer valid.
In your view, which side—buyers or sellers—has the advantage in the current price zone?
This is educational technical analysis content, not investment advice. Crypto trading carries high risk—you could lose all of your capital. Do your own research and be responsible for your decisions.
#Binance #Crypto #Futures
🚨 AI TRADE ALERT — $SPK
🟢 LONG
📌 Entry: 0.02371 – 0.02379
🛑 Stop Loss: 0.02241
🎯 Take Profit: 0.02777
⏰ Valid for: 6 hours (03:00 – 09:00 VN) - Date: 26/09
$SPK is being monitored by Scanner Pro under the LONG scenario when price holds steady around the current area. The market backdrop is classified as bullish, with high liquidity, but the LONG side is paying funding fees.
📊 WHAT’S GOING ON
Liquidity is high, with 24h matched volume of about 22,676,209 USDT. The overall backdrop is classified as bullish; price is sitting around the middle of the 24h range (51%) — not clearly tilted to either side.
The most noteworthy point is the funding stream: funding at 0.0050%, and the party paying the fee is the LONG side. The crowd is leaning in the same direction as the signal—an unfavorable data point that needs to be faced directly, not ignored.
⚠️ RISK TO KNOW BEFOREHAND — $SPK
🚫 The LONG side is paying the SHORT side, meaning the position is crowded on the exact side that this scenario follows—an obvious disadvantage.
💡 The 1-hour momentum has already risen to around 66.7, hotter than the neutral level, so the upward momentum is no longer a clean support for chasing buys.
If price closes below the stop-loss level on the signal card, the current LONG scenario is no longer valid.
In your view, which side—buyers or sellers—has the advantage in the current price zone?
This is educational technical analysis content, not investment advice. Crypto trading carries high risk—you could lose all of your capital. Do your own research and be responsible for your decisions.
#Binance #Crypto #Futures
3
·
--
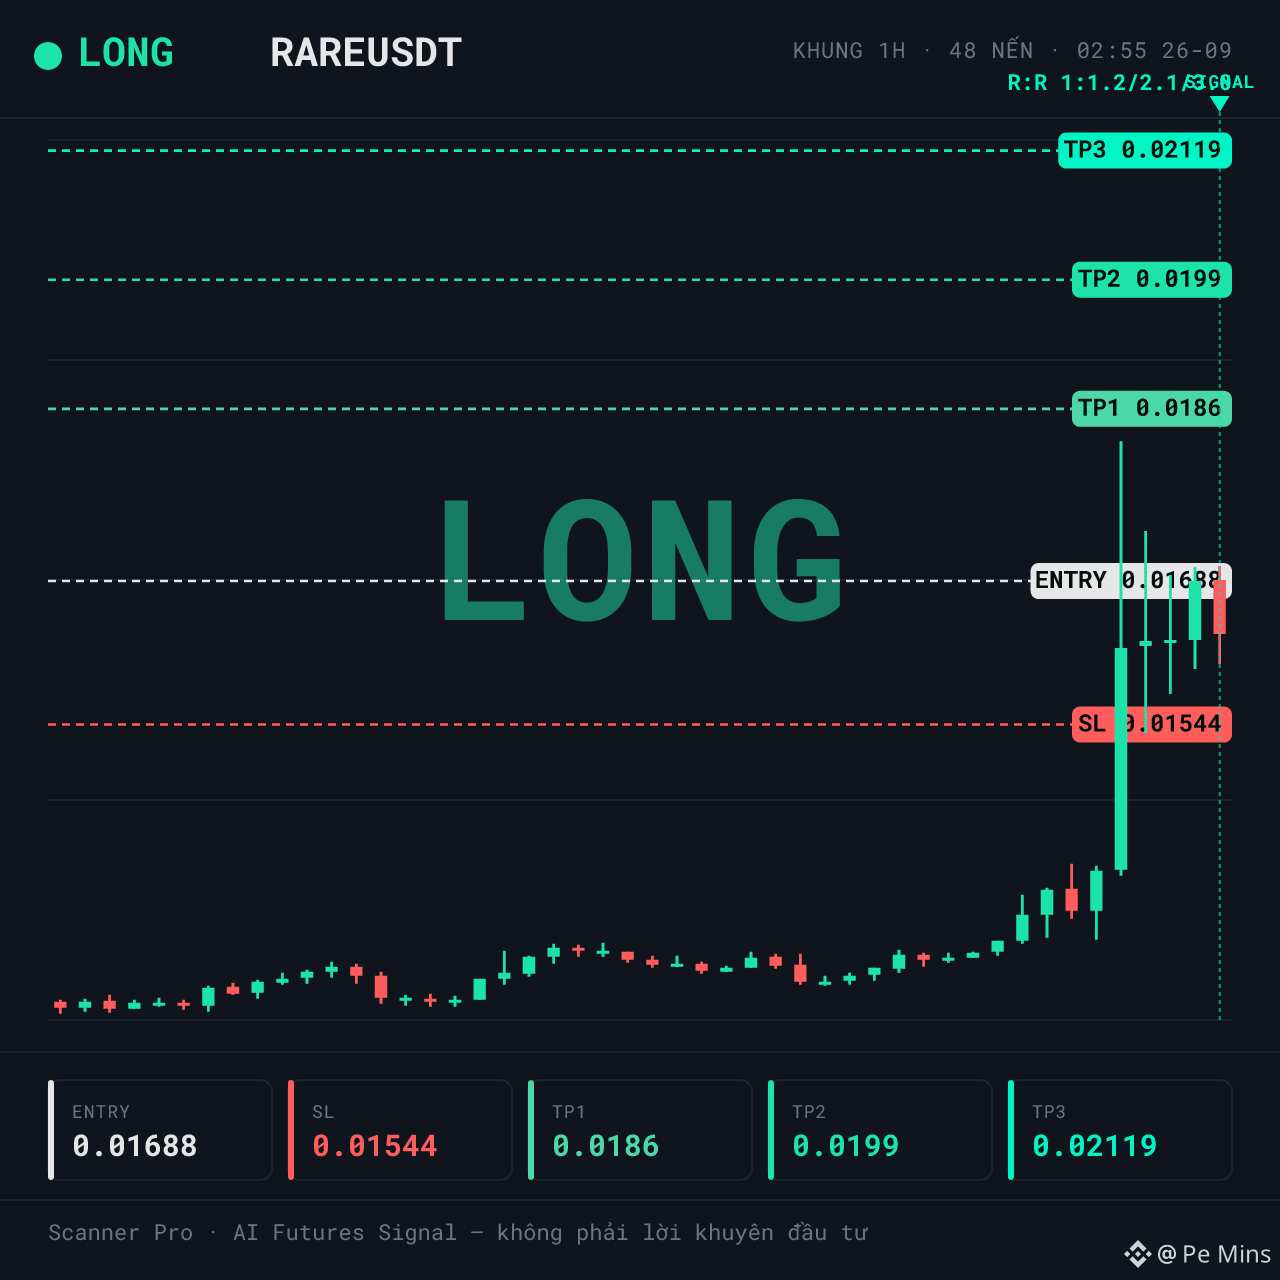
LONG $RARE | Volume surges, but the regime goes against expectations
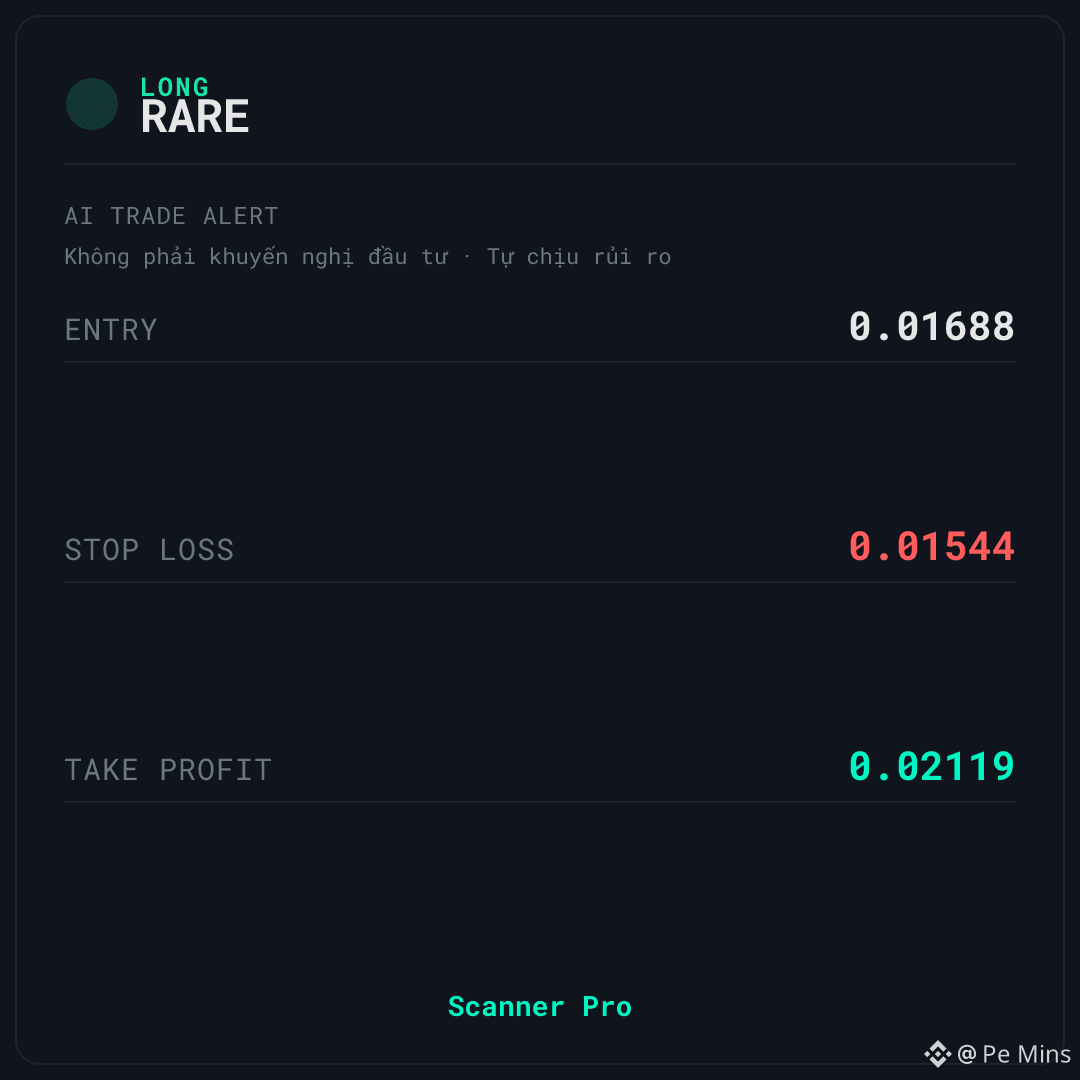
🚨 AI TRADE ALERT — $RARE
🟢 LONG
📌 Entry: 0.01685 – 0.01691
🛑 Stop Loss: 0.01544
🎯 Take Profit: 0.02119
⏰ Valid for: 6 hours (02:55 – 08:55 VN) - Date: 26/09
$RARE is being monitored by Scanner Pro under the LONG scenario when price holds its structure around the current region. The context is rated bullish: the 24h volume is at a notable level, and the funding indicates that the SHORT side is paying the LONG side.
📊 WHAT’S HAPPENING
24h quote volume ~50.583.597 USDT with a volume spike ratio of 1.26x — money flow is returning more clearly than the recent average. Funding -0.4486%: the SHORT side is paying the LONG side, meaning the crowd is leaning opposite to the signal direction, which supports the LONG scenario.
The overall context is rated bullish, but the price is only at 64% of the 24h range — it’s not at the top zone and not at the bottom zone. This is a middle zone, where both sides still have room to maneuver.
⚠️ RISK TO KNOW AHEAD — $RARE
🚫 Biggest downside: although the regime is rated bullish, the 1h momentum is already in the 78.4 zone — it’s heating up, not a support point for a buy setup anymore. This is a risk to monitor, especially since price is in the middle of the 24h range.
If price closes below the stop-loss level on the signal card, the current LONG scenario is no longer valid.
Do you think this is real money flow returning, or just a technical bounce before price needs a deeper retest?
This is educational technical analysis content, not investment advice. Crypto trading carries high risk—you may lose all of your capital. Please do your own research and take responsibility for your decisions.
#Binance #Crypto #Futures
LONG $RARE | Volume surges, but the regime goes against expectations
🚨 AI TRADE ALERT — $RARE
🟢 LONG
📌 Entry: 0.01685 – 0.01691
🛑 Stop Loss: 0.01544
🎯 Take Profit: 0.02119
⏰ Valid for: 6 hours (02:55 – 08:55 VN) - Date: 26/09
$RARE is being monitored by Scanner Pro under the LONG scenario when price holds its structure around the current region. The context is rated bullish: the 24h volume is at a notable level, and the funding indicates that the SHORT side is paying the LONG side.
📊 WHAT’S HAPPENING
24h quote volume ~50.583.597 USDT with a volume spike ratio of 1.26x — money flow is returning more clearly than the recent average. Funding -0.4486%: the SHORT side is paying the LONG side, meaning the crowd is leaning opposite to the signal direction, which supports the LONG scenario.
The overall context is rated bullish, but the price is only at 64% of the 24h range — it’s not at the top zone and not at the bottom zone. This is a middle zone, where both sides still have room to maneuver.
⚠️ RISK TO KNOW AHEAD — $RARE
🚫 Biggest downside: although the regime is rated bullish, the 1h momentum is already in the 78.4 zone — it’s heating up, not a support point for a buy setup anymore. This is a risk to monitor, especially since price is in the middle of the 24h range.
If price closes below the stop-loss level on the signal card, the current LONG scenario is no longer valid.
Do you think this is real money flow returning, or just a technical bounce before price needs a deeper retest?
This is educational technical analysis content, not investment advice. Crypto trading carries high risk—you may lose all of your capital. Please do your own research and take responsibility for your decisions.
#Binance #Crypto #Futures
🚨 AI TRADE ALERT — $RARE
🟢 LONG
📌 Entry: 0.01685 – 0.01691
🛑 Stop Loss: 0.01544
🎯 Take Profit: 0.02119
⏰ Valid for: 6 hours (02:55 – 08:55 VN) - Date: 26/09
$RARE is being monitored by Scanner Pro under the LONG scenario when price holds its structure around the current region. The context is rated bullish: the 24h volume is at a notable level, and the funding indicates that the SHORT side is paying the LONG side.
📊 WHAT’S HAPPENING
24h quote volume ~50.583.597 USDT with a volume spike ratio of 1.26x — money flow is returning more clearly than the recent average. Funding -0.4486%: the SHORT side is paying the LONG side, meaning the crowd is leaning opposite to the signal direction, which supports the LONG scenario.
The overall context is rated bullish, but the price is only at 64% of the 24h range — it’s not at the top zone and not at the bottom zone. This is a middle zone, where both sides still have room to maneuver.
⚠️ RISK TO KNOW AHEAD — $RARE
🚫 Biggest downside: although the regime is rated bullish, the 1h momentum is already in the 78.4 zone — it’s heating up, not a support point for a buy setup anymore. This is a risk to monitor, especially since price is in the middle of the 24h range.
If price closes below the stop-loss level on the signal card, the current LONG scenario is no longer valid.
Do you think this is real money flow returning, or just a technical bounce before price needs a deeper retest?
This is educational technical analysis content, not investment advice. Crypto trading carries high risk—you may lose all of your capital. Please do your own research and take responsibility for your decisions.
#Binance #Crypto #Futures
2
·
--
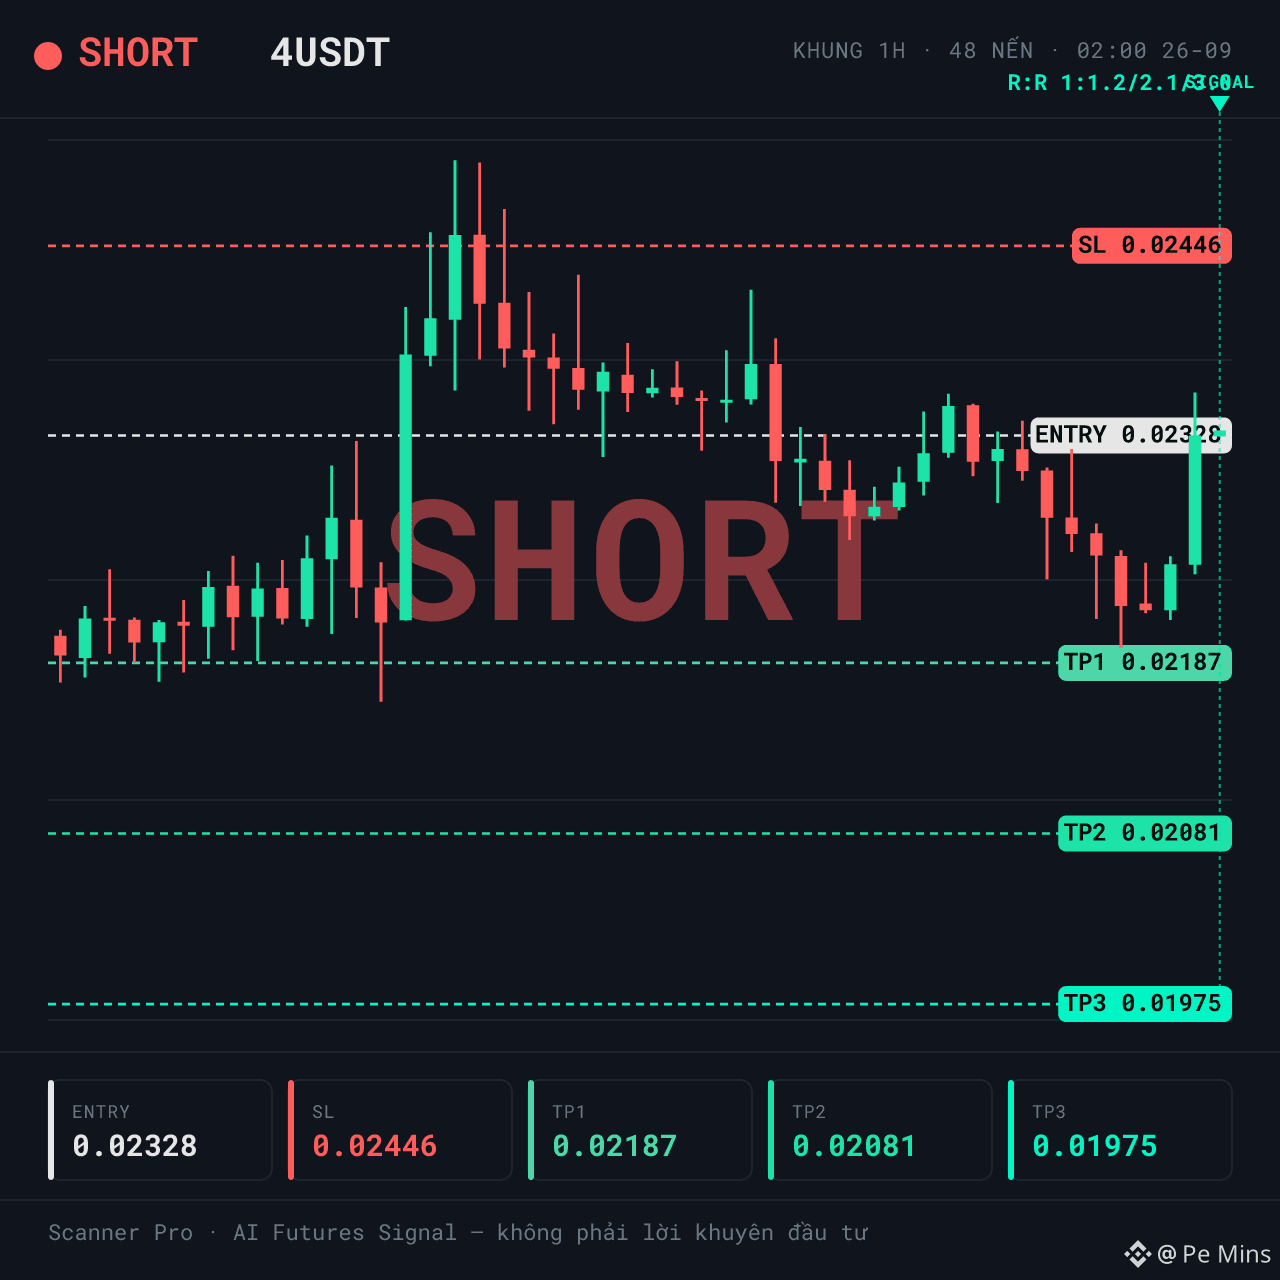
SHORT $4 | Neutral backdrop, the long side is paying fees — counter-signal setup or trend-follow?
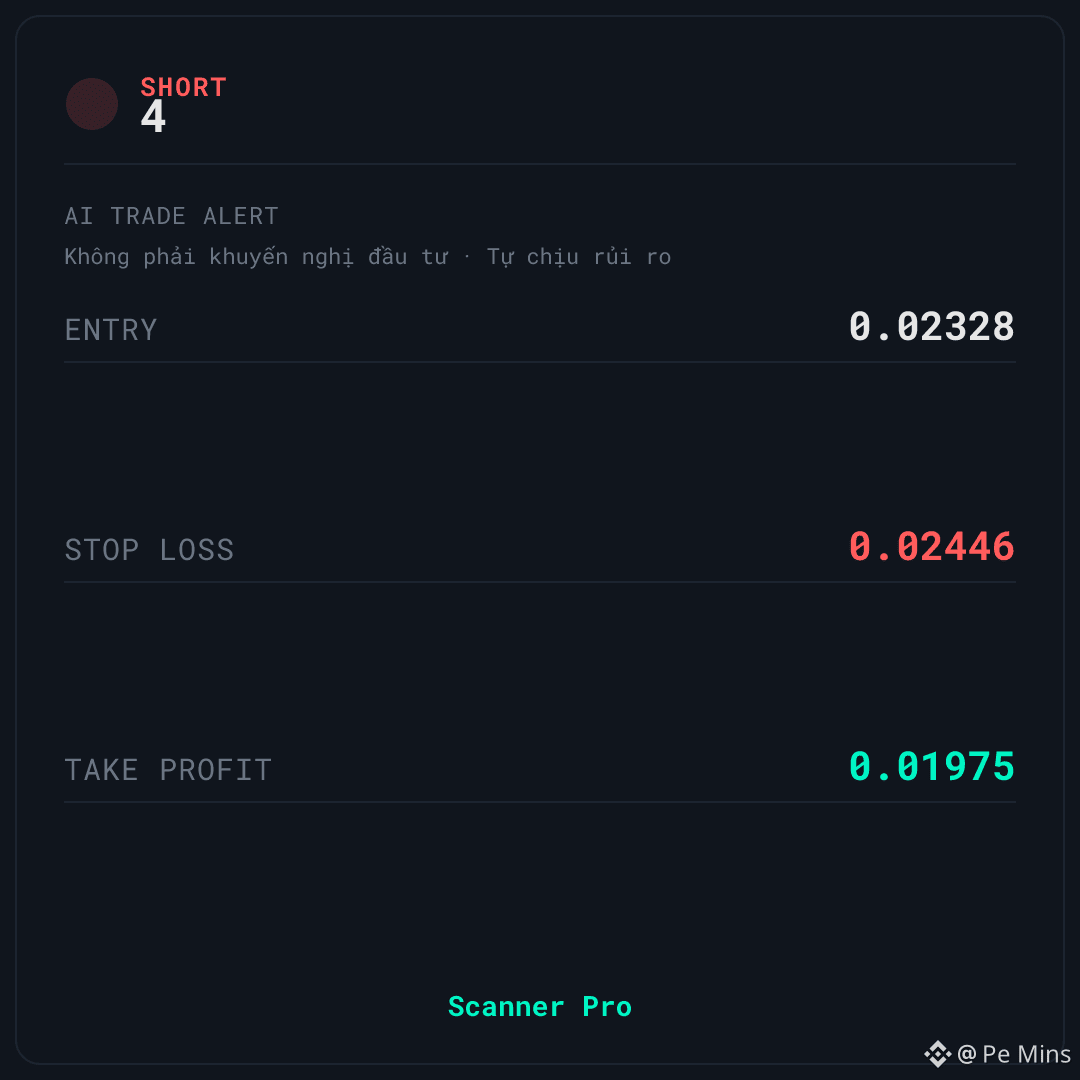
🚨 AI TRADE ALERT — $4
🔴 SHORT
📌 Entry: 0.02325 – 0.02332
🛑 Stop Loss: 0.02446
🎯 Take Profit: 0.01975
⏰ Valid for: 6 hours (02:00 – 08:00 VN) - Date: 26/09
$4 is being tracked by Scanner Pro for a SHORT scenario when price reacts weakly around the current zone. The market backdrop is classified as neutral, with price sitting at about 59% of the 24h range.
📊 WHAT’S HAPPENING
Funding is at 0.0317% — according to the data, the long side is paying the short side, meaning the crowd is leaning opposite to what this signal suggests. This is a supportive point for the SHORT direction.
Liquidity is assessed as strong, but the volume spike ratio of 0.00x indicates that the money flow has not yet surged to provide confirmation. The overall backdrop remains neutral, so this setup is more of a fade than a trend-chase.
⚠️ RISKS TO KNOW BEFORE — $4
🚫 The biggest risk: the SHORT direction aligns with the side that benefits from funding, but the crowd is leaning long — meaning the flow may not have truly confirmed. The 1-hour momentum indicator around 55 hasn’t given a clear signal.
If price closes beyond the stop-loss level on the signal card, the current SHORT setup is no longer valid.
In your view, is this a technical correction wave, or is the money flow genuinely changing direction?
This is educational technical analysis content, not investment advice. Crypto trading is high risk—you can lose all your capital. Please do your own research and take responsibility for your decisions.
#Binance #Crypto #Futures
SHORT $4 | Neutral backdrop, the long side is paying fees — counter-signal setup or trend-follow?
🚨 AI TRADE ALERT — $4
🔴 SHORT
📌 Entry: 0.02325 – 0.02332
🛑 Stop Loss: 0.02446
🎯 Take Profit: 0.01975
⏰ Valid for: 6 hours (02:00 – 08:00 VN) - Date: 26/09
$4 is being tracked by Scanner Pro for a SHORT scenario when price reacts weakly around the current zone. The market backdrop is classified as neutral, with price sitting at about 59% of the 24h range.
📊 WHAT’S HAPPENING
Funding is at 0.0317% — according to the data, the long side is paying the short side, meaning the crowd is leaning opposite to what this signal suggests. This is a supportive point for the SHORT direction.
Liquidity is assessed as strong, but the volume spike ratio of 0.00x indicates that the money flow has not yet surged to provide confirmation. The overall backdrop remains neutral, so this setup is more of a fade than a trend-chase.
⚠️ RISKS TO KNOW BEFORE — $4
🚫 The biggest risk: the SHORT direction aligns with the side that benefits from funding, but the crowd is leaning long — meaning the flow may not have truly confirmed. The 1-hour momentum indicator around 55 hasn’t given a clear signal.
If price closes beyond the stop-loss level on the signal card, the current SHORT setup is no longer valid.
In your view, is this a technical correction wave, or is the money flow genuinely changing direction?
This is educational technical analysis content, not investment advice. Crypto trading is high risk—you can lose all your capital. Please do your own research and take responsibility for your decisions.
#Binance #Crypto #Futures
🚨 AI TRADE ALERT — $4
🔴 SHORT
📌 Entry: 0.02325 – 0.02332
🛑 Stop Loss: 0.02446
🎯 Take Profit: 0.01975
⏰ Valid for: 6 hours (02:00 – 08:00 VN) - Date: 26/09
$4 is being tracked by Scanner Pro for a SHORT scenario when price reacts weakly around the current zone. The market backdrop is classified as neutral, with price sitting at about 59% of the 24h range.
📊 WHAT’S HAPPENING
Funding is at 0.0317% — according to the data, the long side is paying the short side, meaning the crowd is leaning opposite to what this signal suggests. This is a supportive point for the SHORT direction.
Liquidity is assessed as strong, but the volume spike ratio of 0.00x indicates that the money flow has not yet surged to provide confirmation. The overall backdrop remains neutral, so this setup is more of a fade than a trend-chase.
⚠️ RISKS TO KNOW BEFORE — $4
🚫 The biggest risk: the SHORT direction aligns with the side that benefits from funding, but the crowd is leaning long — meaning the flow may not have truly confirmed. The 1-hour momentum indicator around 55 hasn’t given a clear signal.
If price closes beyond the stop-loss level on the signal card, the current SHORT setup is no longer valid.
In your view, is this a technical correction wave, or is the money flow genuinely changing direction?
This is educational technical analysis content, not investment advice. Crypto trading is high risk—you can lose all your capital. Please do your own research and take responsibility for your decisions.
#Binance #Crypto #Futures
·
--
SHORT $SYN | High liquidity but cash flow leans to one side: risk
🚨 AI TRADE ALERT — $SYN
🔴 SHORT
📌 Entry: 0.1863 – 0.1868
🛑 Stop Loss: 0.2049
🎯 Take Profit: 0.1315
⏰ Validity: 6 hours (01:45 – 07:45 VN) - Date: 26/09
$SYN is being tracked by Scanner Pro according to the SHORT scenario when the price reacts weakly in the lower range of the 24h band. Market liquidity is high with a 24h volume of about 27.5 million, but negative funding indicates the SHORT side is paying fees.
📊 WHY IT'S WORTH NOTING
Liquidity is rated high; 24h quoted volume ~27,528,146 USDT, with a volume spike ratio of 0.30x — participation remains steady but there are no signs of a breakout.
Price is at 22% of the 24h range, i.e., the lower zone, which fits the SHORT scenario in a neutral trend context.
⚠️ SETUP & RISK — $SYN
🚫 Funding -0.0026% means the SHORT side is paying fees to the LONG side — the crowd is tilted in the same direction as this signal, which is a disadvantage worth monitoring.
If the price closes above the stop-loss level on the signal card, the current SHORT scenario is no longer valid.
With the current liquidity, do you think this is a sign that large money is distributing—or just a temporary pullback?
This is educational technical analysis content, not investment advice. Crypto trading carries high risk; you could lose all of your capital. Do your own research and be responsible for your decisions.
#Binance #Crypto #Futures
SHORT $SYN | High liquidity but cash flow leans to one side: risk
🚨 AI TRADE ALERT — $SYN
🔴 SHORT
📌 Entry: 0.1863 – 0.1868
🛑 Stop Loss: 0.2049
🎯 Take Profit: 0.1315
⏰ Validity: 6 hours (01:45 – 07:45 VN) - Date: 26/09
$SYN is being tracked by Scanner Pro according to the SHORT scenario when the price reacts weakly in the lower range of the 24h band. Market liquidity is high with a 24h volume of about 27.5 million, but negative funding indicates the SHORT side is paying fees.
📊 WHY IT'S WORTH NOTING
Liquidity is rated high; 24h quoted volume ~27,528,146 USDT, with a volume spike ratio of 0.30x — participation remains steady but there are no signs of a breakout.
Price is at 22% of the 24h range, i.e., the lower zone, which fits the SHORT scenario in a neutral trend context.
⚠️ SETUP & RISK — $SYN
🚫 Funding -0.0026% means the SHORT side is paying fees to the LONG side — the crowd is tilted in the same direction as this signal, which is a disadvantage worth monitoring.
If the price closes above the stop-loss level on the signal card, the current SHORT scenario is no longer valid.
With the current liquidity, do you think this is a sign that large money is distributing—or just a temporary pullback?
This is educational technical analysis content, not investment advice. Crypto trading carries high risk; you could lose all of your capital. Do your own research and be responsible for your decisions.
#Binance #Crypto #Futures
🚨 AI TRADE ALERT — $SYN
🔴 SHORT
📌 Entry: 0.1863 – 0.1868
🛑 Stop Loss: 0.2049
🎯 Take Profit: 0.1315
⏰ Validity: 6 hours (01:45 – 07:45 VN) - Date: 26/09
$SYN is being tracked by Scanner Pro according to the SHORT scenario when the price reacts weakly in the lower range of the 24h band. Market liquidity is high with a 24h volume of about 27.5 million, but negative funding indicates the SHORT side is paying fees.
📊 WHY IT'S WORTH NOTING
Liquidity is rated high; 24h quoted volume ~27,528,146 USDT, with a volume spike ratio of 0.30x — participation remains steady but there are no signs of a breakout.
Price is at 22% of the 24h range, i.e., the lower zone, which fits the SHORT scenario in a neutral trend context.
⚠️ SETUP & RISK — $SYN
🚫 Funding -0.0026% means the SHORT side is paying fees to the LONG side — the crowd is tilted in the same direction as this signal, which is a disadvantage worth monitoring.
If the price closes above the stop-loss level on the signal card, the current SHORT scenario is no longer valid.
With the current liquidity, do you think this is a sign that large money is distributing—or just a temporary pullback?
This is educational technical analysis content, not investment advice. Crypto trading carries high risk; you could lose all of your capital. Do your own research and be responsible for your decisions.
#Binance #Crypto #Futures
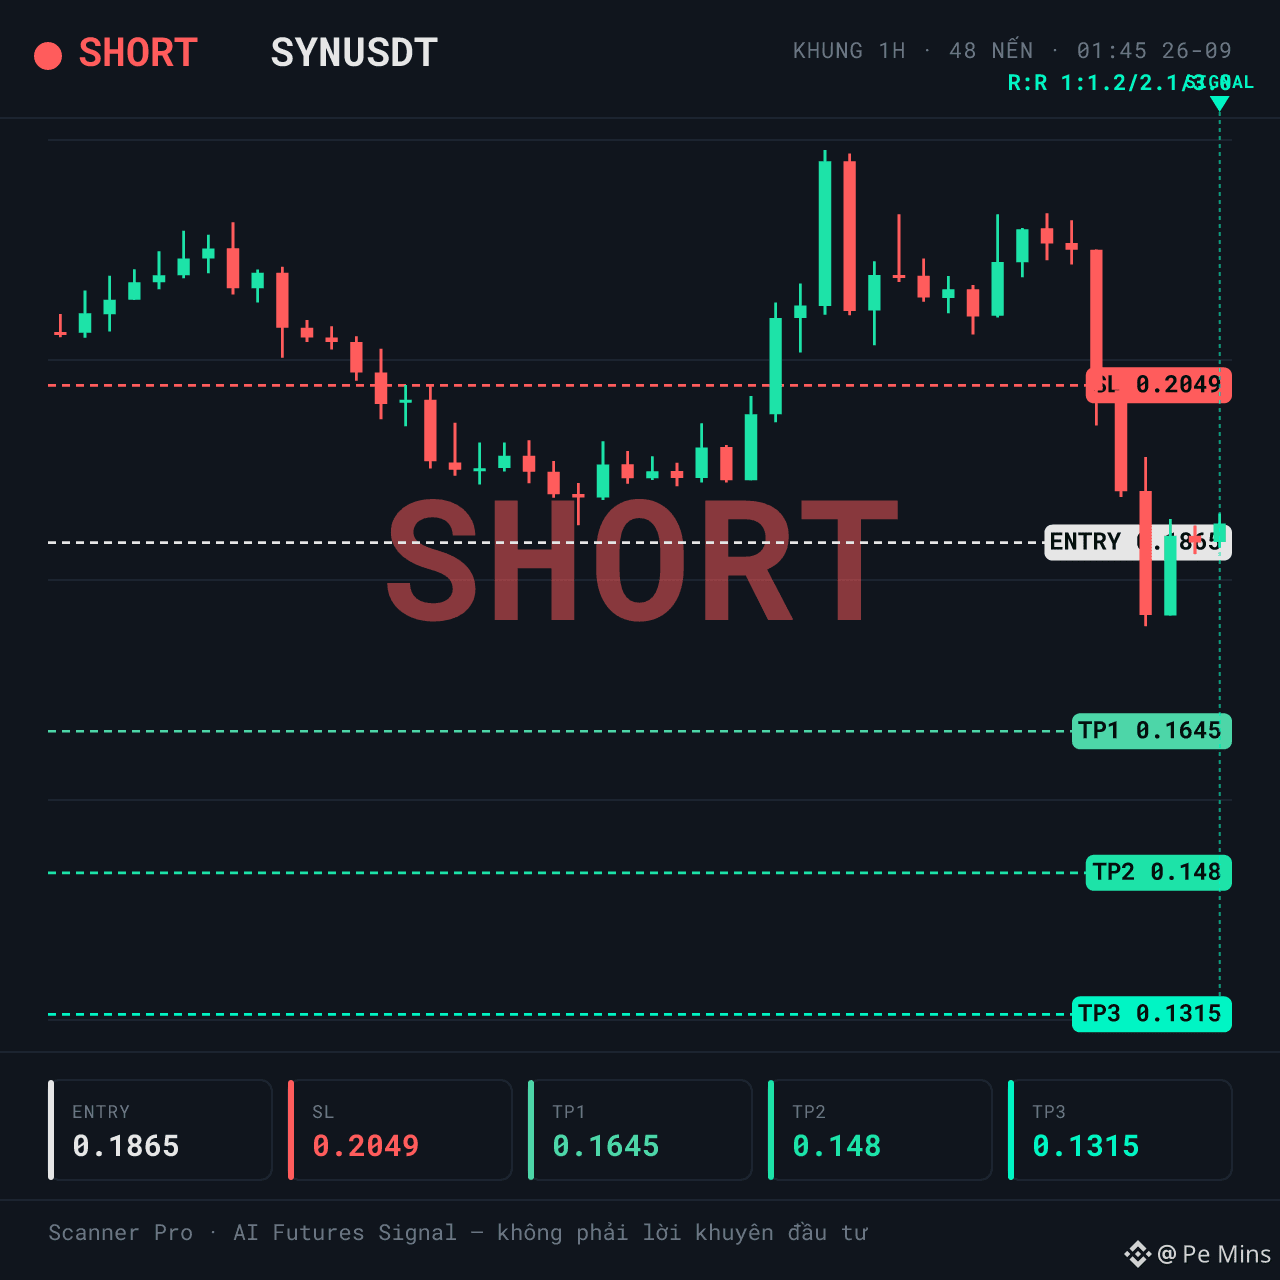
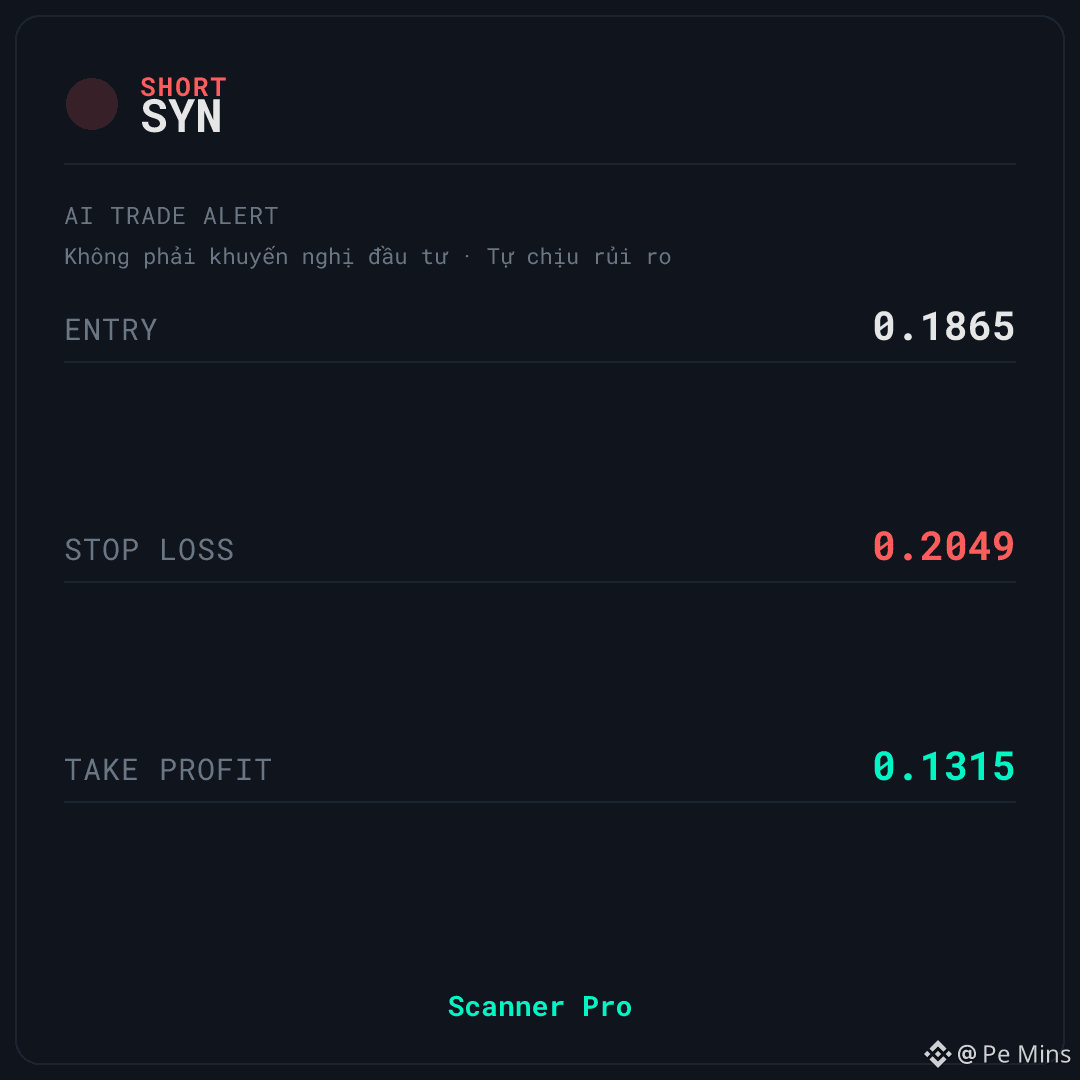
·
--
LONG $RAYSOL | Long tilt, buy-side is paying fees — downside point to note
🚨 AI TRADE ALERT — $RAYSOL
🟢 LONG
📌 Entry: 2.0521 – 2.0583
🛑 Stop Loss: 1.9462
🎯 Take Profit: 2.3822
⏰ Validity: 6 hours (01:40 – 07:40 VN) - Date: 26/09
$RAYSOL is being tracked by Scanner Pro for the LONG setup when price reacts around the entry zone with significant 24h volume. The backdrop is neutral, liquidity is high, funding is 0.0050%, and the volume spike ratio is 0.40x—indicating that capital hasn’t truly surged yet.
📊 WHAT THE DATA IS SHOWING
Liquidity is ranked high, with 24h quote volume ~54,251,459 USDT, but the volume spike ratio is only 0.40x—there’s no clear sign that money has strongly entered the market. This is a signal that should be watched further before expecting a breakout move.
Funding 0.0050% shows that the LONG side is paying fees to the SHORT side, meaning the market is leaning long. The crowd is leaning IN THE SAME DIRECTION with this signal—this is a disadvantage, not confirmation.
💡 SCENARIO & OPEN QUESTION — $RAYSOL
⚠️ Biggest risk: the LONG side is crowded and paying fees, while price is at 25% of the 24h range—toward the lower end of the range. For a reversal strategy, this is a point that needs special attention rather than being treated as supportive.
🚫 If price closes below the stop-loss level shown on the signal card, the current LONG scenario is no longer valid.
💡 What do you think—this is a retest to hold the base, or will the selling side continue to control this zone?
This is educational technical analysis content, not investment advice. Crypto trading carries high risk; you may lose all of your capital. Do your own research and take responsibility for your decisions.
#Binance #Crypto #Futures
LONG $RAYSOL | Long tilt, buy-side is paying fees — downside point to note
🚨 AI TRADE ALERT — $RAYSOL
🟢 LONG
📌 Entry: 2.0521 – 2.0583
🛑 Stop Loss: 1.9462
🎯 Take Profit: 2.3822
⏰ Validity: 6 hours (01:40 – 07:40 VN) - Date: 26/09
$RAYSOL is being tracked by Scanner Pro for the LONG setup when price reacts around the entry zone with significant 24h volume. The backdrop is neutral, liquidity is high, funding is 0.0050%, and the volume spike ratio is 0.40x—indicating that capital hasn’t truly surged yet.
📊 WHAT THE DATA IS SHOWING
Liquidity is ranked high, with 24h quote volume ~54,251,459 USDT, but the volume spike ratio is only 0.40x—there’s no clear sign that money has strongly entered the market. This is a signal that should be watched further before expecting a breakout move.
Funding 0.0050% shows that the LONG side is paying fees to the SHORT side, meaning the market is leaning long. The crowd is leaning IN THE SAME DIRECTION with this signal—this is a disadvantage, not confirmation.
💡 SCENARIO & OPEN QUESTION — $RAYSOL
⚠️ Biggest risk: the LONG side is crowded and paying fees, while price is at 25% of the 24h range—toward the lower end of the range. For a reversal strategy, this is a point that needs special attention rather than being treated as supportive.
🚫 If price closes below the stop-loss level shown on the signal card, the current LONG scenario is no longer valid.
💡 What do you think—this is a retest to hold the base, or will the selling side continue to control this zone?
This is educational technical analysis content, not investment advice. Crypto trading carries high risk; you may lose all of your capital. Do your own research and take responsibility for your decisions.
#Binance #Crypto #Futures
🚨 AI TRADE ALERT — $RAYSOL
🟢 LONG
📌 Entry: 2.0521 – 2.0583
🛑 Stop Loss: 1.9462
🎯 Take Profit: 2.3822
⏰ Validity: 6 hours (01:40 – 07:40 VN) - Date: 26/09
$RAYSOL is being tracked by Scanner Pro for the LONG setup when price reacts around the entry zone with significant 24h volume. The backdrop is neutral, liquidity is high, funding is 0.0050%, and the volume spike ratio is 0.40x—indicating that capital hasn’t truly surged yet.
📊 WHAT THE DATA IS SHOWING
Liquidity is ranked high, with 24h quote volume ~54,251,459 USDT, but the volume spike ratio is only 0.40x—there’s no clear sign that money has strongly entered the market. This is a signal that should be watched further before expecting a breakout move.
Funding 0.0050% shows that the LONG side is paying fees to the SHORT side, meaning the market is leaning long. The crowd is leaning IN THE SAME DIRECTION with this signal—this is a disadvantage, not confirmation.
💡 SCENARIO & OPEN QUESTION — $RAYSOL
⚠️ Biggest risk: the LONG side is crowded and paying fees, while price is at 25% of the 24h range—toward the lower end of the range. For a reversal strategy, this is a point that needs special attention rather than being treated as supportive.
🚫 If price closes below the stop-loss level shown on the signal card, the current LONG scenario is no longer valid.
💡 What do you think—this is a retest to hold the base, or will the selling side continue to control this zone?
This is educational technical analysis content, not investment advice. Crypto trading carries high risk; you may lose all of your capital. Do your own research and take responsibility for your decisions.
#Binance #Crypto #Futures
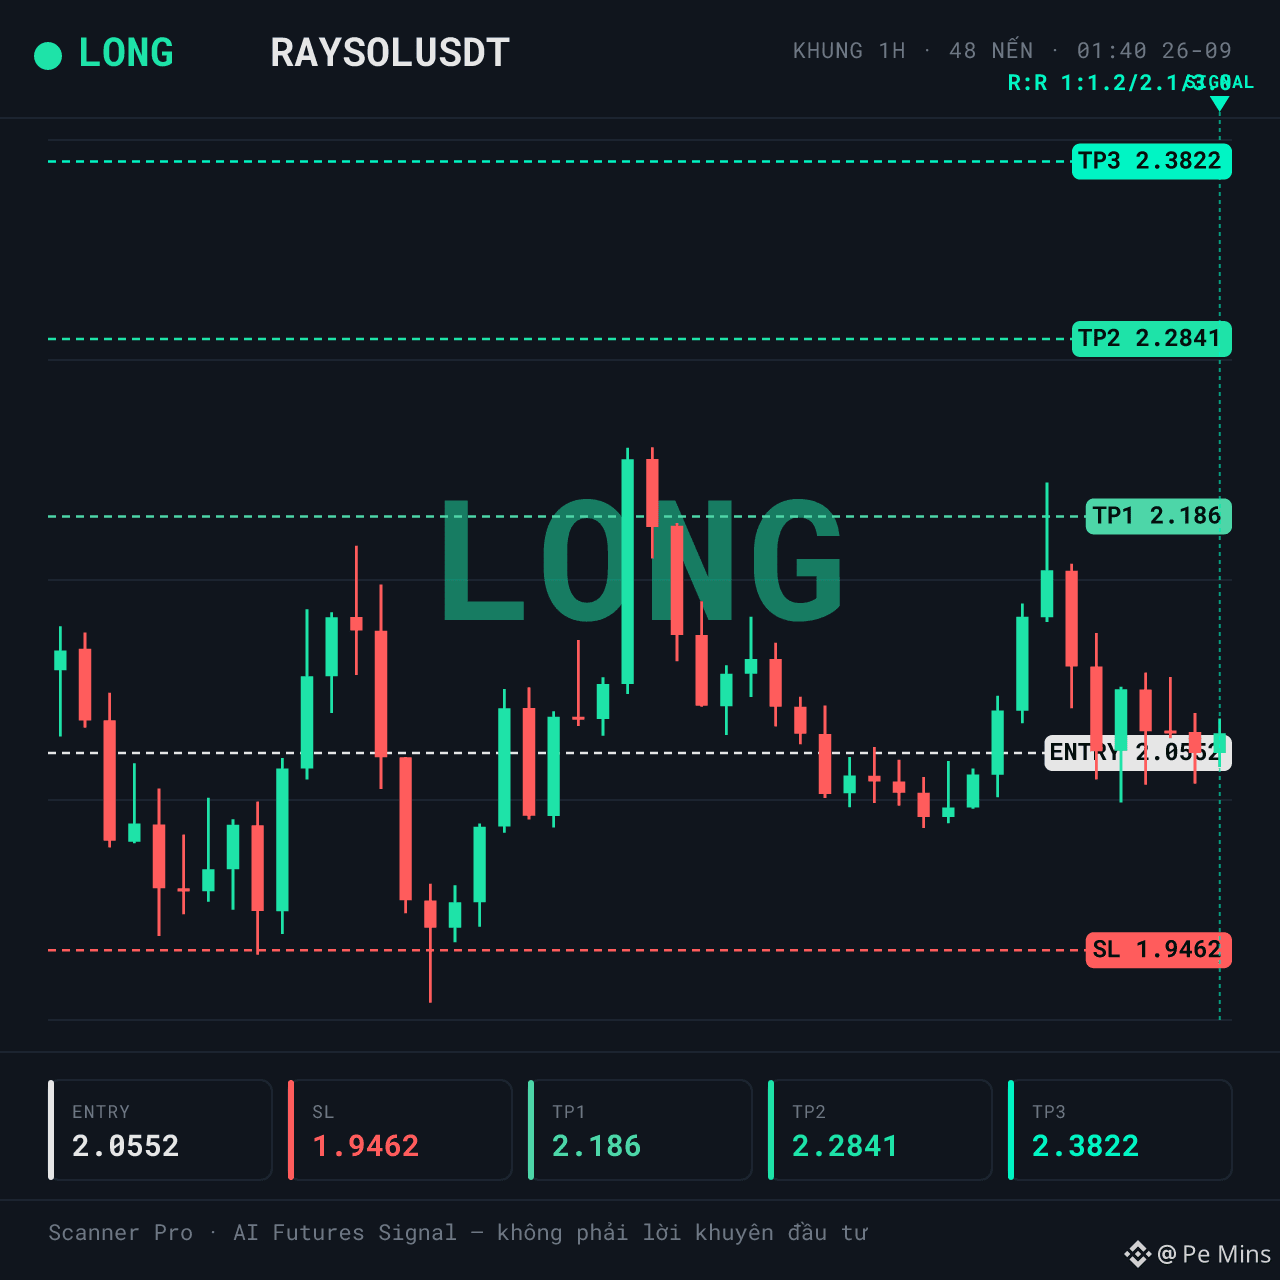
·
--
LONG $SUI | Volume spike 0.64x — is the capital waiting to enter or retreating?
🚨 AI TRADE ALERT — $SUI
🟢 LONG
📌 Entry: 1.121 – 1.1244
🛑 Stop Loss: 1.0659
🎯 Take Profit: 1.2932
⏰ Valid for: 6 hours (01:30 – 07:30 VN) - Date: 26/09
$SUI is being tracked by Scanner Pro with a LONG scenario when the price holds above the entry zone in the context of an uptrend. 24h volume is ~735.837.096 USDT with a spike ratio of 0.64x, positive funding of 0.0096% indicating that the longs are paying the fee.
📊 CONTEXT & DATA
Liquidity is high, with a 24h range of 14.5% — wide enough for fluctuations, but it also demands strict capital management. The most notable point is volume: the spike ratio is only 0.64x, meaning the current volume has not exceeded the average; the capital is not really making a strong entry yet.
Funding 0.0096% shows that the LONG side is paying for the SHORT side — the market leans long, and the crowd is aligned with this signal. The price position within the 24h range is 78%, meaning the price is in the upper part of the range.
🚫 INVALIDATION & RISK MANAGEMENT — $SUI
⚠️ The biggest drawback: the crowd is leaning in the SAME direction as LONG, and that very side is currently paying funding fees — this is a risk to monitor, not a confirmation signal. In addition, since the price is already at the high end of the 24h range, upside room is more limited.
🚫 The 1h momentum has heated up around 66.8 — no longer a buy-support point for the long scenario, while volume has not surged enough to confirm.
If price closes below the stop-loss level on the signal card, the current LONG scenario is no longer valid.
💡 What do you think: is this volume spike ratio of 0.64x a sign that the capital is waiting to accumulate, or gradually retreating from the high-price zone?
This is educational technical analysis content, not investment advice. Cryptocurrency trading carries high risk; you may lose all of your capital. Please do your own research and take responsibility for your decisions.
#Binance #Crypto #Futures
LONG $SUI | Volume spike 0.64x — is the capital waiting to enter or retreating?
🚨 AI TRADE ALERT — $SUI
🟢 LONG
📌 Entry: 1.121 – 1.1244
🛑 Stop Loss: 1.0659
🎯 Take Profit: 1.2932
⏰ Valid for: 6 hours (01:30 – 07:30 VN) - Date: 26/09
$SUI is being tracked by Scanner Pro with a LONG scenario when the price holds above the entry zone in the context of an uptrend. 24h volume is ~735.837.096 USDT with a spike ratio of 0.64x, positive funding of 0.0096% indicating that the longs are paying the fee.
📊 CONTEXT & DATA
Liquidity is high, with a 24h range of 14.5% — wide enough for fluctuations, but it also demands strict capital management. The most notable point is volume: the spike ratio is only 0.64x, meaning the current volume has not exceeded the average; the capital is not really making a strong entry yet.
Funding 0.0096% shows that the LONG side is paying for the SHORT side — the market leans long, and the crowd is aligned with this signal. The price position within the 24h range is 78%, meaning the price is in the upper part of the range.
🚫 INVALIDATION & RISK MANAGEMENT — $SUI
⚠️ The biggest drawback: the crowd is leaning in the SAME direction as LONG, and that very side is currently paying funding fees — this is a risk to monitor, not a confirmation signal. In addition, since the price is already at the high end of the 24h range, upside room is more limited.
🚫 The 1h momentum has heated up around 66.8 — no longer a buy-support point for the long scenario, while volume has not surged enough to confirm.
If price closes below the stop-loss level on the signal card, the current LONG scenario is no longer valid.
💡 What do you think: is this volume spike ratio of 0.64x a sign that the capital is waiting to accumulate, or gradually retreating from the high-price zone?
This is educational technical analysis content, not investment advice. Cryptocurrency trading carries high risk; you may lose all of your capital. Please do your own research and take responsibility for your decisions.
#Binance #Crypto #Futures
🚨 AI TRADE ALERT — $SUI
🟢 LONG
📌 Entry: 1.121 – 1.1244
🛑 Stop Loss: 1.0659
🎯 Take Profit: 1.2932
⏰ Valid for: 6 hours (01:30 – 07:30 VN) - Date: 26/09
$SUI is being tracked by Scanner Pro with a LONG scenario when the price holds above the entry zone in the context of an uptrend. 24h volume is ~735.837.096 USDT with a spike ratio of 0.64x, positive funding of 0.0096% indicating that the longs are paying the fee.
📊 CONTEXT & DATA
Liquidity is high, with a 24h range of 14.5% — wide enough for fluctuations, but it also demands strict capital management. The most notable point is volume: the spike ratio is only 0.64x, meaning the current volume has not exceeded the average; the capital is not really making a strong entry yet.
Funding 0.0096% shows that the LONG side is paying for the SHORT side — the market leans long, and the crowd is aligned with this signal. The price position within the 24h range is 78%, meaning the price is in the upper part of the range.
🚫 INVALIDATION & RISK MANAGEMENT — $SUI
⚠️ The biggest drawback: the crowd is leaning in the SAME direction as LONG, and that very side is currently paying funding fees — this is a risk to monitor, not a confirmation signal. In addition, since the price is already at the high end of the 24h range, upside room is more limited.
🚫 The 1h momentum has heated up around 66.8 — no longer a buy-support point for the long scenario, while volume has not surged enough to confirm.
If price closes below the stop-loss level on the signal card, the current LONG scenario is no longer valid.
💡 What do you think: is this volume spike ratio of 0.64x a sign that the capital is waiting to accumulate, or gradually retreating from the high-price zone?
This is educational technical analysis content, not investment advice. Cryptocurrency trading carries high risk; you may lose all of your capital. Please do your own research and take responsibility for your decisions.
#Binance #Crypto #Futures
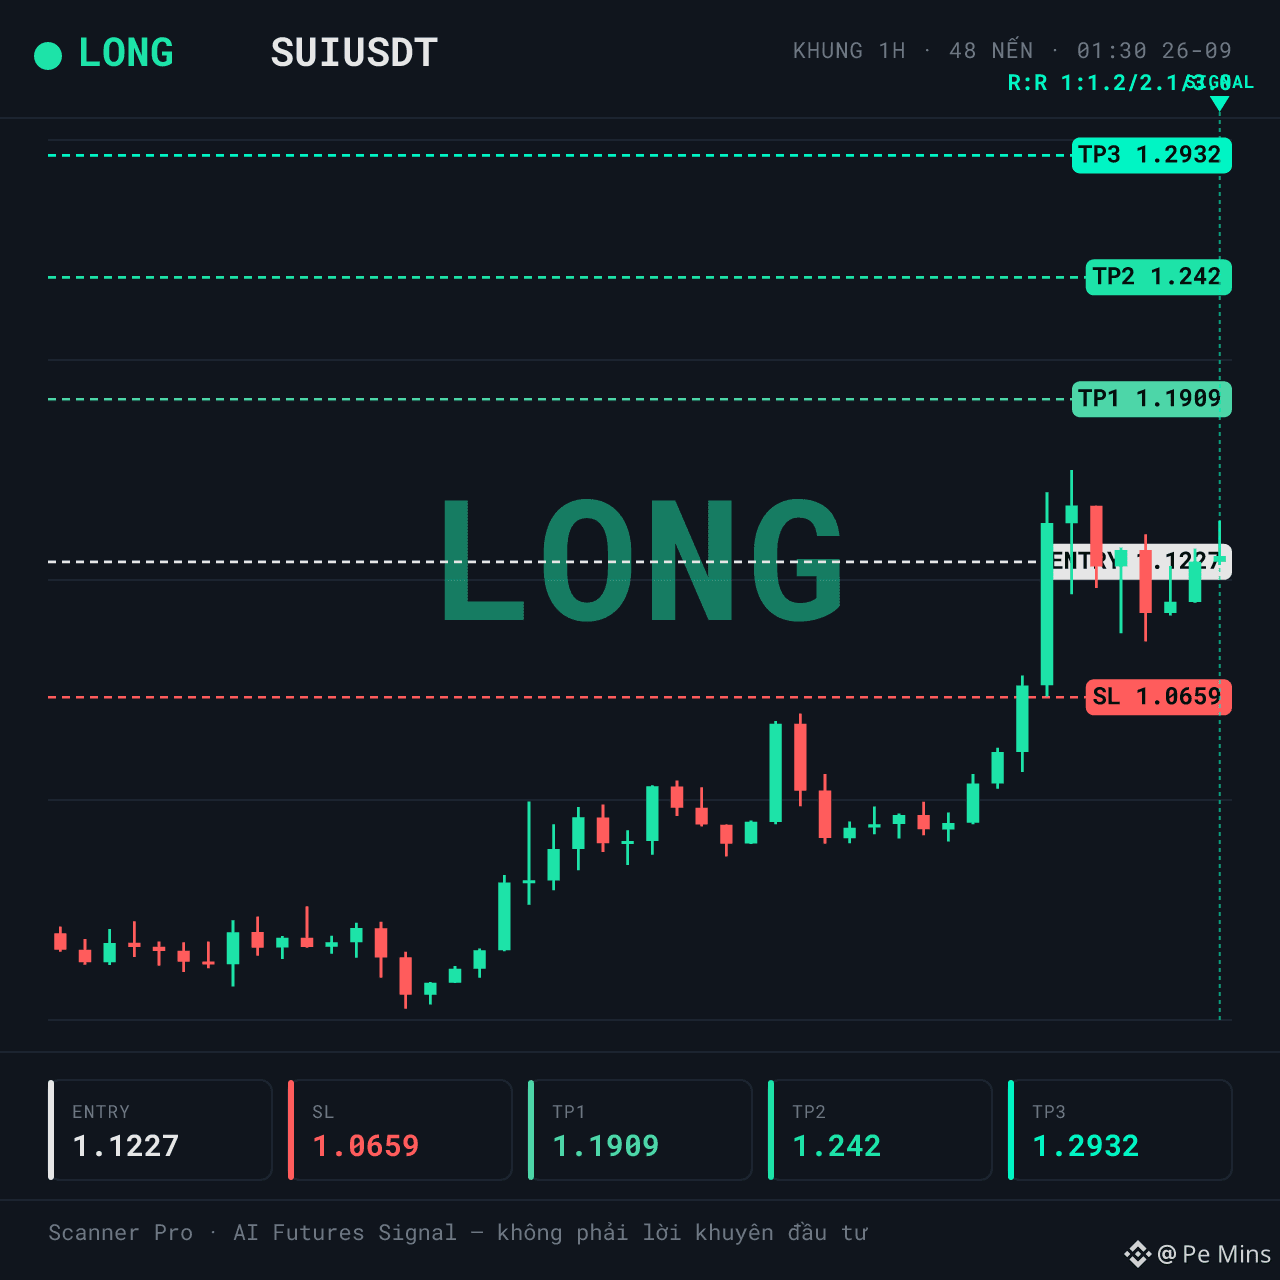
4
·
--
LONG $LYN | Volume is surging, but momentum is it heating up or cooling down?
🚨 AI TRADE ALERT — $LYN
🟢 LONG
📌 Entry: 0.07009 – 0.07031
🛑 Stop Loss: 0.06423
🎯 Take Profit: 0.0881
⏰ Valid for: 6 hours (00:25 – 06:25 VN) - Date: 26/09
$LYN is being monitored by Scanner Pro for a LONG setup after a breakout from the low-price zone. The 24h volume hit a spike level 18.45x higher than the average, while funding is slightly positive—suggesting buyers are paying the cost.
📊 WHAT DATA IS SHOWING
The most notable point is the money flow: 24h quote volume is around 54,897,175 USDT with a volume spike ratio of 18.45x—an unusually explosive surge, indicating liquidity is pouring in strongly. Funding at 0.0050% records that the LONG side is paying the SHORT side, meaning the market is leaning toward buyers.
In terms of structure, price is currently at 58% within the 24h range, with the fluctuation band reaching up to 60.6%—a wide volatility zone. The context is classified as an uptrend, but the reliability of this classification is not very high.
💡 SCENARIO & OPEN QUESTIONS — $LYN
⚠️ The biggest downside: the crowd is leaning in the SAME direction as the LONG signal, and this very side is also paying funding—an indication that the long positioning is already quite crowded. This requires close monitoring of adjustment risk. In addition, the momentum indicator on the 1h timeframe has climbed to 71.4, meaning momentum is heating up rather than being a supportive factor for chasing longs.
🚫 If price closes below the stop-loss level on the signal card, the current LONG scenario is no longer valid.
What do you think—this is real money flowing in, or just a short-term volume burst that needs more time for confirmation?
This is educational technical analysis content, not investment advice. Crypto trading carries high risk; you may lose all your capital. Do your own research and take responsibility for your decisions.
#Binance #Crypto #Futures
LONG $LYN | Volume is surging, but momentum is it heating up or cooling down?
🚨 AI TRADE ALERT — $LYN
🟢 LONG
📌 Entry: 0.07009 – 0.07031
🛑 Stop Loss: 0.06423
🎯 Take Profit: 0.0881
⏰ Valid for: 6 hours (00:25 – 06:25 VN) - Date: 26/09
$LYN is being monitored by Scanner Pro for a LONG setup after a breakout from the low-price zone. The 24h volume hit a spike level 18.45x higher than the average, while funding is slightly positive—suggesting buyers are paying the cost.
📊 WHAT DATA IS SHOWING
The most notable point is the money flow: 24h quote volume is around 54,897,175 USDT with a volume spike ratio of 18.45x—an unusually explosive surge, indicating liquidity is pouring in strongly. Funding at 0.0050% records that the LONG side is paying the SHORT side, meaning the market is leaning toward buyers.
In terms of structure, price is currently at 58% within the 24h range, with the fluctuation band reaching up to 60.6%—a wide volatility zone. The context is classified as an uptrend, but the reliability of this classification is not very high.
💡 SCENARIO & OPEN QUESTIONS — $LYN
⚠️ The biggest downside: the crowd is leaning in the SAME direction as the LONG signal, and this very side is also paying funding—an indication that the long positioning is already quite crowded. This requires close monitoring of adjustment risk. In addition, the momentum indicator on the 1h timeframe has climbed to 71.4, meaning momentum is heating up rather than being a supportive factor for chasing longs.
🚫 If price closes below the stop-loss level on the signal card, the current LONG scenario is no longer valid.
What do you think—this is real money flowing in, or just a short-term volume burst that needs more time for confirmation?
This is educational technical analysis content, not investment advice. Crypto trading carries high risk; you may lose all your capital. Do your own research and take responsibility for your decisions.
#Binance #Crypto #Futures
🚨 AI TRADE ALERT — $LYN
🟢 LONG
📌 Entry: 0.07009 – 0.07031
🛑 Stop Loss: 0.06423
🎯 Take Profit: 0.0881
⏰ Valid for: 6 hours (00:25 – 06:25 VN) - Date: 26/09
$LYN is being monitored by Scanner Pro for a LONG setup after a breakout from the low-price zone. The 24h volume hit a spike level 18.45x higher than the average, while funding is slightly positive—suggesting buyers are paying the cost.
📊 WHAT DATA IS SHOWING
The most notable point is the money flow: 24h quote volume is around 54,897,175 USDT with a volume spike ratio of 18.45x—an unusually explosive surge, indicating liquidity is pouring in strongly. Funding at 0.0050% records that the LONG side is paying the SHORT side, meaning the market is leaning toward buyers.
In terms of structure, price is currently at 58% within the 24h range, with the fluctuation band reaching up to 60.6%—a wide volatility zone. The context is classified as an uptrend, but the reliability of this classification is not very high.
💡 SCENARIO & OPEN QUESTIONS — $LYN
⚠️ The biggest downside: the crowd is leaning in the SAME direction as the LONG signal, and this very side is also paying funding—an indication that the long positioning is already quite crowded. This requires close monitoring of adjustment risk. In addition, the momentum indicator on the 1h timeframe has climbed to 71.4, meaning momentum is heating up rather than being a supportive factor for chasing longs.
🚫 If price closes below the stop-loss level on the signal card, the current LONG scenario is no longer valid.
What do you think—this is real money flowing in, or just a short-term volume burst that needs more time for confirmation?
This is educational technical analysis content, not investment advice. Crypto trading carries high risk; you may lose all your capital. Do your own research and take responsibility for your decisions.
#Binance #Crypto #Futures
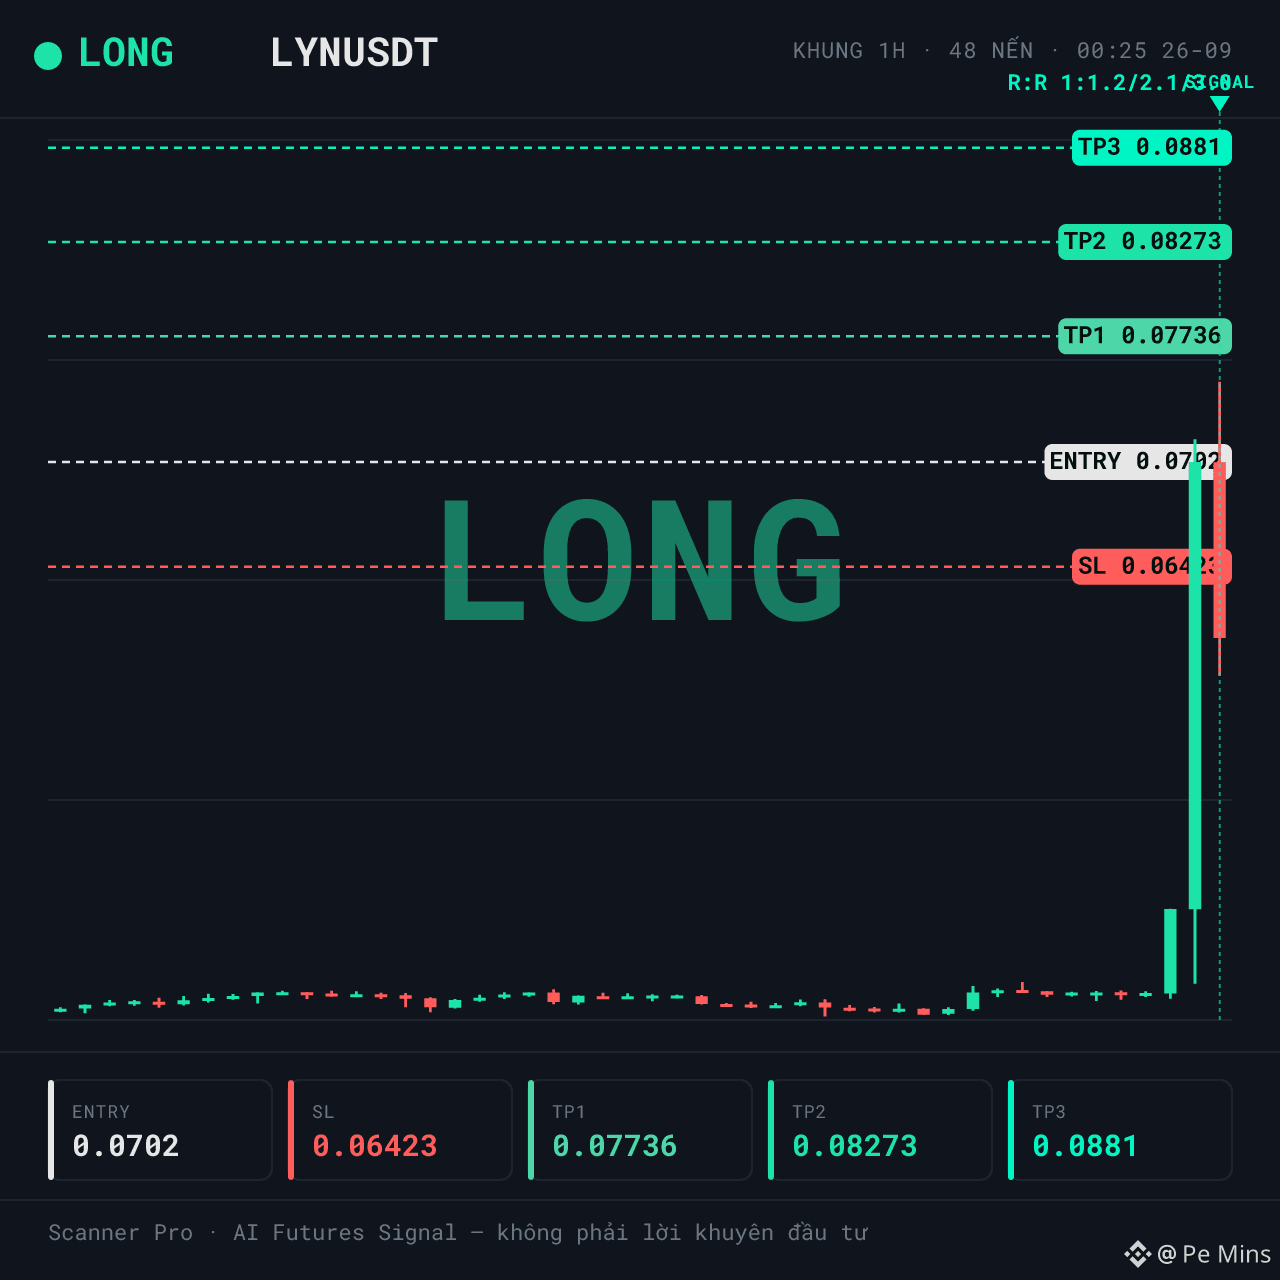
5
·
--
SHORT $4 | Price at the lower end of the 24h range, capital flow leaning long
🚨 AI TRADE ALERT — $4
🔴 SHORT
📌 Entry: 0.02219 – 0.02226
🛑 Stop Loss: 0.02338
🎯 Take Profit: 0.01876
⏰ Valid for: 6 hours (23:30 on 25/09 – 05:30 on 26/09, VN time)
$4 is being tracked by Scanner Pro for a SHORT scenario as the price shows weak reactions around the current zone. The overall context is neutral, and funding at 0.0317% suggests the LONG side is paying fees to the SHORT side.
📊 WHY IT’S WORTH NOTING
Liquidity is rated high: 24h quote volume is ~6,581,184 USDT, but the volume spike ratio is only 0.49x — the capital flow hasn’t truly exploded in any direction yet.
Funding 0.0317%: the LONG side is paying fees to the SHORT side, meaning the crowd is leaning in the direction opposite to this signal. This is supportive of the SHORT direction, but it’s also data that needs monitoring because crowd positioning can flip quickly.
⚠️ SETUP & RISK — $4
🚫 Biggest downside: price is currently at the lower end of the 24h range (about 20%), so additional downside room may be limited and it’s easier to encounter buy-the-dip reactions.
If price closes beyond the stop-loss level on the signal card, the current SHORT scenario is no longer valid.
In your view, does this indicate large money is distributing, or is it just a temporary correction?
This is educational technical analysis content, not investment advice. Crypto trading carries high risk; you could lose all of your capital. Do your own research and take responsibility for your decisions.
#Binance #Crypto #Futures
SHORT $4 | Price at the lower end of the 24h range, capital flow leaning long
🚨 AI TRADE ALERT — $4
🔴 SHORT
📌 Entry: 0.02219 – 0.02226
🛑 Stop Loss: 0.02338
🎯 Take Profit: 0.01876
⏰ Valid for: 6 hours (23:30 on 25/09 – 05:30 on 26/09, VN time)
$4 is being tracked by Scanner Pro for a SHORT scenario as the price shows weak reactions around the current zone. The overall context is neutral, and funding at 0.0317% suggests the LONG side is paying fees to the SHORT side.
📊 WHY IT’S WORTH NOTING
Liquidity is rated high: 24h quote volume is ~6,581,184 USDT, but the volume spike ratio is only 0.49x — the capital flow hasn’t truly exploded in any direction yet.
Funding 0.0317%: the LONG side is paying fees to the SHORT side, meaning the crowd is leaning in the direction opposite to this signal. This is supportive of the SHORT direction, but it’s also data that needs monitoring because crowd positioning can flip quickly.
⚠️ SETUP & RISK — $4
🚫 Biggest downside: price is currently at the lower end of the 24h range (about 20%), so additional downside room may be limited and it’s easier to encounter buy-the-dip reactions.
If price closes beyond the stop-loss level on the signal card, the current SHORT scenario is no longer valid.
In your view, does this indicate large money is distributing, or is it just a temporary correction?
This is educational technical analysis content, not investment advice. Crypto trading carries high risk; you could lose all of your capital. Do your own research and take responsibility for your decisions.
#Binance #Crypto #Futures
🚨 AI TRADE ALERT — $4
🔴 SHORT
📌 Entry: 0.02219 – 0.02226
🛑 Stop Loss: 0.02338
🎯 Take Profit: 0.01876
⏰ Valid for: 6 hours (23:30 on 25/09 – 05:30 on 26/09, VN time)
$4 is being tracked by Scanner Pro for a SHORT scenario as the price shows weak reactions around the current zone. The overall context is neutral, and funding at 0.0317% suggests the LONG side is paying fees to the SHORT side.
📊 WHY IT’S WORTH NOTING
Liquidity is rated high: 24h quote volume is ~6,581,184 USDT, but the volume spike ratio is only 0.49x — the capital flow hasn’t truly exploded in any direction yet.
Funding 0.0317%: the LONG side is paying fees to the SHORT side, meaning the crowd is leaning in the direction opposite to this signal. This is supportive of the SHORT direction, but it’s also data that needs monitoring because crowd positioning can flip quickly.
⚠️ SETUP & RISK — $4
🚫 Biggest downside: price is currently at the lower end of the 24h range (about 20%), so additional downside room may be limited and it’s easier to encounter buy-the-dip reactions.
If price closes beyond the stop-loss level on the signal card, the current SHORT scenario is no longer valid.
In your view, does this indicate large money is distributing, or is it just a temporary correction?
This is educational technical analysis content, not investment advice. Crypto trading carries high risk; you could lose all of your capital. Do your own research and take responsibility for your decisions.
#Binance #Crypto #Futures
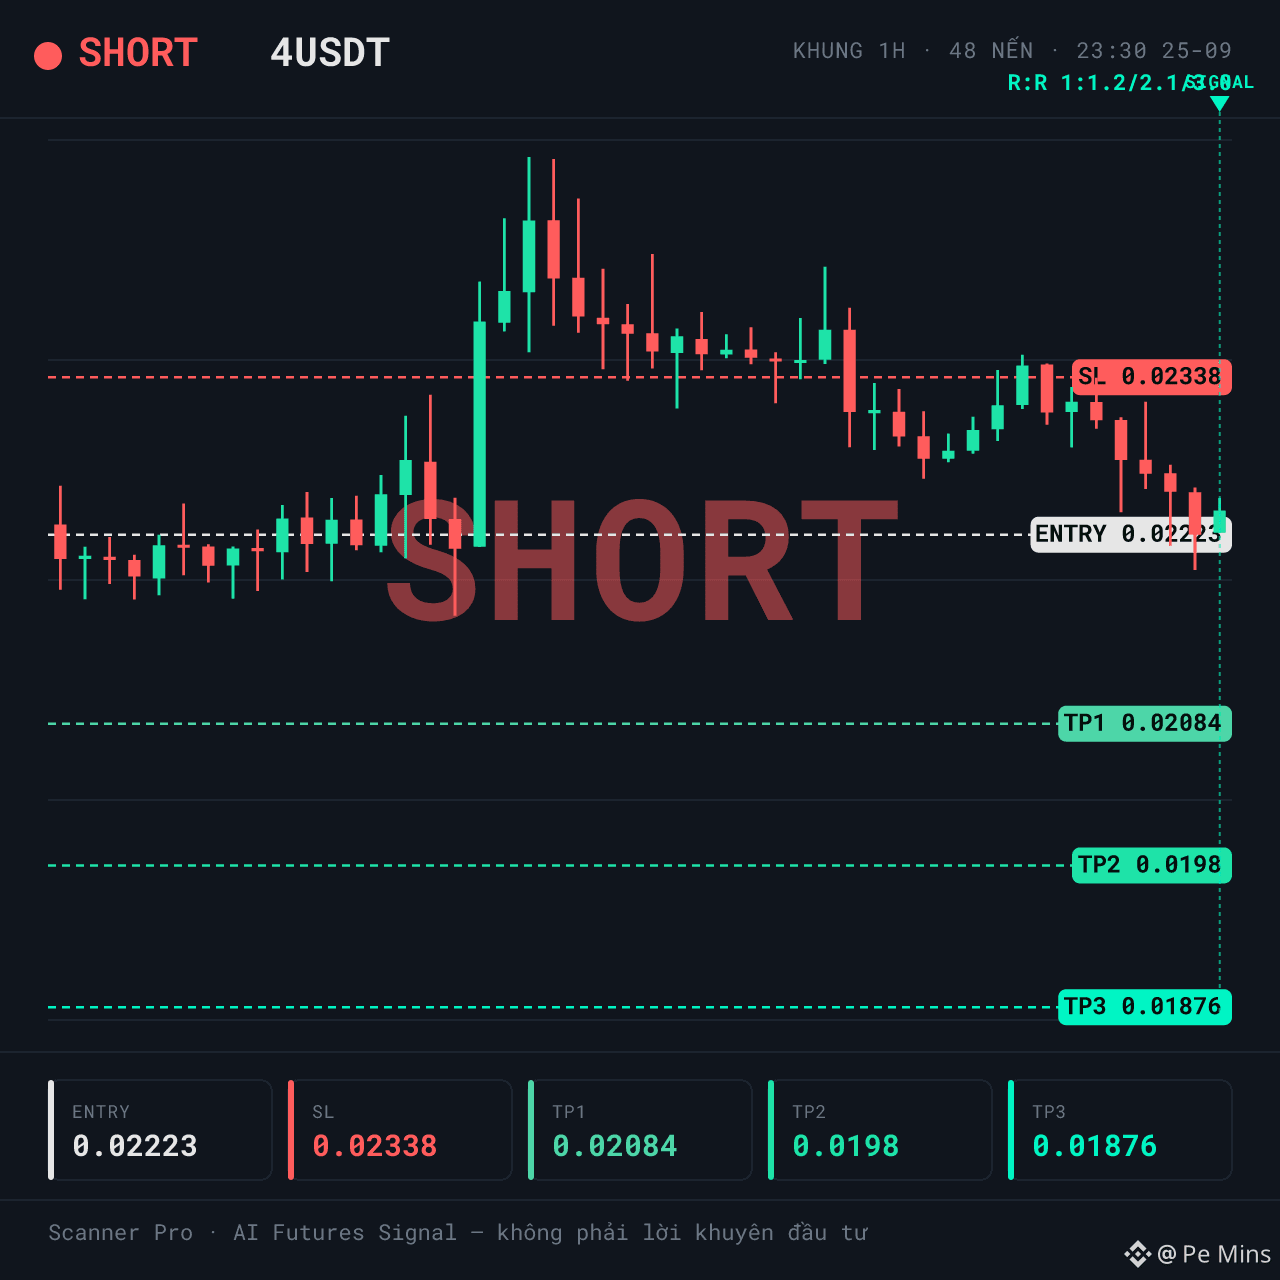
7
Log in to explore more content
Join global crypto users on Binance Square
⚡️ Get latest and useful information about crypto.
💬 Trusted by the world’s largest crypto exchange.
👍 Discover real insights from verified creators.
Email / Phone number
Trending Topics
CircleMints500MUSDCOnSolana
17,187 views
616 Discussing
#circlemints500musdconsolana
🚨 HUGE Liquidity Boost! Circle Mints $500 Million USDC on Solana — Is a Massive DeFi Rally Next? 🚀
💵 What Happened?
In a major on-chain event, the USDC Treasury issued $500 million in USDC directly on the Solana network across two $250M transactions.
This massive influx of real-fiat-backed capital highlights a growing appetite for stablecoins in high-speed, low-cost ecosystems.
🔑 Key Takeaways & Headlines
Fresh On-Chain Liquidity: Freshly minted USDC boosts liquidity pools across Solana-based DEXs, lending markets, and yield protocols.
$SOL
Institutional Signal: Because every USDC is backed 1:1 by real reserves, large minting events reflect actual institutional or commercial capital entering the ecosystem.
Solana’s Market Share Expansion: Solana continues to capture an increasing share of total USDC circulation, threatening traditional stablecoin market distributions.
Macro & Fed Context: As traders monitor global macroeconomic developments and interest rate outlooks, high-yield on-chain opportunities attract resting capital back to Web3.
💡 Why It Matters for Traders
Lower Slippage & Better Swaps: Higher stablecoin depth means larger trades can occur without heavy market impact.
DeFi Yield Potential: Increased USDC reserves encourage higher TVL (Total Value Locked) in Solana lending and farming protocols.
Sentiment Shift: Massive stablecoin injections are historically bullish indicators for ecosystem tokens ($SOL,$JUP, $RAY,$KMNO).
What’s your play? Are you keeping cash on the sidelines or riding the Solana liquidity wave? Drop your thoughts below! 👇
#BlackRockBuildsTokenizedPortfoliosForOndo #solana #defi
Lily星星
·4 Likes
·2.6k views
PolymarketBankFailureBetsDrawFDICConcern
32,683 views
809 Discussing
BlackRockBuildsTokenizedPortfoliosForOndo
26,440 views
549 Discussing