
sultan al-mansori
40 Posts

sultan al-mansori
Report
Block User
Occasional Trader
7.6 Months
48 Following
19 Followers
53 Liked
Posts
All
Quotes
Videos
🚨 The resistance level has been broken! Should you enter the trade right away or wait?
Many traders rush into a trade after a breakout, only to be surprised by a price reversal! 📉
In this video, you’ll learn: 📊 How to identify a real breakout. 🎯 How to wait for a retest. 📈 How to determine your entry point. 🛑 Where to place your stop loss. 💰 And how to set your take-profit target.
Watch BTC, ETH, and BNB, and apply the steps yourself.
💬 A question for you: Do you prefer entering right after a breakout or waiting for a retest?
❤️ Enjoyed the explanation? Support us with a like and a follow—the next one will be even better!
#Bitcoin #BTC #ETH #BNB #Crypto #Binance #Trading
🚨 The resistance level has been broken! Should you enter the trade right away or wait?
Many traders rush into a trade after a breakout, only to be surprised by a price reversal! 📉
In this video, you’ll learn: 📊 How to identify a real breakout. 🎯 How to wait for a retest. 📈 How to determine your entry point. 🛑 Where to place your stop loss. 💰 And how to set your take-profit target.
Watch BTC, ETH, and BNB, and apply the steps yourself.
💬 A question for you: Do you prefer entering right after a breakout or waiting for a retest?
❤️ Enjoyed the explanation? Support us with a like and a follow—the next one will be even better!
#Bitcoin #BTC #ETH #BNB #Crypto #Binance #Trading
Many traders rush into a trade after a breakout, only to be surprised by a price reversal! 📉
In this video, you’ll learn: 📊 How to identify a real breakout. 🎯 How to wait for a retest. 📈 How to determine your entry point. 🛑 Where to place your stop loss. 💰 And how to set your take-profit target.
Watch BTC, ETH, and BNB, and apply the steps yourself.
💬 A question for you: Do you prefer entering right after a breakout or waiting for a retest?
❤️ Enjoyed the explanation? Support us with a like and a follow—the next one will be even better!
#Bitcoin #BTC #ETH #BNB #Crypto #Binance #Trading
3
3
1.2k
📊 Want to understand market movements and identify trading opportunities more accurately?
In this guide, we explore 5 important strategies using moving averages: 📈 Moving average crossover (50/200). 📈 Moving average ribbon. 📈 Moving average envelopes. 📈 MACD indicator. 📈 Dynamic support and resistance.
Learn how to spot uptrends and downtrends, identify buy and sell signals, and recognize support and resistance zones.
🔥 Which strategy do you rely on most in your trading? And do you use EMA or SMA?
💬 Share your thoughts in the comments, hit like 👍 and follow the account for more technical analysis insights.
Keep an eye on BTC, ETH, BNB and SOL, and don’t forget to manage your risk before every trade.
#Bitcoin #BTC #ETH #BNB #SOL
📊 Want to understand market movements and identify trading opportunities more accurately?
In this guide, we explore 5 important strategies using moving averages: 📈 Moving average crossover (50/200). 📈 Moving average ribbon. 📈 Moving average envelopes. 📈 MACD indicator. 📈 Dynamic support and resistance.
Learn how to spot uptrends and downtrends, identify buy and sell signals, and recognize support and resistance zones.
🔥 Which strategy do you rely on most in your trading? And do you use EMA or SMA?
💬 Share your thoughts in the comments, hit like 👍 and follow the account for more technical analysis insights.
Keep an eye on BTC, ETH, BNB and SOL, and don’t forget to manage your risk before every trade.
#Bitcoin #BTC #ETH #BNB #SOL
In this guide, we explore 5 important strategies using moving averages: 📈 Moving average crossover (50/200). 📈 Moving average ribbon. 📈 Moving average envelopes. 📈 MACD indicator. 📈 Dynamic support and resistance.
Learn how to spot uptrends and downtrends, identify buy and sell signals, and recognize support and resistance zones.
🔥 Which strategy do you rely on most in your trading? And do you use EMA or SMA?
💬 Share your thoughts in the comments, hit like 👍 and follow the account for more technical analysis insights.
Keep an eye on BTC, ETH, BNB and SOL, and don’t forget to manage your risk before every trade.
#Bitcoin #BTC #ETH #BNB #SOL
1
107
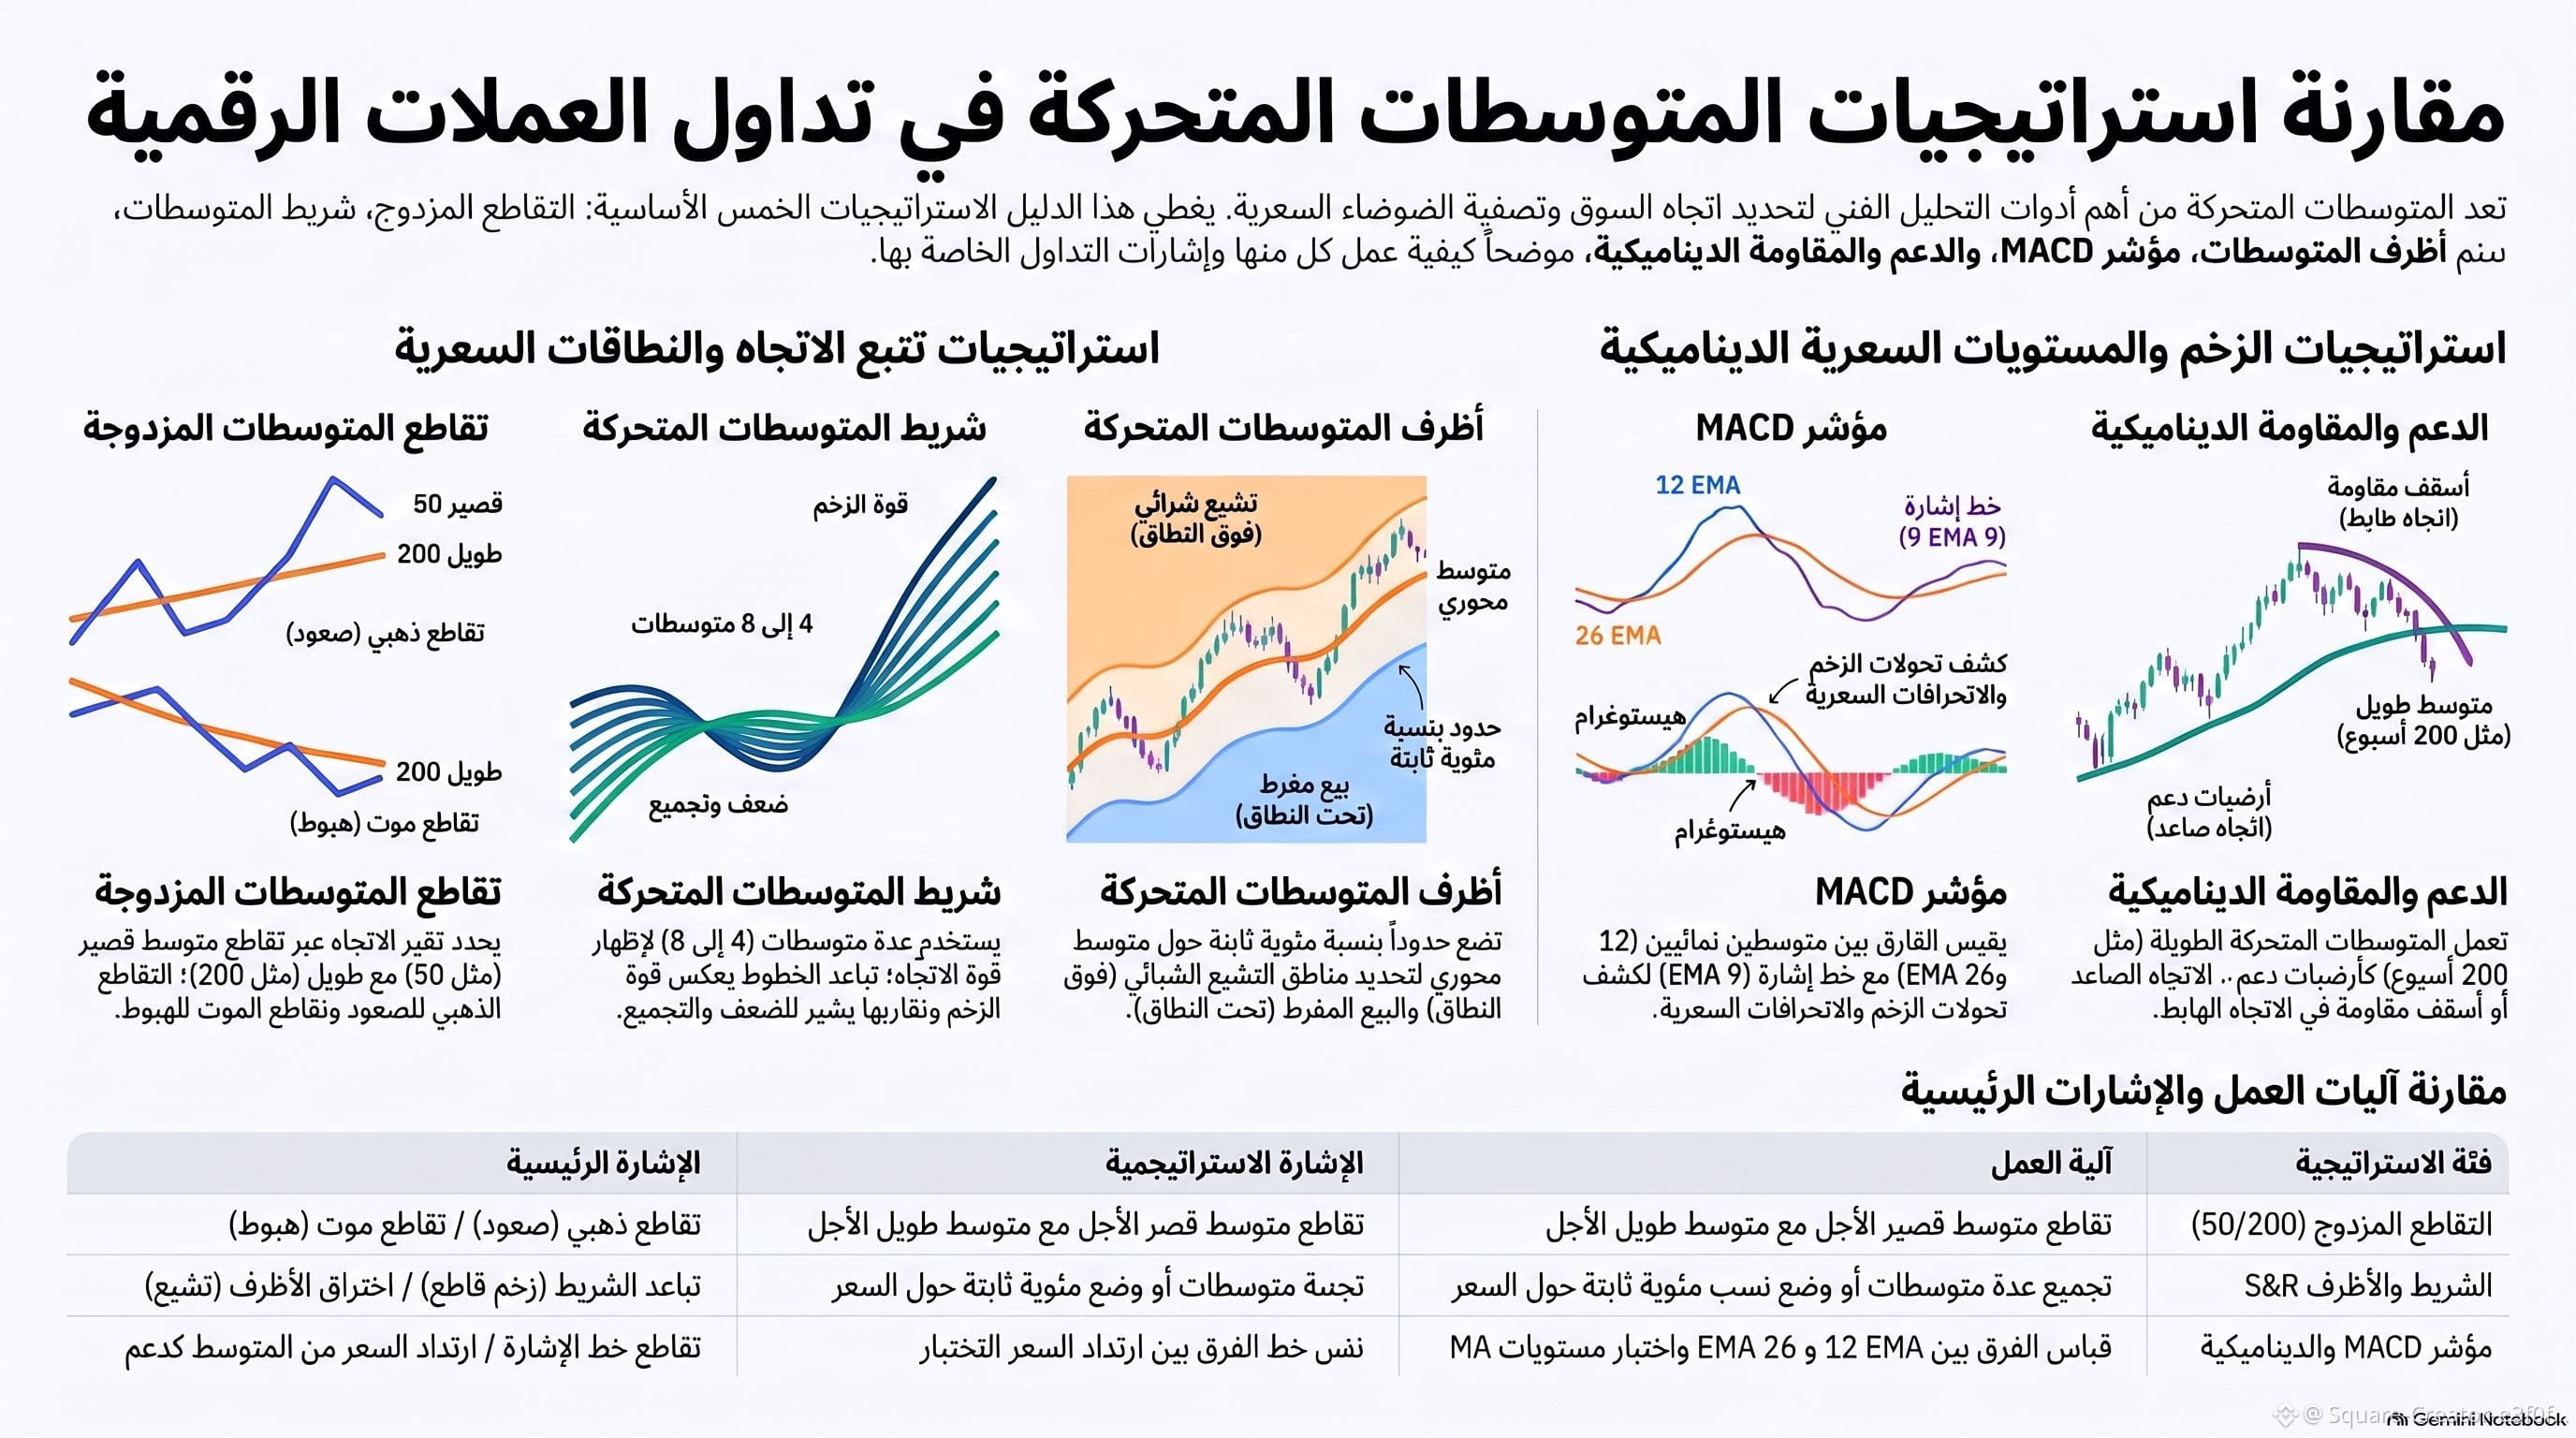
📊 Do you know how to use moving averages to spot trading opportunities?
Moving averages are more than just lines on a chart—they’re tools that help you understand market trends and identify potential entry and exit points. 📈
In this guide, you’ll learn about 5 important strategies: 🔹 Moving average crossover (50/200). 🔹 Moving average ribbon. 🔹 Moving average envelopes. 🔹 MACD indicator. 🔹 Dynamic support and resistance.
💡 Remember: Don’t rely on a single indicator to make trading decisions. Instead, combine trend direction, price action, trading volume, and risk management.
🔥 Which strategy do you use most when trading BTC, ETH, BNB, and SOL?
💬 Share your thoughts in the comments, and don’t forget to like 👍 and follow for more educational guides and analysis.
#Bitcoin #BTC #Ethereum #ETH #BNB #SOL #Crypto #Trading #BinanceSquare
📊 Do you know how to use moving averages to spot trading opportunities?
Moving averages are more than just lines on a chart—they’re tools that help you understand market trends and identify potential entry and exit points. 📈
In this guide, you’ll learn about 5 important strategies: 🔹 Moving average crossover (50/200). 🔹 Moving average ribbon. 🔹 Moving average envelopes. 🔹 MACD indicator. 🔹 Dynamic support and resistance.
💡 Remember: Don’t rely on a single indicator to make trading decisions. Instead, combine trend direction, price action, trading volume, and risk management.
🔥 Which strategy do you use most when trading BTC, ETH, BNB, and SOL?
💬 Share your thoughts in the comments, and don’t forget to like 👍 and follow for more educational guides and analysis.
#Bitcoin #BTC #Ethereum #ETH #BNB #SOL #Crypto #Trading #BinanceSquare
Moving averages are more than just lines on a chart—they’re tools that help you understand market trends and identify potential entry and exit points. 📈
In this guide, you’ll learn about 5 important strategies: 🔹 Moving average crossover (50/200). 🔹 Moving average ribbon. 🔹 Moving average envelopes. 🔹 MACD indicator. 🔹 Dynamic support and resistance.
💡 Remember: Don’t rely on a single indicator to make trading decisions. Instead, combine trend direction, price action, trading volume, and risk management.
🔥 Which strategy do you use most when trading BTC, ETH, BNB, and SOL?
💬 Share your thoughts in the comments, and don’t forget to like 👍 and follow for more educational guides and analysis.
#Bitcoin #BTC #Ethereum #ETH #BNB #SOL #Crypto #Trading #BinanceSquare
1
166
🐋 Can you spot whale movements before the price moves?
Crypto whales can influence the crypto market, but how can we spot their activity?
📊 Watch for these signals:
🔹 Unusual spikes in trading volume.
🔹 Accumulation.
🔹 Price movement compared with trading volume.
🔹 Areas of buying and selling activity.
Watch BTC, ETH, and SOL, and learn to read the market more intelligently.
💬 Do you think trading volume reveals whale movements?
❤️ Enjoyed the explanation? Show your support with a like and follow us for more technical analysis secrets.
#Bitcoin #BTC #ETH #SOL #Crypto #Binance #Trading
🐋 Can you spot whale movements before the price moves?
Crypto whales can influence the crypto market, but how can we spot their activity?
📊 Watch for these signals:
🔹 Unusual spikes in trading volume.
🔹 Accumulation.
🔹 Price movement compared with trading volume.
🔹 Areas of buying and selling activity.
Watch BTC, ETH, and SOL, and learn to read the market more intelligently.
💬 Do you think trading volume reveals whale movements?
❤️ Enjoyed the explanation? Show your support with a like and follow us for more technical analysis secrets.
#Bitcoin #BTC #ETH #SOL #Crypto #Binance #Trading
Crypto whales can influence the crypto market, but how can we spot their activity?
📊 Watch for these signals:
🔹 Unusual spikes in trading volume.
🔹 Accumulation.
🔹 Price movement compared with trading volume.
🔹 Areas of buying and selling activity.
Watch BTC, ETH, and SOL, and learn to read the market more intelligently.
💬 Do you think trading volume reveals whale movements?
❤️ Enjoyed the explanation? Show your support with a like and follow us for more technical analysis secrets.
#Bitcoin #BTC #ETH #SOL #Crypto #Binance #Trading
2
157
🚨 Is the market tricking you before moving in its true direction?
🐂 Bull Trap: A fake breakout above resistance that prompts traders to buy before the price drops.
🐻 Bear Trap: A fake breakdown below support that prompts traders to sell before the price rises.
📊 How can you spot these traps and avoid entering at the wrong time?
Watch the video to the end!
💬 Which have you fallen for before: a bull trap or a bear trap?
❤️ Enjoyed the explanation? Support us with a like and follow us for more technical analysis secrets.
#Bitcoin #BTC #ETH #BNB #Crypto #Trading #Binance
🚨 Is the market tricking you before moving in its true direction?
🐂 Bull Trap: A fake breakout above resistance that prompts traders to buy before the price drops.
🐻 Bear Trap: A fake breakdown below support that prompts traders to sell before the price rises.
📊 How can you spot these traps and avoid entering at the wrong time?
Watch the video to the end!
💬 Which have you fallen for before: a bull trap or a bear trap?
❤️ Enjoyed the explanation? Support us with a like and follow us for more technical analysis secrets.
#Bitcoin #BTC #ETH #BNB #Crypto #Trading #Binance
🐂 Bull Trap: A fake breakout above resistance that prompts traders to buy before the price drops.
🐻 Bear Trap: A fake breakdown below support that prompts traders to sell before the price rises.
📊 How can you spot these traps and avoid entering at the wrong time?
Watch the video to the end!
💬 Which have you fallen for before: a bull trap or a bear trap?
❤️ Enjoyed the explanation? Support us with a like and follow us for more technical analysis secrets.
#Bitcoin #BTC #ETH #BNB #Crypto #Trading #Binance
2
1.2k
🚨 False Breakout | A trap that catches many traders!
Have you ever seen the price break through resistance, entered a buy trade, and then been surprised when it dropped? 📉
This is called a false breakout! It happens when the price moves beyond a support or resistance level, then quickly returns to the previous range.
🔍 How can you spot one?
📊 Watch trading volume (Volume).
📈 Wait for the candle to close for confirmation.
🎯 Watch for a retest of the level (Retest).
🔥 Follow along to learn how to avoid falling into this trap!
💬 Have you ever been fooled by a false breakout?
❤️ Enjoyed the content? Support us by liking and following.
#Bitcoin #BTC #ETH #BNB #Crypto #Binance #Trading
🚨 False Breakout | A trap that catches many traders!
Have you ever seen the price break through resistance, entered a buy trade, and then been surprised when it dropped? 📉
This is called a false breakout! It happens when the price moves beyond a support or resistance level, then quickly returns to the previous range.
🔍 How can you spot one?
📊 Watch trading volume (Volume).
📈 Wait for the candle to close for confirmation.
🎯 Watch for a retest of the level (Retest).
🔥 Follow along to learn how to avoid falling into this trap!
💬 Have you ever been fooled by a false breakout?
❤️ Enjoyed the content? Support us by liking and following.
#Bitcoin #BTC #ETH #BNB #Crypto #Binance #Trading
Have you ever seen the price break through resistance, entered a buy trade, and then been surprised when it dropped? 📉
This is called a false breakout! It happens when the price moves beyond a support or resistance level, then quickly returns to the previous range.
🔍 How can you spot one?
📊 Watch trading volume (Volume).
📈 Wait for the candle to close for confirmation.
🎯 Watch for a retest of the level (Retest).
🔥 Follow along to learn how to avoid falling into this trap!
💬 Have you ever been fooled by a false breakout?
❤️ Enjoyed the content? Support us by liking and following.
#Bitcoin #BTC #ETH #BNB #Crypto #Binance #Trading
5
7k
📊 How do you identify support and resistance? 📈
Want to know where the price might bounce on the chart? 🎯
In this video, you'll learn:
🔹 Support: An area where the price may bounce upward.
🔹 Resistance: An area where the price may reverse downward.
🔹 How to identify areas where price has repeatedly bounced.
🔹 How to use candlesticks and trading volume to confirm signals.
🔥 Try it yourself with BTC, ETH, and SOL, and watch the price action!
💬 What tool do you rely on to confirm a bounce?
❤️ Enjoyed the explanation? Like and follow me for more technical analysis lessons.
⚠️ A bounce is never guaranteed, and risk management is the foundation of trading.
#Binance #Bitcoin #Crypto #Trading #الدعم_والمقاومة
📊 How do you identify support and resistance? 📈
Want to know where the price might bounce on the chart? 🎯
In this video, you'll learn:
🔹 Support: An area where the price may bounce upward.
🔹 Resistance: An area where the price may reverse downward.
🔹 How to identify areas where price has repeatedly bounced.
🔹 How to use candlesticks and trading volume to confirm signals.
🔥 Try it yourself with BTC, ETH, and SOL, and watch the price action!
💬 What tool do you rely on to confirm a bounce?
❤️ Enjoyed the explanation? Like and follow me for more technical analysis lessons.
⚠️ A bounce is never guaranteed, and risk management is the foundation of trading.
#Binance #Bitcoin #Crypto #Trading #الدعم_والمقاومة
Want to know where the price might bounce on the chart? 🎯
In this video, you'll learn:
🔹 Support: An area where the price may bounce upward.
🔹 Resistance: An area where the price may reverse downward.
🔹 How to identify areas where price has repeatedly bounced.
🔹 How to use candlesticks and trading volume to confirm signals.
🔥 Try it yourself with BTC, ETH, and SOL, and watch the price action!
💬 What tool do you rely on to confirm a bounce?
❤️ Enjoyed the explanation? Like and follow me for more technical analysis lessons.
⚠️ A bounce is never guaranteed, and risk management is the foundation of trading.
#Binance #Bitcoin #Crypto #Trading #الدعم_والمقاومة
1
180
📊🔍 How does the NVT indicator reveal the true value of cryptocurrencies?
Did you know that Bitcoin’s price alone isn’t enough to tell whether the market is overvalued? 🤔
In this video, we explore the NVT indicator and how it helps us compare a coin’s market value with the transaction volume on its network, to spot potential signs of overvaluation or undervaluation.
🔥 Do you use NVT in your cryptocurrency analysis?
💬 Share your thoughts in the comments!
❤️ Enjoyed the content? Like and follow me for more analysis insights.
#BTC #Bitcoin #Crypto #NVT #Binance #Technical_Analysis
📊🔍 How does the NVT indicator reveal the true value of cryptocurrencies?
Did you know that Bitcoin’s price alone isn’t enough to tell whether the market is overvalued? 🤔
In this video, we explore the NVT indicator and how it helps us compare a coin’s market value with the transaction volume on its network, to spot potential signs of overvaluation or undervaluation.
🔥 Do you use NVT in your cryptocurrency analysis?
💬 Share your thoughts in the comments!
❤️ Enjoyed the content? Like and follow me for more analysis insights.
#BTC #Bitcoin #Crypto #NVT #Binance #Technical_Analysis
Did you know that Bitcoin’s price alone isn’t enough to tell whether the market is overvalued? 🤔
In this video, we explore the NVT indicator and how it helps us compare a coin’s market value with the transaction volume on its network, to spot potential signs of overvaluation or undervaluation.
🔥 Do you use NVT in your cryptocurrency analysis?
💬 Share your thoughts in the comments!
❤️ Enjoyed the content? Like and follow me for more analysis insights.
#BTC #Bitcoin #Crypto #NVT #Binance #Technical_Analysis
1
201
🔥 Bullish Engulfing 📈
How can a single bullish candle engulf the previous bearish candle? And what does it tell us about market movement?
In this video, we’ll learn:
📌 How the Bullish Engulfing pattern forms.
📌 What it says about buyers’ strength.
📌 When it may signal a potential reversal from bearish to bullish.
📌 And how to confirm the signal before making a trading decision.
🚀 Do you think this pattern is a buying opportunity, or does it need confirmation?
❤️ Like this post and follow the account for more secrets of technical analysis and Japanese candlesticks.
💬 Share your thoughts in the comments!
#BTC #ETH #BNB #SOL #XRP #Bitcoin #Crypto #Binance #BullishEngulfing #التحليل_الفني
🔥 Bullish Engulfing 📈
How can a single bullish candle engulf the previous bearish candle? And what does it tell us about market movement?
In this video, we’ll learn:
📌 How the Bullish Engulfing pattern forms.
📌 What it says about buyers’ strength.
📌 When it may signal a potential reversal from bearish to bullish.
📌 And how to confirm the signal before making a trading decision.
🚀 Do you think this pattern is a buying opportunity, or does it need confirmation?
❤️ Like this post and follow the account for more secrets of technical analysis and Japanese candlesticks.
💬 Share your thoughts in the comments!
#BTC #ETH #BNB #SOL #XRP #Bitcoin #Crypto #Binance #BullishEngulfing #التحليل_الفني
How can a single bullish candle engulf the previous bearish candle? And what does it tell us about market movement?
In this video, we’ll learn:
📌 How the Bullish Engulfing pattern forms.
📌 What it says about buyers’ strength.
📌 When it may signal a potential reversal from bearish to bullish.
📌 And how to confirm the signal before making a trading decision.
🚀 Do you think this pattern is a buying opportunity, or does it need confirmation?
❤️ Like this post and follow the account for more secrets of technical analysis and Japanese candlesticks.
💬 Share your thoughts in the comments!
#BTC #ETH #BNB #SOL #XRP #Bitcoin #Crypto #Binance #BullishEngulfing #التحليل_الفني
2
169

Article
🔥 The mistake that could make you lose money trading cryptocurrency! 📉
Have you ever bought a coin after a green candle appeared,🔥 The mistake that could make you lose money trading cryptocurrency! 📉
Have you ever bought a coin after a green candle appeared, only for the price to drop against your expectations? 😱
🕯️ 3 mistakes traders make:
1️⃣ Entering after a Hammer candle appears without waiting for confirmation.
2️⃣ Ignoring support and resistance levels.
3️⃣ Neglecting trading volume and market direction.
🔥 The mistake that could make you lose money trading cryptocurrency! 📉 Have you ever bought a coin after a green candle appeared,
🔥 The mistake that could make you lose money trading cryptocurrency! 📉
Have you ever bought a coin after a green candle appeared, only for the price to drop against your expectations? 😱
🕯️ 3 mistakes traders make:
1️⃣ Entering after a Hammer candle appears without waiting for confirmation.
2️⃣ Ignoring support and resistance levels.
3️⃣ Neglecting trading volume and market direction.
Have you ever bought a coin after a green candle appeared, only for the price to drop against your expectations? 😱
🕯️ 3 mistakes traders make:
1️⃣ Entering after a Hammer candle appears without waiting for confirmation.
2️⃣ Ignoring support and resistance levels.
3️⃣ Neglecting trading volume and market direction.
1
49
🌅⭐ Morning Star and Evening Star 🌆📊
Can you spot a trend reversal using 3 Japanese candlesticks? 🔥
📈 Morning Star: May indicate a reversal from a downtrend to an uptrend.
📉 Evening Star: May indicate a reversal from an uptrend to a downtrend.
🎯 Learn to read these patterns and confirm them before making a trading decision!
Watch for them on BTC, ETH, BNB, SOL, and XRP 🚀
❤️ Like this content? Tap Like 👍
🔔 Follow me for more trading secrets.
💬 Which pattern do you prefer?
#BinanceSquare #BTC #ETH #BNB #SOL #Crypto #Trading
🌅⭐ Morning Star and Evening Star 🌆📊
Can you spot a trend reversal using 3 Japanese candlesticks? 🔥
📈 Morning Star: May indicate a reversal from a downtrend to an uptrend.
📉 Evening Star: May indicate a reversal from an uptrend to a downtrend.
🎯 Learn to read these patterns and confirm them before making a trading decision!
Watch for them on BTC, ETH, BNB, SOL, and XRP 🚀
❤️ Like this content? Tap Like 👍
🔔 Follow me for more trading secrets.
💬 Which pattern do you prefer?
#BinanceSquare #BTC #ETH #BNB #SOL #Crypto #Trading
Can you spot a trend reversal using 3 Japanese candlesticks? 🔥
📈 Morning Star: May indicate a reversal from a downtrend to an uptrend.
📉 Evening Star: May indicate a reversal from an uptrend to a downtrend.
🎯 Learn to read these patterns and confirm them before making a trading decision!
Watch for them on BTC, ETH, BNB, SOL, and XRP 🚀
❤️ Like this content? Tap Like 👍
🔔 Follow me for more trading secrets.
💬 Which pattern do you prefer?
#BinanceSquare #BTC #ETH #BNB #SOL #Crypto #Trading
1
130
🕯️📊 Doji Candlestick: Is the Market About to Change Direction? 🤔
A doji candlestick appears when the opening and closing prices are close, reflecting indecision and a temporary balance between buyers and sellers.
🔥 But does it always signal a trend reversal? Or does it need confirmation from the following candlesticks?
📈 Follow BTC and ETH price movements and learn to read market signals before making your decisions.
💬 What do you think: Is a doji candlestick a reversal signal or just indecision? Share your thoughts in the comments 👇
👍 Enjoyed the explanation? Hit Like ❤️ 🚀 Follow me for more Japanese candlestick secrets and technical analysis!
#BTC #Bitcoin #ETH #Crypto #Binance #Trading #Doji #Digital_Currencies
🕯️📊 Doji Candlestick: Is the Market About to Change Direction? 🤔
A doji candlestick appears when the opening and closing prices are close, reflecting indecision and a temporary balance between buyers and sellers.
🔥 But does it always signal a trend reversal? Or does it need confirmation from the following candlesticks?
📈 Follow BTC and ETH price movements and learn to read market signals before making your decisions.
💬 What do you think: Is a doji candlestick a reversal signal or just indecision? Share your thoughts in the comments 👇
👍 Enjoyed the explanation? Hit Like ❤️ 🚀 Follow me for more Japanese candlestick secrets and technical analysis!
#BTC #Bitcoin #ETH #Crypto #Binance #Trading #Doji #Digital_Currencies
A doji candlestick appears when the opening and closing prices are close, reflecting indecision and a temporary balance between buyers and sellers.
🔥 But does it always signal a trend reversal? Or does it need confirmation from the following candlesticks?
📈 Follow BTC and ETH price movements and learn to read market signals before making your decisions.
💬 What do you think: Is a doji candlestick a reversal signal or just indecision? Share your thoughts in the comments 👇
👍 Enjoyed the explanation? Hit Like ❤️ 🚀 Follow me for more Japanese candlestick secrets and technical analysis!
#BTC #Bitcoin #ETH #Crypto #Binance #Trading #Doji #Digital_Currencies
1
104
🚨🕯️ Shooting Star Candle: Is the price preparing to fall?
Imagine $BTC rising 📈 and then a shooting star candle appears at resistance! Could this be the start of a bearish reversal? 🤔
🔍 In this video, learn what the candle looks like, how it differs from the inverted hammer, and what it could mean after a price rise.
⚠️ Remember: the signal isn’t guaranteed; wait for confirmation and watch price action.
❤️ If you found this helpful, tap Like 👍 👥 Follow me to learn how to read Japanese candlesticks step by step. 💬 What do you think: is a shooting star a strong sell signal, or does it need confirmation?
#BTC #Crypto #ShootingStar #TechnicalAnalysis
🚨🕯️ Shooting Star Candle: Is the price preparing to fall?
Imagine $BTC rising 📈 and then a shooting star candle appears at resistance! Could this be the start of a bearish reversal? 🤔
🔍 In this video, learn what the candle looks like, how it differs from the inverted hammer, and what it could mean after a price rise.
⚠️ Remember: the signal isn’t guaranteed; wait for confirmation and watch price action.
❤️ If you found this helpful, tap Like 👍 👥 Follow me to learn how to read Japanese candlesticks step by step. 💬 What do you think: is a shooting star a strong sell signal, or does it need confirmation?
#BTC #Crypto #ShootingStar #TechnicalAnalysis
Imagine $BTC rising 📈 and then a shooting star candle appears at resistance! Could this be the start of a bearish reversal? 🤔
🔍 In this video, learn what the candle looks like, how it differs from the inverted hammer, and what it could mean after a price rise.
⚠️ Remember: the signal isn’t guaranteed; wait for confirmation and watch price action.
❤️ If you found this helpful, tap Like 👍 👥 Follow me to learn how to read Japanese candlesticks step by step. 💬 What do you think: is a shooting star a strong sell signal, or does it need confirmation?
#BTC #Crypto #ShootingStar #TechnicalAnalysis
2
1.9k
🕯️📊 3 candlesticks that may reveal what’s happening in the market!
🔹 Hammer: May signal a bullish reversal after a decline. 🟢 Bullish Engulfing: May indicate growing buying strength and a potential price rise. 🔴 Bearish Engulfing: May signal seller dominance and a potential price drop.
⚠️ Remember: No signal is guaranteed; watch the trend and support and resistance levels, and wait for confirmation.
❤️ If you found this helpful, give it a like. 👥 Follow me for more Japanese candlestick lessons.
💬 A question for you: Which pattern do you trust most: the Hammer, Bullish Engulfing, or Bearish Engulfing?
#BTC #Crypto #JapaneseCandlesticks #TechnicalAnalysis
🕯️📊 3 candlesticks that may reveal what’s happening in the market!
🔹 Hammer: May signal a bullish reversal after a decline. 🟢 Bullish Engulfing: May indicate growing buying strength and a potential price rise. 🔴 Bearish Engulfing: May signal seller dominance and a potential price drop.
⚠️ Remember: No signal is guaranteed; watch the trend and support and resistance levels, and wait for confirmation.
❤️ If you found this helpful, give it a like. 👥 Follow me for more Japanese candlestick lessons.
💬 A question for you: Which pattern do you trust most: the Hammer, Bullish Engulfing, or Bearish Engulfing?
#BTC #Crypto #JapaneseCandlesticks #TechnicalAnalysis
🔹 Hammer: May signal a bullish reversal after a decline. 🟢 Bullish Engulfing: May indicate growing buying strength and a potential price rise. 🔴 Bearish Engulfing: May signal seller dominance and a potential price drop.
⚠️ Remember: No signal is guaranteed; watch the trend and support and resistance levels, and wait for confirmation.
❤️ If you found this helpful, give it a like. 👥 Follow me for more Japanese candlestick lessons.
💬 A question for you: Which pattern do you trust most: the Hammer, Bullish Engulfing, or Bearish Engulfing?
#BTC #Crypto #JapaneseCandlesticks #TechnicalAnalysis
1
654
🕯️📈 Can a single candlestick alert you to a possible price reversal and rise? 🔥
Learn how to spot the Inverted Hammer candlestick, and when it may signal a potential bullish move in the cryptocurrency market! 🚀
⚠️ Don't rush to buy before confirmation appears.
💬 Question: Do you buy when the candlestick appears, or wait for confirmation? 👇
👍 Enjoyed the content? Support us with a like and follow me to learn the secrets of Japanese candlesticks and technical analysis.
#Cryptocurrency #CryptocurrencyTrading #Binance #Bitcoin #BTC #Crypto #TechnicalAnalysis #JapaneseCandlesticks #Trading
🕯️📈 Can a single candlestick alert you to a possible price reversal and rise? 🔥
Learn how to spot the Inverted Hammer candlestick, and when it may signal a potential bullish move in the cryptocurrency market! 🚀
⚠️ Don't rush to buy before confirmation appears.
💬 Question: Do you buy when the candlestick appears, or wait for confirmation? 👇
👍 Enjoyed the content? Support us with a like and follow me to learn the secrets of Japanese candlesticks and technical analysis.
#Cryptocurrency #CryptocurrencyTrading #Binance #Bitcoin #BTC #Crypto #TechnicalAnalysis #JapaneseCandlesticks #Trading
Learn how to spot the Inverted Hammer candlestick, and when it may signal a potential bullish move in the cryptocurrency market! 🚀
⚠️ Don't rush to buy before confirmation appears.
💬 Question: Do you buy when the candlestick appears, or wait for confirmation? 👇
👍 Enjoyed the content? Support us with a like and follow me to learn the secrets of Japanese candlesticks and technical analysis.
#Cryptocurrency #CryptocurrencyTrading #Binance #Bitcoin #BTC #Crypto #TechnicalAnalysis #JapaneseCandlesticks #Trading
1
85
⚠️ When does a hammer candle fail?
Do you think that seeing a hammer candle always means the price will rise? Not necessarily!
There are 3 reasons it may fail:
1️⃣ It appears in an unsuitable location, far from support levels and after no clear downtrend.
2️⃣ No bullish candle appears afterward to confirm the signal.
3️⃣ The price breaks below the hammer candle’s low, indicating that selling pressure is continuing.
📊 Remember: Don’t rely on the hammer candle alone. Monitor the trend, support, and trading volume, and wait for confirmation.
💬 A question for you: Do you enter as soon as a hammer appears, or do you wait for confirmation?
#BinanceSquare #Technical_Analysis #HammerCandle
⚠️ When does a hammer candle fail?
Do you think that seeing a hammer candle always means the price will rise? Not necessarily!
There are 3 reasons it may fail:
1️⃣ It appears in an unsuitable location, far from support levels and after no clear downtrend.
2️⃣ No bullish candle appears afterward to confirm the signal.
3️⃣ The price breaks below the hammer candle’s low, indicating that selling pressure is continuing.
📊 Remember: Don’t rely on the hammer candle alone. Monitor the trend, support, and trading volume, and wait for confirmation.
💬 A question for you: Do you enter as soon as a hammer appears, or do you wait for confirmation?
#BinanceSquare #Technical_Analysis #HammerCandle
Do you think that seeing a hammer candle always means the price will rise? Not necessarily!
There are 3 reasons it may fail:
1️⃣ It appears in an unsuitable location, far from support levels and after no clear downtrend.
2️⃣ No bullish candle appears afterward to confirm the signal.
3️⃣ The price breaks below the hammer candle’s low, indicating that selling pressure is continuing.
📊 Remember: Don’t rely on the hammer candle alone. Monitor the trend, support, and trading volume, and wait for confirmation.
💬 A question for you: Do you enter as soon as a hammer appears, or do you wait for confirmation?
#BinanceSquare #Technical_Analysis #HammerCandle
2
5
2.7k
📊 Does a hammer candle mean the price will rise? 🕯️
Many traders see a hammer candle and immediately think the trend will reverse from bearish to bullish—but be careful! Not every hammer candle is a buy signal.
For a stronger signal, watch for 3 things:
1️⃣ Where it appears: It matters more when it appears after a downtrend.
2️⃣ The lower wick: The longer it is compared to the candle body, the more it indicates rejection of lower prices.
3️⃣ The confirmation candle: Wait for a bullish candle to close afterward, and don’t rush into a trade.
⚠️ Remember: A hammer candle is a potential reversal signal, not a guarantee that the price will rise.
💬 A question for traders:
Do you enter a trade as soon as a hammer candle appears, or wait for a confirmation candle?
Share your thoughts in the comments 👇
#BinanceSquare #LearnToTrade #TechnicalAnalysis #HammerCandle #JapaneseCandlesticks
📊 Does a hammer candle mean the price will rise? 🕯️
Many traders see a hammer candle and immediately think the trend will reverse from bearish to bullish—but be careful! Not every hammer candle is a buy signal.
For a stronger signal, watch for 3 things:
1️⃣ Where it appears: It matters more when it appears after a downtrend.
2️⃣ The lower wick: The longer it is compared to the candle body, the more it indicates rejection of lower prices.
3️⃣ The confirmation candle: Wait for a bullish candle to close afterward, and don’t rush into a trade.
⚠️ Remember: A hammer candle is a potential reversal signal, not a guarantee that the price will rise.
💬 A question for traders:
Do you enter a trade as soon as a hammer candle appears, or wait for a confirmation candle?
Share your thoughts in the comments 👇
#BinanceSquare #LearnToTrade #TechnicalAnalysis #HammerCandle #JapaneseCandlesticks
Many traders see a hammer candle and immediately think the trend will reverse from bearish to bullish—but be careful! Not every hammer candle is a buy signal.
For a stronger signal, watch for 3 things:
1️⃣ Where it appears: It matters more when it appears after a downtrend.
2️⃣ The lower wick: The longer it is compared to the candle body, the more it indicates rejection of lower prices.
3️⃣ The confirmation candle: Wait for a bullish candle to close afterward, and don’t rush into a trade.
⚠️ Remember: A hammer candle is a potential reversal signal, not a guarantee that the price will rise.
💬 A question for traders:
Do you enter a trade as soon as a hammer candle appears, or wait for a confirmation candle?
Share your thoughts in the comments 👇
#BinanceSquare #LearnToTrade #TechnicalAnalysis #HammerCandle #JapaneseCandlesticks
2
73
🕯️📊 Can a single candlestick alert you to a trend reversal?! 🔥
The hammer candlestick 🔨 is one of the key patterns traders watch for as a possible reversal from a downtrend to an uptrend.
🎯 But the secret isn’t just the candle’s shape—it’s where it appears and how you confirm the signal!
👀 Watch the video to learn how to read the hammer candlestick and use it in technical analysis.
💬 A question for you: Have you ever spotted a hammer candlestick and then seen the price rise? Share your experience! 👇
🔁 If you found this useful, share the video with friends who are interested in trading.
#BinanceSquare #JapaneseCandlesticks #HammerCandlestick #TechnicalAnalysis #CryptoTrading
🕯️📊 Can a single candlestick alert you to a trend reversal?! 🔥
The hammer candlestick 🔨 is one of the key patterns traders watch for as a possible reversal from a downtrend to an uptrend.
🎯 But the secret isn’t just the candle’s shape—it’s where it appears and how you confirm the signal!
👀 Watch the video to learn how to read the hammer candlestick and use it in technical analysis.
💬 A question for you: Have you ever spotted a hammer candlestick and then seen the price rise? Share your experience! 👇
🔁 If you found this useful, share the video with friends who are interested in trading.
#BinanceSquare #JapaneseCandlesticks #HammerCandlestick #TechnicalAnalysis #CryptoTrading
The hammer candlestick 🔨 is one of the key patterns traders watch for as a possible reversal from a downtrend to an uptrend.
🎯 But the secret isn’t just the candle’s shape—it’s where it appears and how you confirm the signal!
👀 Watch the video to learn how to read the hammer candlestick and use it in technical analysis.
💬 A question for you: Have you ever spotted a hammer candlestick and then seen the price rise? Share your experience! 👇
🔁 If you found this useful, share the video with friends who are interested in trading.
#BinanceSquare #JapaneseCandlesticks #HammerCandlestick #TechnicalAnalysis #CryptoTrading
1
2
1k
🕯️📊 Do you understand the language of Japanese candlesticks?
Every candlestick tells a story of the battle between buyers and sellers! 🔥
In this post, you’ll learn how to identify bullish and bearish candlesticks, understand their bodies and wicks, and read price movements more clearly.
💬 What do you find more difficult: reversal candlesticks or identifying entry and exit points?
🔁 Share this post with people interested in trading, and follow me for more technical analysis lessons.
#BinanceSquare #TechnicalAnalysis #JapaneseCandlesticks #LearnToTrade
🕯️📊 Do you understand the language of Japanese candlesticks?
Every candlestick tells a story of the battle between buyers and sellers! 🔥
In this post, you’ll learn how to identify bullish and bearish candlesticks, understand their bodies and wicks, and read price movements more clearly.
💬 What do you find more difficult: reversal candlesticks or identifying entry and exit points?
🔁 Share this post with people interested in trading, and follow me for more technical analysis lessons.
#BinanceSquare #TechnicalAnalysis #JapaneseCandlesticks #LearnToTrade
Every candlestick tells a story of the battle between buyers and sellers! 🔥
In this post, you’ll learn how to identify bullish and bearish candlesticks, understand their bodies and wicks, and read price movements more clearly.
💬 What do you find more difficult: reversal candlesticks or identifying entry and exit points?
🔁 Share this post with people interested in trading, and follow me for more technical analysis lessons.
#BinanceSquare #TechnicalAnalysis #JapaneseCandlesticks #LearnToTrade

1
76
📊🕯️ Do you understand the language of Japanese candlesticks?
Many traders look at charts, but do you know what each candlestick is telling you? 👀
In this video 🎥, you’ll learn how to read Japanese candlesticks and discover: 🟢 Bullish and bearish candlesticks. 📍 The open, close, high, and low prices. ⚡ How do a candlestick’s body and wicks reveal the battle between buyers and sellers?
💡 Remember: Candlesticks can help with your analysis, but they don’t guarantee the market’s direction.
🔥 Test yourself: Can you tell who’s in control of the market from a candlestick’s shape? Share your answer in the comments! 👇
🔁 If you found this helpful, share the video with your friends and follow me for more technical analysis lessons.
#BinanceSquare #JapaneseCandlesticks #TechnicalAnalysis #LearnToTrade
📊🕯️ Do you understand the language of Japanese candlesticks?
Many traders look at charts, but do you know what each candlestick is telling you? 👀
In this video 🎥, you’ll learn how to read Japanese candlesticks and discover: 🟢 Bullish and bearish candlesticks. 📍 The open, close, high, and low prices. ⚡ How do a candlestick’s body and wicks reveal the battle between buyers and sellers?
💡 Remember: Candlesticks can help with your analysis, but they don’t guarantee the market’s direction.
🔥 Test yourself: Can you tell who’s in control of the market from a candlestick’s shape? Share your answer in the comments! 👇
🔁 If you found this helpful, share the video with your friends and follow me for more technical analysis lessons.
#BinanceSquare #JapaneseCandlesticks #TechnicalAnalysis #LearnToTrade
Many traders look at charts, but do you know what each candlestick is telling you? 👀
In this video 🎥, you’ll learn how to read Japanese candlesticks and discover: 🟢 Bullish and bearish candlesticks. 📍 The open, close, high, and low prices. ⚡ How do a candlestick’s body and wicks reveal the battle between buyers and sellers?
💡 Remember: Candlesticks can help with your analysis, but they don’t guarantee the market’s direction.
🔥 Test yourself: Can you tell who’s in control of the market from a candlestick’s shape? Share your answer in the comments! 👇
🔁 If you found this helpful, share the video with your friends and follow me for more technical analysis lessons.
#BinanceSquare #JapaneseCandlesticks #TechnicalAnalysis #LearnToTrade
2
8
4.5k
Log in to explore more content
Join global crypto users on Binance Square
⚡️ Get latest and useful information about crypto.
💬 Trusted by the world’s largest crypto exchange.
👍 Discover real insights from verified creators.
Email / Phone number
Trending Topics
BitcoinRebounds$75KAsChipsLead
9,528 views
139 Discussing
Market Watch | Bitcoin Rebounds to $75,600 After Dip Below $75,000 as Chip Stocks Lead Rally on Jobs Beat
Binance News
·16 Likes
·5k views
JobsReportRaisesHikeOdds
120,017 views
1,072 Discussing
US Data Center Rules May Constrain AI Expansion
17,590 views
109 Discussing