

chesster74
Del tablero al mercado 📊 Estudiante y ajedrecista documentando mi viaje en el trading y análisis técnico. 👋 Saludos desde Venezuela 🇻🇪
Open Trade
High-Frequency Trader
3.5 Years
268 Following
491 Followers
1.0K+ Liked
Posts
Portfolio
All
Quotes
Live
PINNED

chesster74
·
--
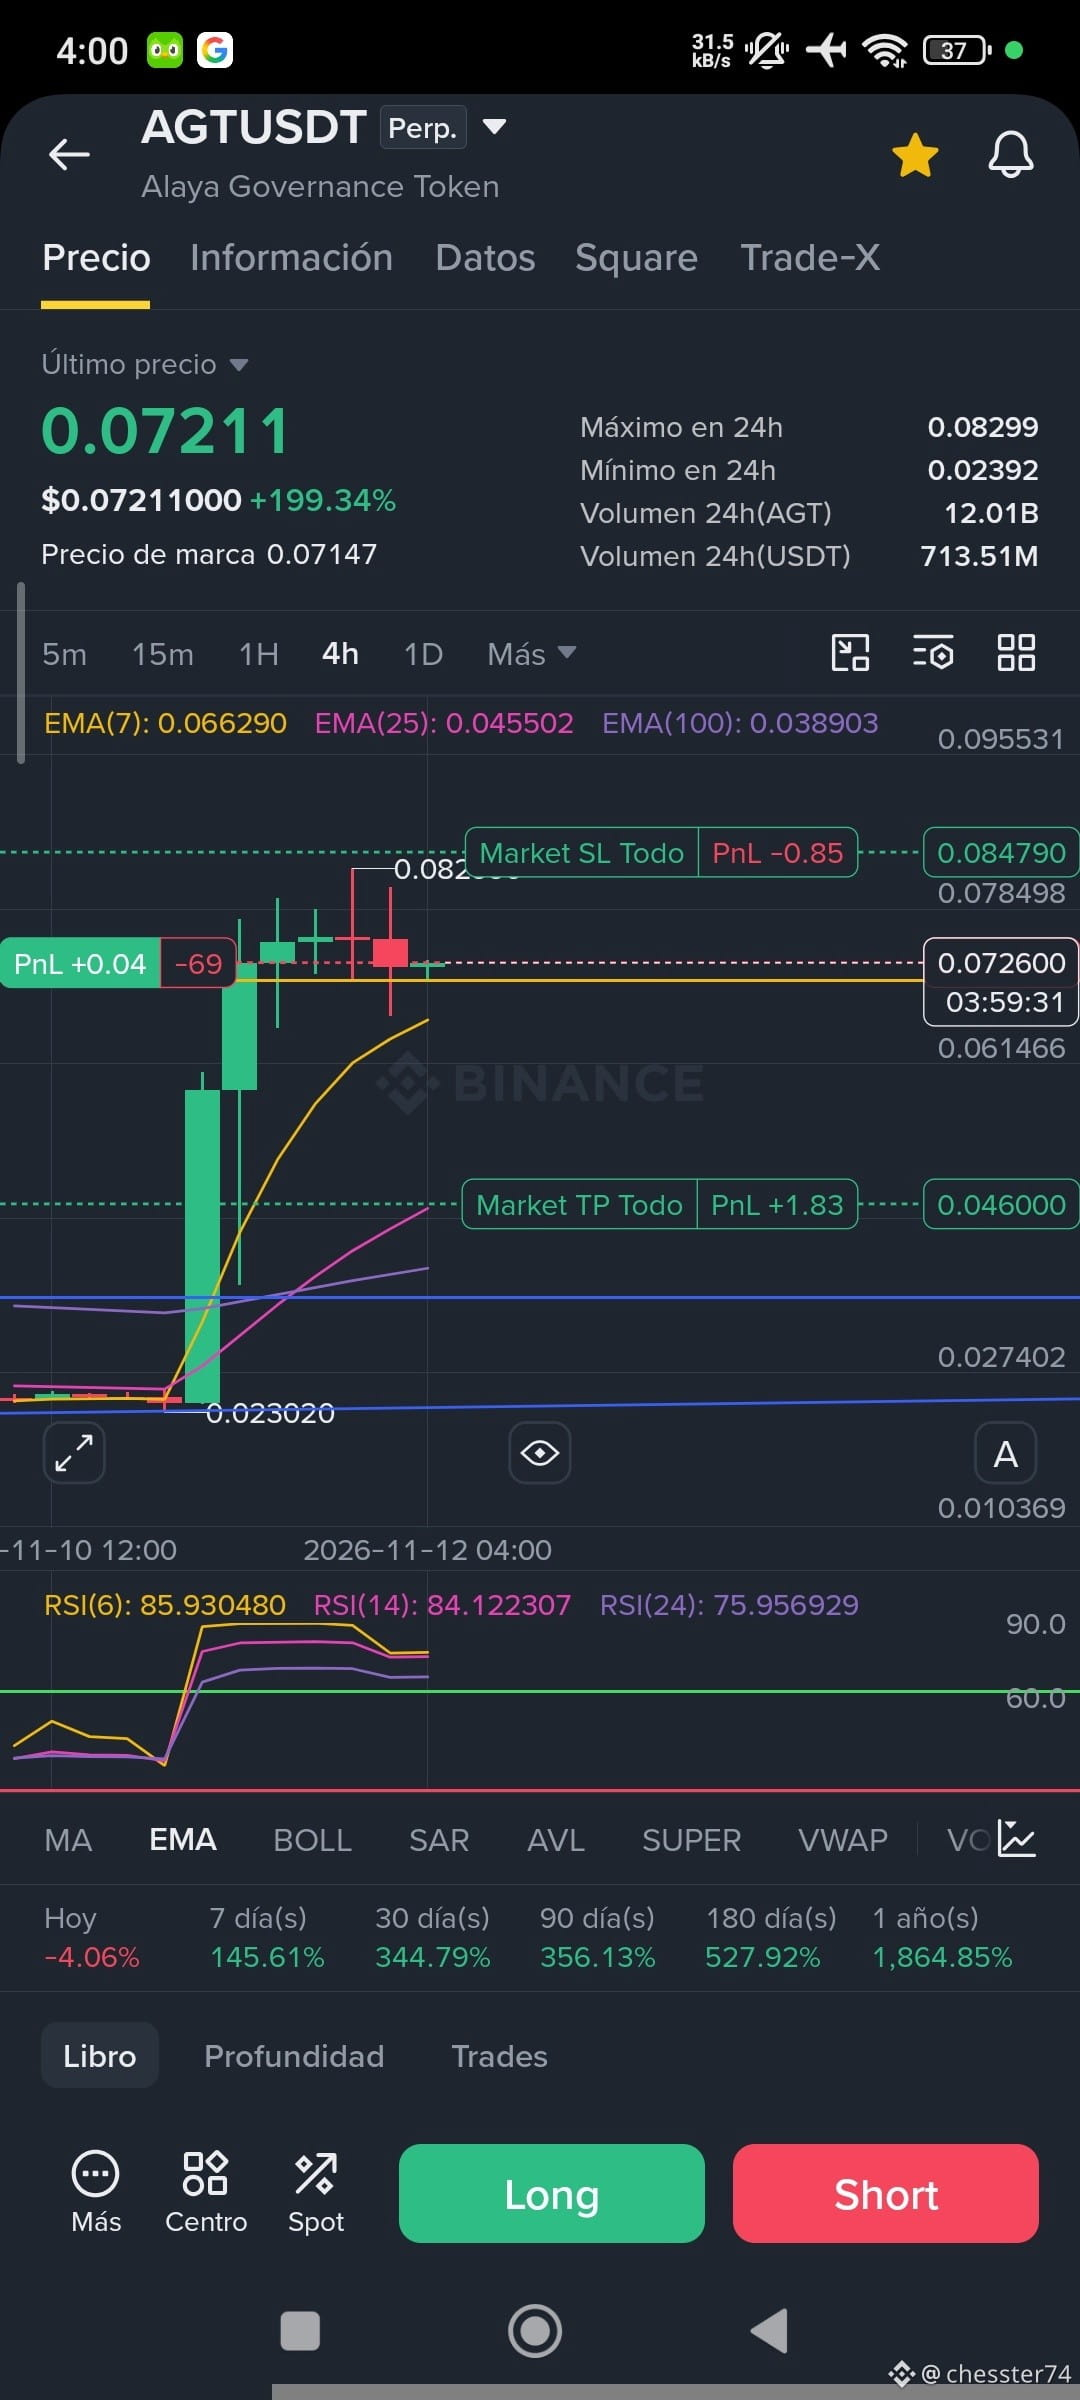
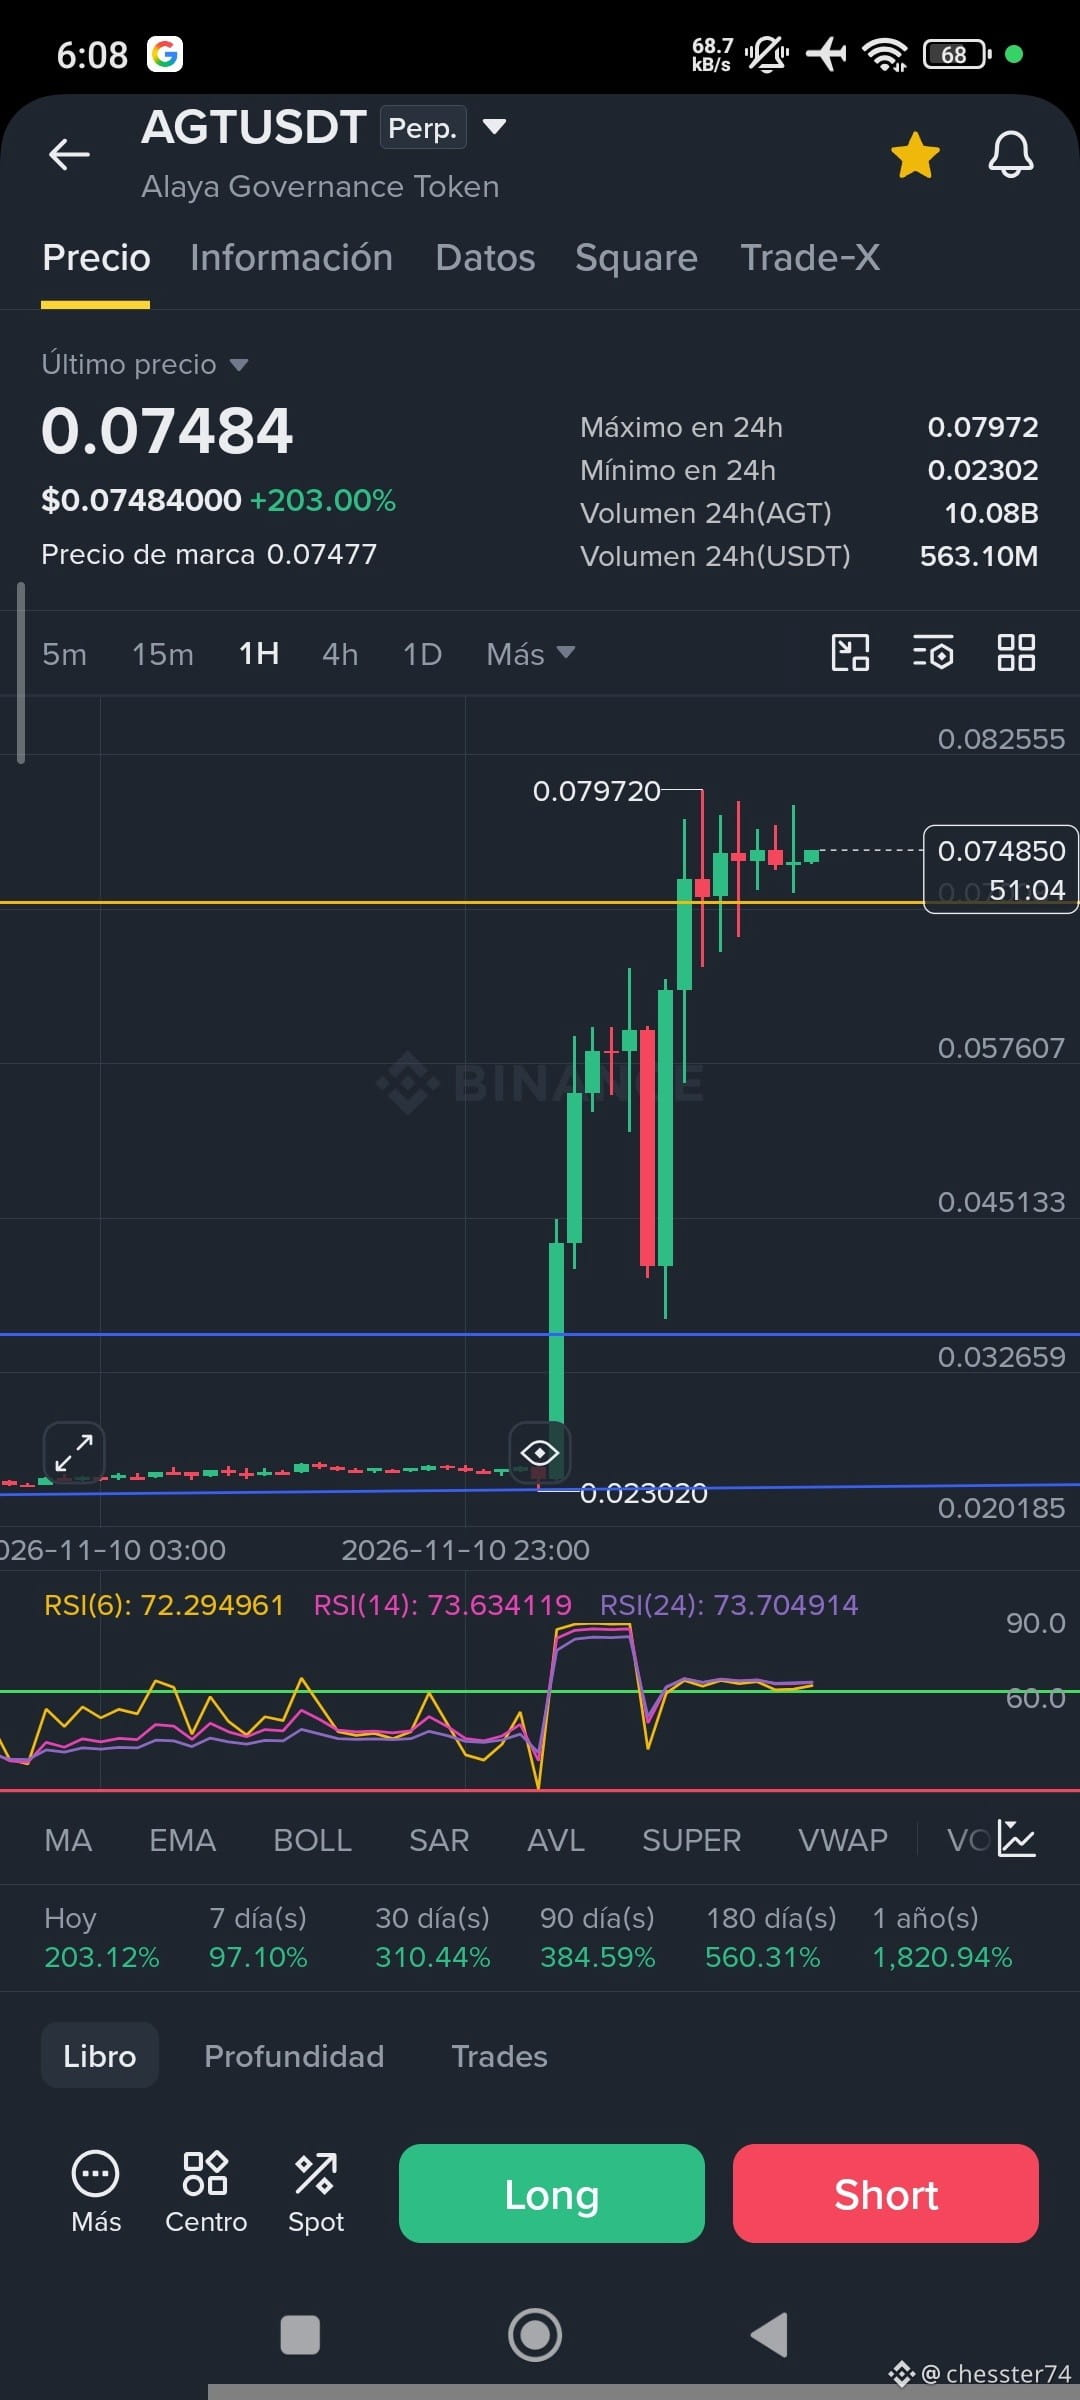
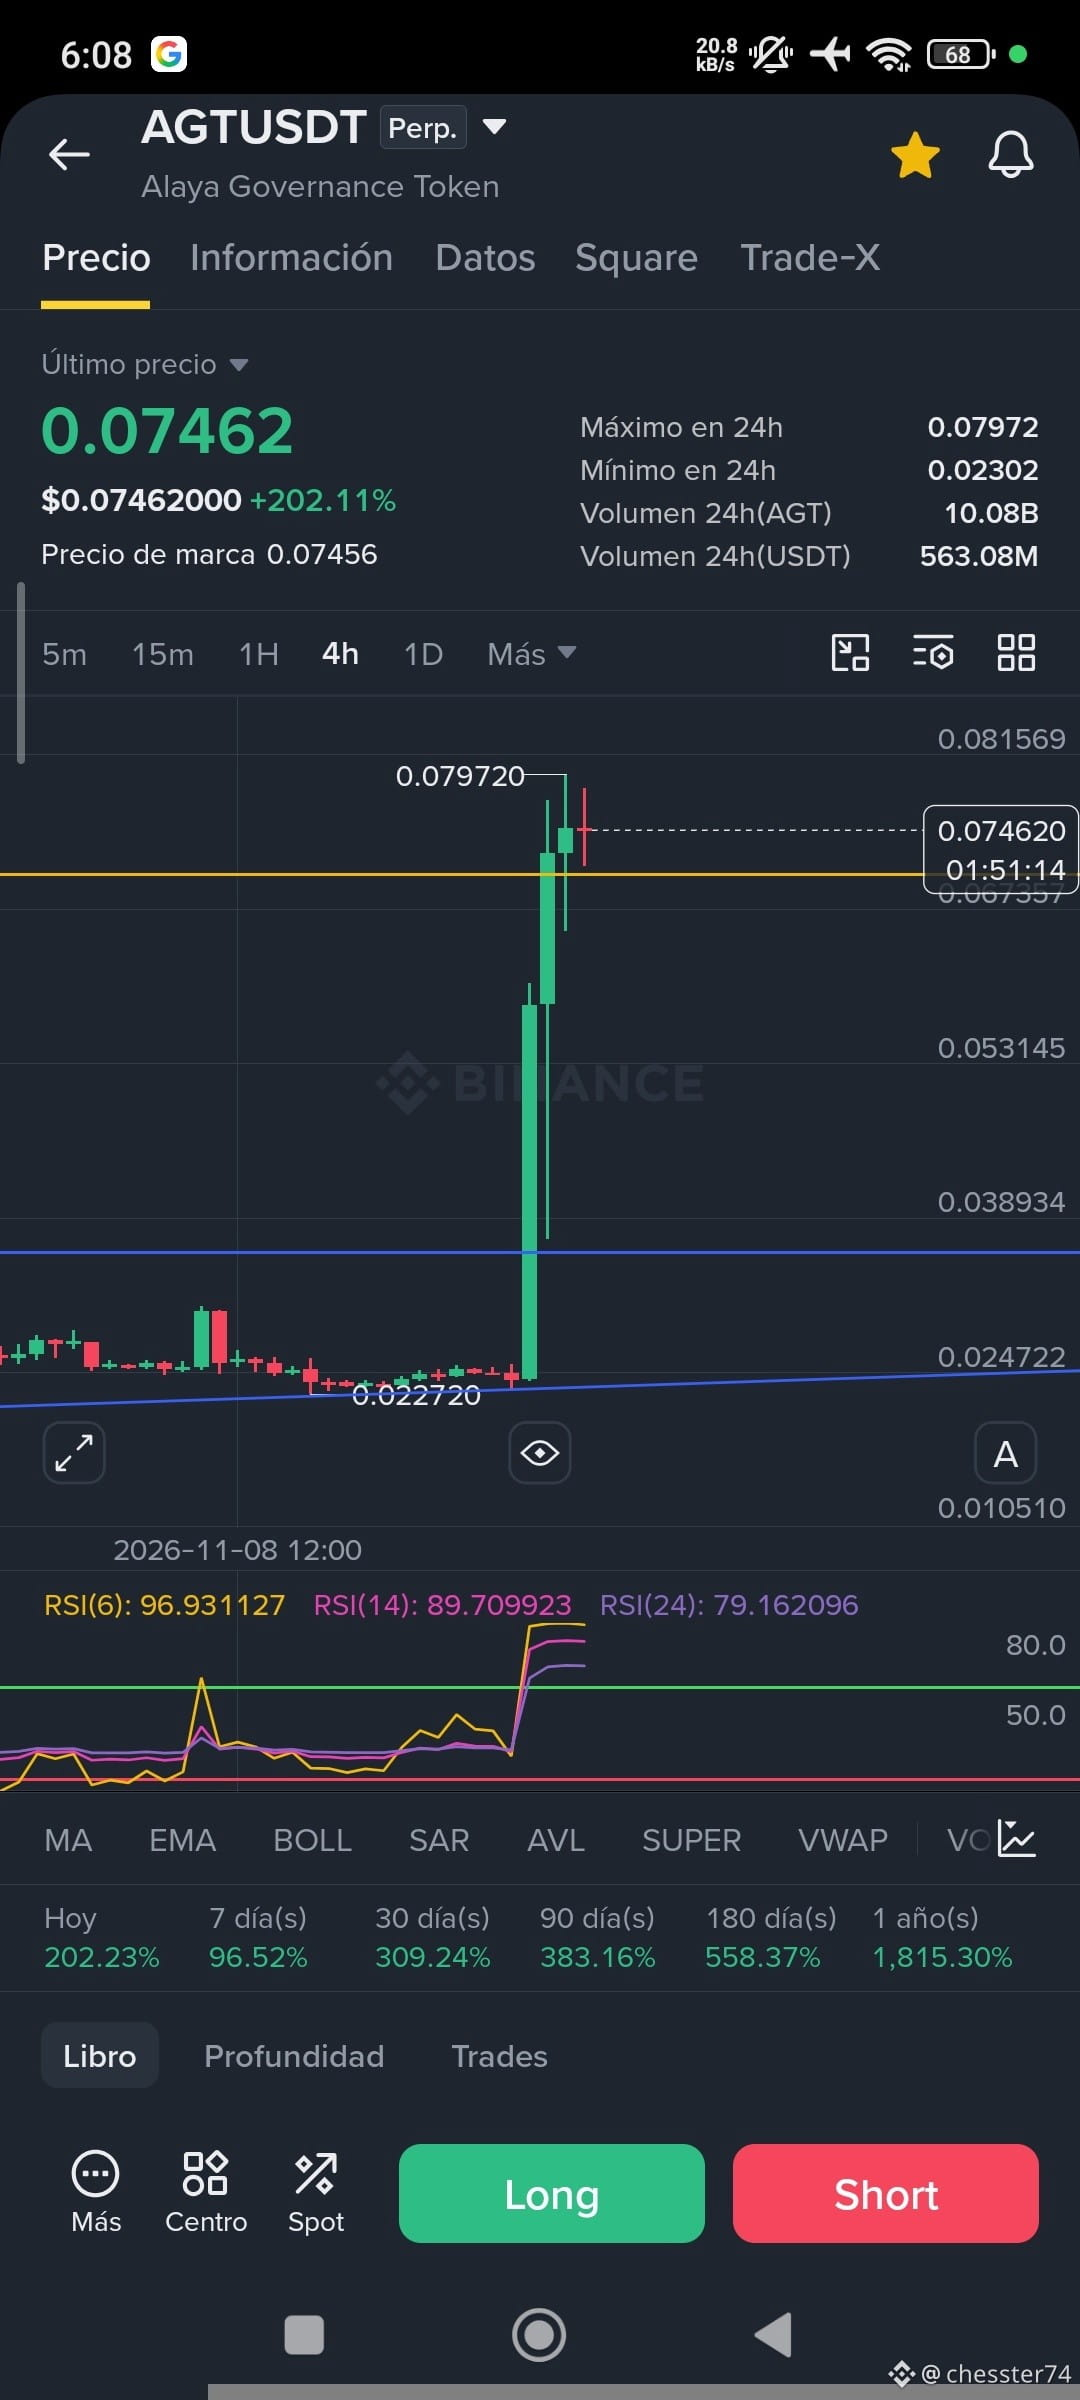
Bearish$AGT 👀 Waiting to go short?
The price is at resistance, and you can see demand starting to lose strength and slow down.
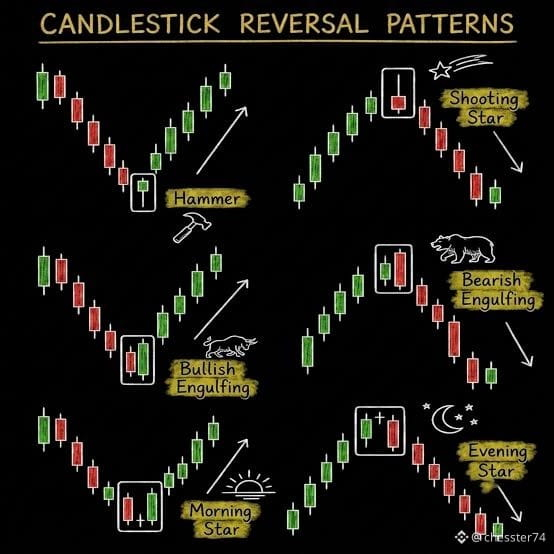
A slowdown is the step before a reversal. But I prefer to wait for a reversal candle to confirm the direction.
1H timeframe
The price is overbought and approaching resistance, with momentum slowing down. All that’s missing is for the bears to confirm the direction so we can look for a short position.
The price is also starting to slow down on the 4H timeframe.
🤔 Will the bears manage to defend this zone, or will demand reach a new high? Remember to do your own research (DYOR).
The price is at resistance, and you can see demand starting to lose strength and slow down.
A slowdown is the step before a reversal. But I prefer to wait for a reversal candle to confirm the direction.
1H timeframe
The price is overbought and approaching resistance, with momentum slowing down. All that’s missing is for the bears to confirm the direction so we can look for a short position.
The price is also starting to slow down on the 4H timeframe.
🤔 Will the bears manage to defend this zone, or will demand reach a new high? Remember to do your own research (DYOR).
chesster74
·
--
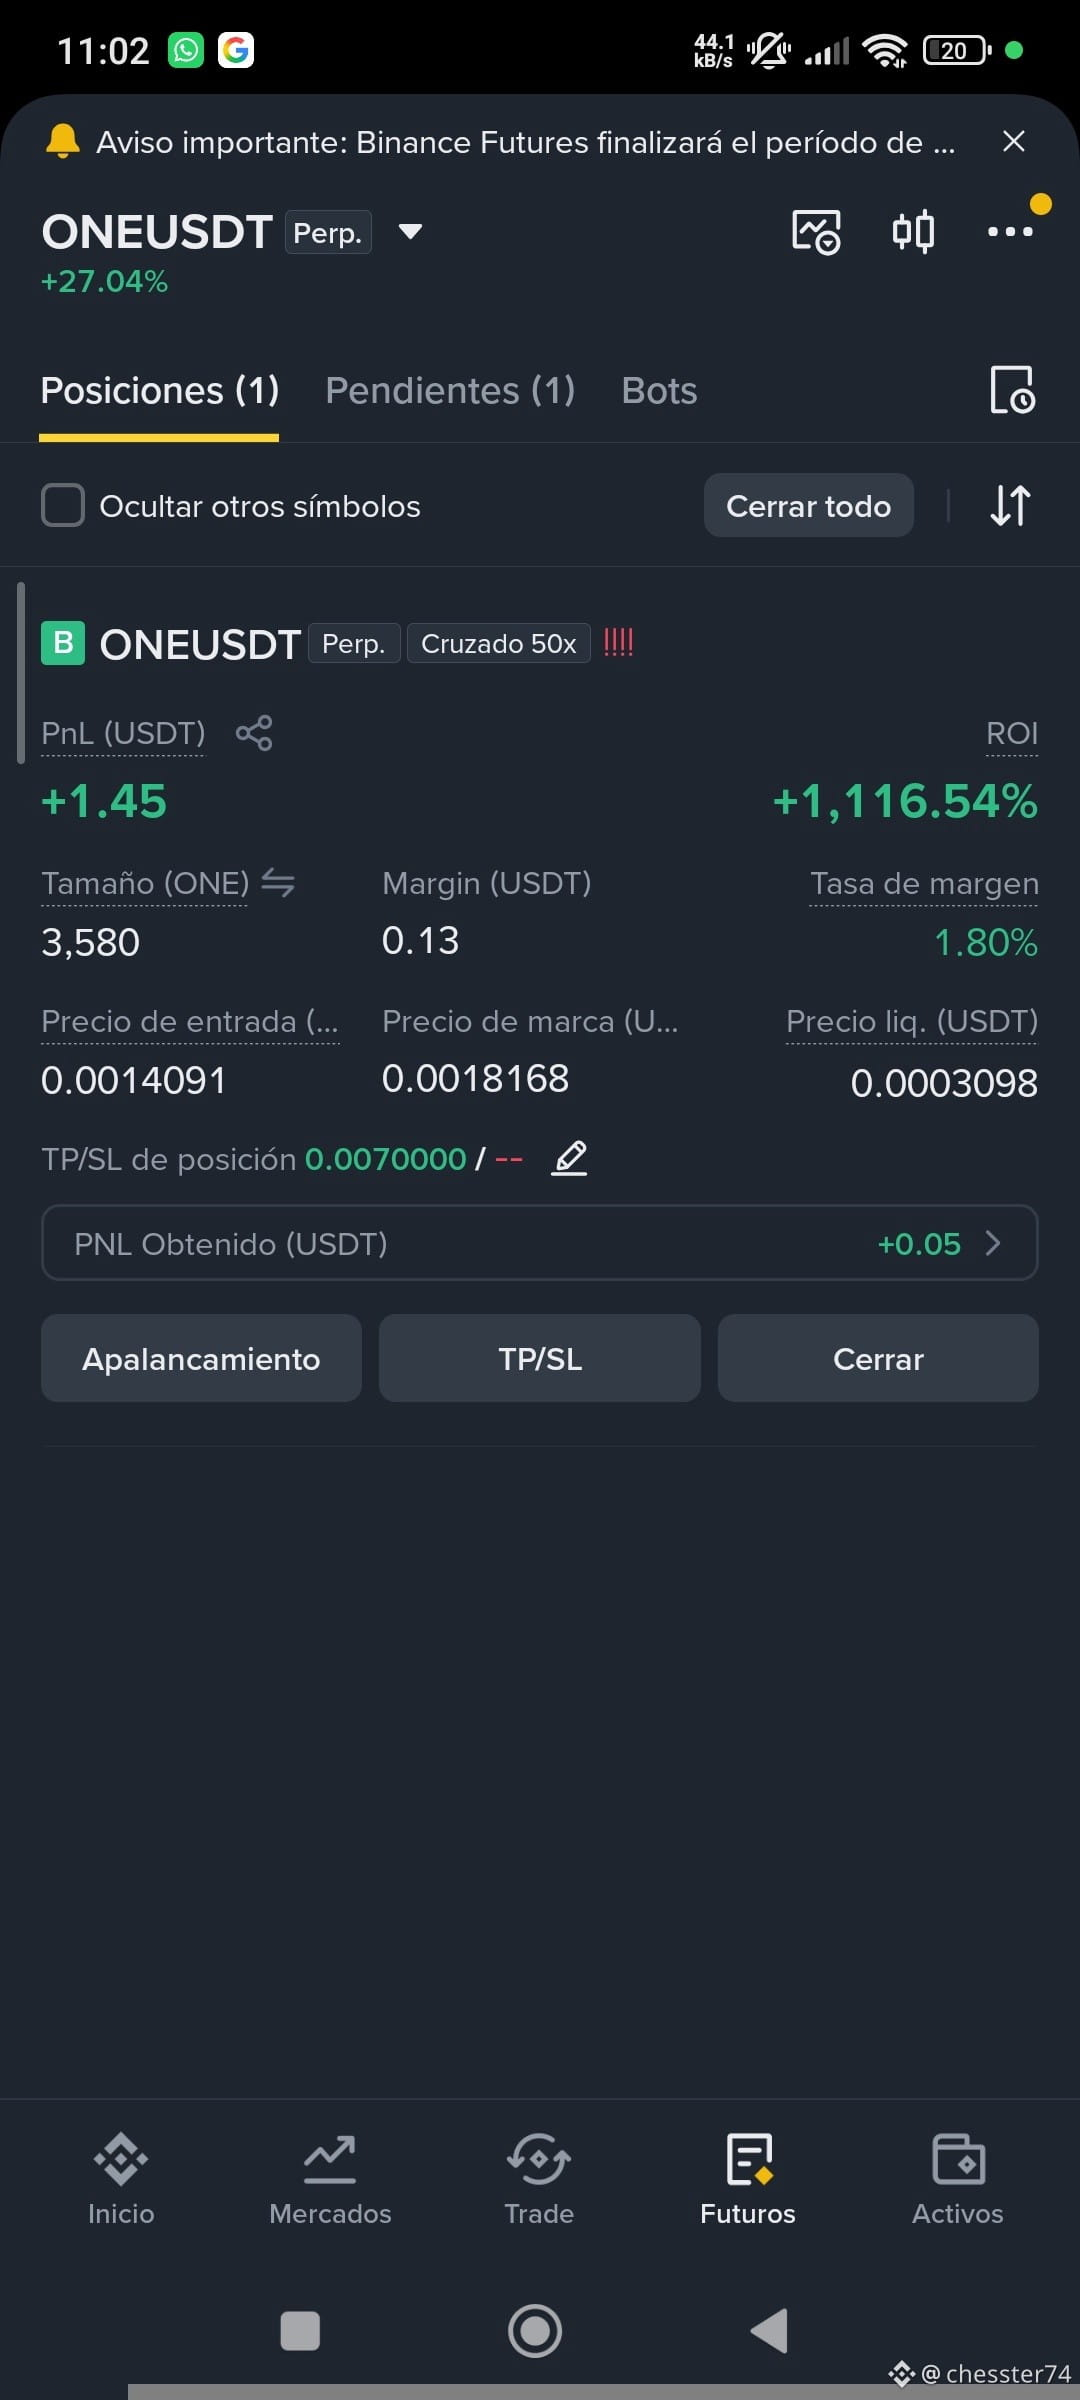
Bullish$ONE 👀 Are you seeing the movement?
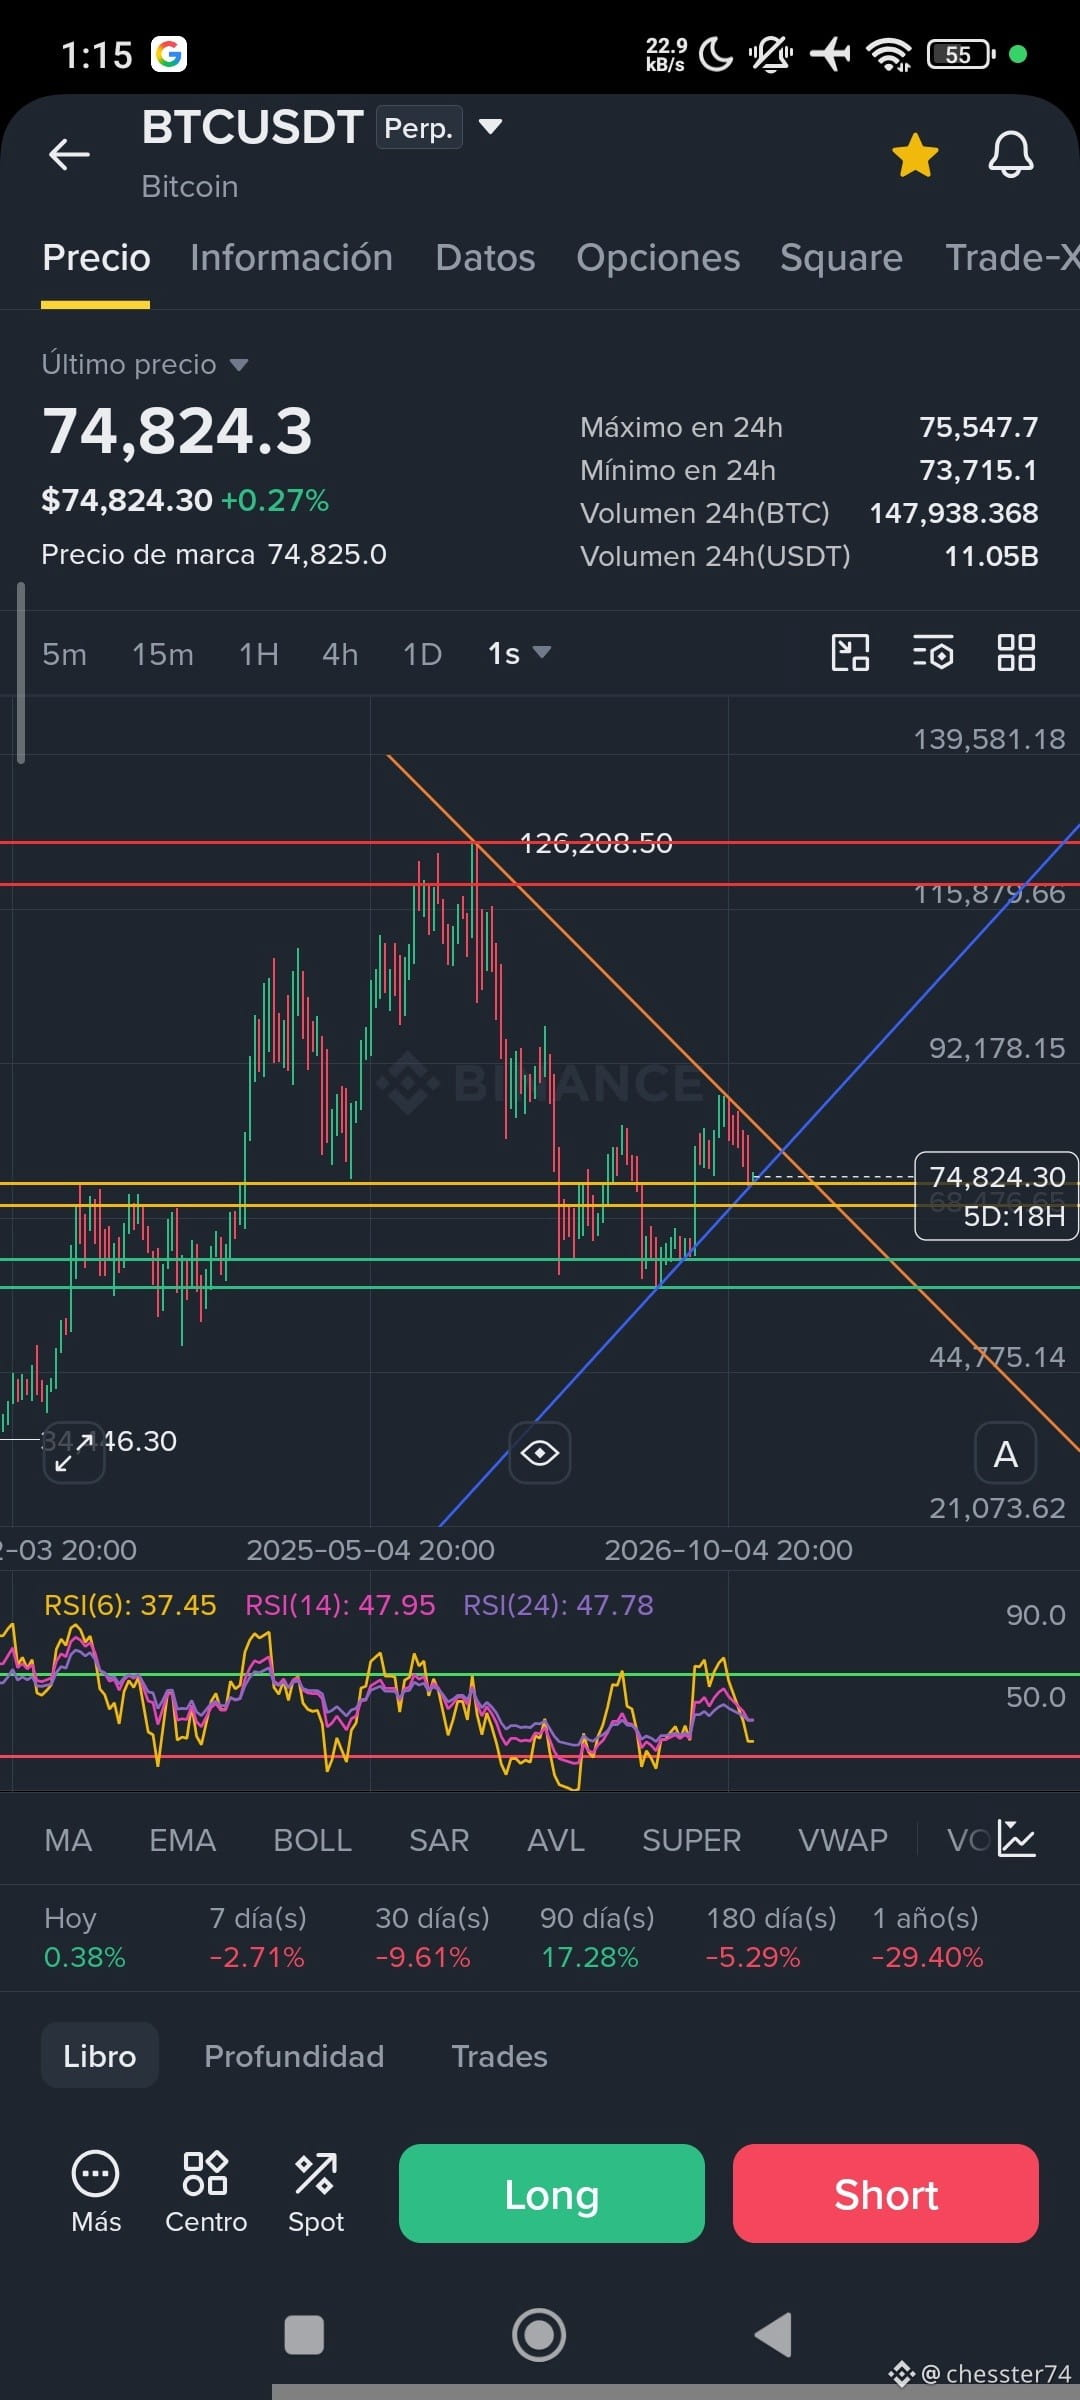
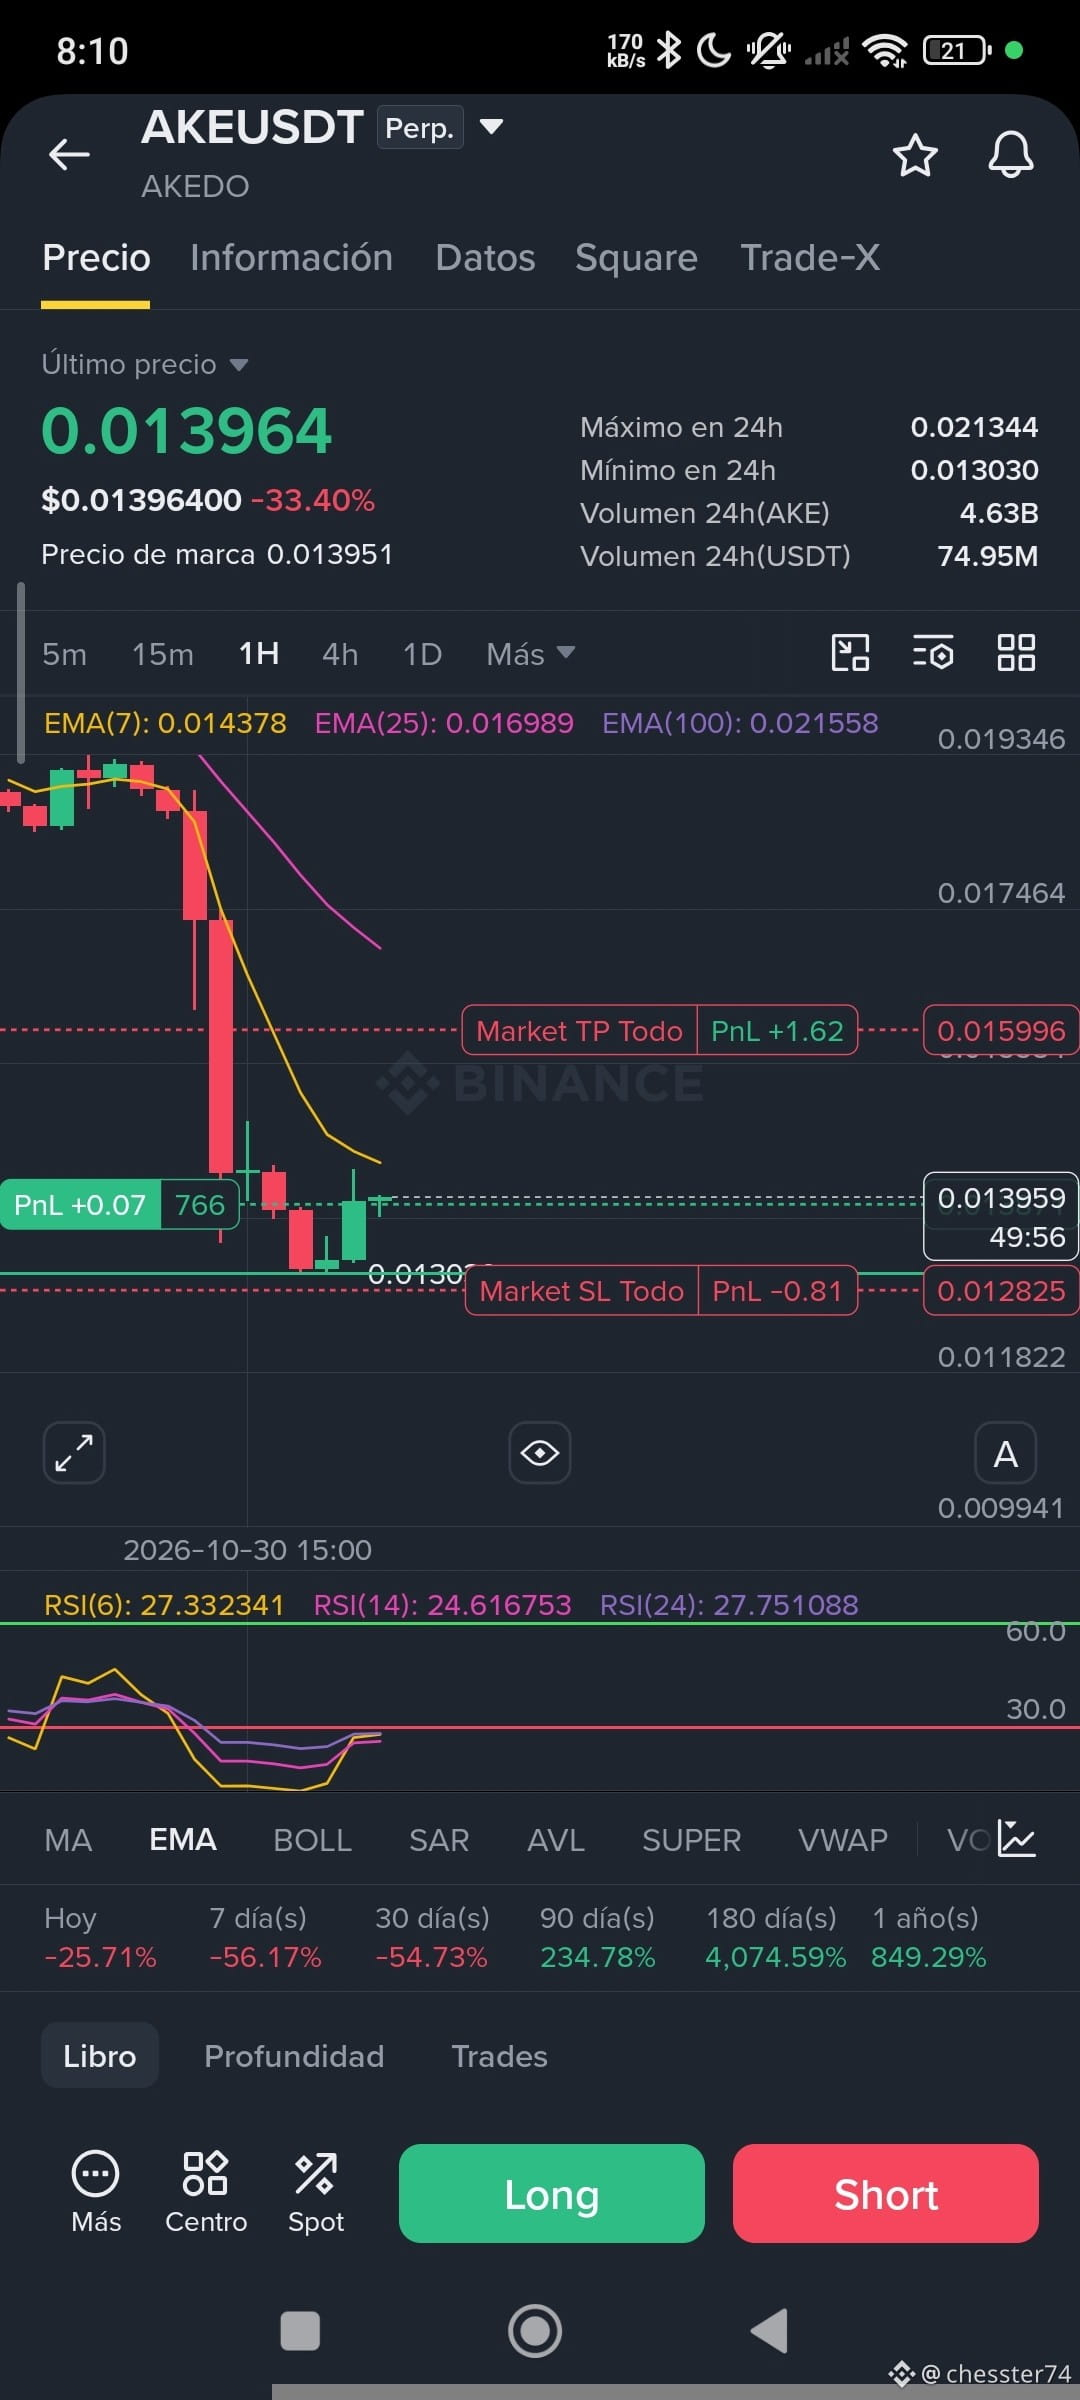
It’s a shame I couldn’t share the information when I entered the trade because of the electricity issues 💡 I’ve hardly shared any trades since then. The most recent one was when I was analyzing BTC and wanted to do some scalping, but it didn’t work out 😅 and the one before that was $AKE where I was applying a strategy. In the comments, you helped me identify that I was wrong on that trade because it wasn’t a support level. We’re getting better, step by step.
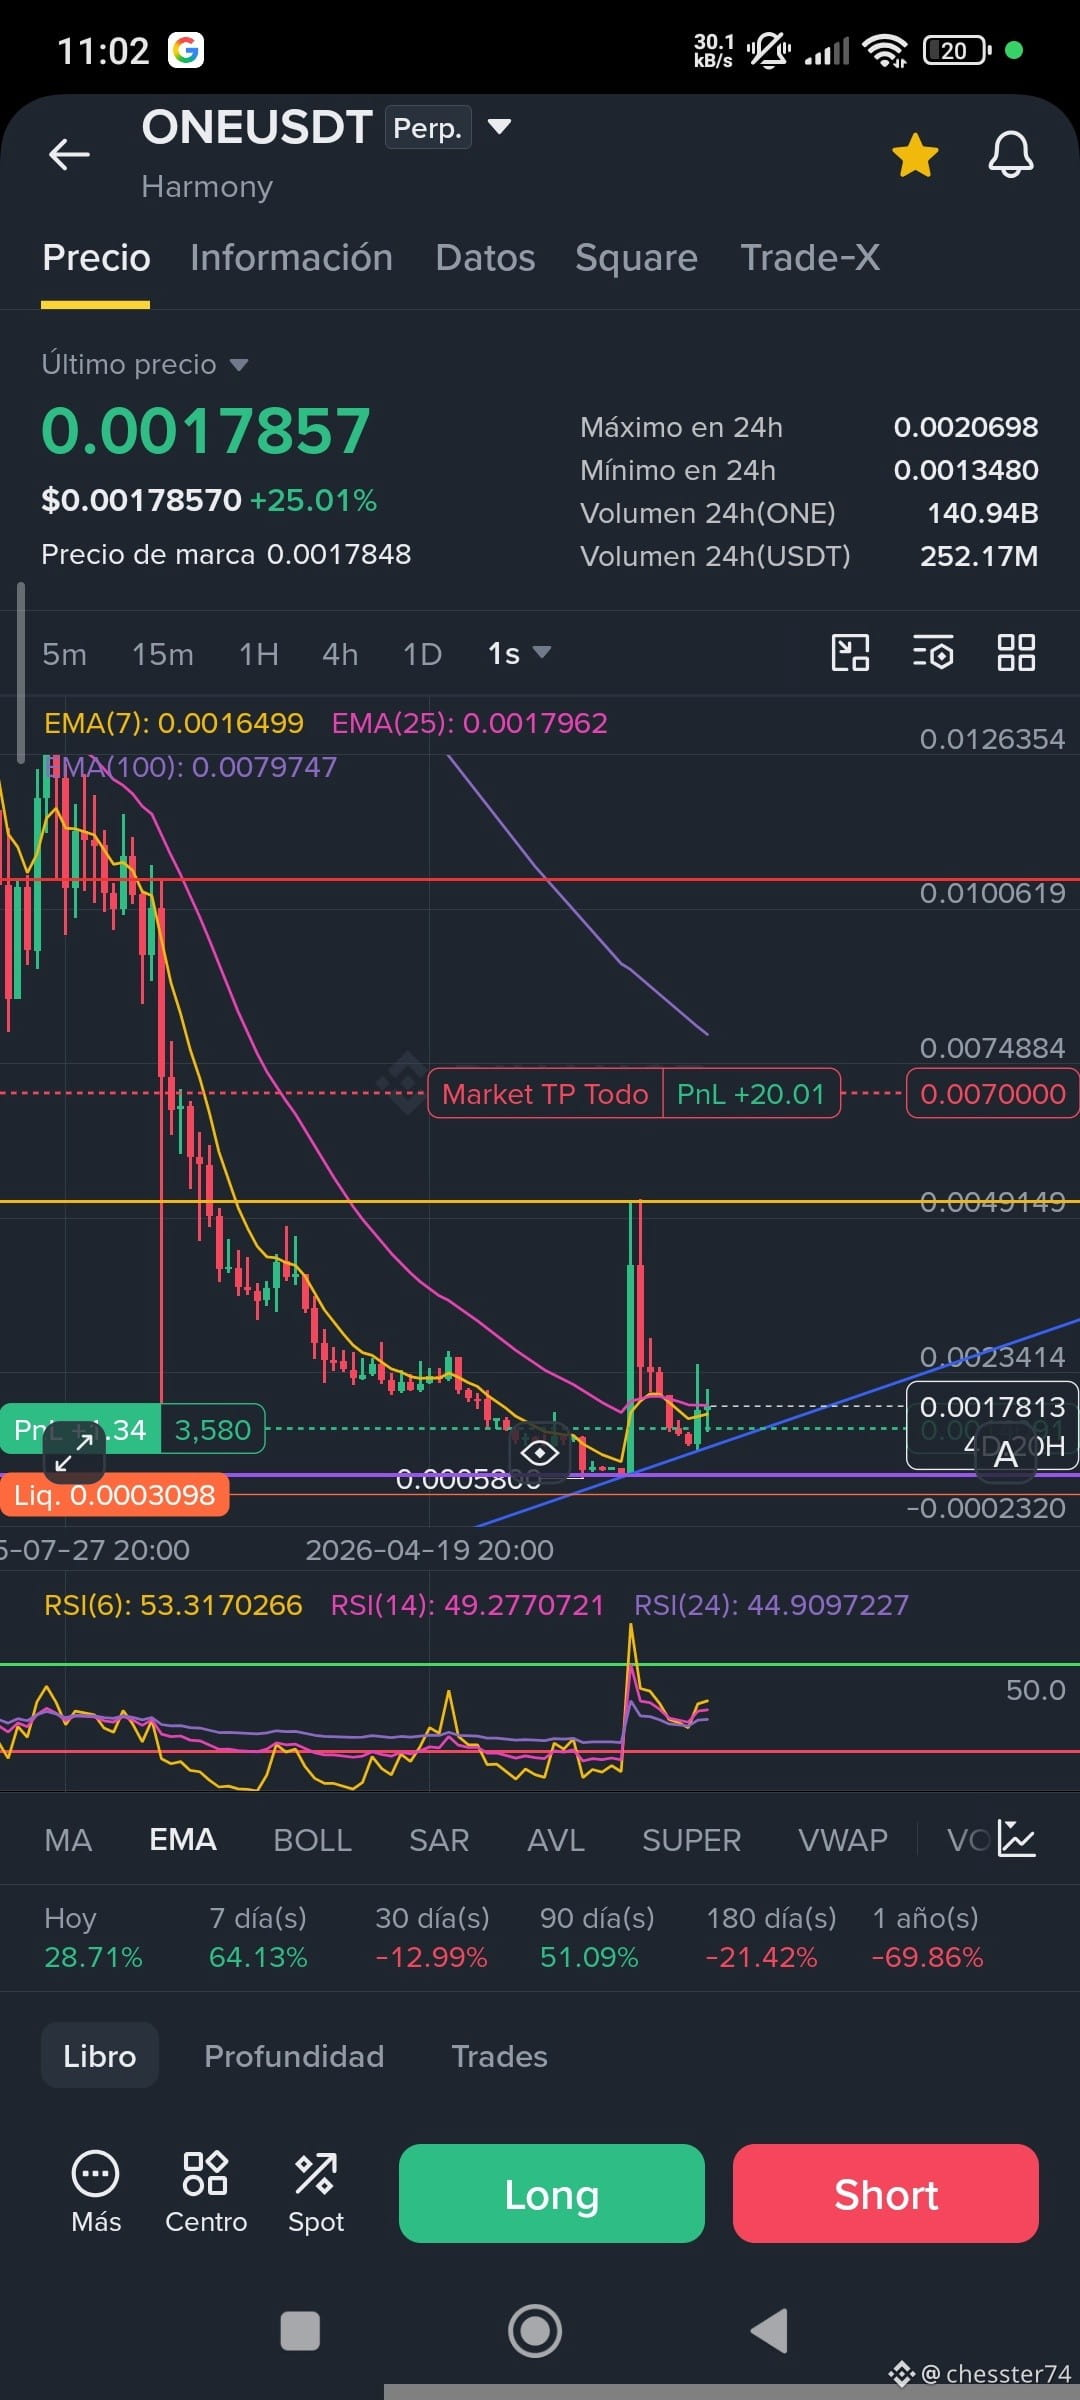
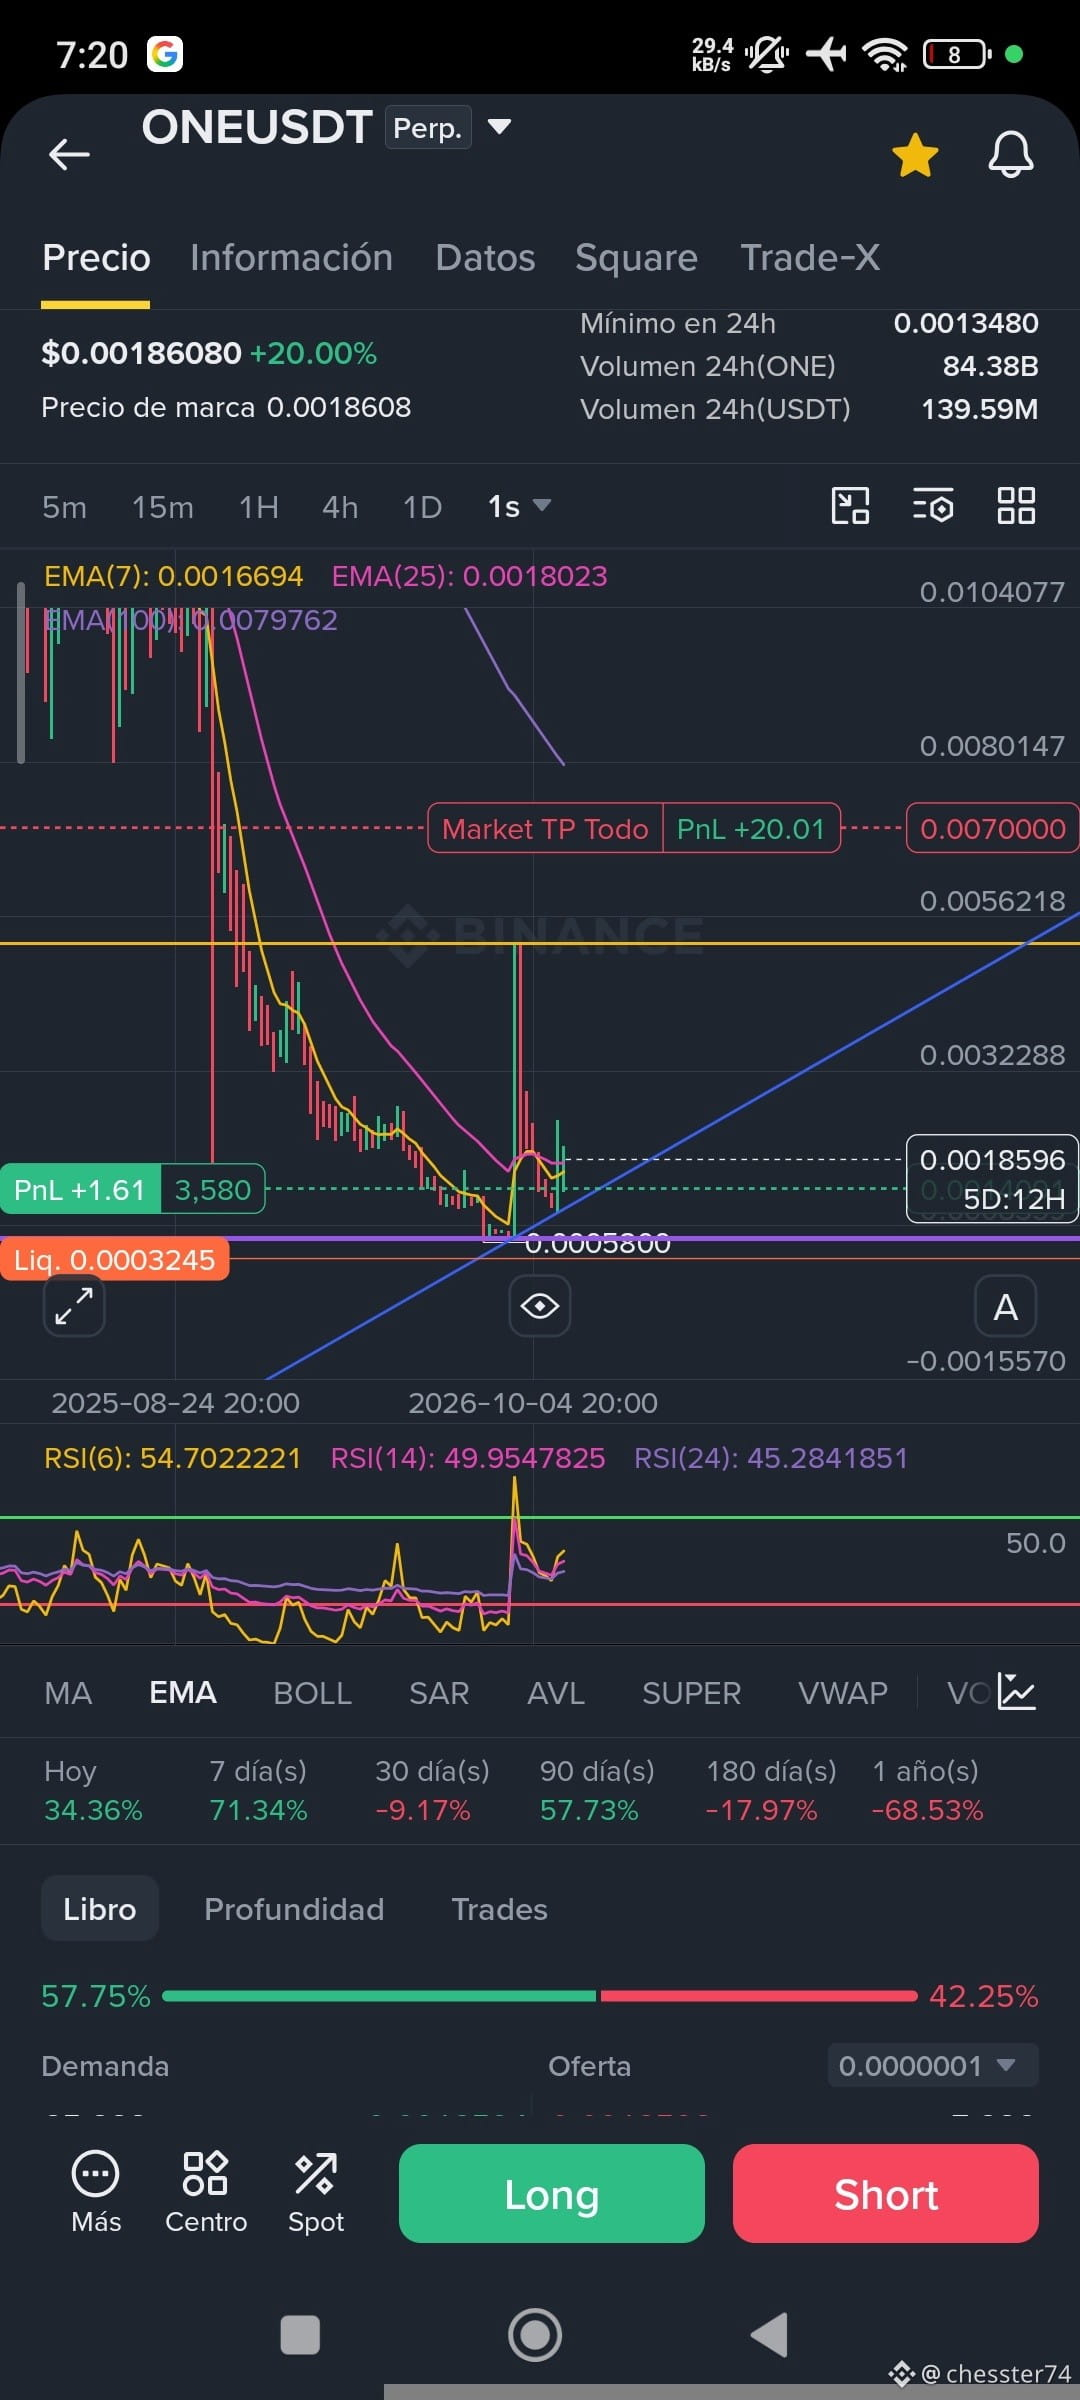
But anyway, I wanted to share that I was analyzing this chart, and based on my technical analysis, I think the price will go up because:
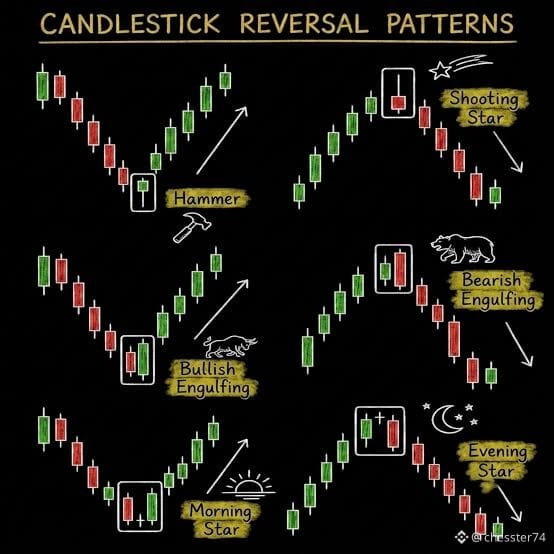
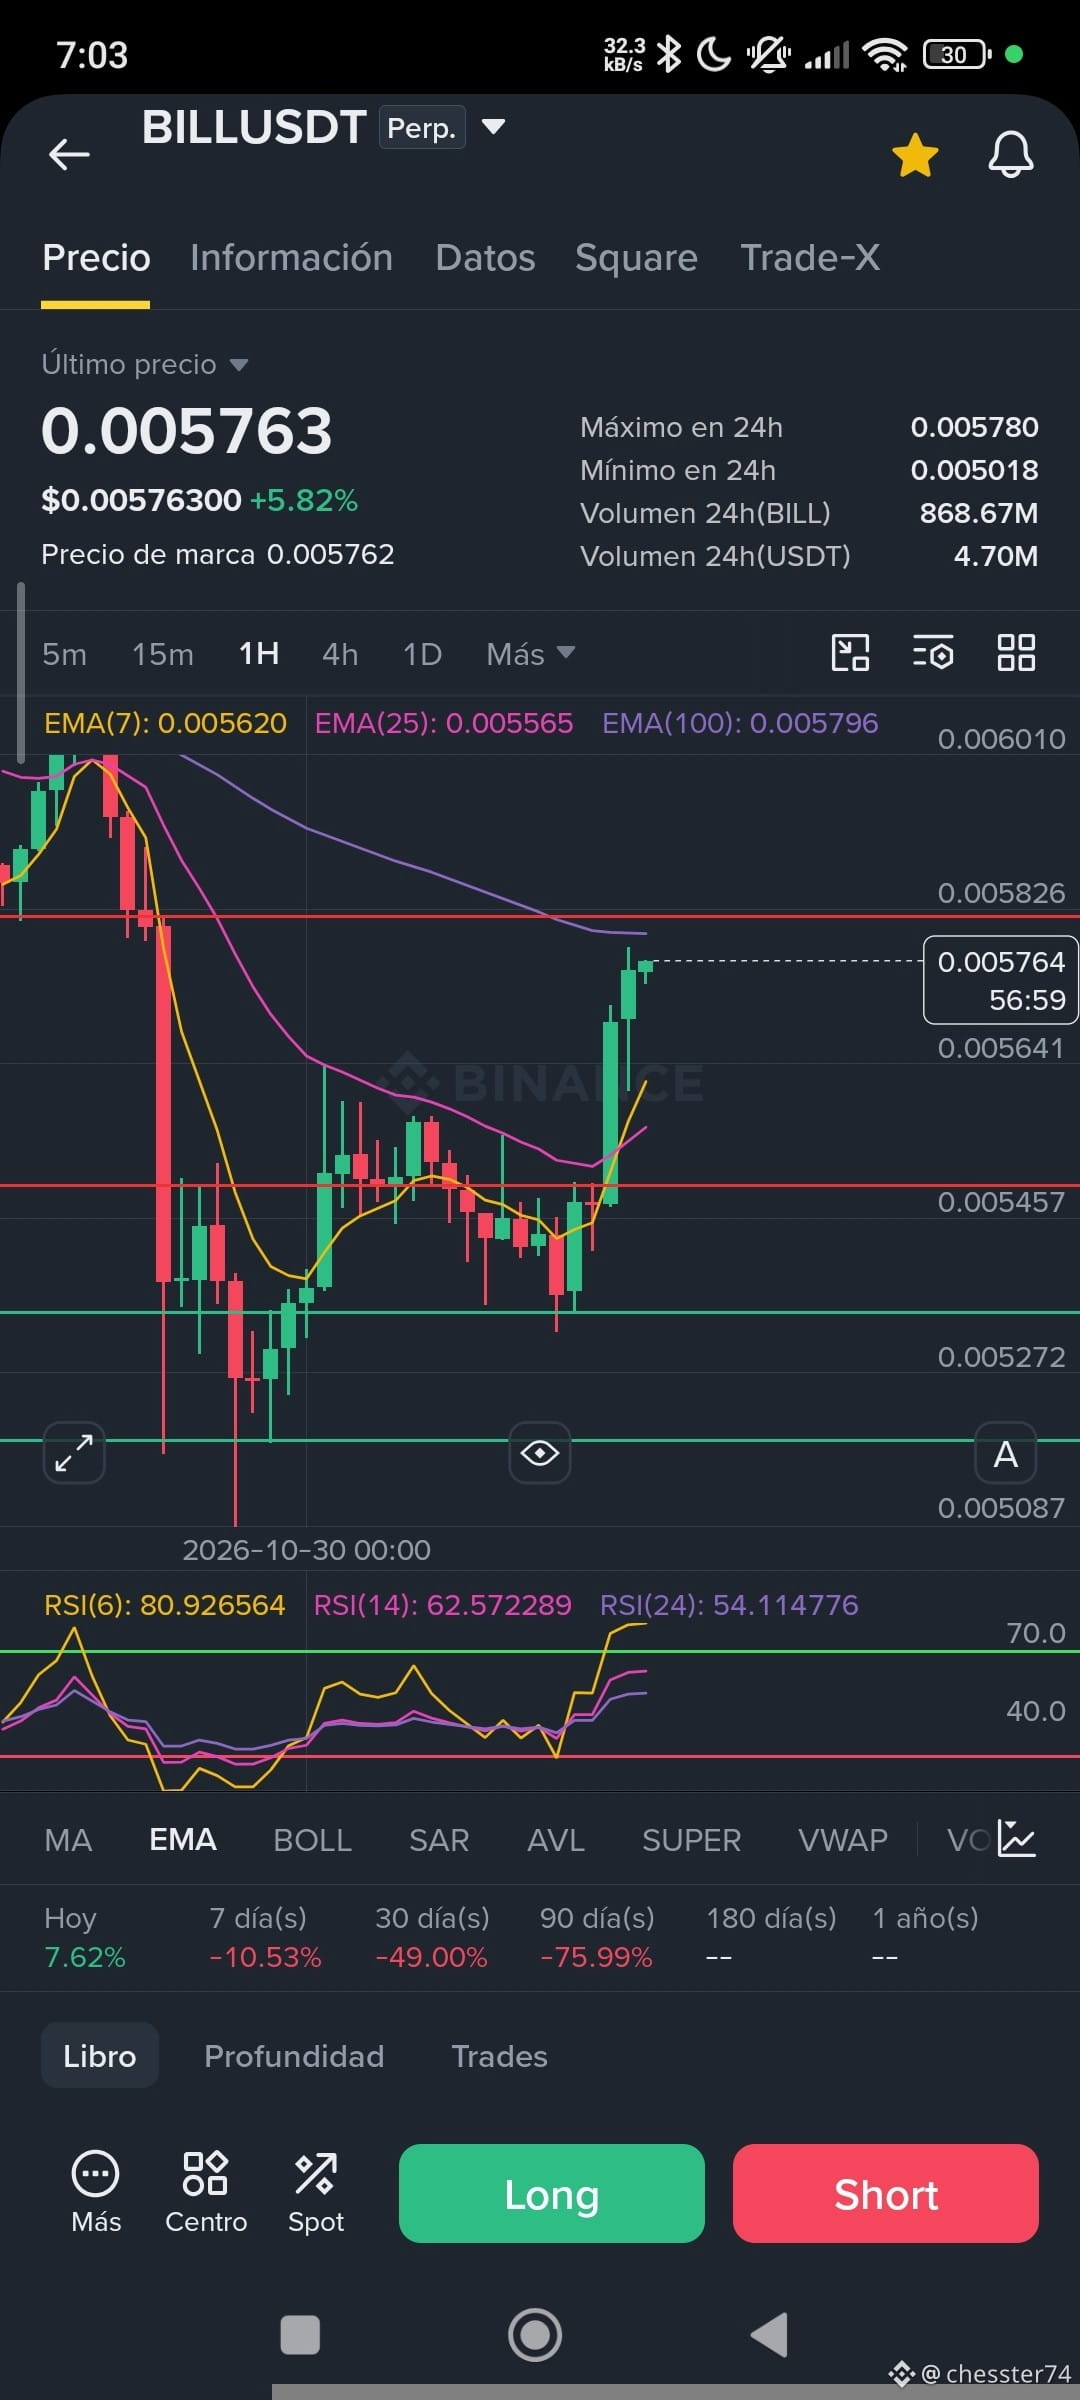
1. The price has been in a downward trend for weeks, but in a single candle, demand managed to push the price up, forming an engulfing candle. Basically, what the bears did over a week, the bulls managed to reverse in a single week.
2. An uptrend is an impulse, followed by a pullback, and then it continues. In this case, I drew a trend line, the price reached that area, and demand managed to defend the uptrend line.
Now I’m waiting for the price to get close to the EMA 100, because that would be the second impulse, HH (Higher High), meaning a high higher than the previous one.
🤔 Do you think it’s time to go long, or should we wait for a pullback on a lower time frame?
It’s a shame I couldn’t share the information when I entered the trade because of the electricity issues 💡 I’ve hardly shared any trades since then. The most recent one was when I was analyzing BTC and wanted to do some scalping, but it didn’t work out 😅 and the one before that was $AKE where I was applying a strategy. In the comments, you helped me identify that I was wrong on that trade because it wasn’t a support level. We’re getting better, step by step.
But anyway, I wanted to share that I was analyzing this chart, and based on my technical analysis, I think the price will go up because:
1. The price has been in a downward trend for weeks, but in a single candle, demand managed to push the price up, forming an engulfing candle. Basically, what the bears did over a week, the bulls managed to reverse in a single week.
2. An uptrend is an impulse, followed by a pullback, and then it continues. In this case, I drew a trend line, the price reached that area, and demand managed to defend the uptrend line.
Now I’m waiting for the price to get close to the EMA 100, because that would be the second impulse, HH (Higher High), meaning a high higher than the previous one.
🤔 Do you think it’s time to go long, or should we wait for a pullback on a lower time frame?

chesster74
·
--
Bullish$BILL 🤔 Trade summary
The strategy I’m applying is helping me find opportunities in the market.
Now, looking back at the attempts I’ve made, I’ve noticed that when I lose, I look for some justification to avoid accepting the loss. For example, “I lost this trade because the price hit the SL.” I should have added that indicator, or I didn’t see that support level, among other things. I think that’s a mistake; I should just minimize losses.
So I’ll keep applying the strategy with leverage, and all that’s left is to wait.
I’ll try applying the strategy on the 1H timeframe, in a day-trading style.
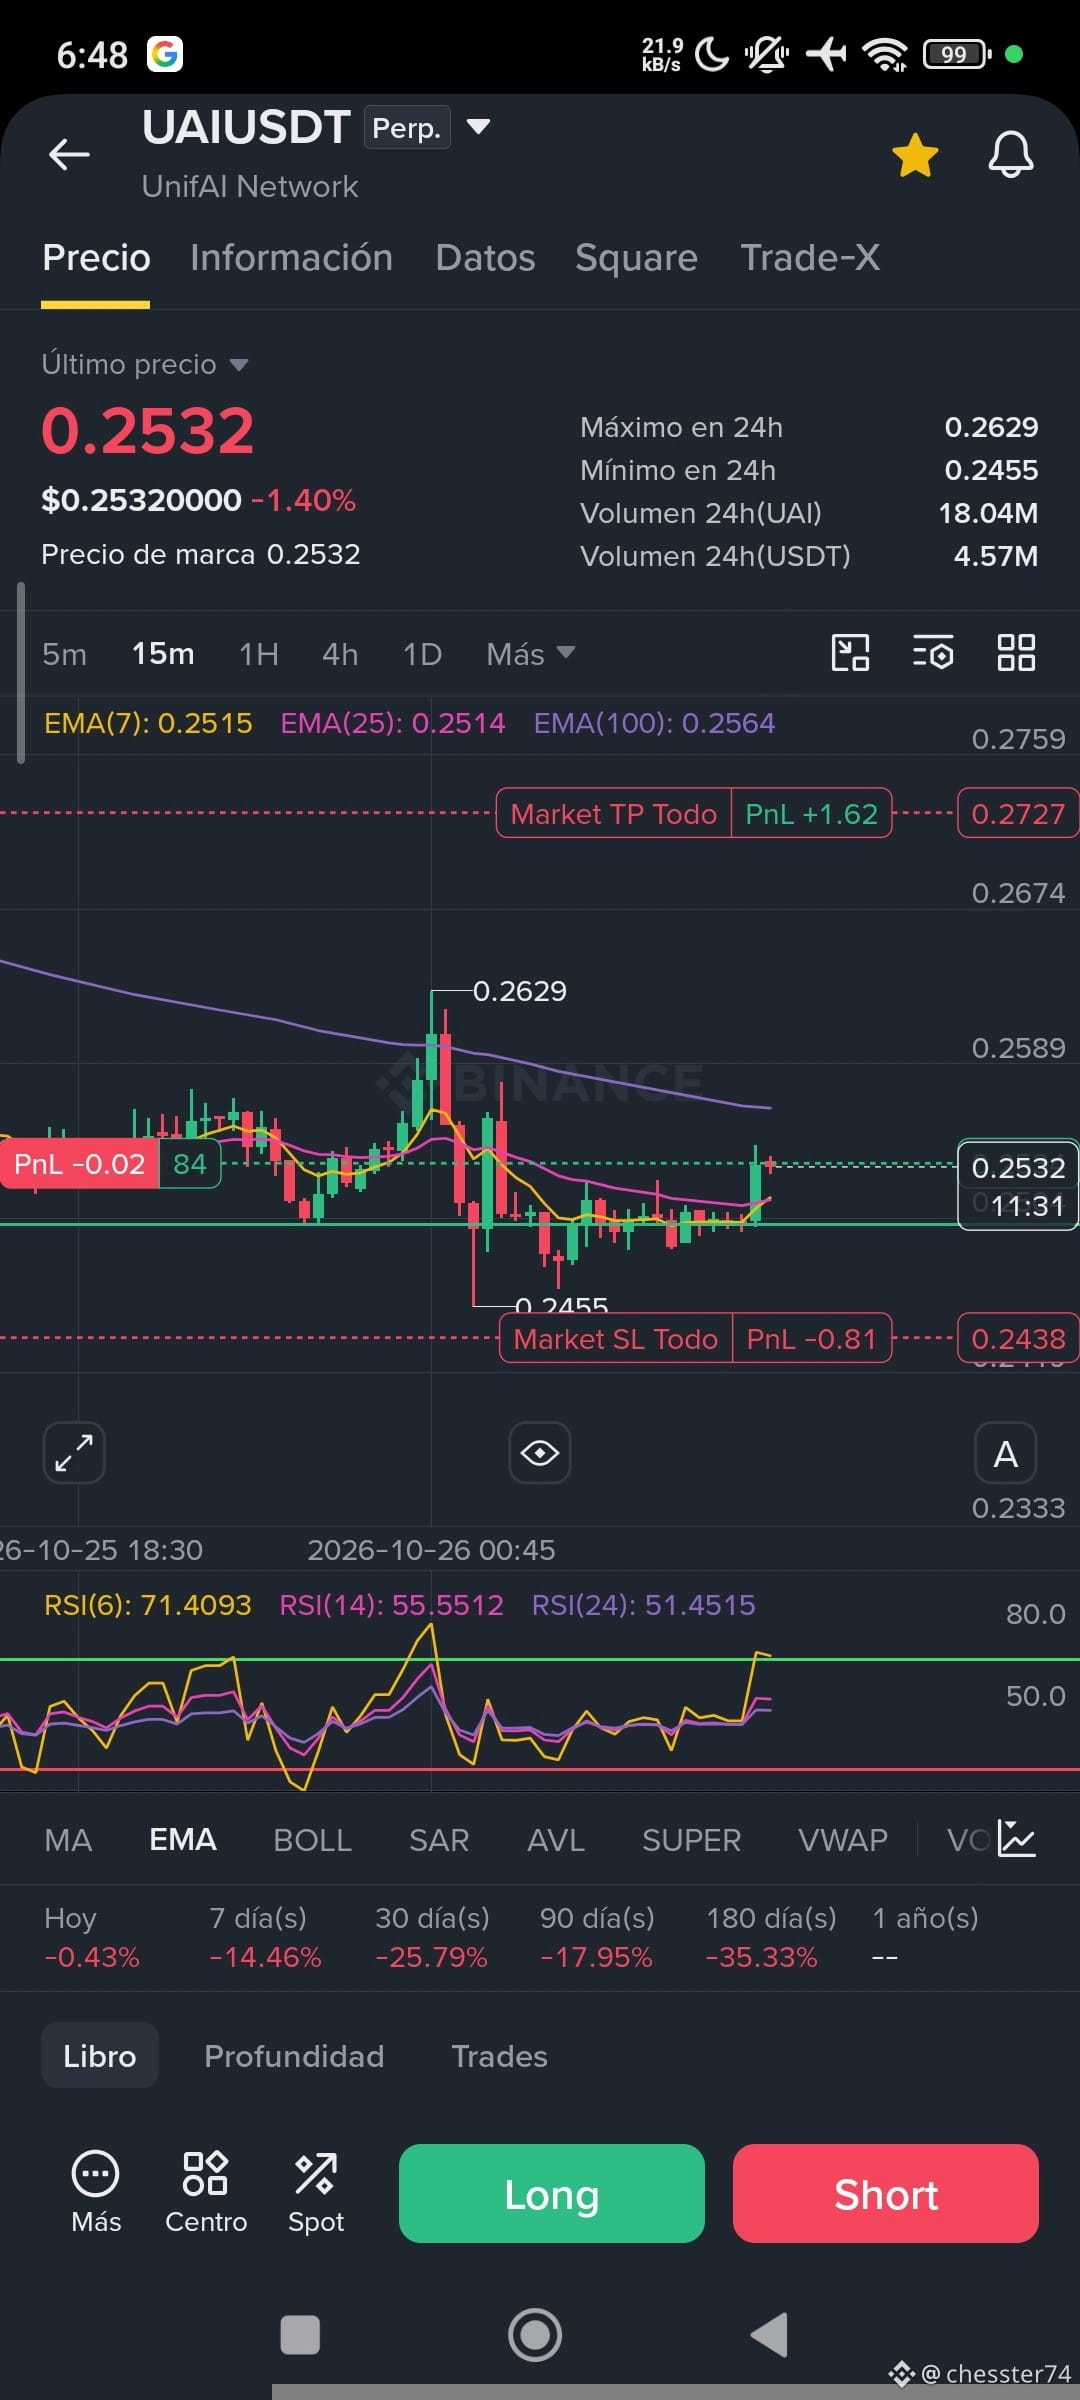
I’m currently in a trade on BILL.
The strategy I came up with to find an opportunity was as follows:
✅Step 1: Find an oversold market
✅Step 2: Draw a support level
👀Step 3: Deceleration (the step before a reversal; the price may or may not reach the support level and decelerate)
👀Step 4: Reversal candle
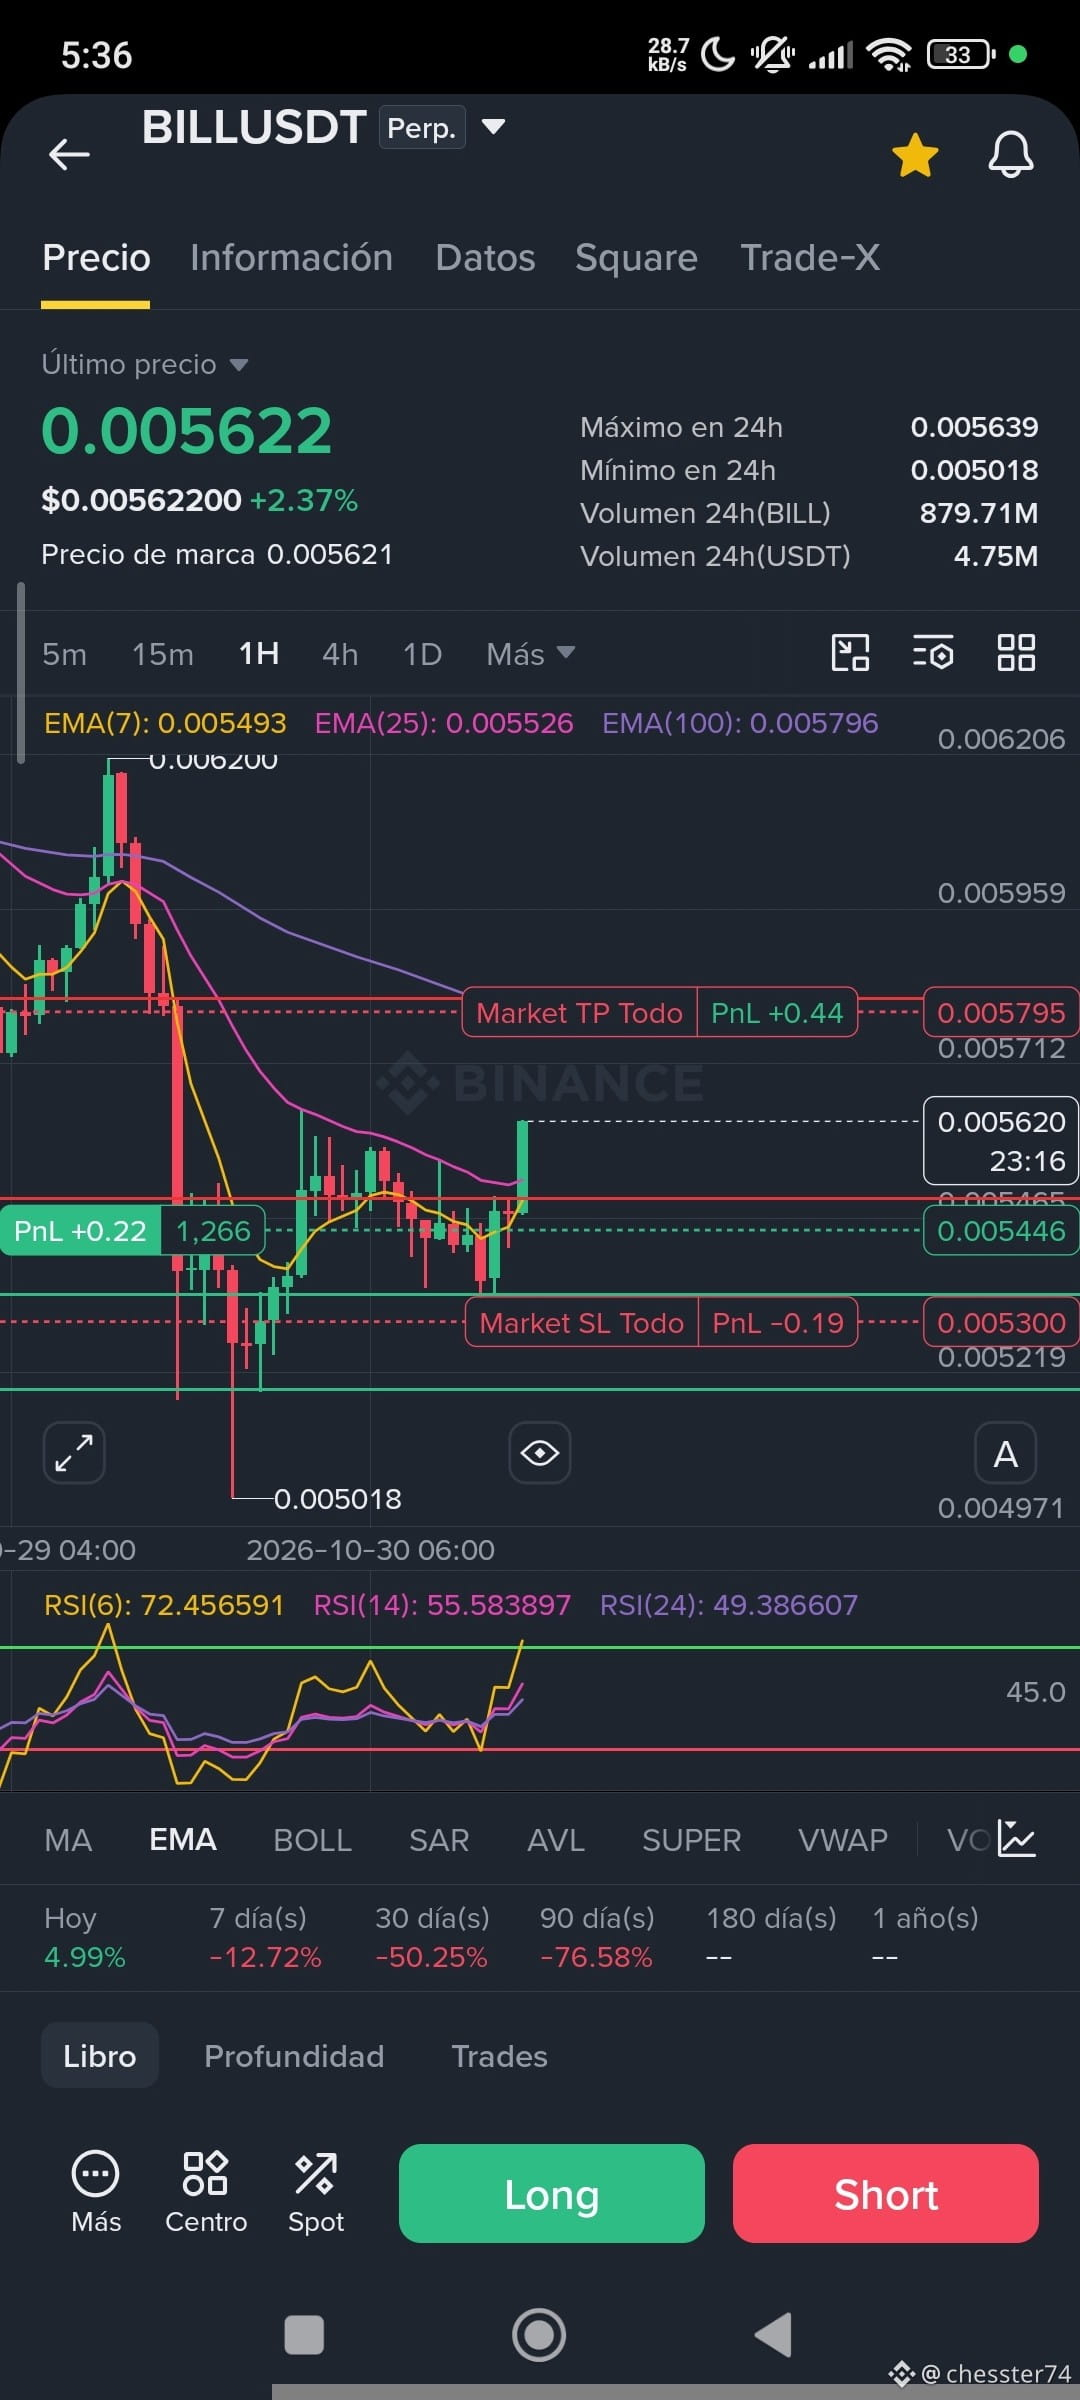
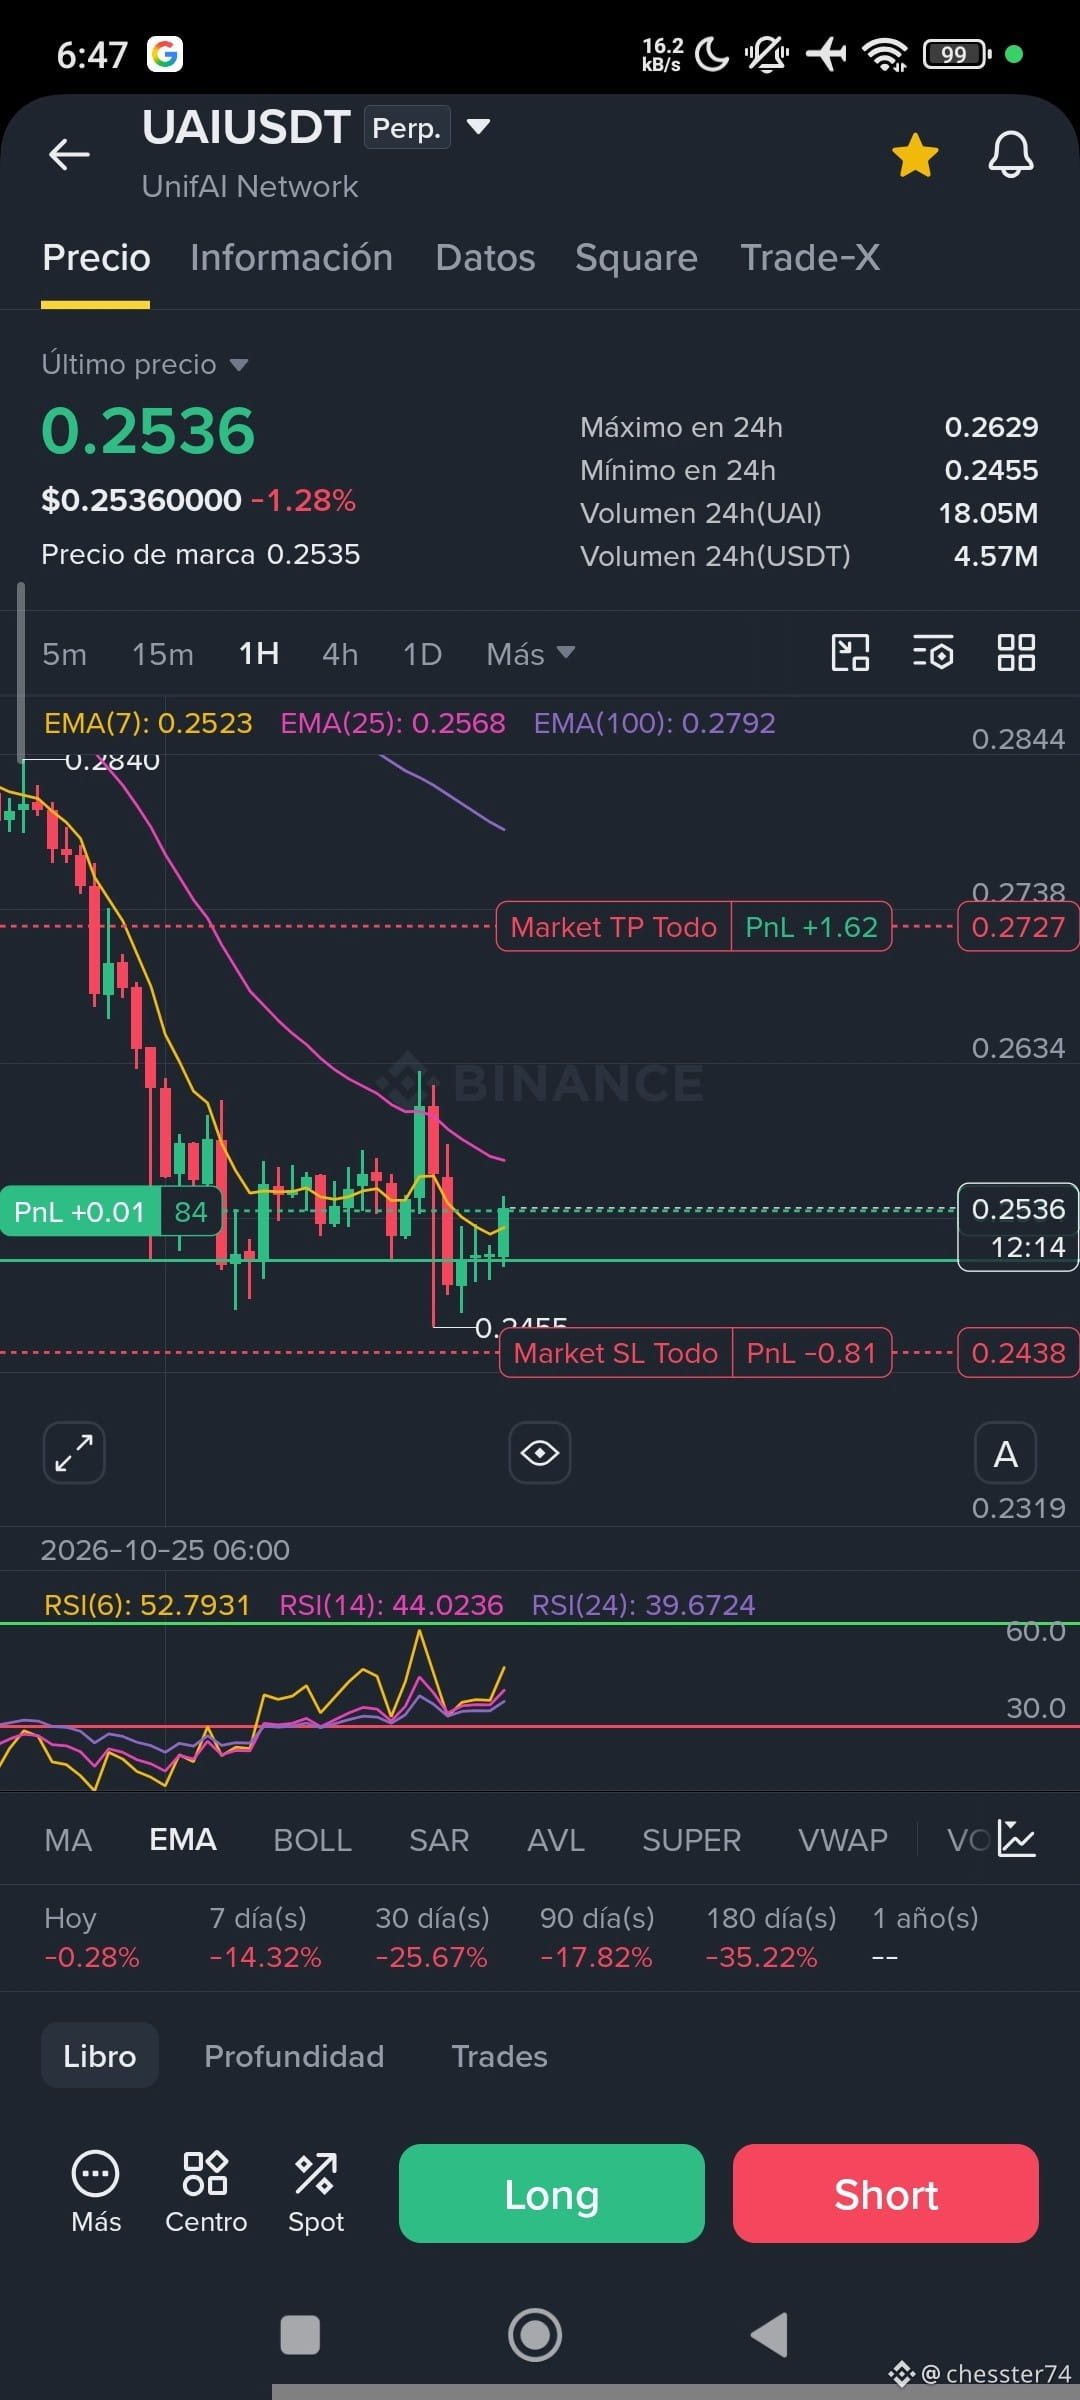
The first move was from the support level up to the 25 EMA, and I missed that trade. But I see that the price is still oversold, so I draw a support level higher than the one I drew before. A reversal candle appears, and I enter the market.
SL below the low and TP at the next resistance level. With lower leverage, I should be able to manage the position better. Now I’m waiting to see the results.
I think the key is to repeat exactly the strategy I’m using across several trades. That way, I think I’ll be able to become profitable and recover from my losses 😅.
Do you think it’s time to go Long, Short, or wait for confirmation? Remember to do your own research (DYOR).
The strategy I’m applying is helping me find opportunities in the market.
Now, looking back at the attempts I’ve made, I’ve noticed that when I lose, I look for some justification to avoid accepting the loss. For example, “I lost this trade because the price hit the SL.” I should have added that indicator, or I didn’t see that support level, among other things. I think that’s a mistake; I should just minimize losses.
So I’ll keep applying the strategy with leverage, and all that’s left is to wait.
I’ll try applying the strategy on the 1H timeframe, in a day-trading style.
I’m currently in a trade on BILL.
The strategy I came up with to find an opportunity was as follows:
✅Step 1: Find an oversold market
✅Step 2: Draw a support level
👀Step 3: Deceleration (the step before a reversal; the price may or may not reach the support level and decelerate)
👀Step 4: Reversal candle
The first move was from the support level up to the 25 EMA, and I missed that trade. But I see that the price is still oversold, so I draw a support level higher than the one I drew before. A reversal candle appears, and I enter the market.
SL below the low and TP at the next resistance level. With lower leverage, I should be able to manage the position better. Now I’m waiting to see the results.
I think the key is to repeat exactly the strategy I’m using across several trades. That way, I think I’ll be able to become profitable and recover from my losses 😅.
Do you think it’s time to go Long, Short, or wait for confirmation? Remember to do your own research (DYOR).
chesster74
·
--
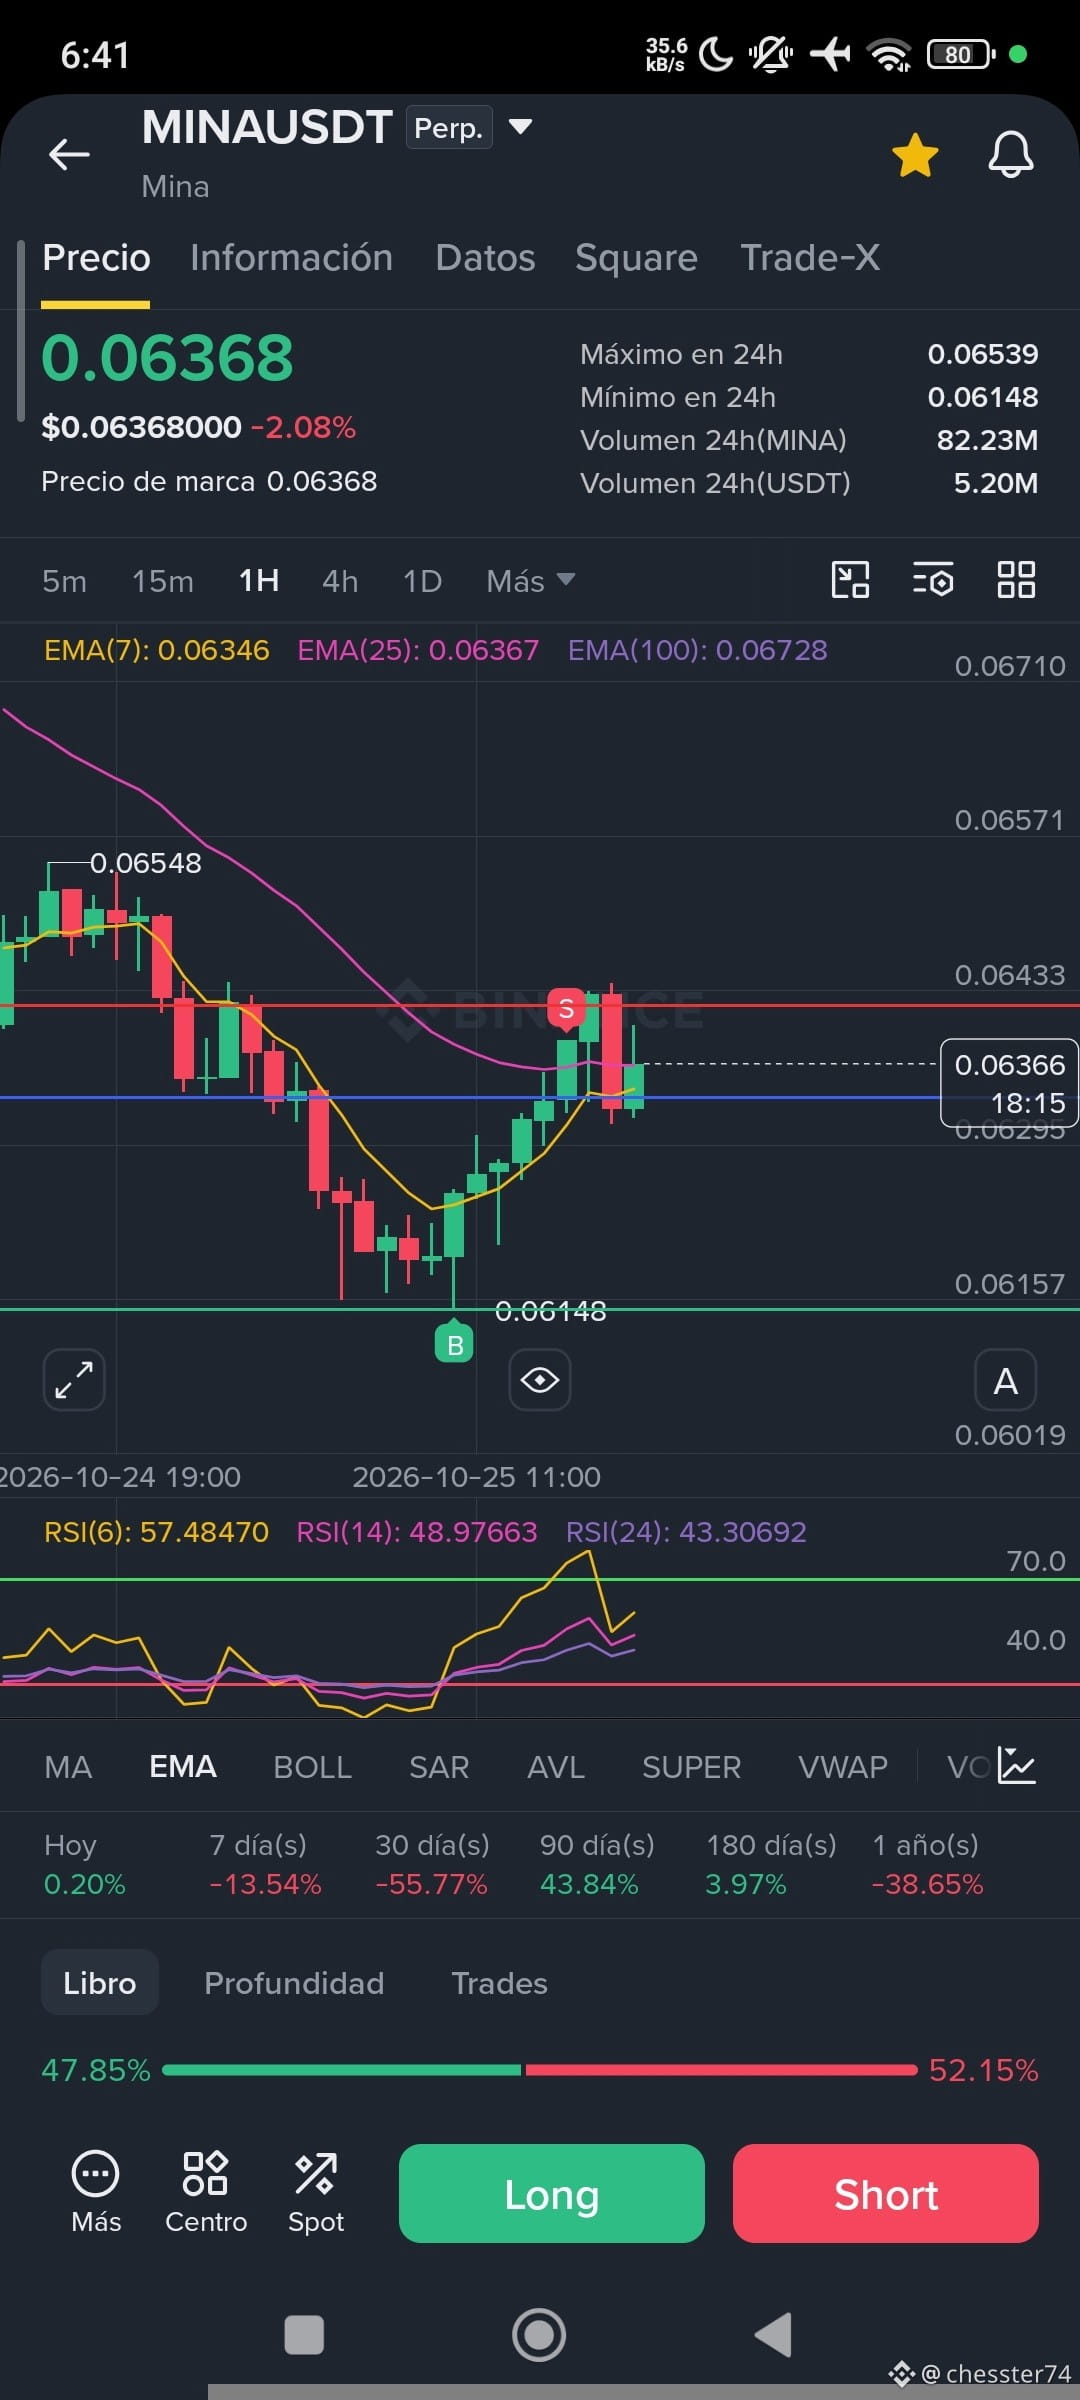
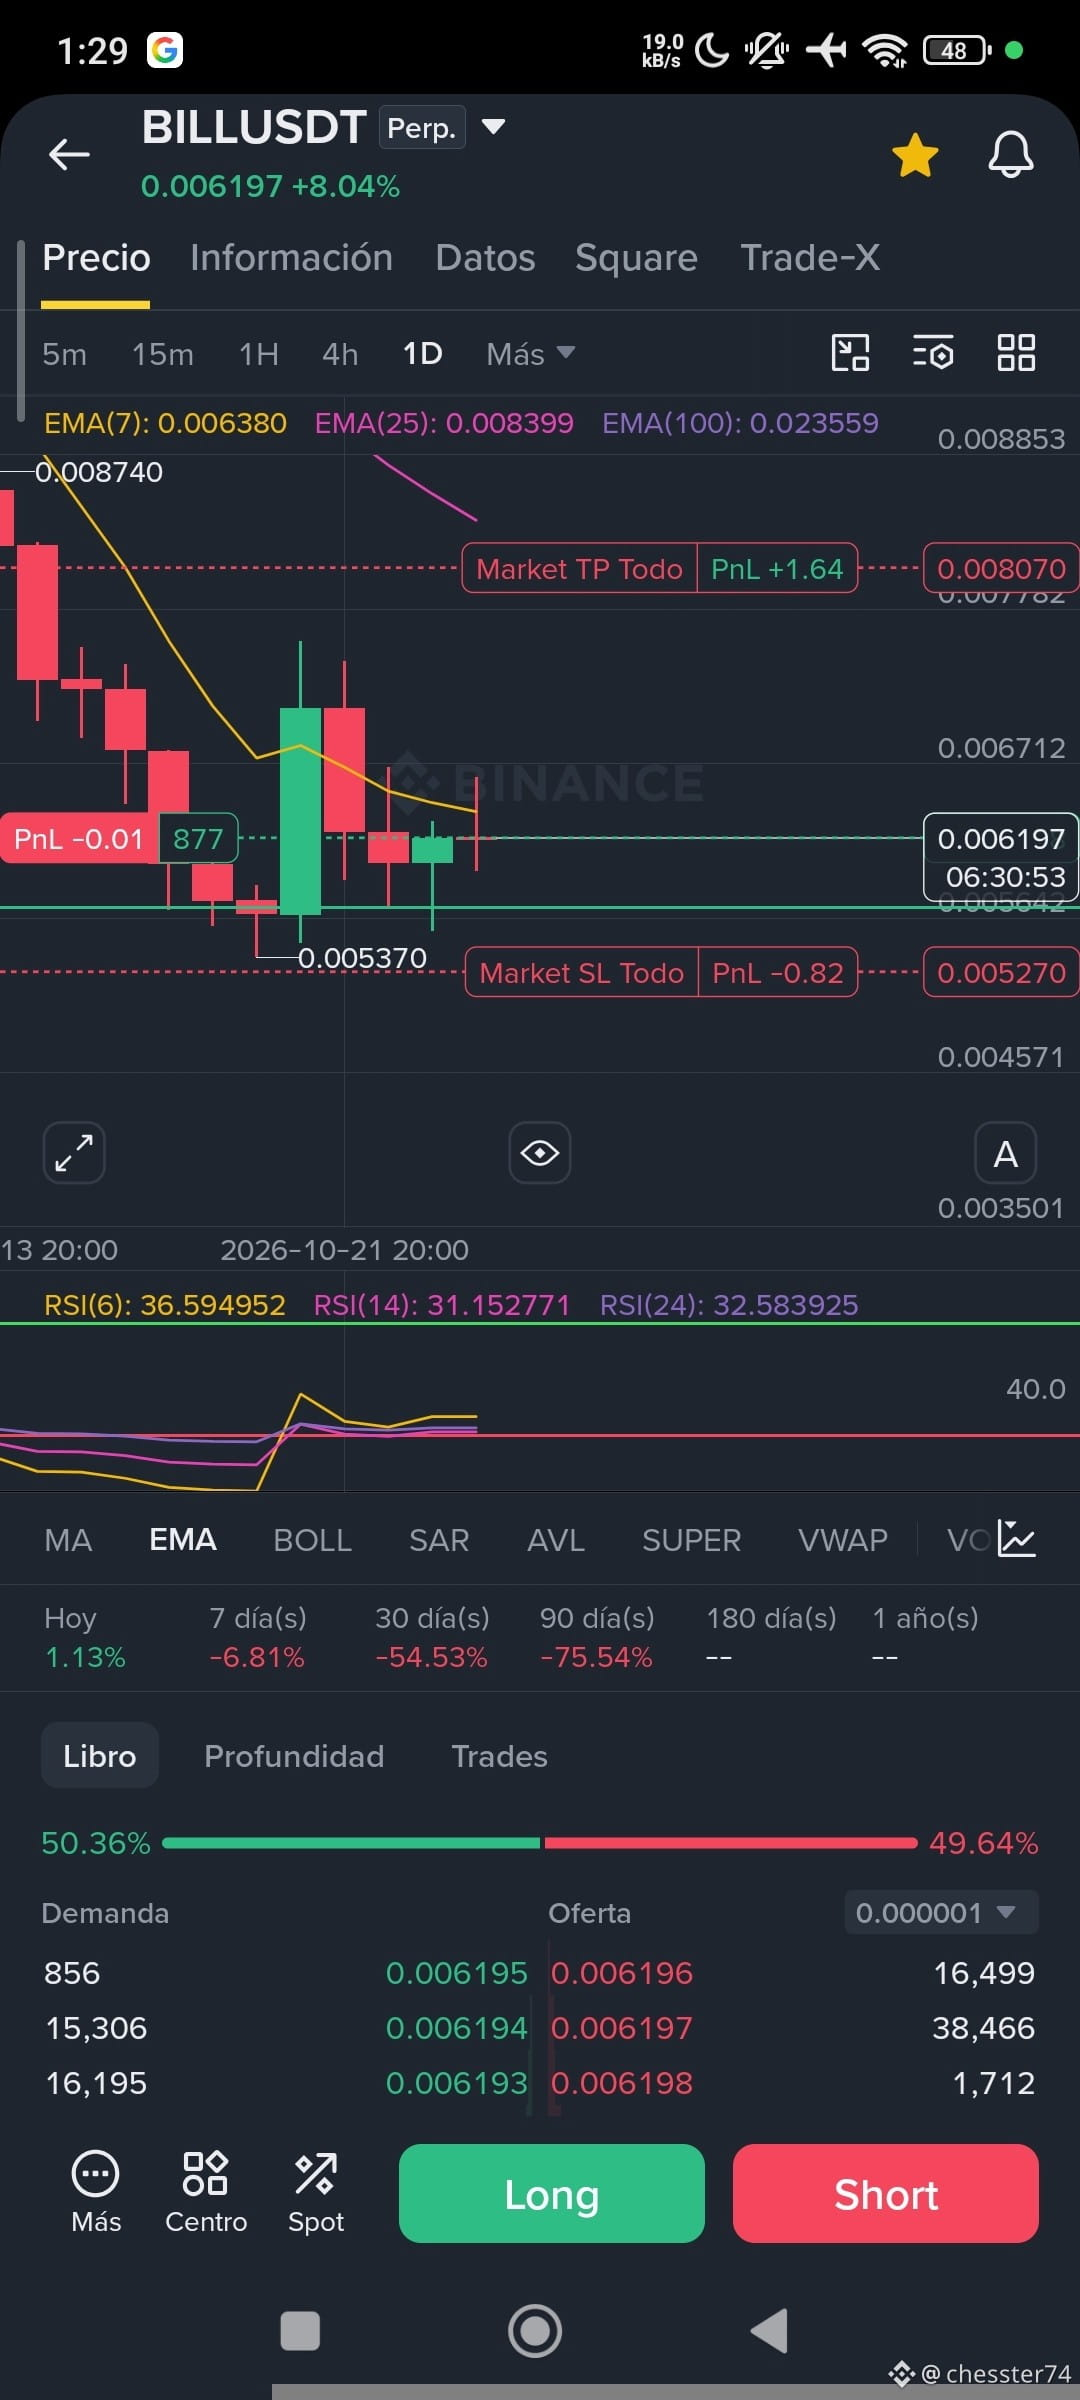
Bullish$UAI 📚 Trying a new strategy, attempt number 10
Let's take another trade to bring the total to 3 trades using the idea.
Now I wait for the market to decide. Happy Sunday 👋 Remember to do your own research (DYOR)
Let's take another trade to bring the total to 3 trades using the idea.
Now I wait for the market to decide. Happy Sunday 👋 Remember to do your own research (DYOR)
chesster74
·
--
Bullish$MINA Applying a new strategy, attempt number 8
In my previous attempt, the mistake was how I managed the trade.
This time, I’m aiming for a 1:2 risk-reward ratio instead of 1:3.
✅ Step 1: Find an oversold market
✅ Step 2: Find a support level
👀 Step 3: Deceleration (may or may not occur)
👀 Step 4: Reversal candle
Okay, let’s review 📝
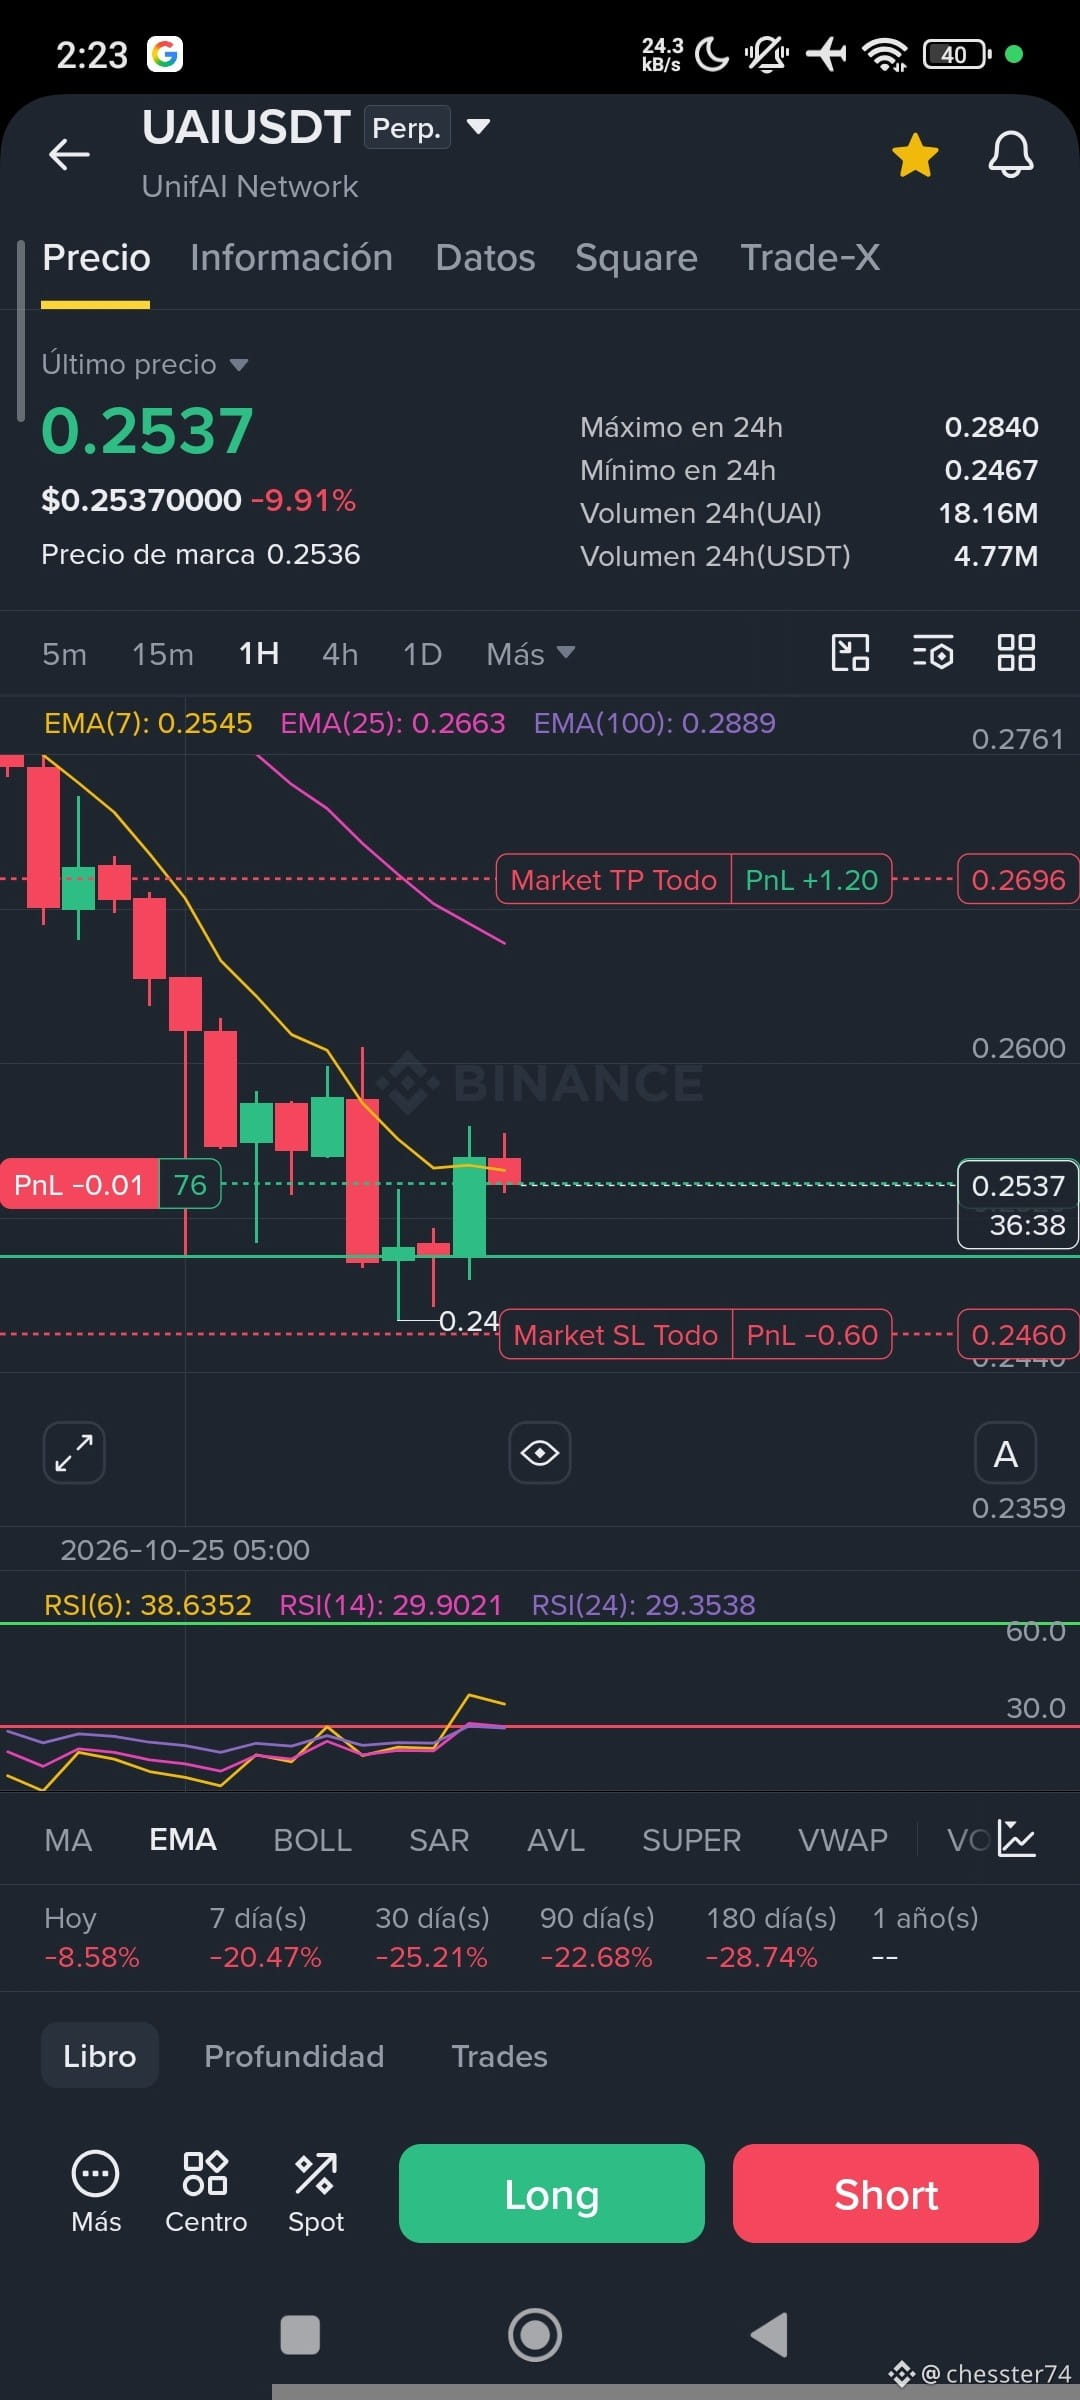
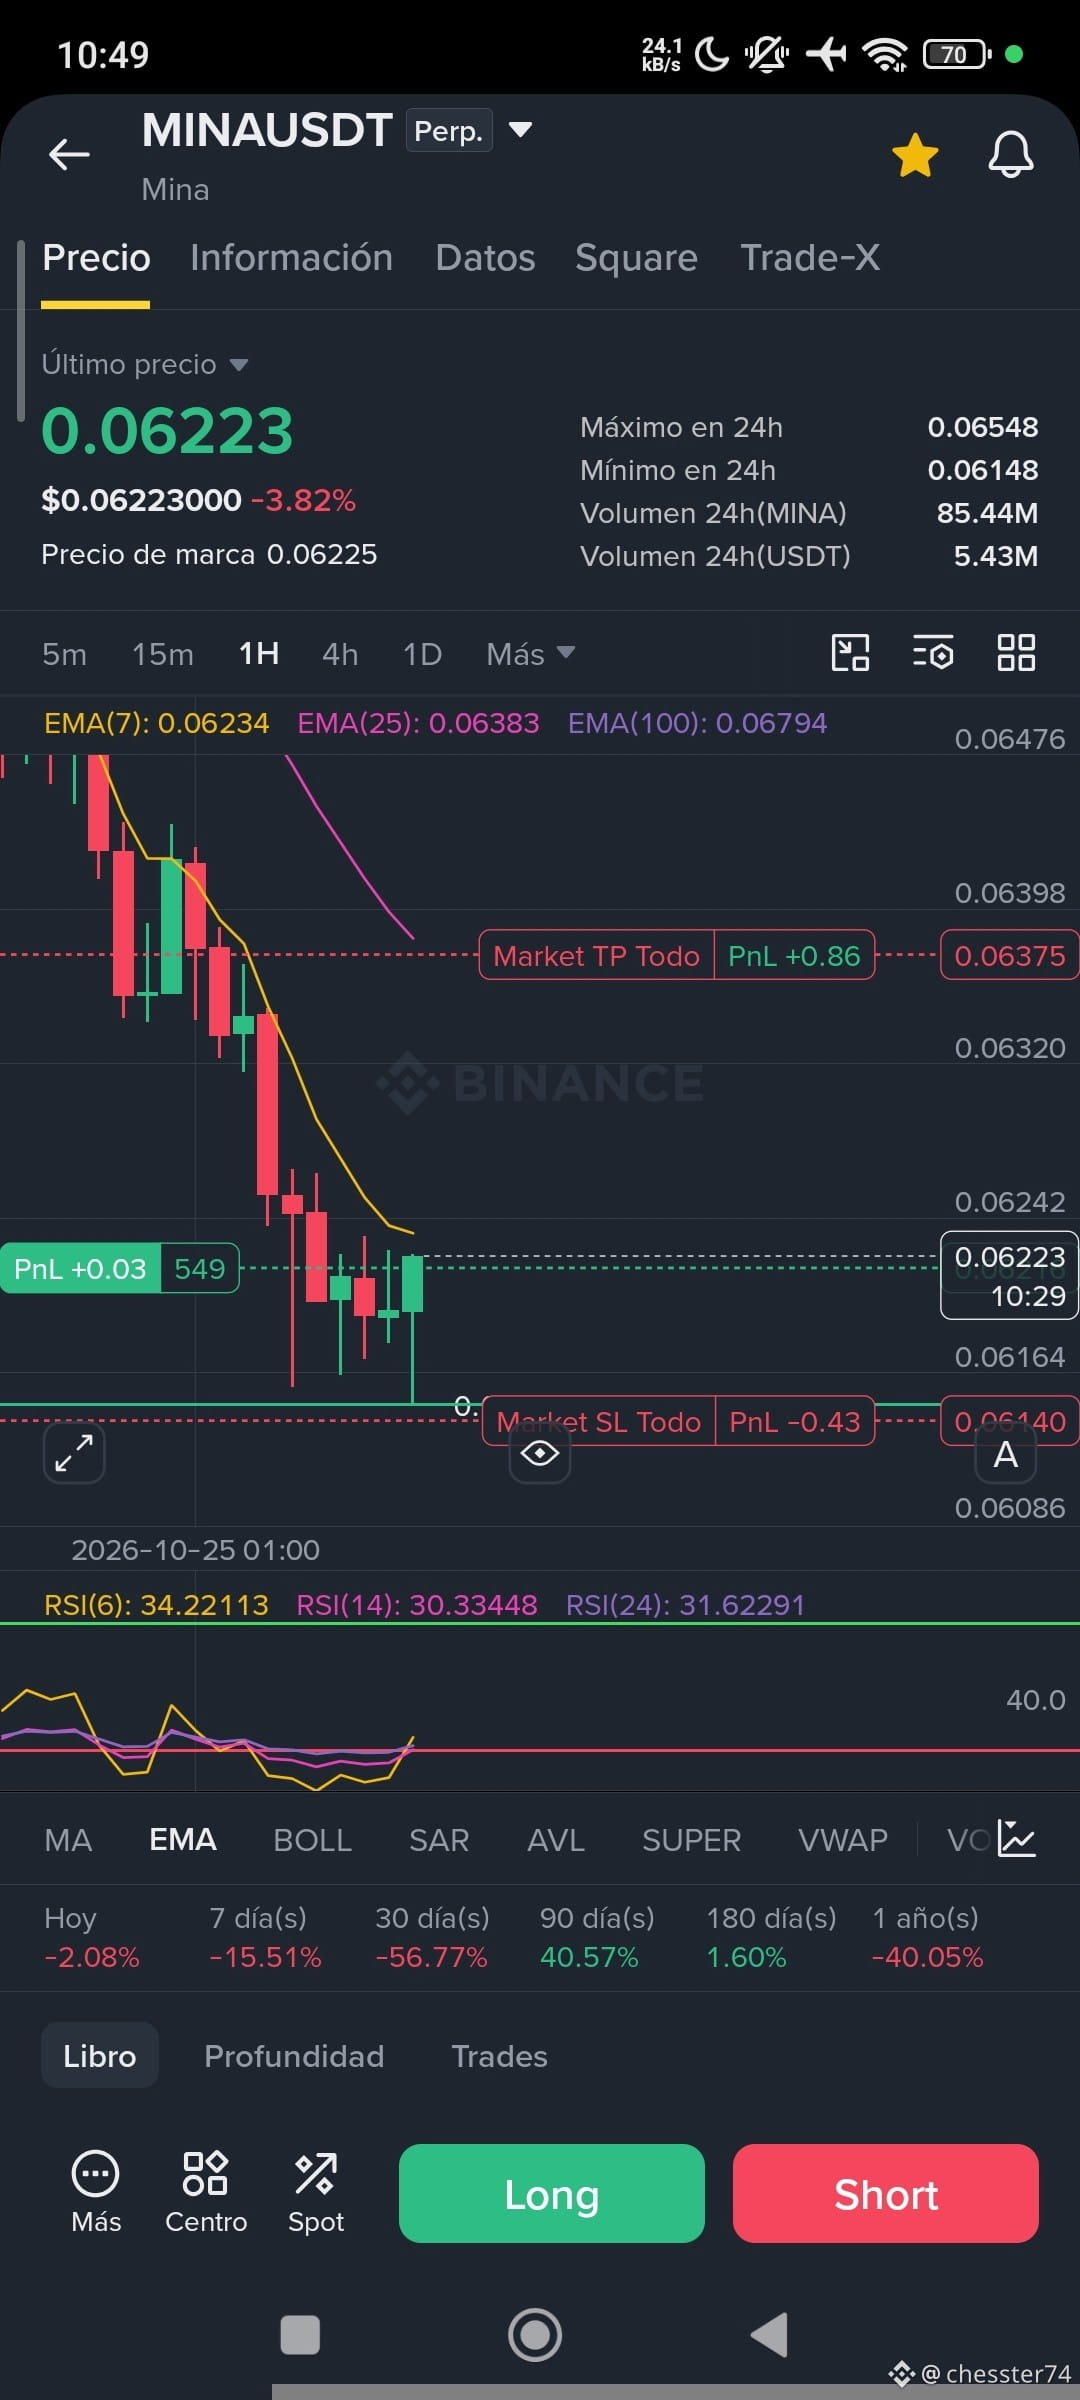
1. 🤔 Is MINA oversold? The RSI indicates it’s below 30.
On which timeframe?
1H timeframe
2. I’m looking for a support level on the 1H timeframe. Done.
3. Is there deceleration?
Yes, there are candles with small bodies and long wicks, forming a doji-like candle.
4. Is there a reversal candle?
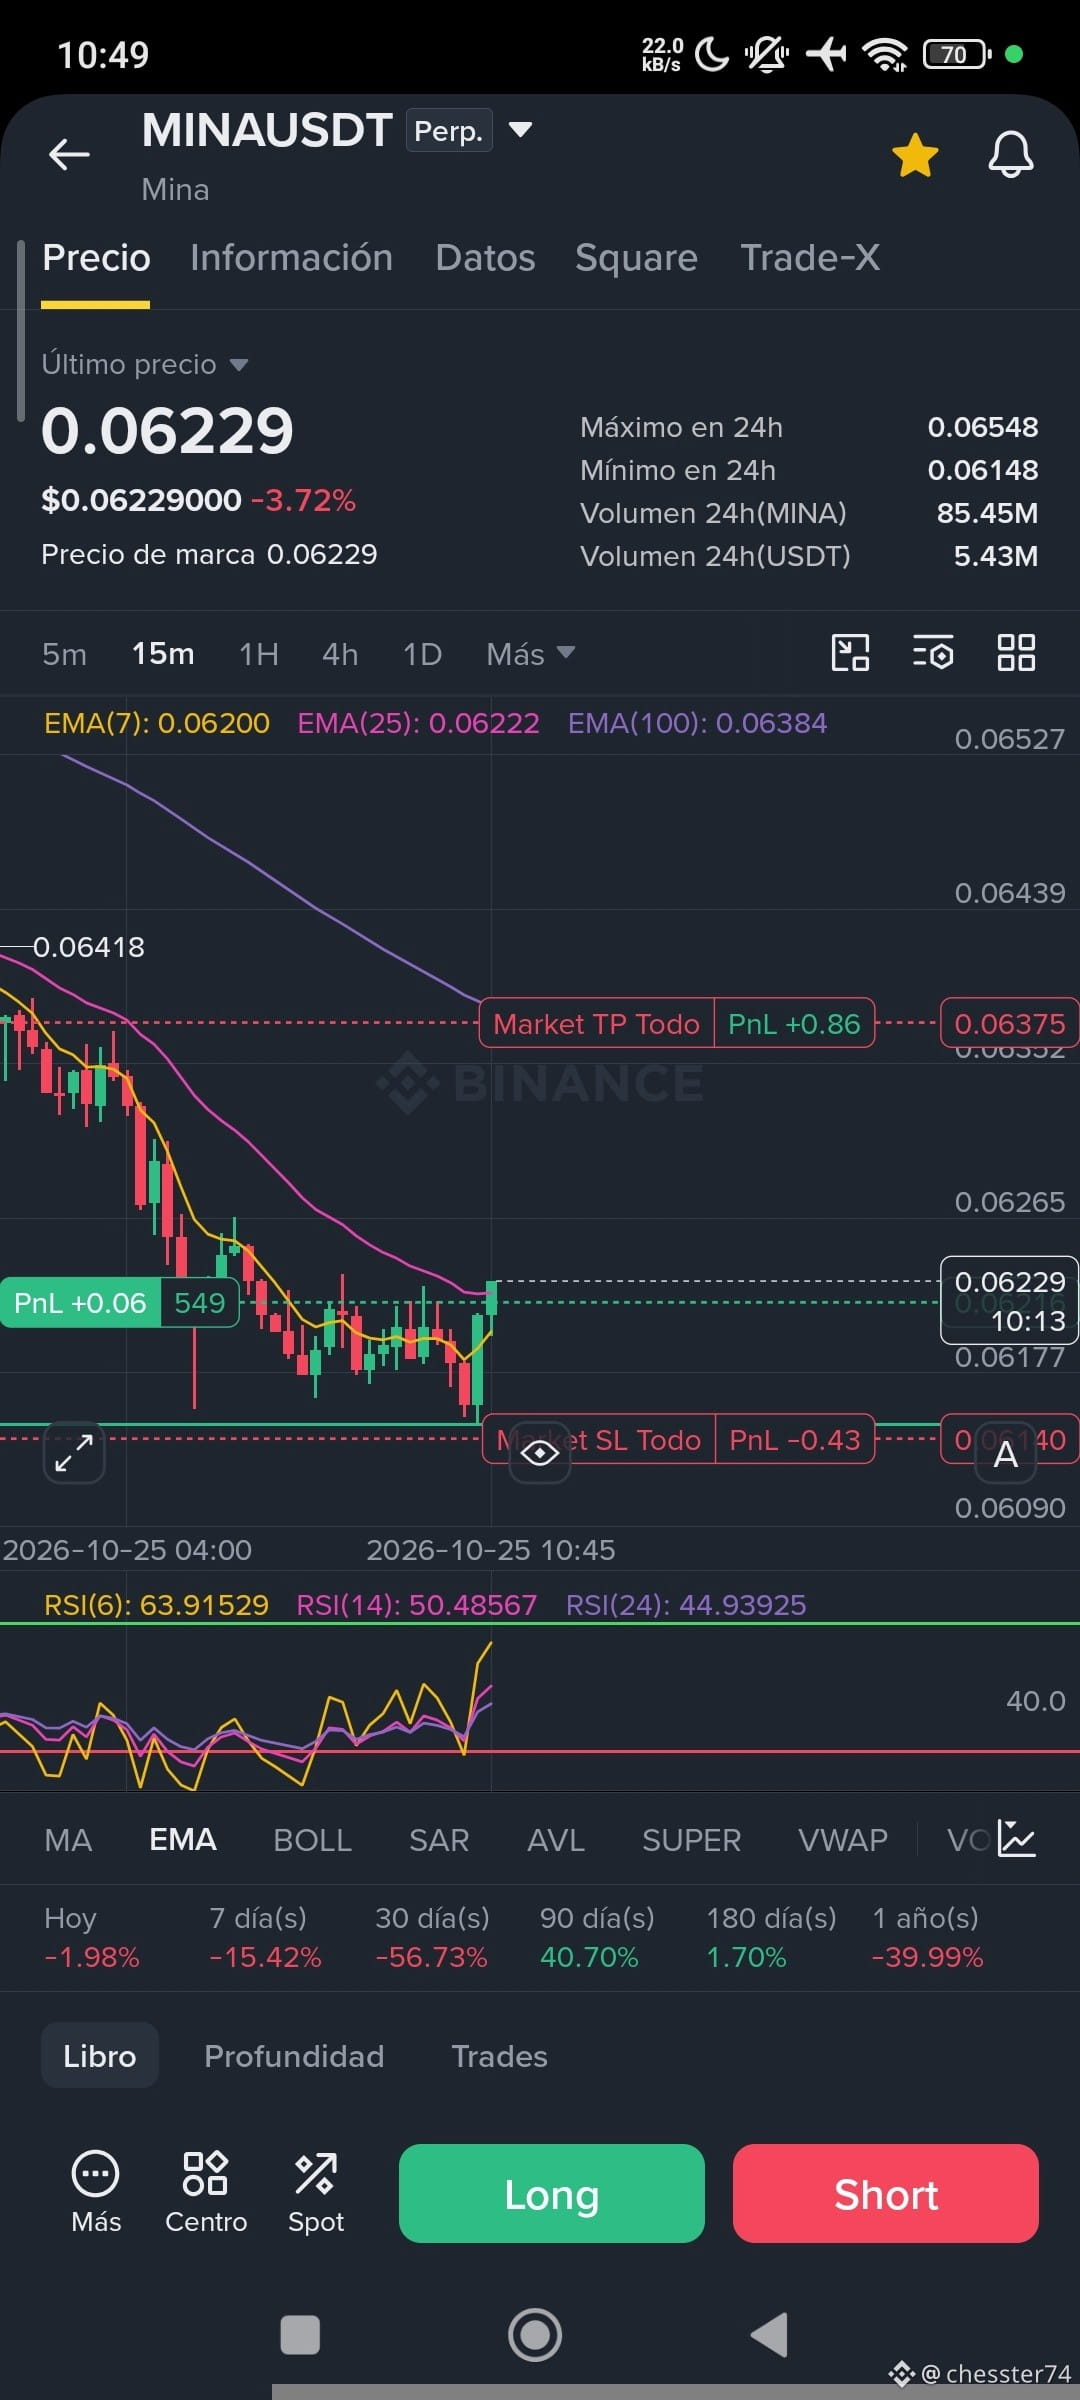
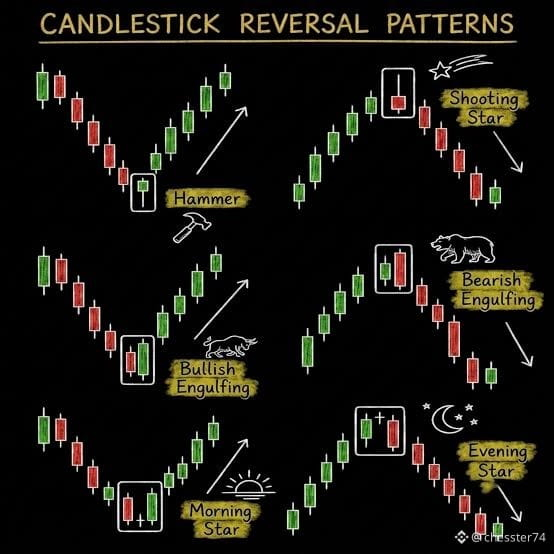
Yes, a potential hammer is forming on the 1H timeframe. The candle hasn’t closed yet, but I’m entering the market because there’s deceleration on the 1H timeframe (a step before a reversal). I’m looking for a reversal candle on the 15m timeframe to get a better entry.
There’s a bullish engulfing candle on the 15m timeframe. I place my SL below the recent low, aiming for 1:2.
Now all that’s left is to wait.
Do you see a bullish move? Remember to do your own research (DYOR).
In my previous attempt, the mistake was how I managed the trade.
This time, I’m aiming for a 1:2 risk-reward ratio instead of 1:3.
✅ Step 1: Find an oversold market
✅ Step 2: Find a support level
👀 Step 3: Deceleration (may or may not occur)
👀 Step 4: Reversal candle
Okay, let’s review 📝
1. 🤔 Is MINA oversold? The RSI indicates it’s below 30.
On which timeframe?
1H timeframe
2. I’m looking for a support level on the 1H timeframe. Done.
3. Is there deceleration?
Yes, there are candles with small bodies and long wicks, forming a doji-like candle.
4. Is there a reversal candle?
Yes, a potential hammer is forming on the 1H timeframe. The candle hasn’t closed yet, but I’m entering the market because there’s deceleration on the 1H timeframe (a step before a reversal). I’m looking for a reversal candle on the 15m timeframe to get a better entry.
There’s a bullish engulfing candle on the 15m timeframe. I place my SL below the recent low, aiming for 1:2.
Now all that’s left is to wait.
Do you see a bullish move? Remember to do your own research (DYOR).
chesster74
·
--
Bullish$BANK 📚Trade Analysis
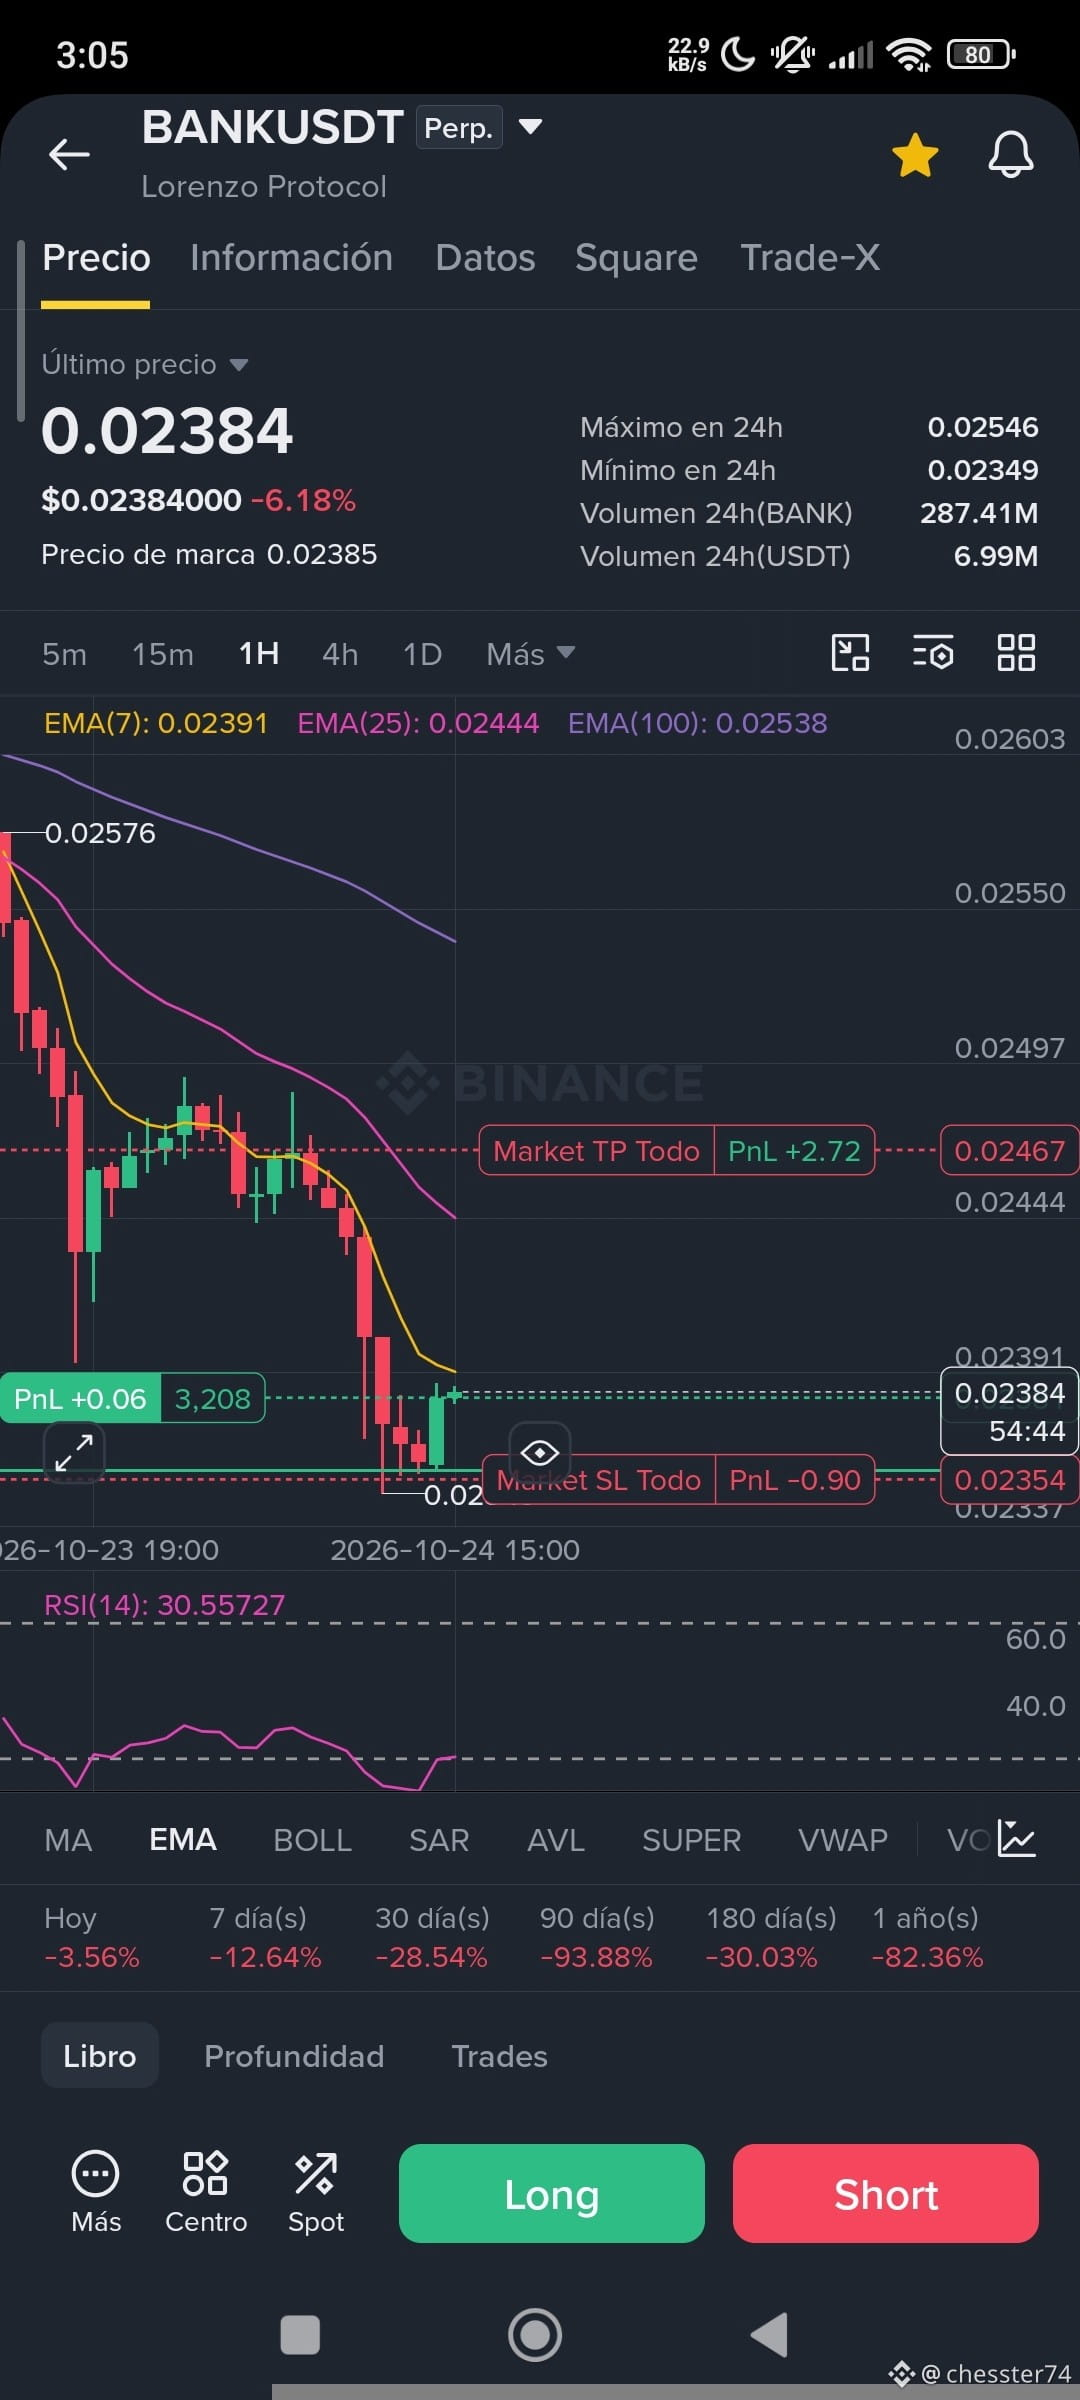
So far, things are going well—the strategy is working, and the price rose just as I thought it would.
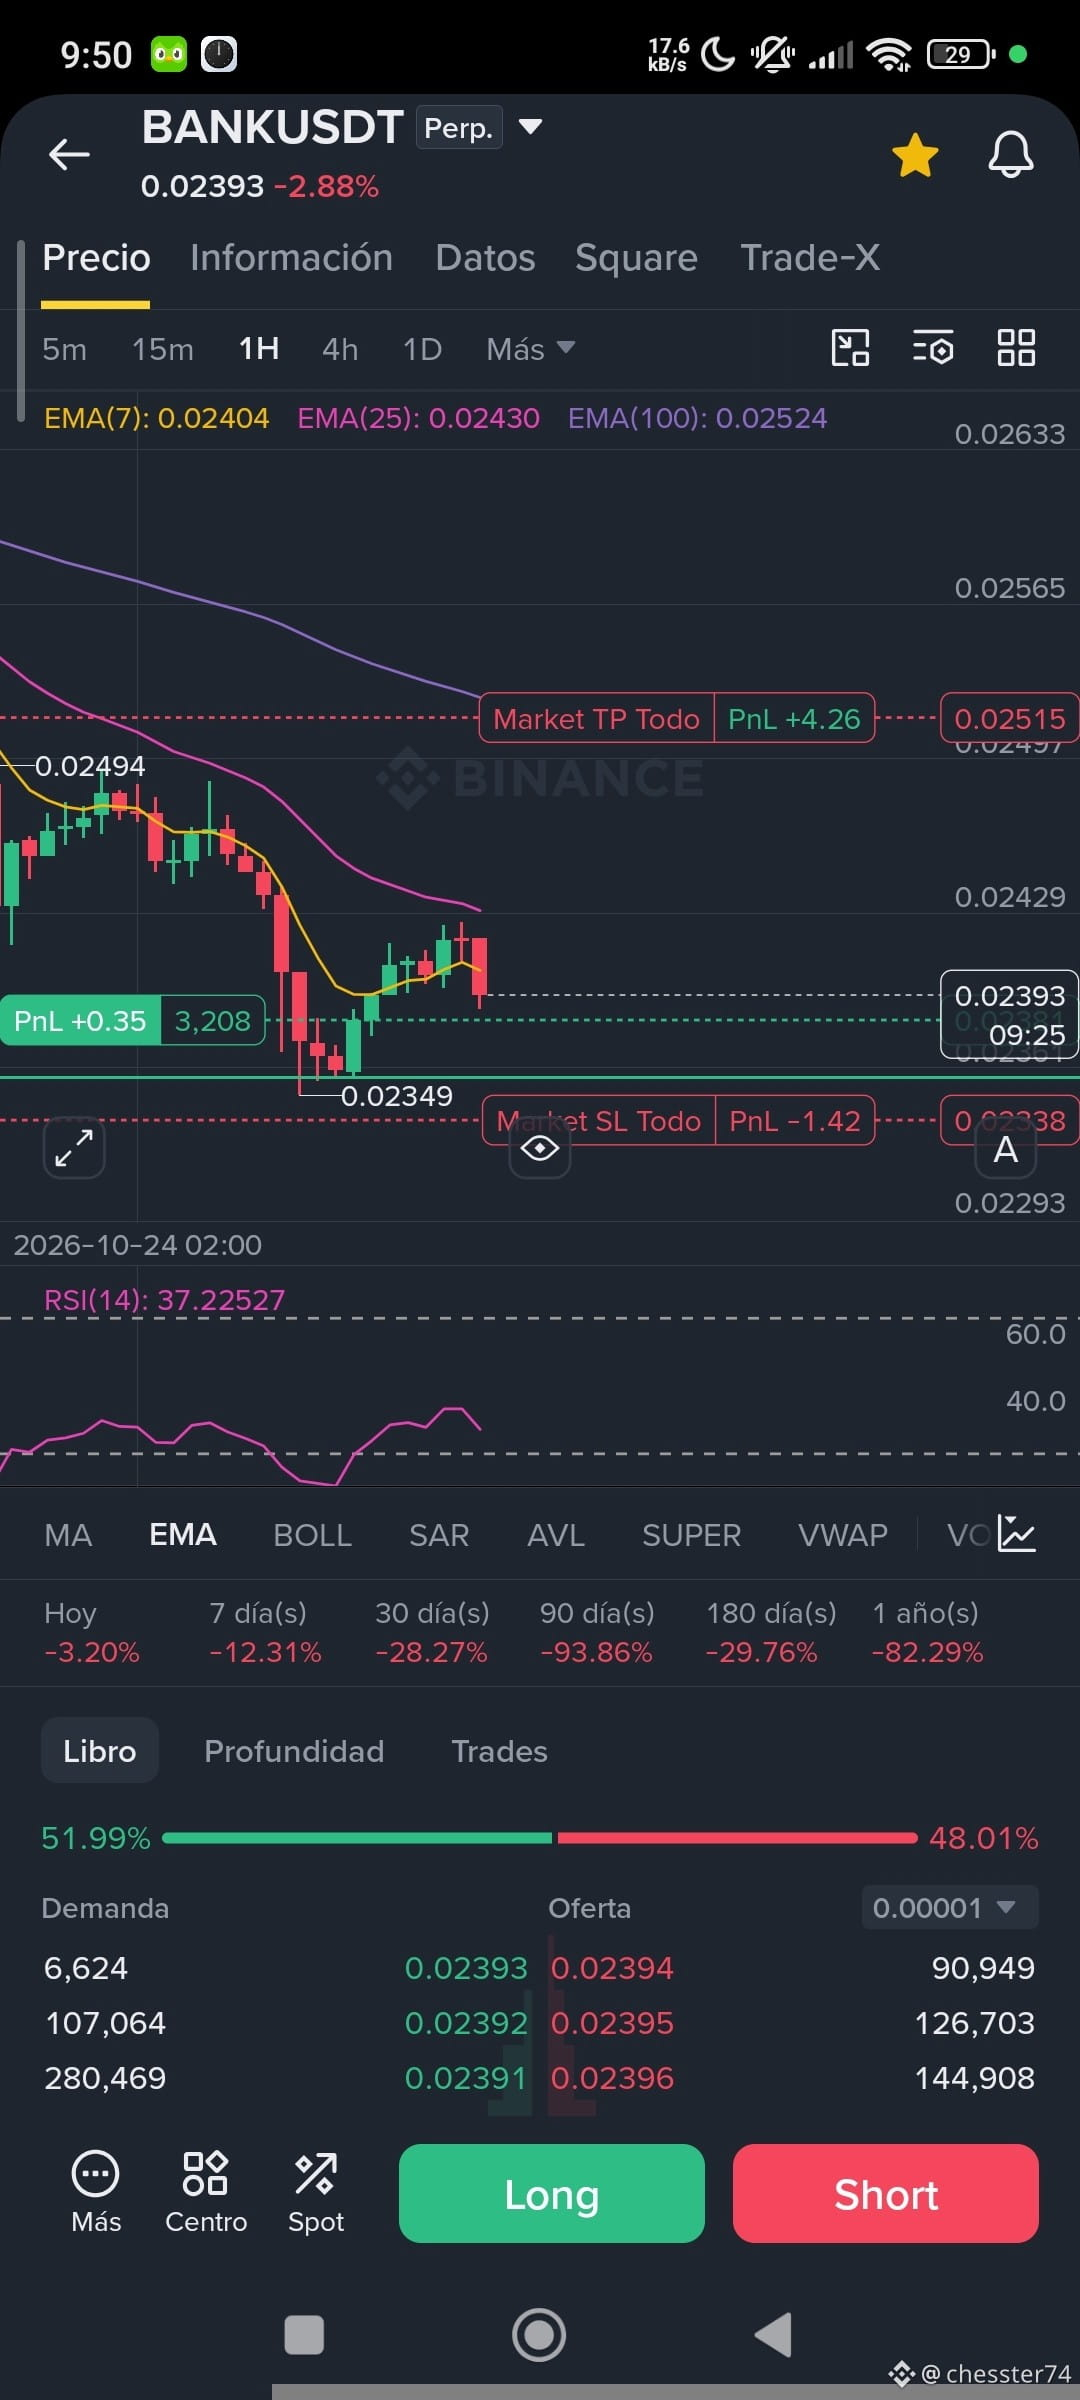
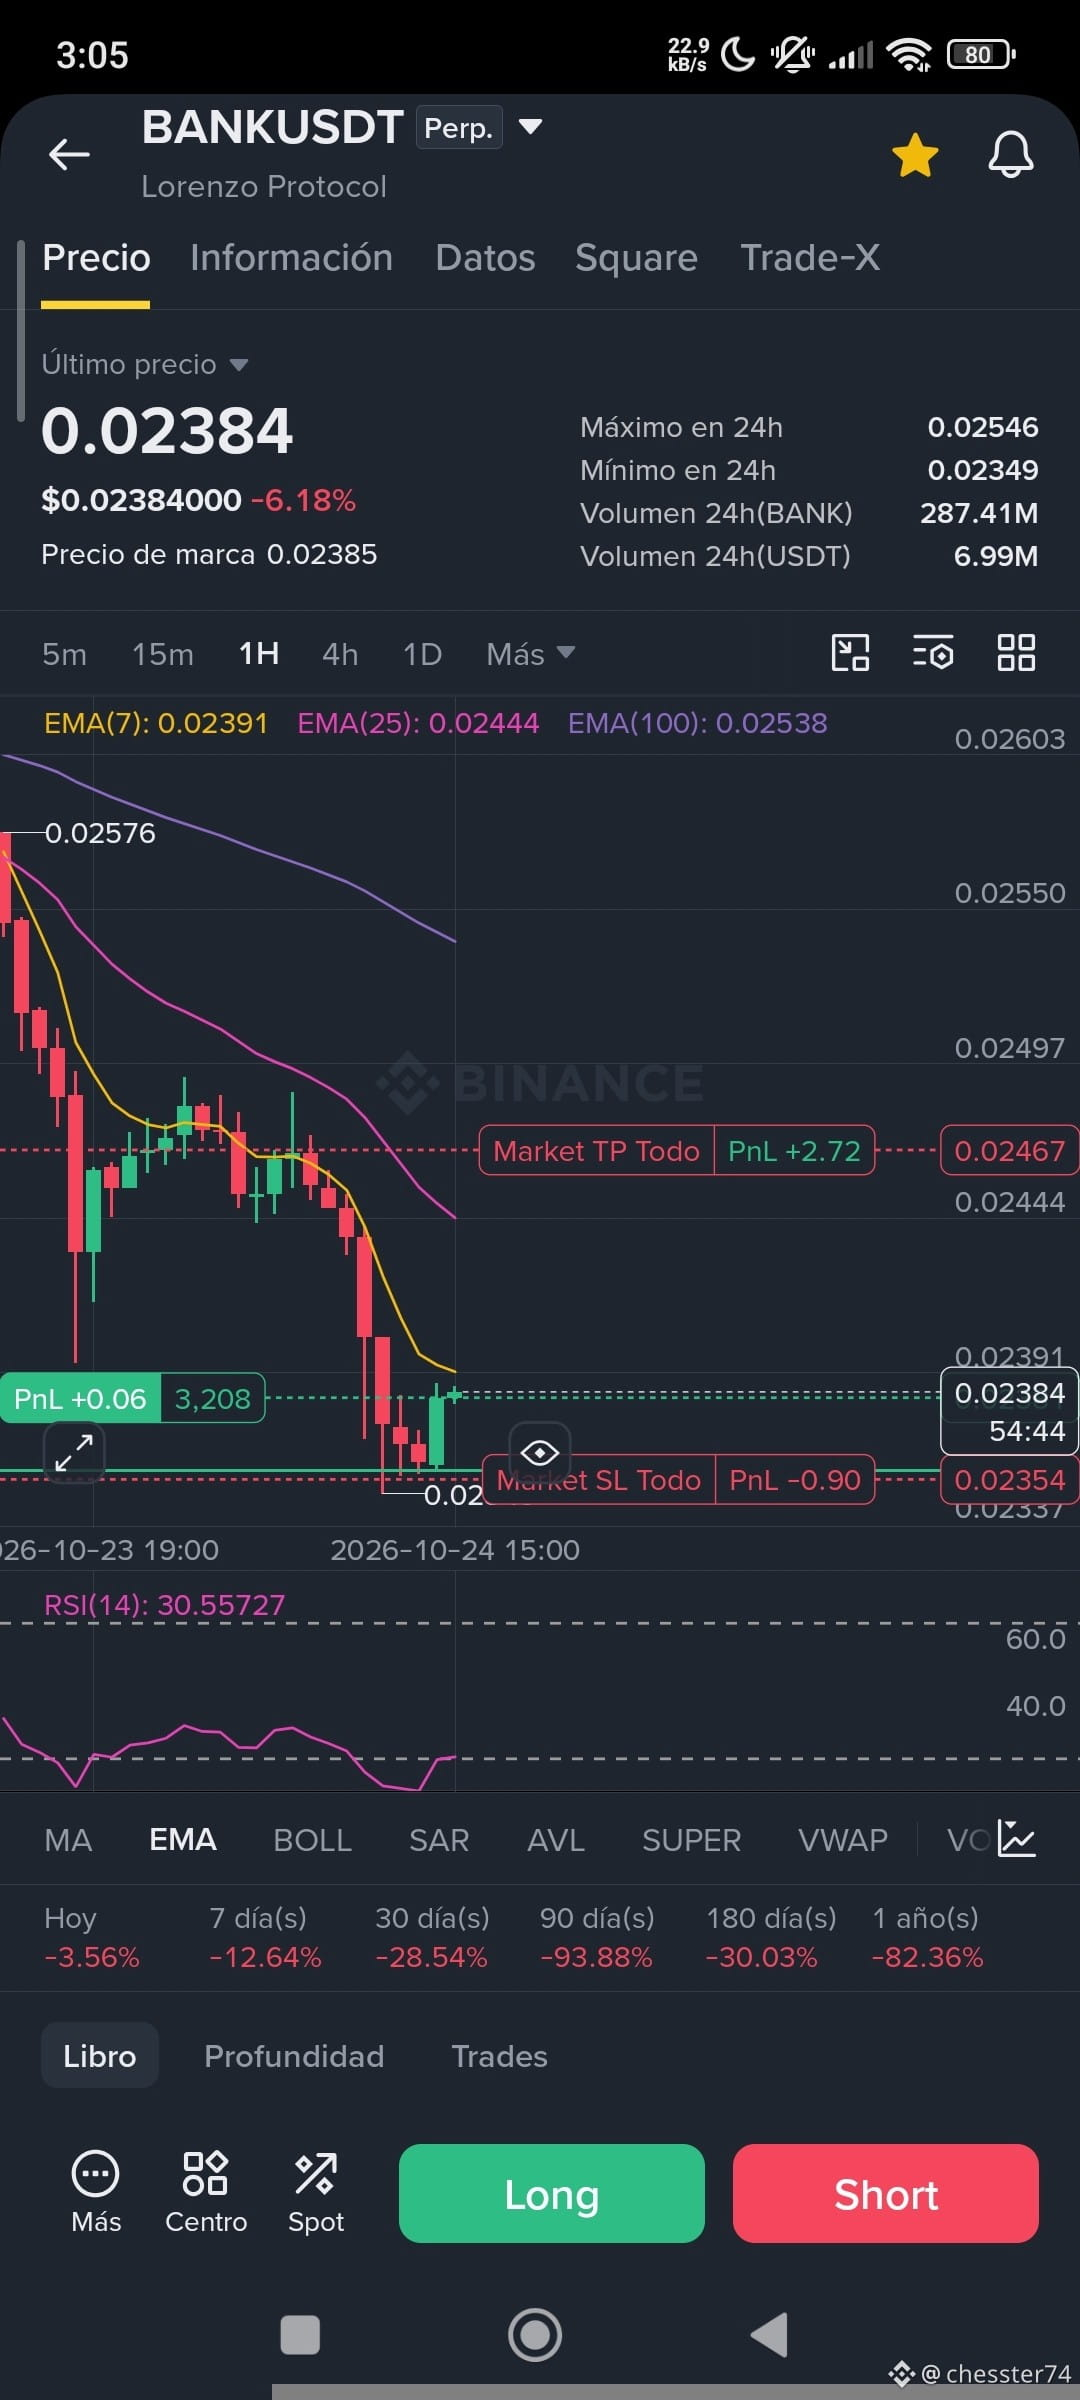
The first push has now reached the 25 EMA. I think this is a normal pullback before the upward move continues.
I adjusted the SL because I had placed it below the engulfing candle, but then I looked at the chart again. If the price pulls back, it could stop me out too early.
In other words, the price could drop, hit the SL, and then rise, causing me to lose the trade by exiting too early.
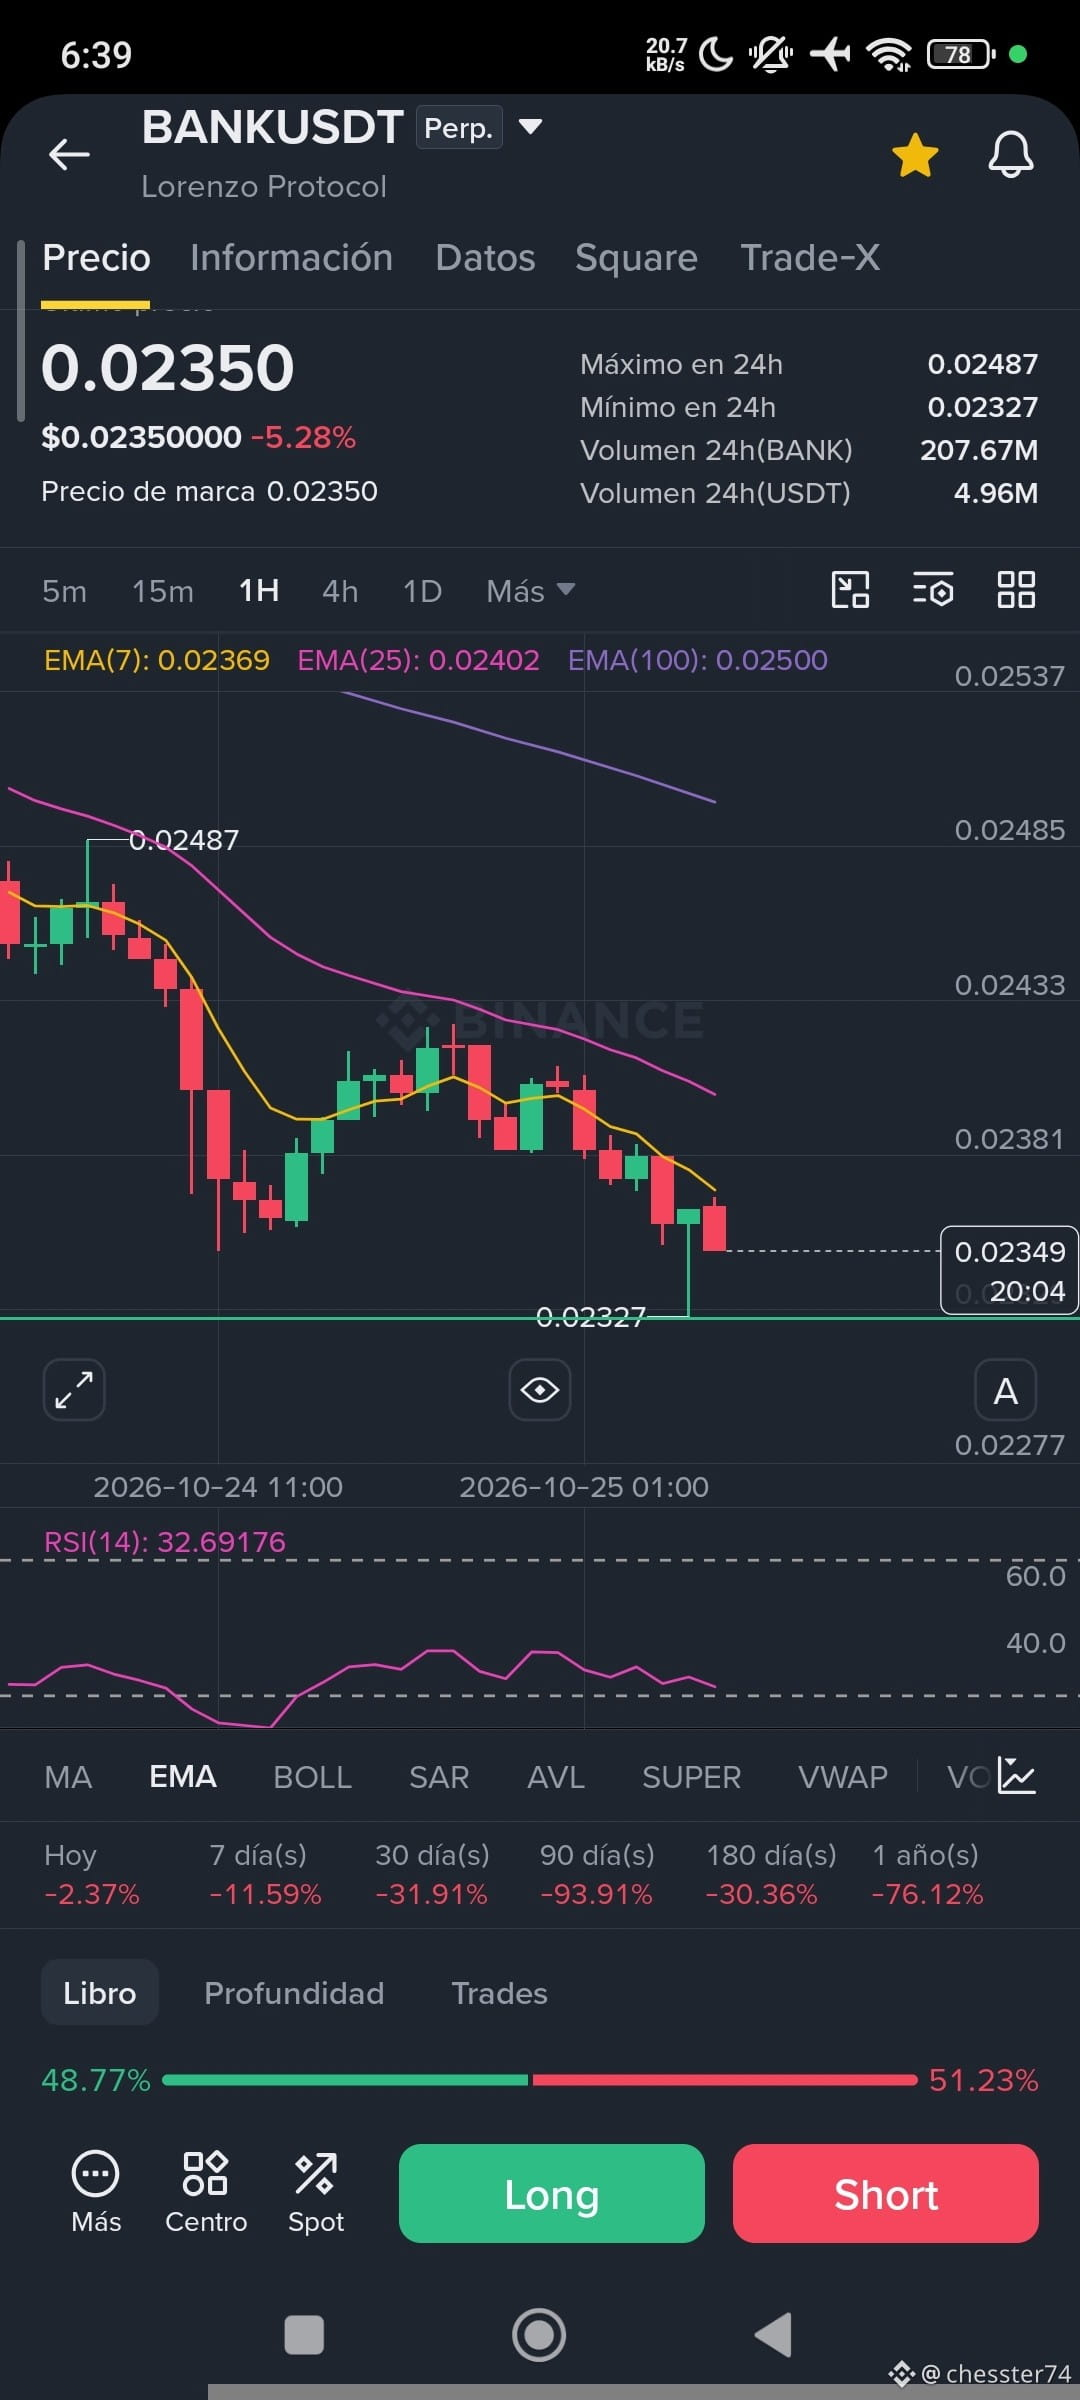
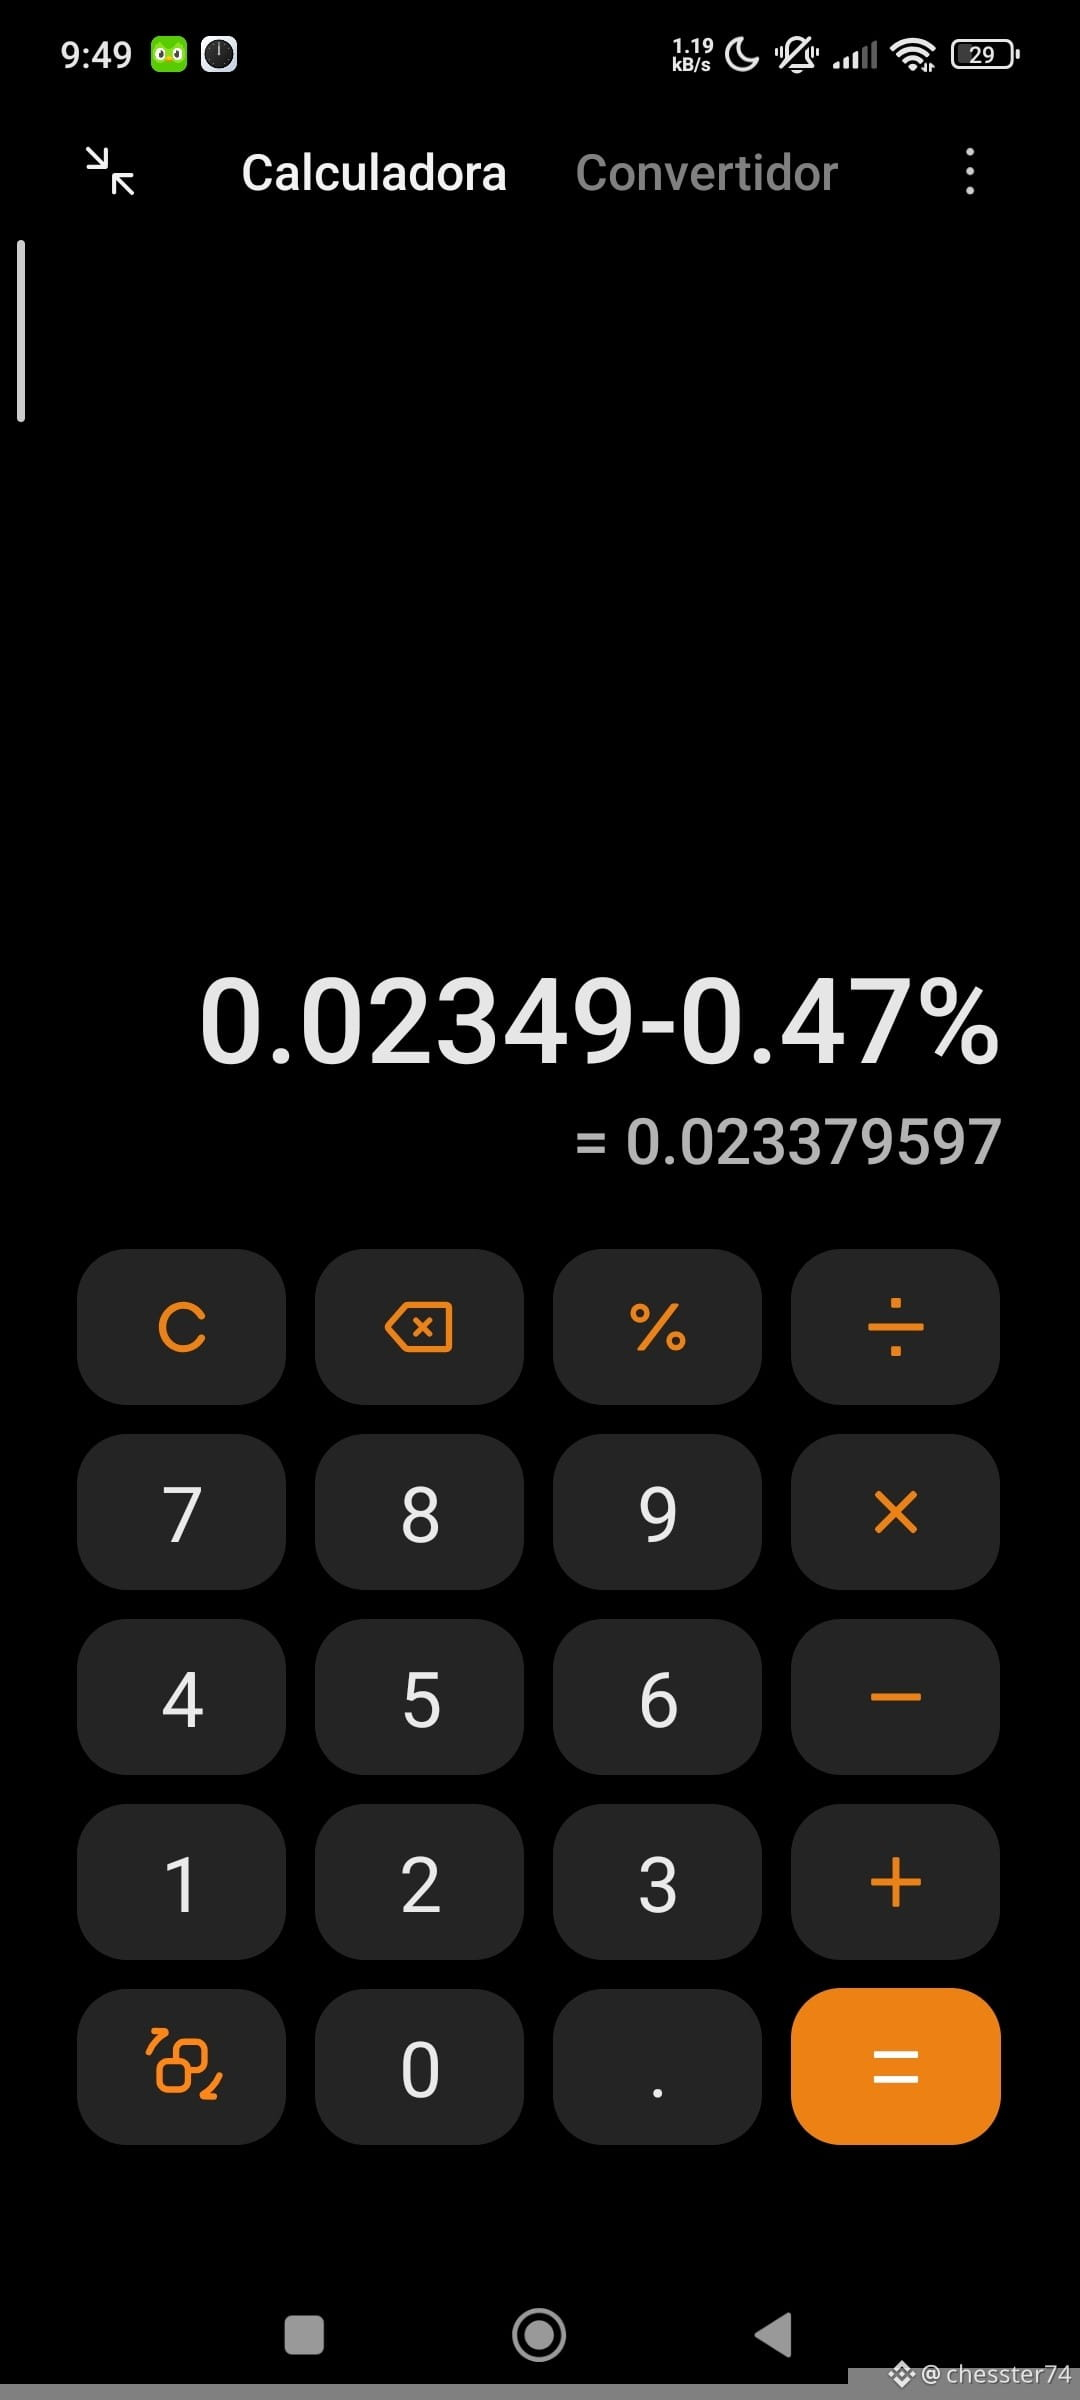
So I found the structure's low at 0.02349 and subtracted 0.47%. That would be the new SL, to prevent a small pullback from stopping me out of the trade.
I adjusted the new risk-reward ratio to 1:3. Now all that's left is to wait.
Are you in a long or a short? Remember to do your own research (DYOR).
So far, things are going well—the strategy is working, and the price rose just as I thought it would.
The first push has now reached the 25 EMA. I think this is a normal pullback before the upward move continues.
I adjusted the SL because I had placed it below the engulfing candle, but then I looked at the chart again. If the price pulls back, it could stop me out too early.
In other words, the price could drop, hit the SL, and then rise, causing me to lose the trade by exiting too early.
So I found the structure's low at 0.02349 and subtracted 0.47%. That would be the new SL, to prevent a small pullback from stopping me out of the trade.
I adjusted the new risk-reward ratio to 1:3. Now all that's left is to wait.
Are you in a long or a short? Remember to do your own research (DYOR).
chesster74
·
--
Bullish$BANK 👍 Entry placed; now I’m hoping it goes up.
I’m looking for a 1:3 ratio. I think the hardest part of the strategy I’m practicing will be waiting for step 3 or 4 to be completed and not jumping in too early.
For example, I’ve made two attempts with STX and lost those trades, but I think it’s because I’m getting ahead of the move.
I’ll keep studying and hopefully improve at trading.
Are you going Long or Short? Remember to do your own research (DYOR).
I’m looking for a 1:3 ratio. I think the hardest part of the strategy I’m practicing will be waiting for step 3 or 4 to be completed and not jumping in too early.
For example, I’ve made two attempts with STX and lost those trades, but I think it’s because I’m getting ahead of the move.
I’ll keep studying and hopefully improve at trading.
Are you going Long or Short? Remember to do your own research (DYOR).
chesster74
·
--
Bullish$BANK 📚Applying a new strategy, attempt number 7
I think the mistake in my other attempts is executing the strategy too soon—in other words, I don't wait long enough and get ahead of the move.
That's a habit from chess. I need to unlearn it to improve at trading.
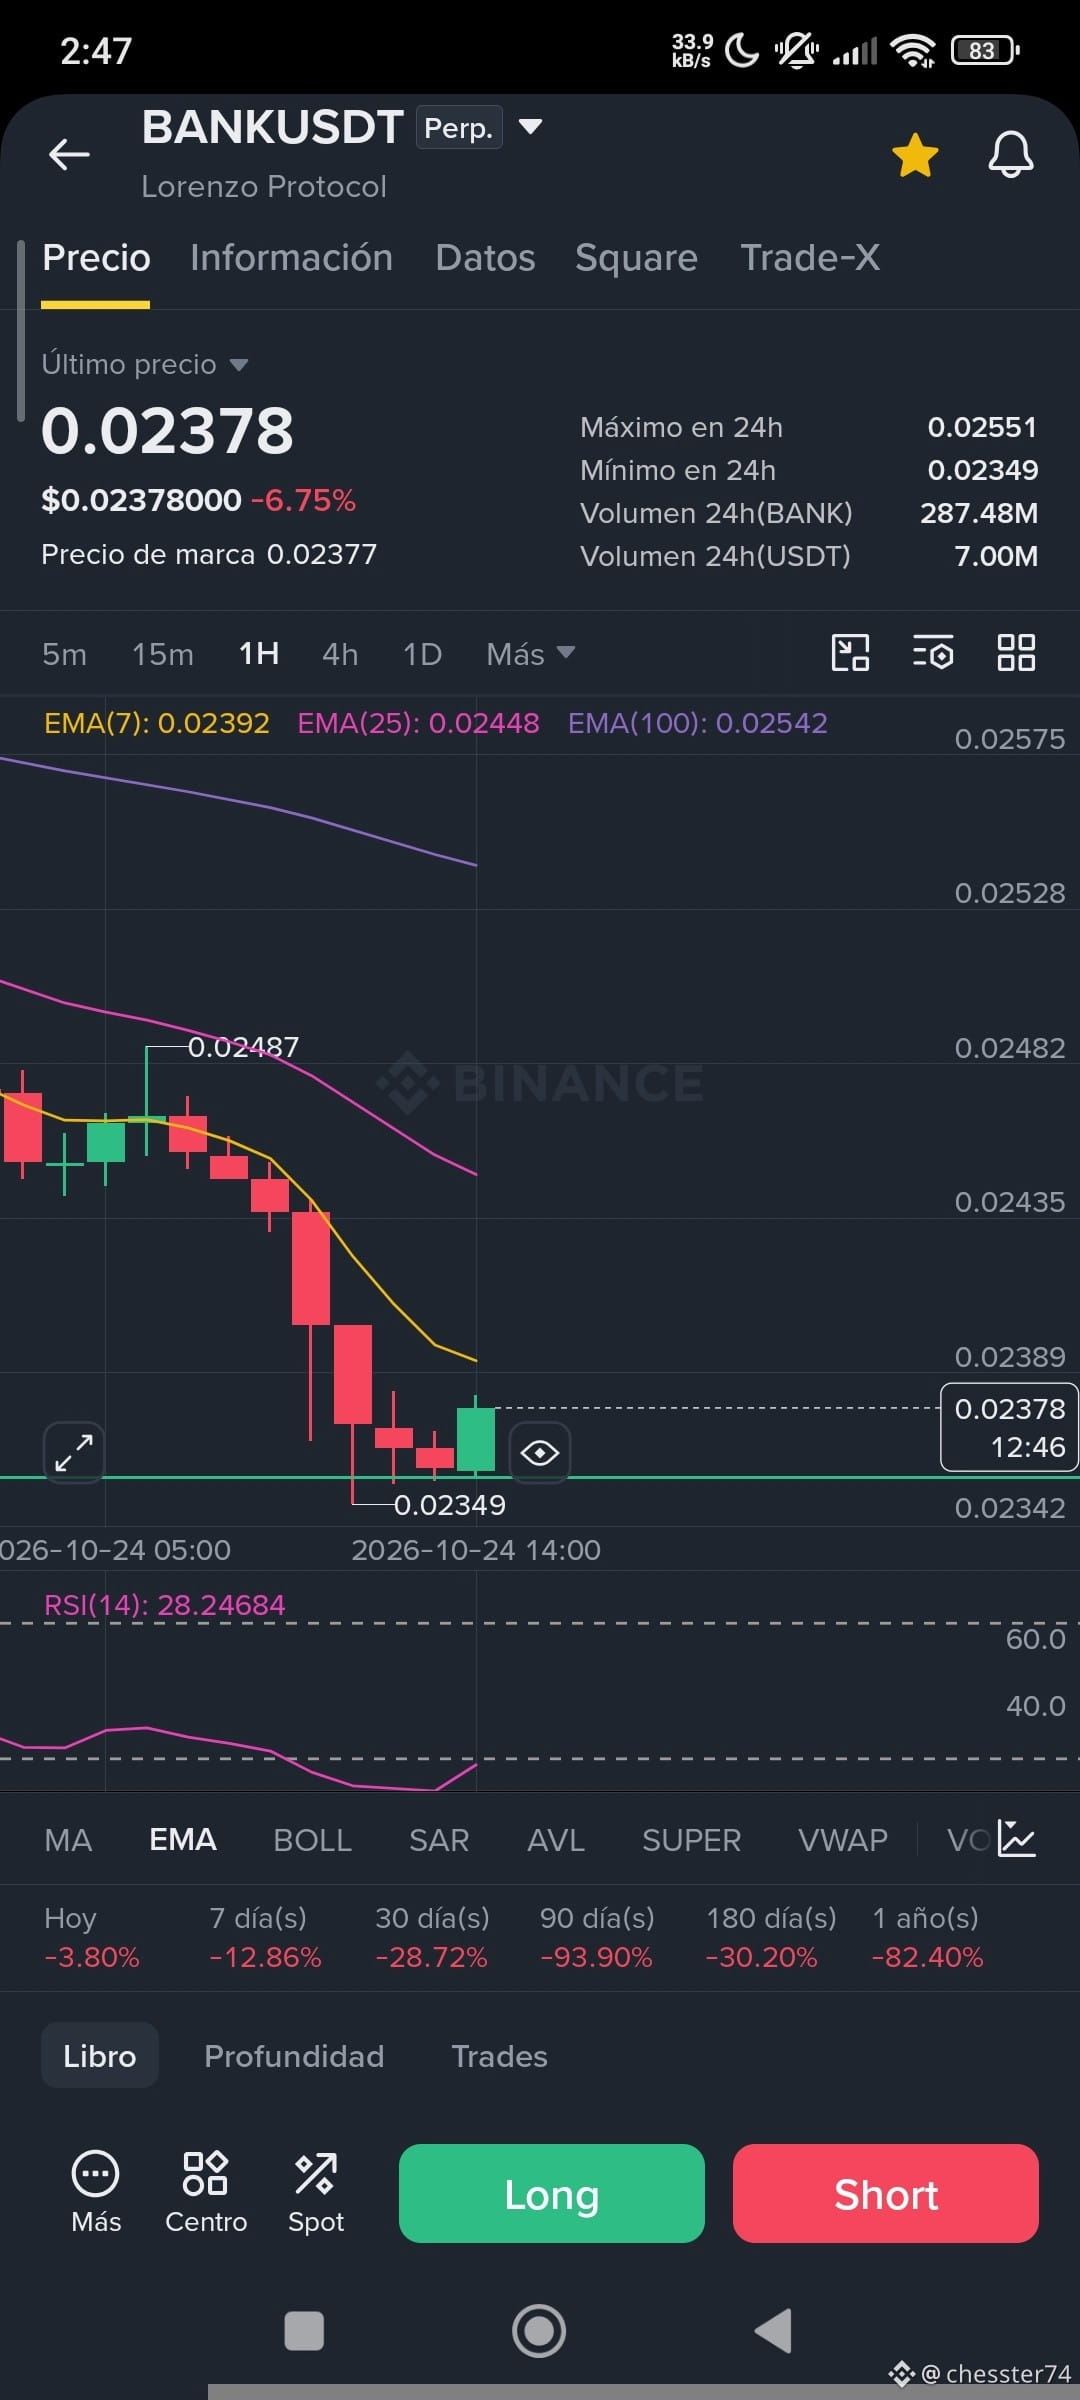
Looking at the BANK chart, I can see that the conditions are being met.
✅ Step 1: Find an oversold market
✅ Step 2: Find support
Step 3: Deceleration (the step before the reversal)—this may or may not occur
👀 Step 4: Reversal candle
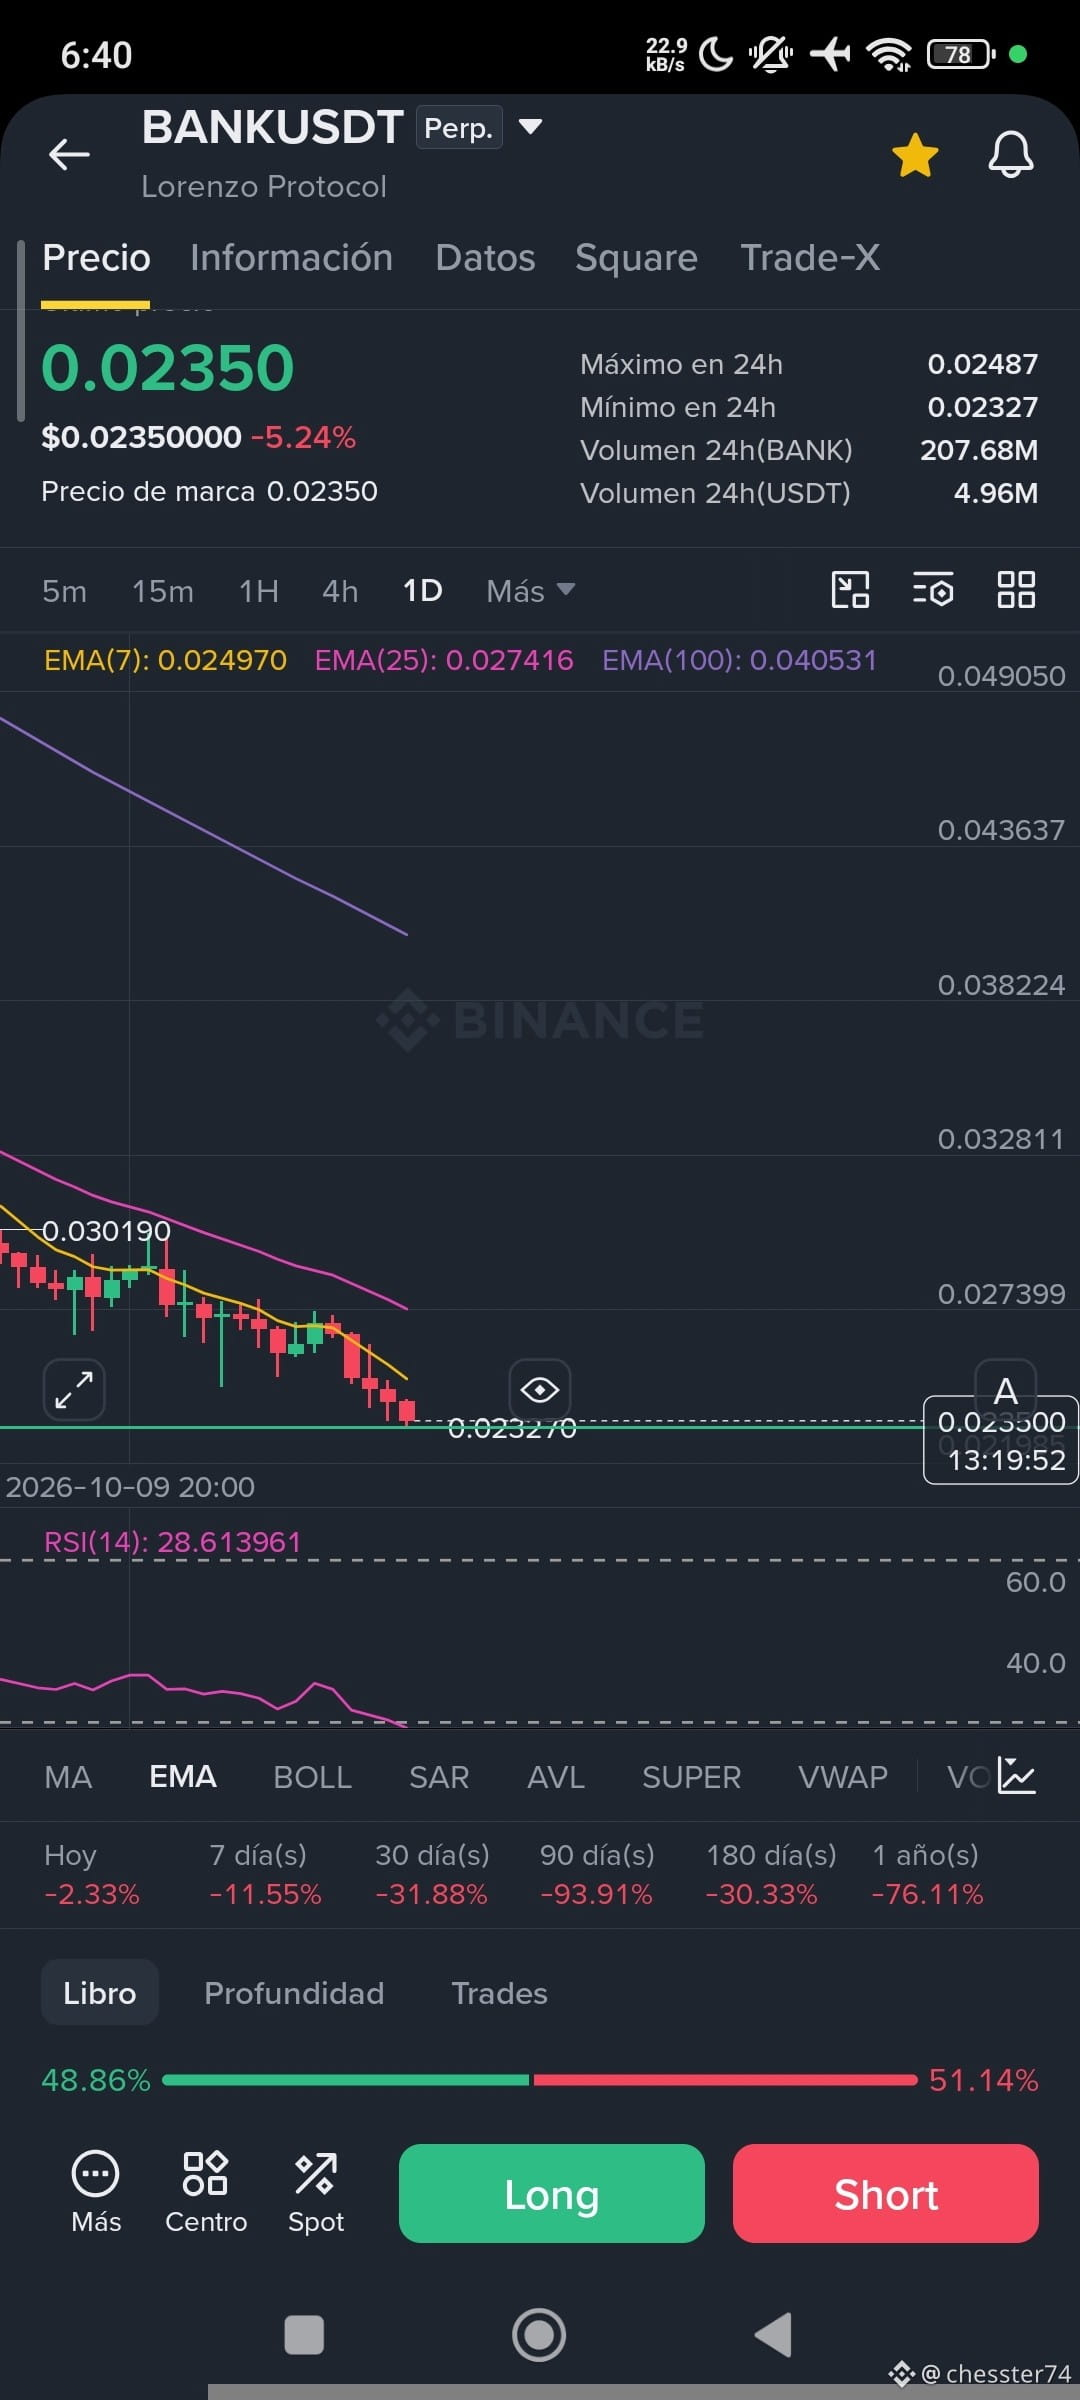
In this case, I don't see any deceleration. Instead, an engulfing candle (a reversal candle) is forming at support.
That's what it looks like. I'm waiting for the candle to close before entering.
SL below the engulfing candle, aiming for a 1:3 risk-reward ratio.
Do you think it's time to go long? Remember to do your own research (DYOR).
I think the mistake in my other attempts is executing the strategy too soon—in other words, I don't wait long enough and get ahead of the move.
That's a habit from chess. I need to unlearn it to improve at trading.
Looking at the BANK chart, I can see that the conditions are being met.
✅ Step 1: Find an oversold market
✅ Step 2: Find support
Step 3: Deceleration (the step before the reversal)—this may or may not occur
👀 Step 4: Reversal candle
In this case, I don't see any deceleration. Instead, an engulfing candle (a reversal candle) is forming at support.
That's what it looks like. I'm waiting for the candle to close before entering.
SL below the engulfing candle, aiming for a 1:3 risk-reward ratio.
Do you think it's time to go long? Remember to do your own research (DYOR).
Log in to explore more content