

粉汐
12 Posts

粉汐
Report
Block User
13 Following
0 Followers
0 Liked
Posts
·
--
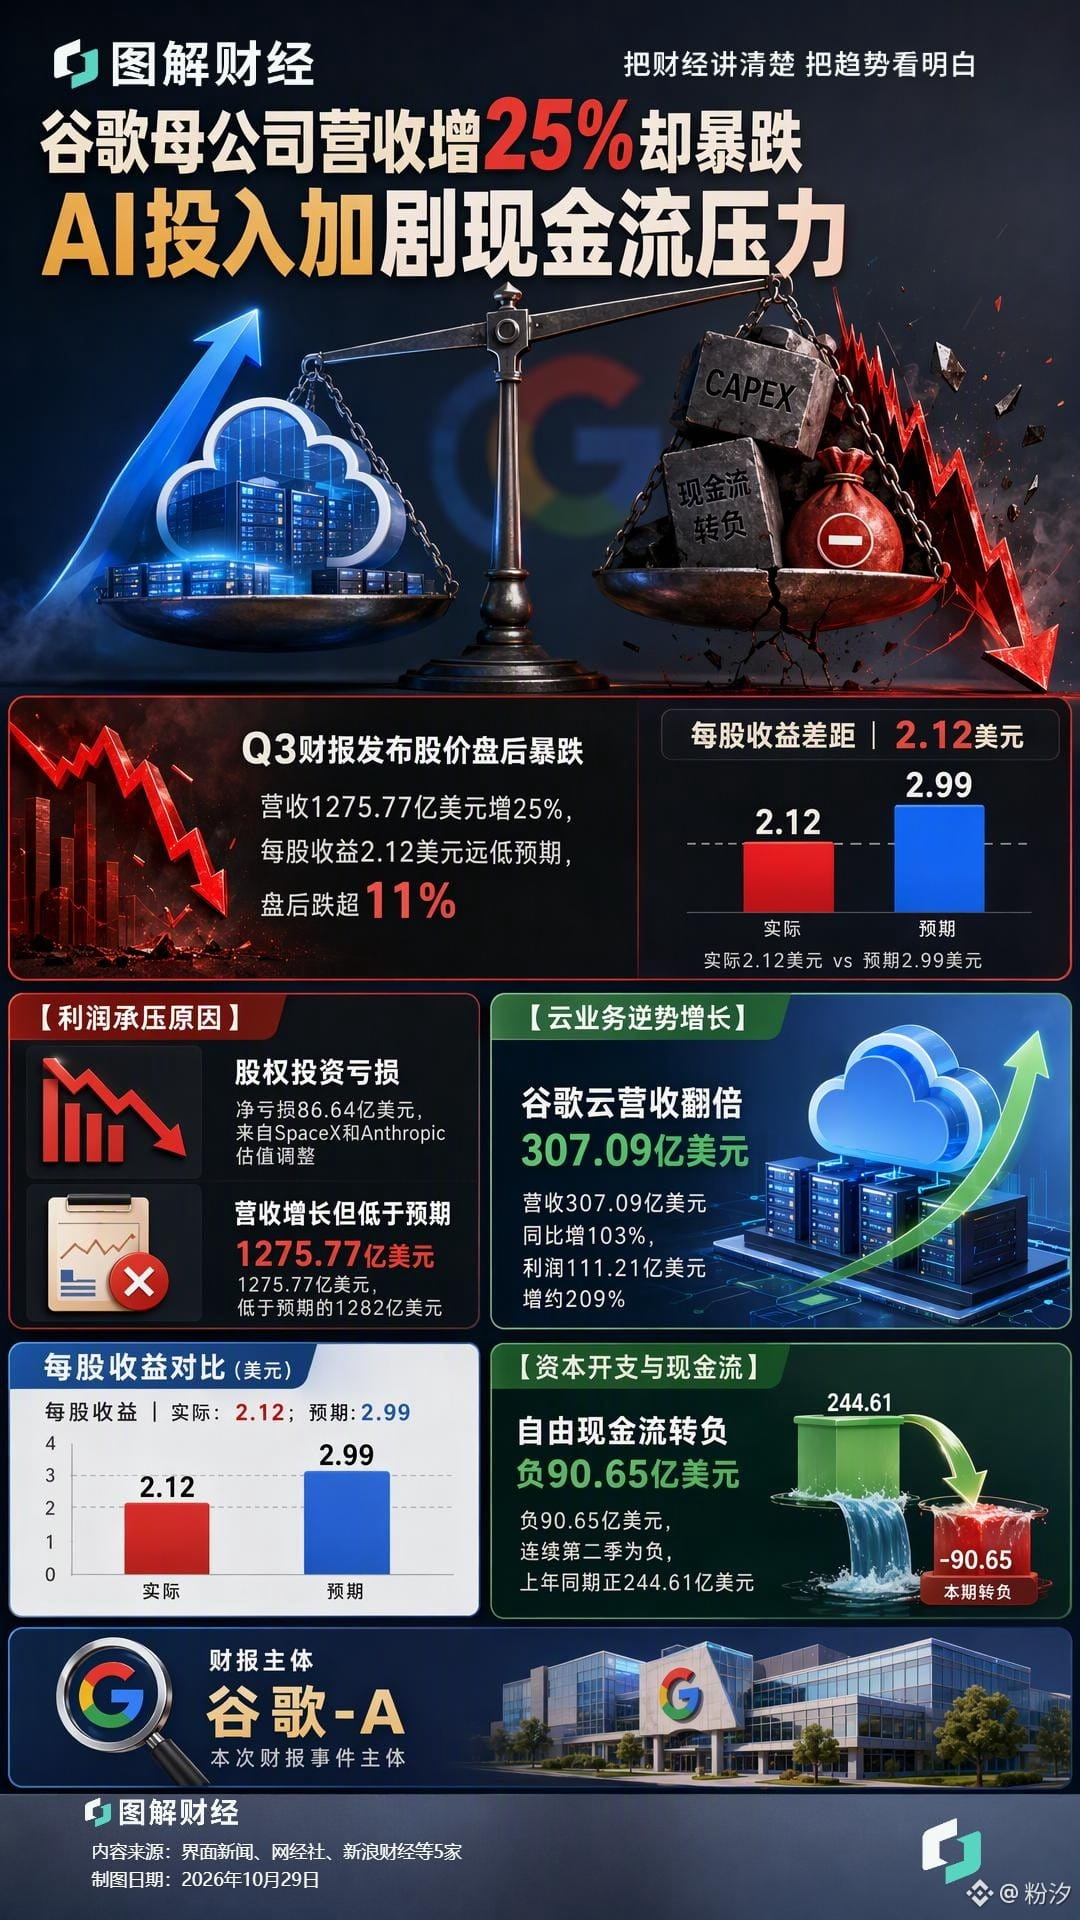
$GOOGL Just released its Q3 earnings report, and the market went wild—shares briefly plunged nearly 10% after hours 😮
✅ Key reasons, summed up:
1. Earnings broadly missed Wall Street expectations
Revenue was $127.577 billion, up 25% year over year, but below expectations. EPS came in at just $2.12 versus the market's $3.02 forecast—a huge miss. Non-GAAP net income plunged 34% year over year.
There was also an $8.7 billion paper loss on an equity investment, which dealt profits a heavy blow.
2. Free cash flow took a nosedive, to -$9.1 billion
Free cash flow was negative for the second quarter in a row! Capital expenditures hit $51.4 billion in a single quarter, as the company poured money into AI computing capacity and data centers. It’s burning through cash far faster than the market expected, spooking investors who are wondering when these investments will pay off.
3. The core search ad business underperformed
Search is Google's steadiest “cash cow,” but ad revenue missed the mark this time. Executives themselves admitted that while AI Mode usage is growing, monetization hasn’t caught up. AI search isn’t making much money yet, and the market is starting to worry that the core business is gradually being eroded.
4. ✅ There was some good news, too: Google Cloud revenue doubled, and Gemini 4 Carbon topped the model rankings. But that wasn’t enough to reassure investors. The market is now focused more on profits and cash flow than on just telling a story.
💬 Question for you:
Do you think this is an overreaction—or are the consequences of Google’s AI spending spree only just beginning? Share your thoughts in the comments!
386
·
--
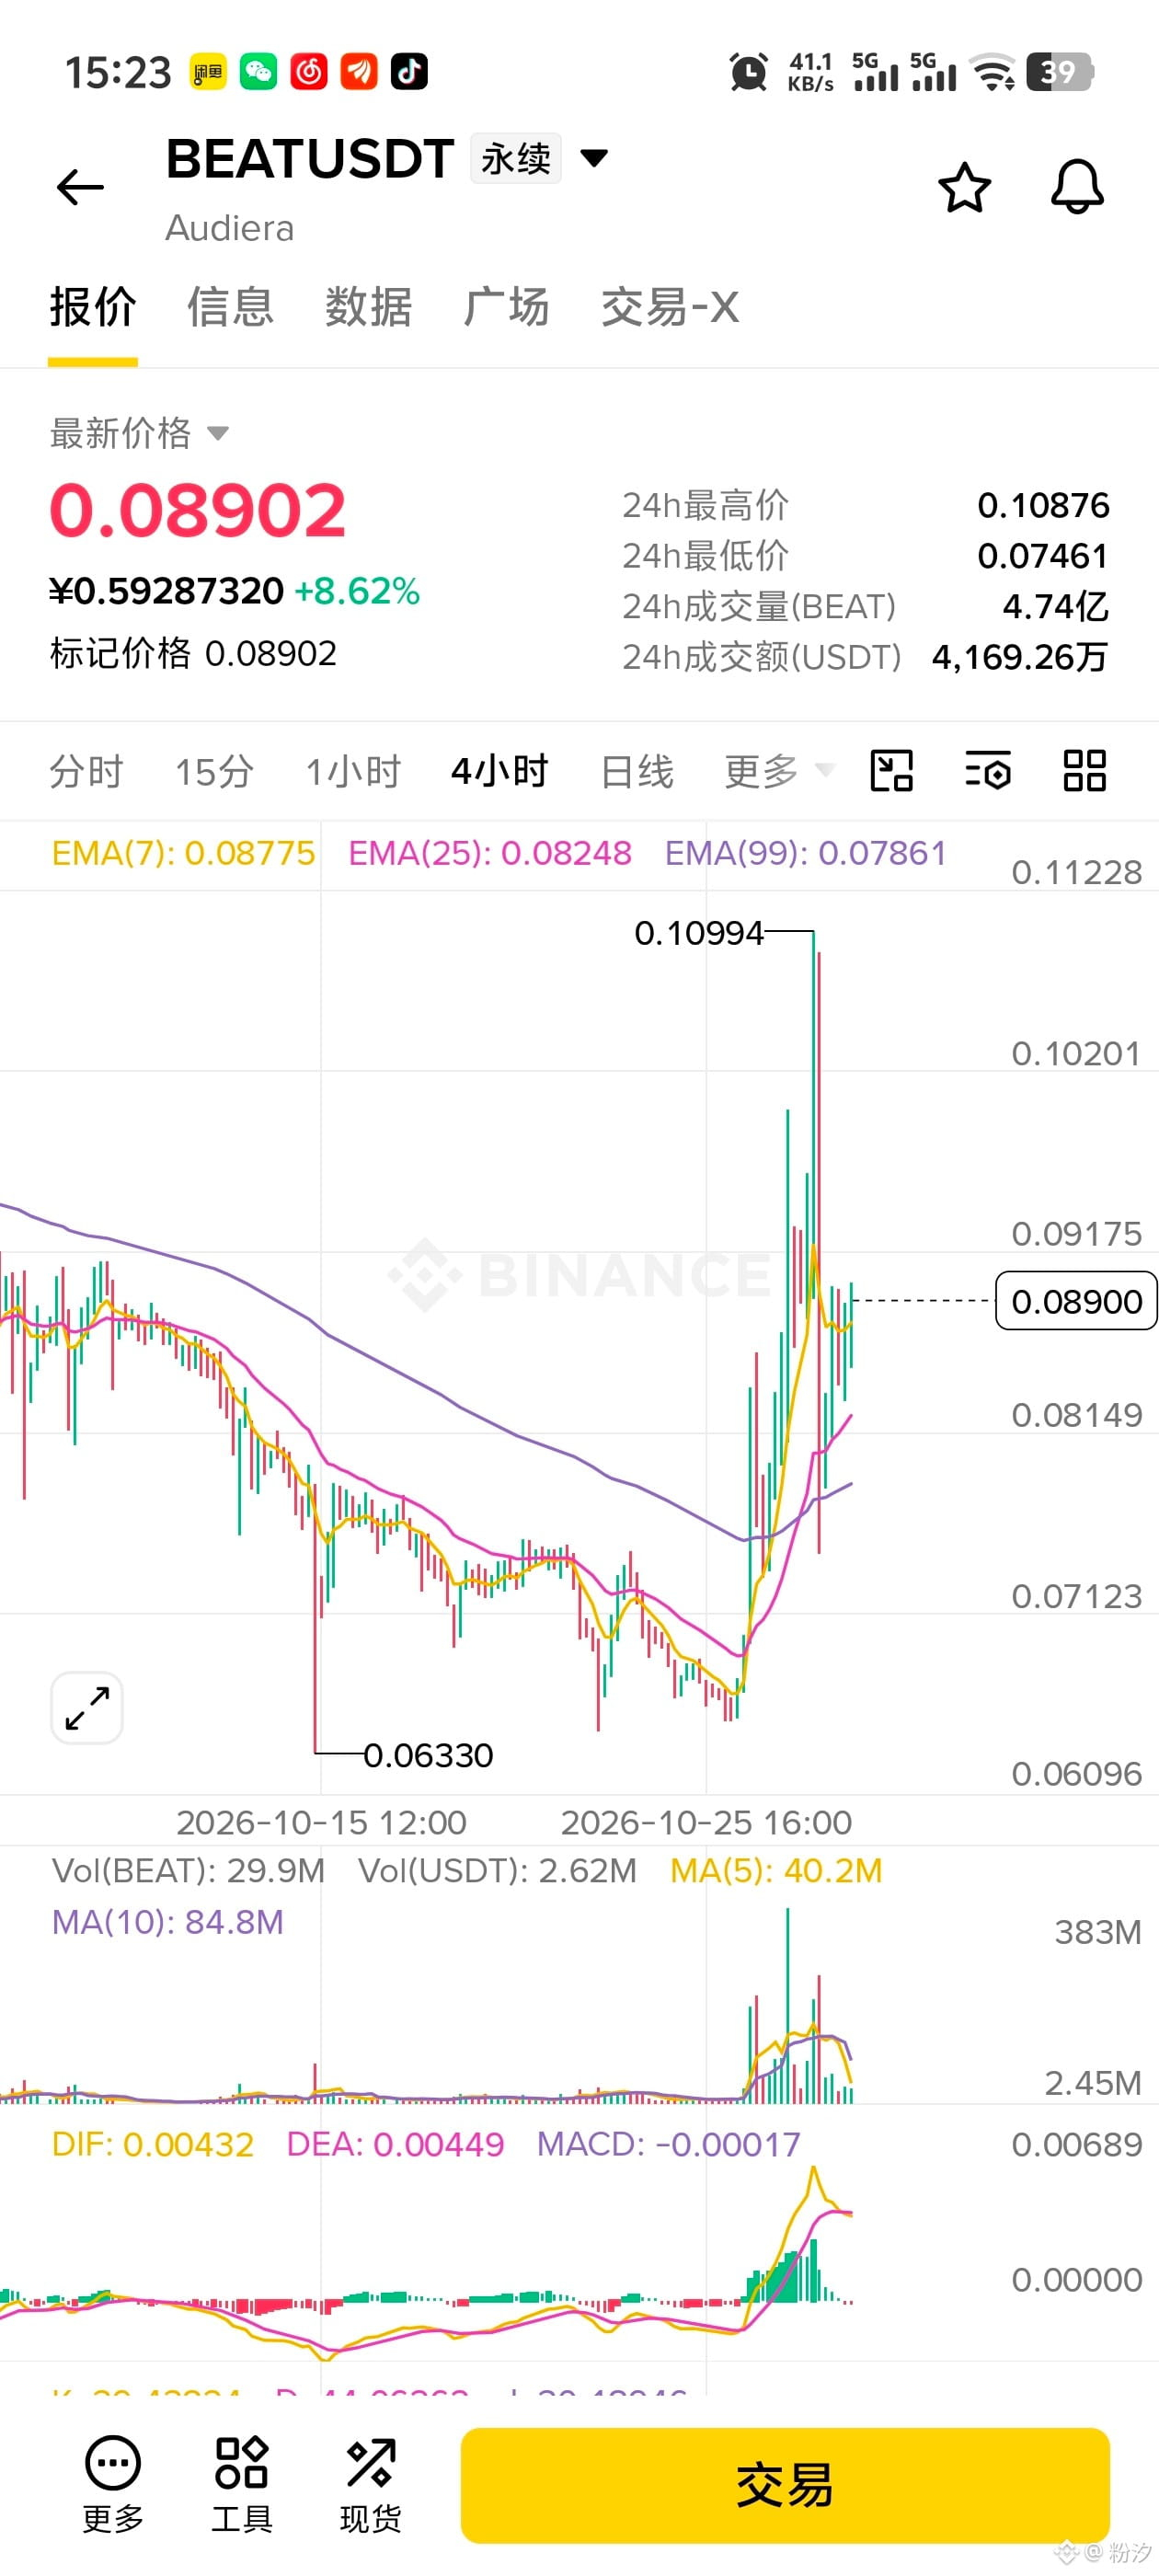
$BEAT Let’s talk about BEAT: 24h +8.62%
After a sharp surge to 0.10994, it pulled back; current price is 0.08902
24h range: 0.07461‑0.10876; trading volume is about 41.69 million U
It has moved above the short-term EMA, rebounding from a low of 0.06333. This looks like a low-level volume-spike move
Also took a look at long/short positions in futures:
There are many retail accounts going long, but shorts have a slight edge in capital size. Be cautious of a potential shakeout by major players with this kind of positioning
⚠️Risk reminder:
This is a short-term hot-money-driven move. The MACD shows signs of turning down, and there is considerable overhead resistance. Volatility is extremely high, so avoid going in heavily and be sure to set stop-losses
Chart observation only; not investment advice
335
·
--
$INIT title: INIT rebounds from lows, recovery begins, 24h gain +6.65%
summary: INIT experienced a sharp decline earlier, then began a recovery from a low of 0.04710. The rebound is continuing, with 24-hour trading activity rising significantly.
{future}(INITUSDT)
$INIT title: INIT rebounds from lows, recovery begins, 24h gain +6.65%
summary: INIT experienced a sharp decline earlier, then began a recovery from a low of 0.04710. The rebound is continuing, with 24-hour trading activity rising significantly.
summary: INIT experienced a sharp decline earlier, then began a recovery from a low of 0.04710. The rebound is continuing, with 24-hour trading activity rising significantly.
81
·
--
$BNB is still up +1.09% over the rolling 24 hours, but the most recently closed 1-hour period was down -0.3563%, with spot pulling back from 755.01 to 752.32 USDT.
What’s interesting is the trading volume: about 11.75 million USDT over the past hour, up 71.66% from the previous hour. Prices are pulling back, while trading is getting more active.
Higher trading volume only indicates more active turnover; it doesn’t reveal whether buyers or sellers are in control. Is this extra volume absorbing the pullback, or accelerating the move downward? These numbers alone can’t tell us.
38
·
--
$STAR Key Price Levels
🟢 Support: 0.03329 (defense at the recent low)
✅ Current price: 0.03836
🎯 First target: 0.04235 (short-term resistance at the 24-hour high)
🎯 Second target: 0.04730 (historical local high)
$STAR Key Price Levels
🟢 Support: 0.03329 (defense at the recent low)
✅ Current price: 0.03836
🎯 First target: 0.04235 (short-term resistance at the 24-hour high)
🎯 Second target: 0.04730 (historical local high)
🟢 Support: 0.03329 (defense at the recent low)
✅ Current price: 0.03836
🎯 First target: 0.04235 (short-term resistance at the 24-hour high)
🎯 Second target: 0.04730 (historical local high)
2
·
--
$ON ✅Asset: ON/USDT Perpetual (Orochi Network)
📊Current price: 0.1892, 24h change: +13.57%
🔥24h stats:
- 24h high: 0.2073
- 24h low: 0.1433
- 24h USDT trading volume: 65.7537 million
📈Bullish thesis
1. A strong bullish daily candle rebounded from the lows, with clear signs of short-term capital inflows.
2. The EMA7, EMA25, and EMA99 lines are starting to turn upward. The short-term averages have moved above the others, signaling the early stages of a bullish trend.
3. MACD: DIF > DEA, and MACD is positive, indicating bullish momentum.
4. The previous historical high was 0.46, leaving considerable upside potential. This coin is relatively volatile.
5. Trading volume has risen in tandem, showing renewed market activity rather than an unsupported price spike.
🎯Key price levels
🟢Support: 0.1433 (recent low; defensive level)
✅Current price: 0.1892
🎯First target: 0.2073 (24h high; short-term resistance)
🎯Second target: 0.2227 (daily-chart consolidation resistance)
73
·
--
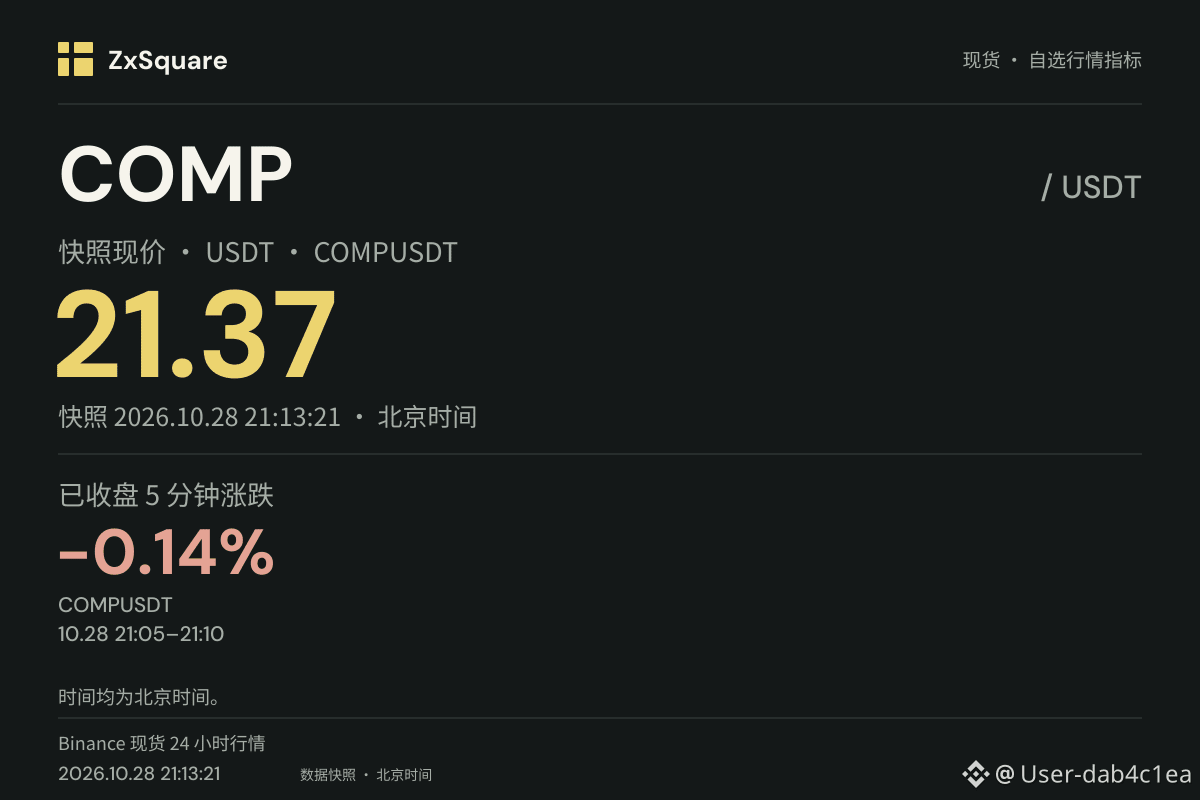
The most recent completed 1-hour candle for $COMP (12:00–13:00 UTC) fell from 21.53 to 21.38, a decline of 0.70%, which is not particularly large. Spot trading volume during that hour was 30,803.30 USDT, compared with just 16,049.89 USDT in the previous hour—an increase of about 92%. The price barely moved, but trading activity clearly picked up.
However, trading volume only indicates increased trading activity; it is not the same as net capital inflows and cannot show whether buyers or sellers were in control. Based on this data alone, it is impossible to tell whether this was due to increased turnover, more concentrated trading, or some other reason. Later, the most recent completed 5-minute candle (13:05–13:10 UTC) closed at 21.41, a change of -0.14%, still a modest fluctuation.
However, trading volume only indicates increased trading activity; it is not the same as net capital inflows and cannot show whether buyers or sellers were in control. Based on this data alone, it is impossible to tell whether this was due to increased turnover, more concentrated trading, or some other reason. Later, the most recent completed 5-minute candle (13:05–13:10 UTC) closed at 21.41, a change of -0.14%, still a modest fluctuation.
124
·
--
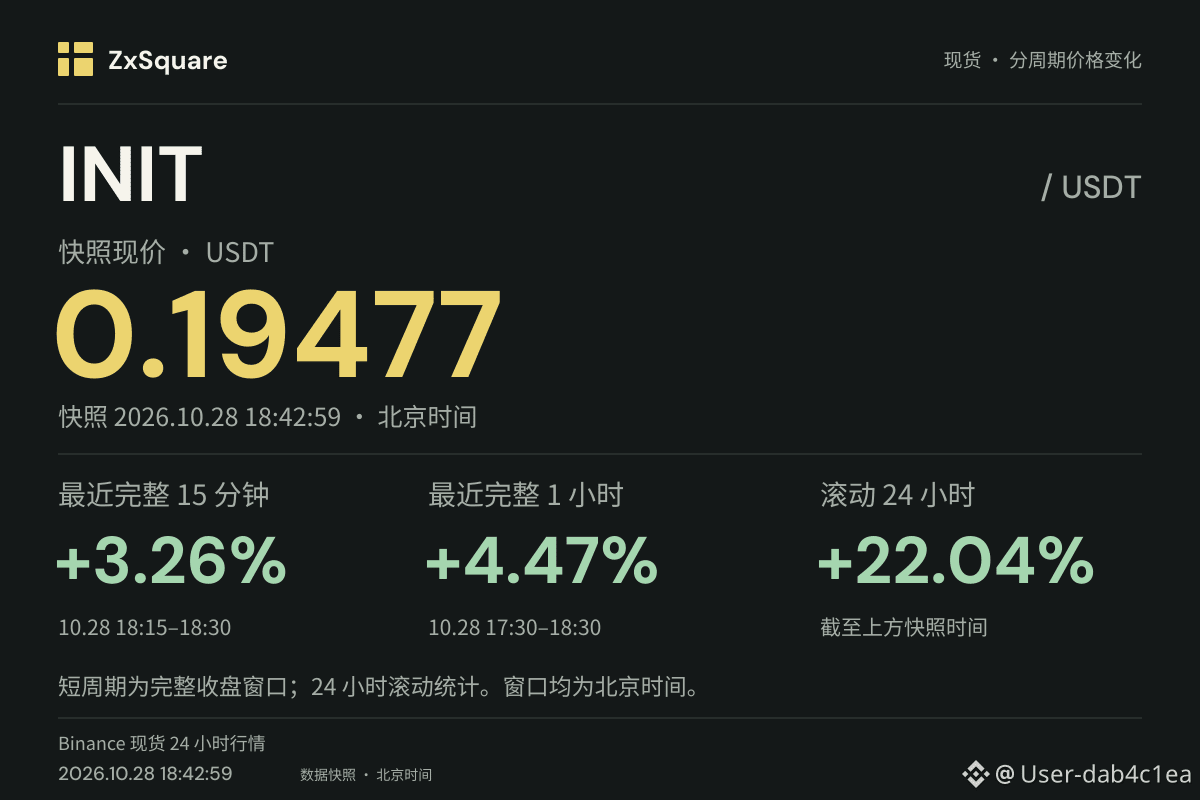
$INIT 24-hour gain: +22.04%. Narrowing the measurement window, the most recent completed 1-hour period (09:30–10:30 UTC) rose 4.47%, with the spot price climbing from 0.18623 USDT to 0.19455 USDT. Narrowing it further to the most recent completed 15-minute period (10:15–10:30 UTC), the price rose 3.26% in that interval alone, from 0.1884 USDT to 0.19455 USDT.
In other words, most of the 1-hour gain came during the final 15-minute candle. All three windows show positive gains; the main difference is how unevenly the same upward move is distributed across the two windows.
In other words, most of the 1-hour gain came during the final 15-minute candle. All three windows show positive gains; the main difference is how unevenly the same upward move is distributed across the two windows.
45
·
--
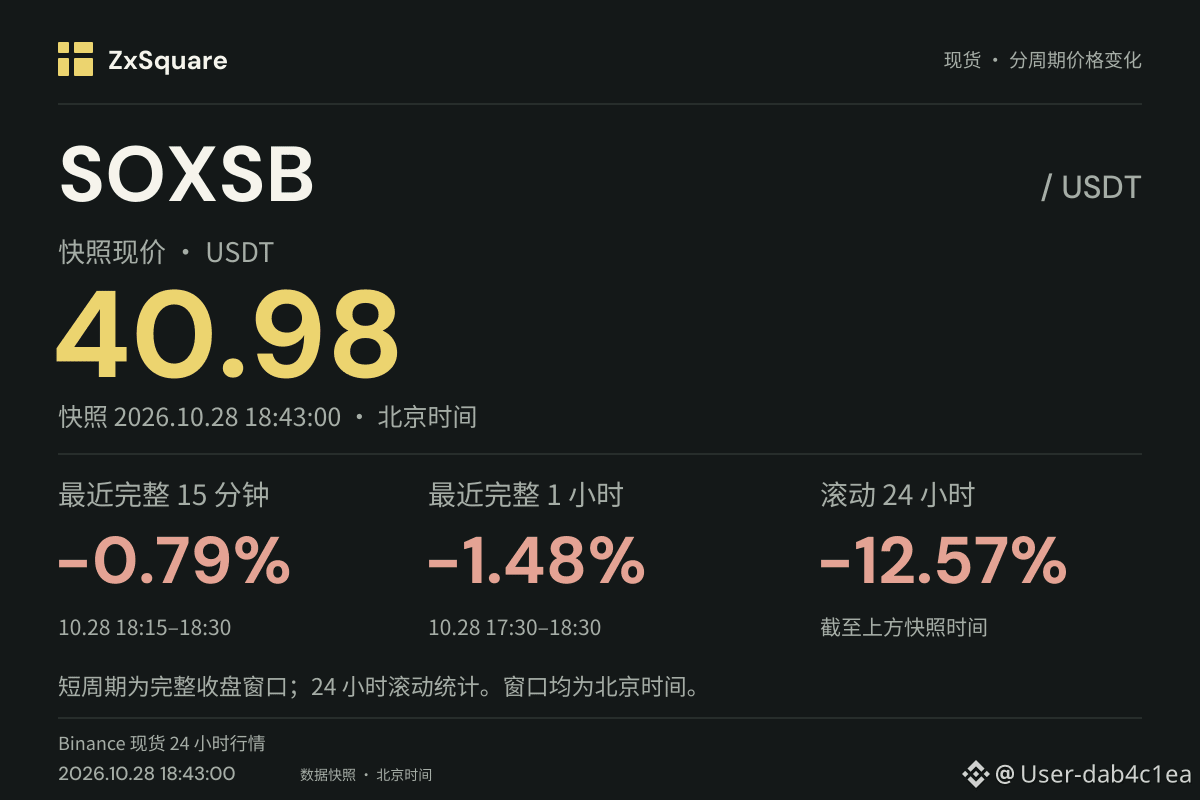
$SOXSB The percentage drops over shorter periods are much smaller than the 24-hour figure: the most recent complete hour (09:30–10:30 UTC) was -1.48%, the most recent complete 15 minutes was -0.80%, and the rolling 24-hour figure was -12.57%.
But with such different window lengths, these figures side by side don’t show that the decline is slowing. Where did most of the -12.57% drop over 24 hours occur?
But with such different window lengths, these figures side by side don’t show that the decline is slowing. Where did most of the -12.57% drop over 24 hours occur?
101
·
--
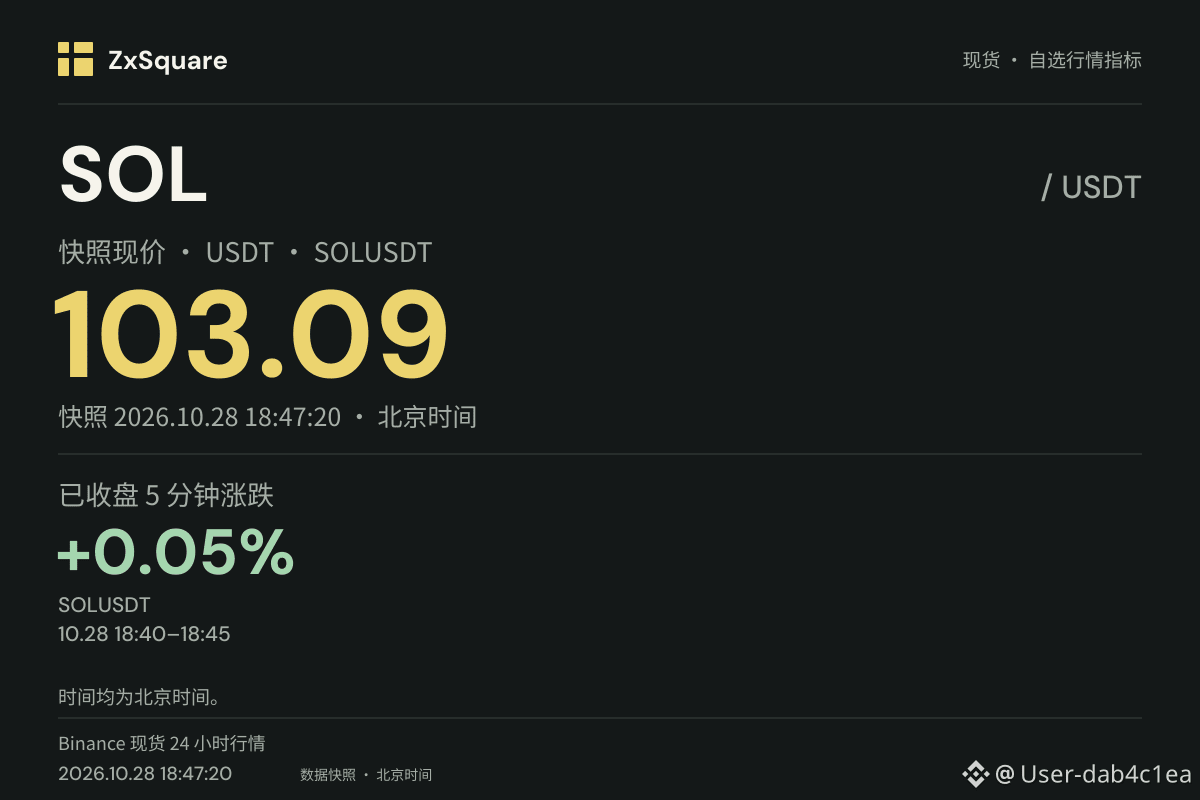
$SOL 24 hours is still up +2.57%, with the current price at 103.09 USDT. At first glance, that doesn't look bad.
But zoom in on the time windows, and things look less heated. In the latest completed 5-minute candlestick, spot rose from 103.01 to 103.06, up 0.0485%; the previous completed 15-minute candle was down 0.1163%.
Trading has cooled off too: volume was around 4.44 million USDT in the latest completed hour, compared with 11.93 million USDT in the hour before that—a drop of more than 60%. That only tells us trading activity has slowed; the direction is another matter.
I can't really tell from these time windows alone how much of the 24-hour gain had already happened earlier.
69
Log in to explore more content
Join global crypto users on Binance Square
⚡️ Get latest and useful information about crypto.
💬 Trusted by the world’s largest crypto exchange.
👍 Discover real insights from verified creators.
Email / Phone number
Trending Topics
FedWatch
16.2M views
38,842 Discussing
🚨 BREAKING: THE US ECONOMY JUST BEAT ON EVERYTHING. THAT IS THE WORST NEWS FOR YOUR PORTFOLIO.
GDP Q3: 3.4% vs 3.2% expected. Previous: 2.2%
Jobless claims: 194K vs 199K expected. Previous: 194K
PCE inflation: 3.6%, as expected. Previous: 3.4%
Strong growth. Almost no layoffs. Inflation going UP, not down. The Fed has zero reason to stop, and a December hike is priced near 80%.
In this market, good news for the economy is bad news for stocks and crypto. PCE in line is not a relief, it is 0.2 points higher than last month.
Rate cut hopes are dead. Stay alert.
12 years in these markets. This is what I do.
Follow me and turn notifications on.
#FedWatch
#EarningsSeason
#Nasdaq100FuturesFall0.9%
$BTC
$SOL
$SUI
MARKET STRUCTURE GUIDE
·4 Likes
·1.2k views
EarningsSeason
6.3M views
31,570 Discussing
USMidtermElections
13,272 views
352 Discussing