

Awal K
2 Posts

Awal K
Report
Block User
Open Trade
Occasional Trader
5.6 Years
2 Following
7 Followers
1 Liked
Posts
Portfolio
·
--
📊 #NEAR : Watching the next breakout
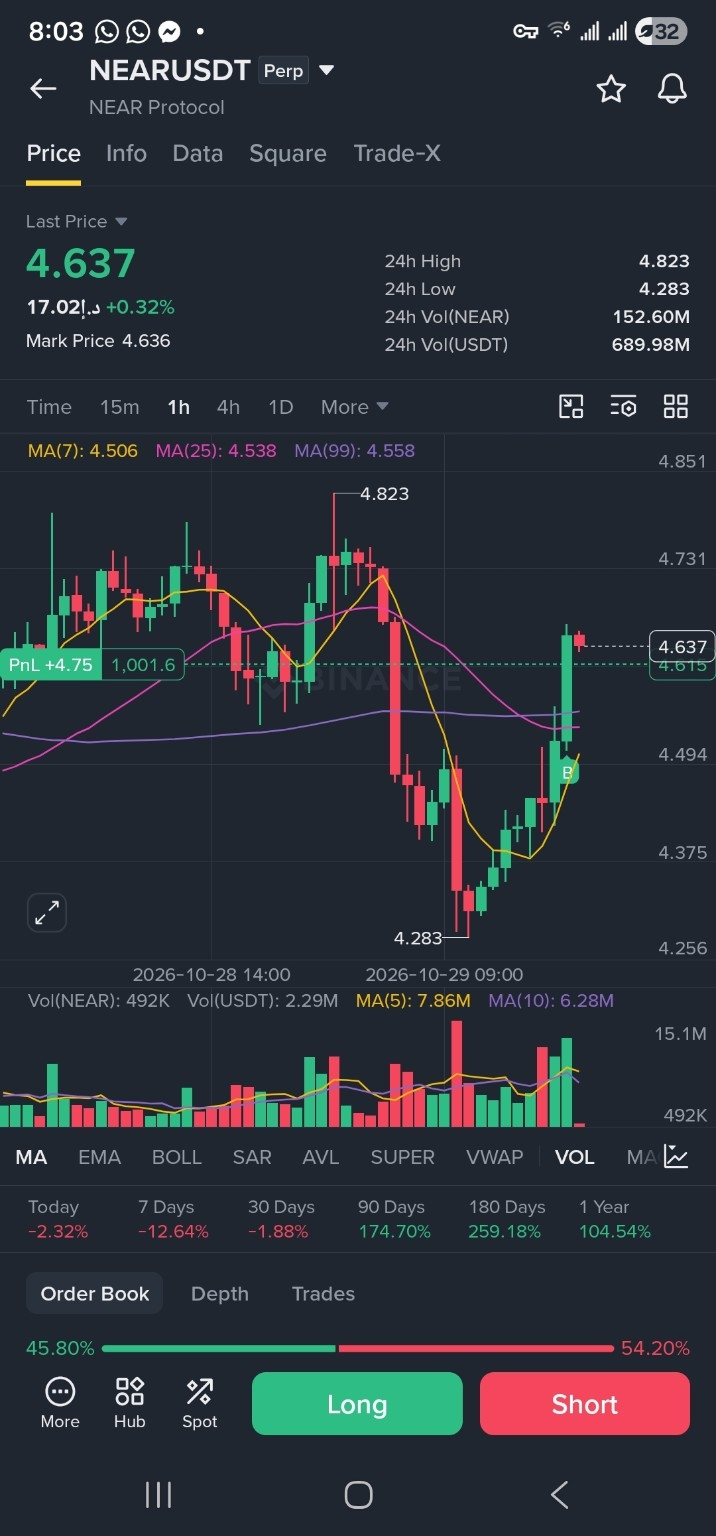
The shared 1-hour chart shows NEAR rebounding from $4.283 to around $4.637, reclaiming its moving averages. The recovery looks encouraging, but resistance is close.
🎯 Upside levels: $4.70–$4.73, followed by $4.823 if buyers sustain a breakout.
🛡️ Support: $4.55–$4.56. Losing this area could bring $4.49 back into play.
My outlook: cautiously bullish while support holds. Watch for a candle close above resistance with strong volume before assuming further upside.
Chart snapshot—not a live quote. Targets are scenarios, not guarantees.
Will NEAR break $4.73 or retest support first? 👇
#NearBullish #NEARUSDT #BinanceSquare #CryptoAnalysis
1
312
·
--
📊 NEAR/USDT Prediction: Can the rebound continue?
NEAR bounced strongly from $4.283 and reached around $4.637 on the 1-hour chart. Buyers have shown strength, but the next resistance areas could test the move.
🟢 Bullish scenario: If NEAR holds above the $4.55–$4.56 area, it could move toward $4.70–$4.73. A break above that zone may bring the previous high of $4.823 into focus.
🔴 Bearish scenario: If NEAR falls back below $4.55, the rebound could weaken, with $4.49 and then $4.28 worth watching.
These levels are based on the chart shared on October 29, when NEAR was around $4.637. Check the latest price before making a decision—this is a prediction, not a guarantee.
What do you think: will NEAR break above $4.73 or pull back first? 👇
#NEARUSDT #CryptoAnalysis #BinanceSquare
385
Log in to explore more content
Join global crypto users on Binance Square
⚡️ Get latest and useful information about crypto.
💬 Trusted by the world’s largest crypto exchange.
👍 Discover real insights from verified creators.
Email / Phone number
Trending Topics
FedWatch
16.3M views
39,519 Discussing
🚨 🇺🇸 PETER SCHIFF JUST THREW A BIG WARNING AT THE FED!
Peter Schiff is calling Kevin Warsh’s tough talk on inflation a “bluff,” and his prediction could have major implications for the markets.
Schiff believes the Fed could eventually return to money printing through quantitative easing (QE) and even cut interest rates next year, despite inflation continuing to rise.
Think about that for a moment.
🔥 Inflation could remain a problem. 🔥 The Fed could still move toward easier monetary policy. 🔥 More liquidity could flow into financial markets.
If this scenario plays out, it could create a very different market environment for stocks, gold, Bitcoin, and the wider crypto market.
But there’s a catch: if inflation stays high, the Fed could face a difficult choice between fighting rising prices and supporting the economy.
Will Warsh stick to a tough inflation policy, or will the Fed eventually change direction?
The next move could matter a lot for investors.
#FedWatch #EarningsSeason #USMidtermElections #BrazilCryptoExchangesMustApplyForLicensesByFriday #StanDruckenmillerBecomesInvestorInTradeXYZ
Jackson Liam
·4 Likes
·8.7k views
EarningsSeason
6.5M views
32,234 Discussing
USMidtermElections
51,501 views
671 Discussing