
bnb共识者
56 Posts

bnb共识者
Report
Block User
2 Following
5 Followers
10 Liked
Posts
·
--
Many people treat the pre-market price as “the price you can buy at as soon as it goes live.” With $PREDICT only a few days away from TGE, today’s move made that misunderstanding plain.
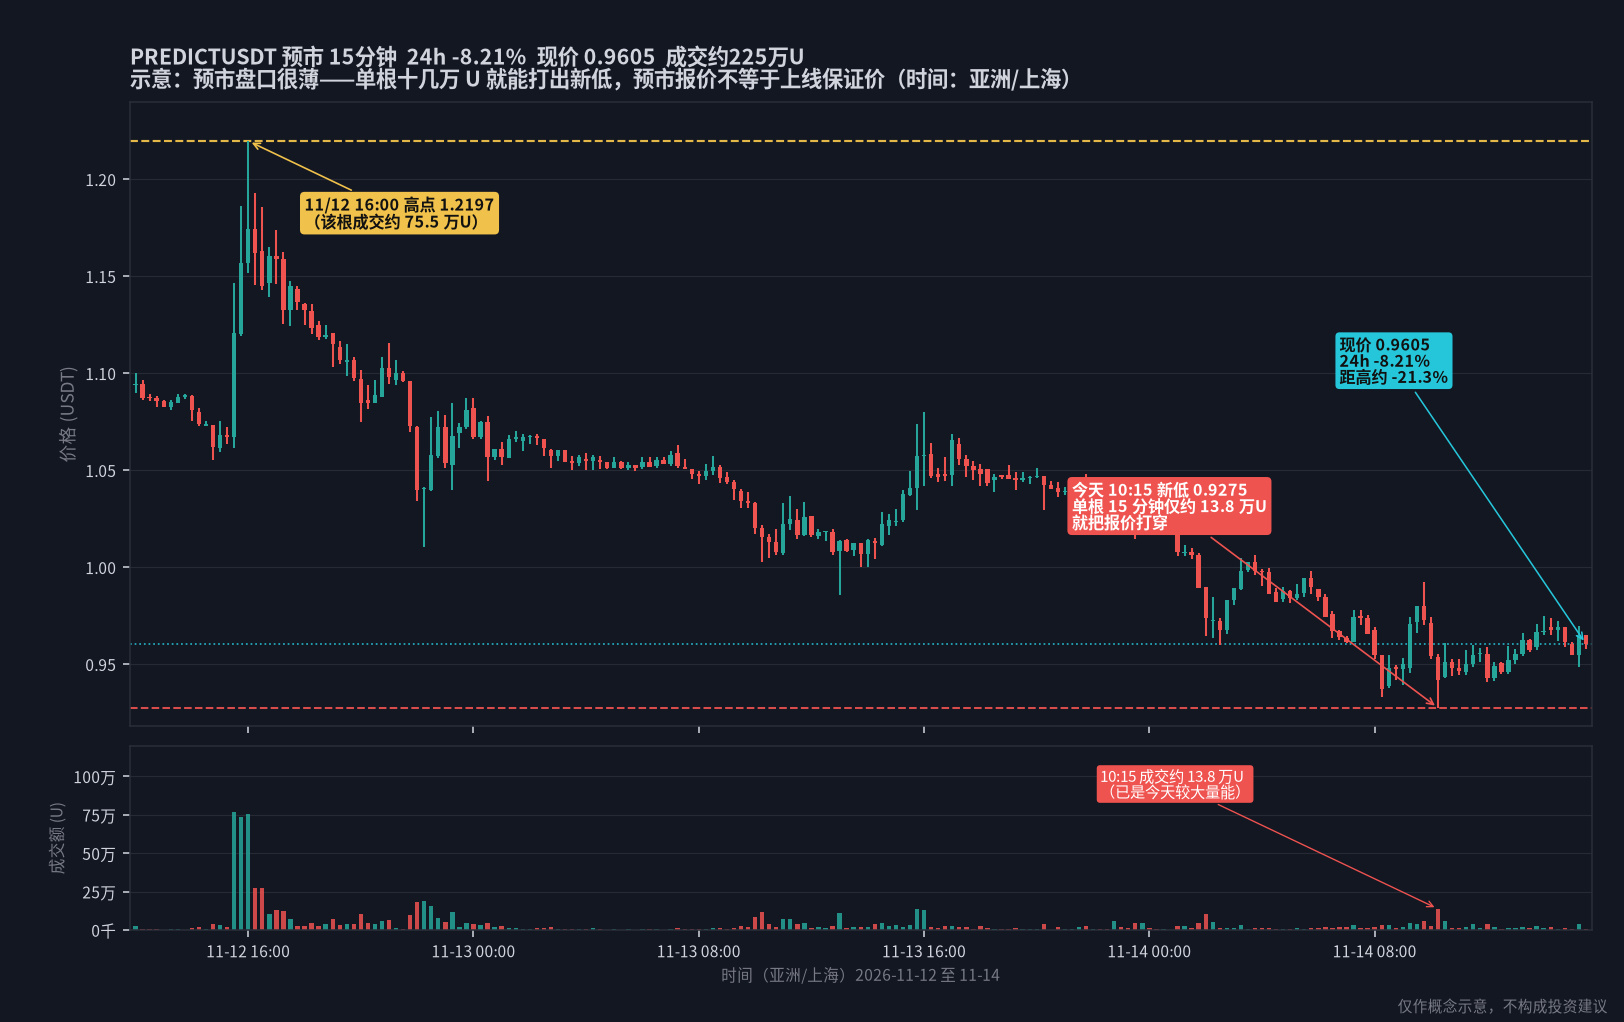
A contract pre-market is not the same as spot already being listed, and the order book is often very thin. $PREDICT is currently around 0.9605, down about -8.2% over 24 hours, with roughly 2.25 million U in trading volume. The high at 11/12 16:00 was 1.2197, and the current price is about -21.3% below that high. At 10:15 today, a single 15-minute candle with about 138,000 U in volume pushed the price from around 0.954 to a new low of 0.9275. By comparison, $BTC contract at 10:15 today had about 1.091 billion U in a single candle. With this kind of pre-market volume, even a relatively small order can skew the quoted price. TGE is still set for 11/18 17:00 (Beijing time); by the opening day, the price may gap, so it does not have to equal the current pre-market price.
When looking at pre-market trading, first check the trading volume and order book depth. Treat the quote as a reference range, not as a guaranteed execution price after listing.
With TGE approaching, will you make your plan based on the pre-market price first, or wait to see the actual liquidity at the open before acting?
For information sharing only, not investment advice.
#预市 #contract
Many people treat the pre-market price as “the price you can buy at as soon as it goes live.” With $PREDICT only a few days away from TGE, today’s move made that misunderstanding plain.
A contract pre-market is not the same as spot already being listed, and the order book is often very thin. $PREDICT is currently around 0.9605, down about -8.2% over 24 hours, with roughly 2.25 million U in trading volume. The high at 11/12 16:00 was 1.2197, and the current price is about -21.3% below that high. At 10:15 today, a single 15-minute candle with about 138,000 U in volume pushed the price from around 0.954 to a new low of 0.9275. By comparison, $BTC contract at 10:15 today had about 1.091 billion U in a single candle. With this kind of pre-market volume, even a relatively small order can skew the quoted price. TGE is still set for 11/18 17:00 (Beijing time); by the opening day, the price may gap, so it does not have to equal the current pre-market price.
When looking at pre-market trading, first check the trading volume and order book depth. Treat the quote as a reference range, not as a guaranteed execution price after listing.
With TGE approaching, will you make your plan based on the pre-market price first, or wait to see the actual liquidity at the open before acting?
For information sharing only, not investment advice.
#预市 #contract
A contract pre-market is not the same as spot already being listed, and the order book is often very thin. $PREDICT is currently around 0.9605, down about -8.2% over 24 hours, with roughly 2.25 million U in trading volume. The high at 11/12 16:00 was 1.2197, and the current price is about -21.3% below that high. At 10:15 today, a single 15-minute candle with about 138,000 U in volume pushed the price from around 0.954 to a new low of 0.9275. By comparison, $BTC contract at 10:15 today had about 1.091 billion U in a single candle. With this kind of pre-market volume, even a relatively small order can skew the quoted price. TGE is still set for 11/18 17:00 (Beijing time); by the opening day, the price may gap, so it does not have to equal the current pre-market price.
When looking at pre-market trading, first check the trading volume and order book depth. Treat the quote as a reference range, not as a guaranteed execution price after listing.
With TGE approaching, will you make your plan based on the pre-market price first, or wait to see the actual liquidity at the open before acting?
For information sharing only, not investment advice.
#预市 #contract
600
·
--
#币安神算子 When the market is doing well, don't get too carried away; when it's doing poorly, don't panic too much. Stick to your own plan to go further in the market. #BinanceOracle
#币安神算子 When the market is doing well, don't get too carried away; when it's doing poorly, don't panic too much. Stick to your own plan to go further in the market. #BinanceOracle

·
--
This afternoon, the $BTC contract suddenly printed a very long lower wick. At first glance, many people might think, “A key level has been decisively broken.” Don’t make a decision based on the wick’s low price just yet.
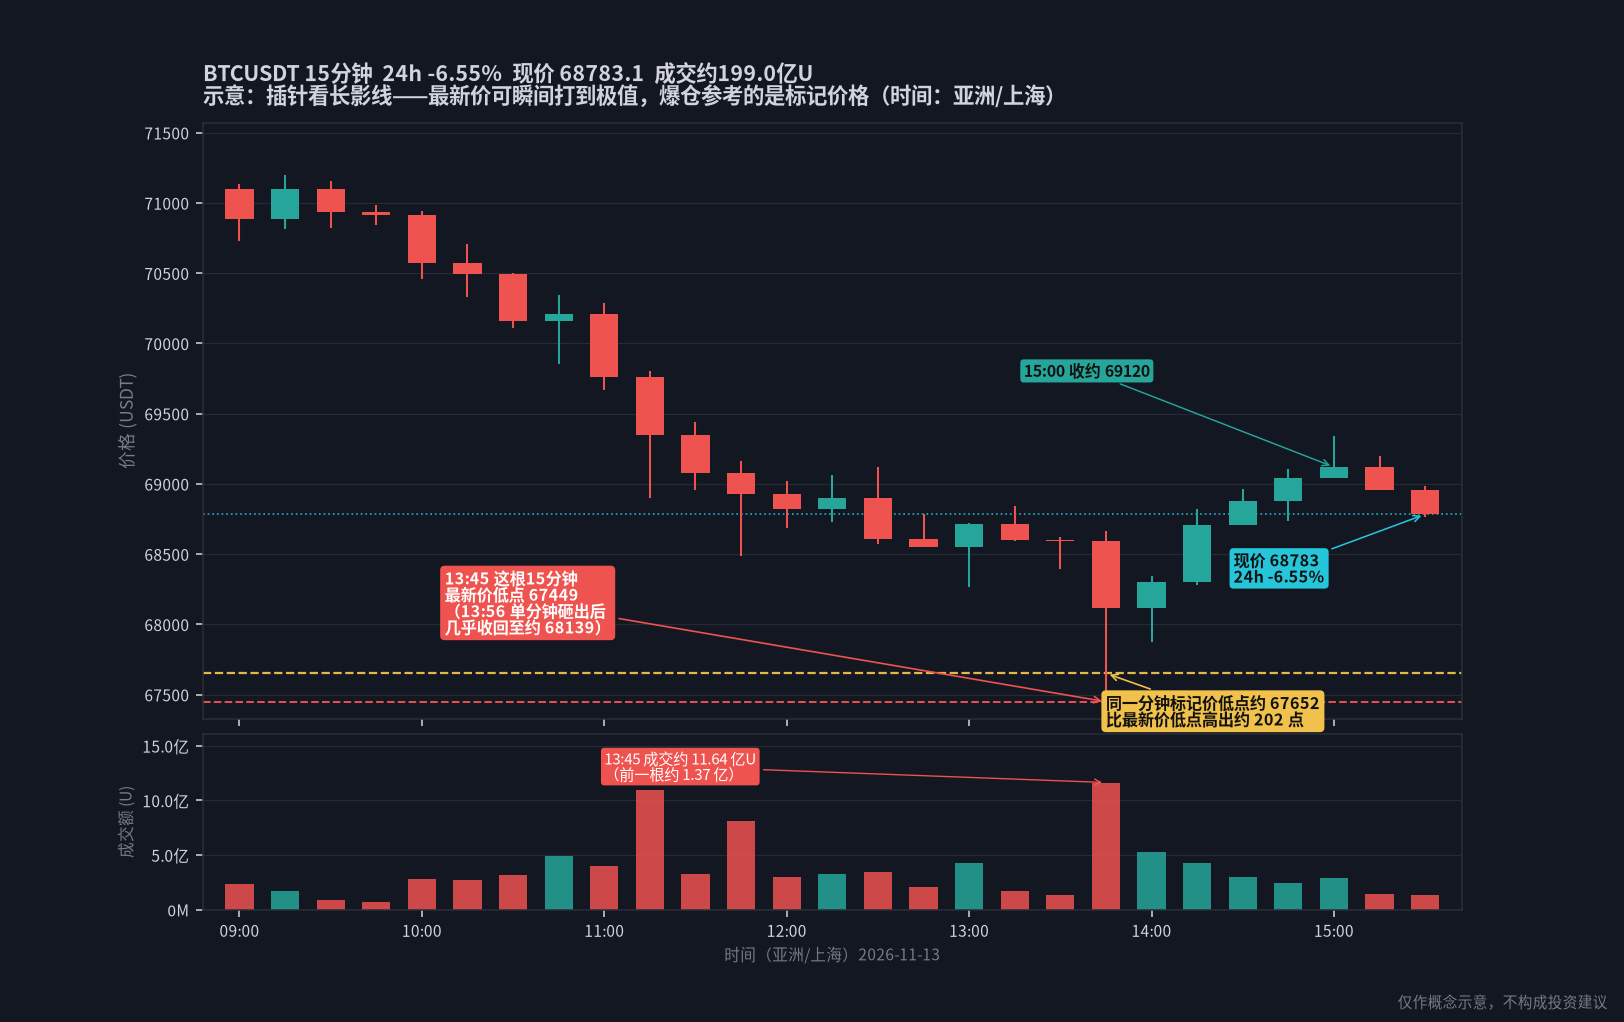
The 13:45 15-minute candle opened at around 68591, dipped to 67449, and closed at around 68113, with volume of about 1.164 billion U—compared with only about 137 million on the previous candle. Now switch to the 1-minute chart: during the 13:56 minute, the last price plunged from around 68121 to 67449, then closed back at around 68139, almost recovering to the open. The mark price bottomed at only around 67652 during that same minute, about 202 points above the low in the last price. By 15:00, the price had recovered to around 69120. The current price is about 68783, down about 6.6% over 24 hours; by comparison, $ETH is at around 1938, down about 5.5%.
Liquidations on futures contracts are based on the mark price, not the tip of a wick in the order book’s last price. When a sudden surge in volume produces a long wick, first check whether the candle recovered, and how far the mark price actually moved, before deciding whether to chase the move with a market sell or cut your position. Try to keep stop-losses away from the just-formed wick low, too—those levels are especially prone to getting swept before the price quickly rebounds.
Wicks can appear in either direction, and the price at the tip is often not the average price you can actually get filled at. Next time you see a “flash break,” will you check the mark price first?
For informational purposes only; this is not investment advice.
#合约 #Bitcoin
This afternoon, the $BTC contract suddenly printed a very long lower wick. At first glance, many people might think, “A key level has been decisively broken.” Don’t make a decision based on the wick’s low price just yet.
The 13:45 15-minute candle opened at around 68591, dipped to 67449, and closed at around 68113, with volume of about 1.164 billion U—compared with only about 137 million on the previous candle. Now switch to the 1-minute chart: during the 13:56 minute, the last price plunged from around 68121 to 67449, then closed back at around 68139, almost recovering to the open. The mark price bottomed at only around 67652 during that same minute, about 202 points above the low in the last price. By 15:00, the price had recovered to around 69120. The current price is about 68783, down about 6.6% over 24 hours; by comparison, $ETH is at around 1938, down about 5.5%.
Liquidations on futures contracts are based on the mark price, not the tip of a wick in the order book’s last price. When a sudden surge in volume produces a long wick, first check whether the candle recovered, and how far the mark price actually moved, before deciding whether to chase the move with a market sell or cut your position. Try to keep stop-losses away from the just-formed wick low, too—those levels are especially prone to getting swept before the price quickly rebounds.
Wicks can appear in either direction, and the price at the tip is often not the average price you can actually get filled at. Next time you see a “flash break,” will you check the mark price first?
For informational purposes only; this is not investment advice.
#合约 #Bitcoin
The 13:45 15-minute candle opened at around 68591, dipped to 67449, and closed at around 68113, with volume of about 1.164 billion U—compared with only about 137 million on the previous candle. Now switch to the 1-minute chart: during the 13:56 minute, the last price plunged from around 68121 to 67449, then closed back at around 68139, almost recovering to the open. The mark price bottomed at only around 67652 during that same minute, about 202 points above the low in the last price. By 15:00, the price had recovered to around 69120. The current price is about 68783, down about 6.6% over 24 hours; by comparison, $ETH is at around 1938, down about 5.5%.
Liquidations on futures contracts are based on the mark price, not the tip of a wick in the order book’s last price. When a sudden surge in volume produces a long wick, first check whether the candle recovered, and how far the mark price actually moved, before deciding whether to chase the move with a market sell or cut your position. Try to keep stop-losses away from the just-formed wick low, too—those levels are especially prone to getting swept before the price quickly rebounds.
Wicks can appear in either direction, and the price at the tip is often not the average price you can actually get filled at. Next time you see a “flash break,” will you check the mark price first?
For informational purposes only; this is not investment advice.
#合约 #Bitcoin
77
·
--
The most interesting thing about making predictions with #币安神算子 is that before the results come in, no one can guarantee they’re right. It’s important to think independently. #BinanceOracle
The most interesting thing about making predictions with #币安神算子 is that before the results come in, no one can guarantee they’re right. It’s important to think independently. #BinanceOracle

·
--
Seeing “+200%” on the top gainers list, it’s easy to think the rally is just getting started and it’s not too late to get in. But that number can change on its own.
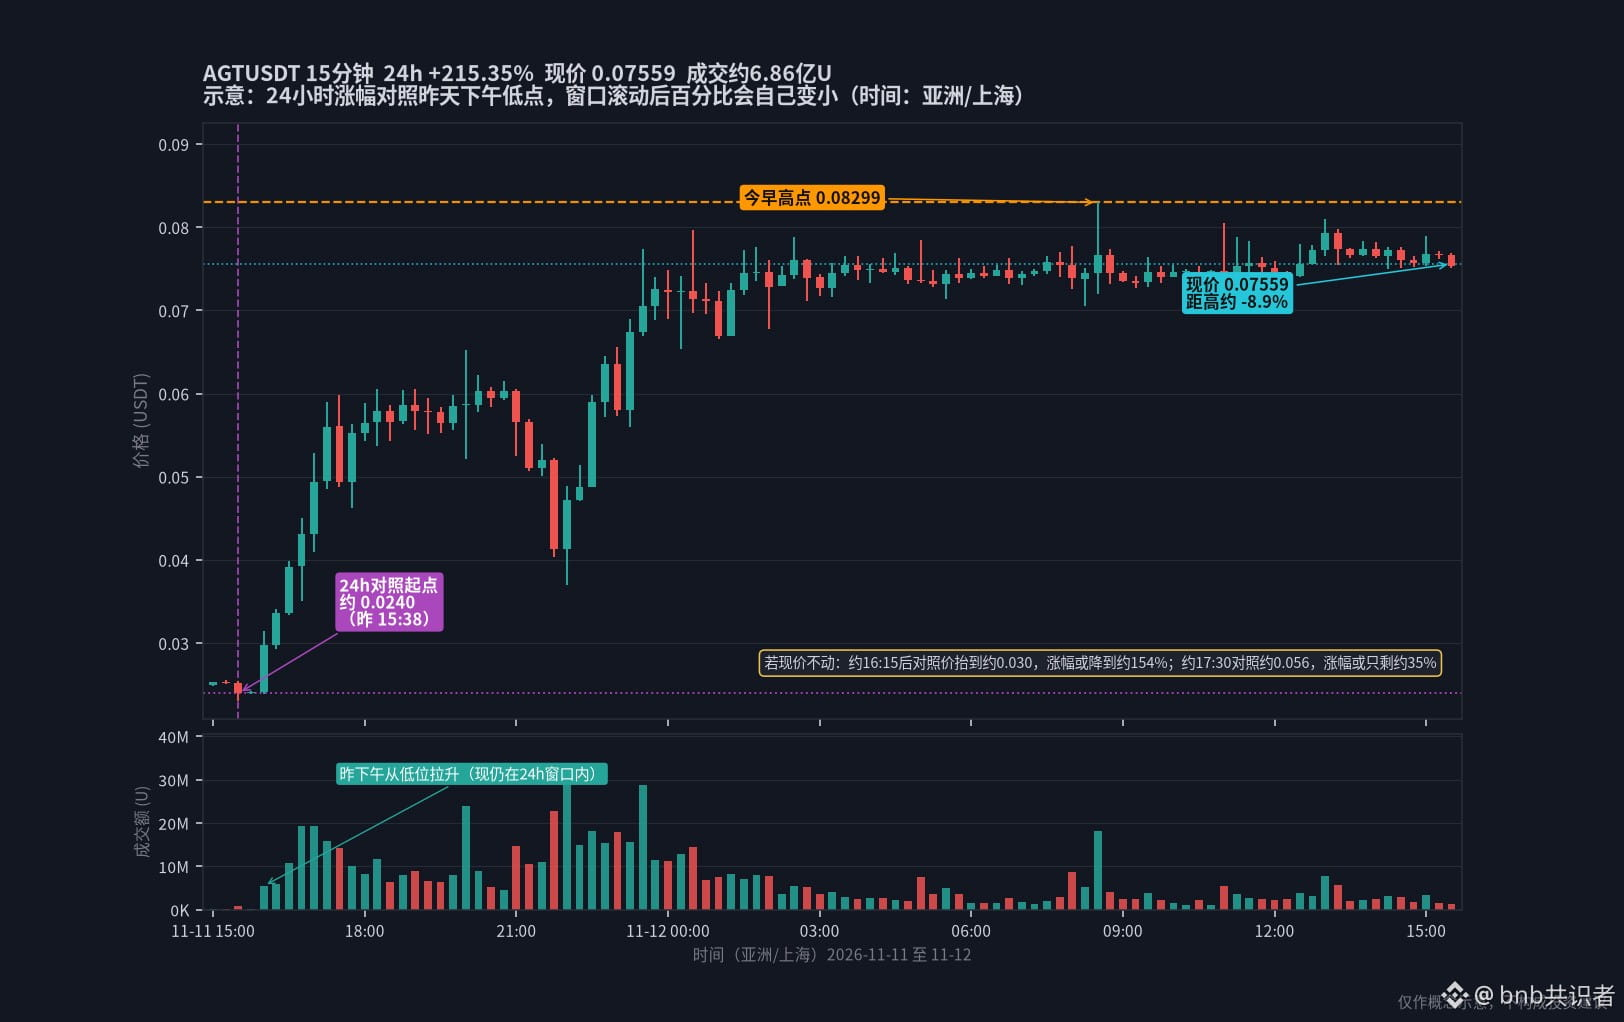
This afternoon’s $AGT is a good example. The contract is currently around 0.0756, up about +215.4% over 24 hours, with roughly 686 million U in trading volume. But the comparison isn’t with midnight today—it’s with the rolling 24 hours before now, roughly 0.024 around 15:38 yesterday afternoon. It was still near its low then, so the calculation shows a gain of more than 200%. It had already touched a high of 0.08299 at 08:30 this morning, and the current price is about 8.9% below that high. If the price doesn’t rise much further, after around 16:15 the reference price will move up to about 0.030, and the gain at the same current price could fall to around 154%. By 17:30, the reference price will be around 0.056, leaving a gain of only about 35%. Meanwhile, $BTC is around 73,600, down about 0.3%, so the broader market is nearly flat—not a full-on bull market lifting it.
Here are three steps to keep in mind: when you see a 24-hour gain, first ask what price it’s being compared with and how soon that low will roll out of the window; then check how far the current price has fallen from its high, rather than assuming that “still at the top of the list” means the move is just starting. As the window rolls forward, the displayed gain will shrink on its own. That doesn’t mean the price has suddenly crashed, and it’s no reason to chase based on the old gain.
The percentages on the top gainers list keep rolling; they aren’t fixed from midnight today. Next time you check the list, will you first ask, “Is it still being compared with yesterday’s low?”
For informational purposes only; this is not investment advice.
#合约 #TopGainers
Seeing “+200%” on the top gainers list, it’s easy to think the rally is just getting started and it’s not too late to get in. But that number can change on its own.
This afternoon’s $AGT is a good example. The contract is currently around 0.0756, up about +215.4% over 24 hours, with roughly 686 million U in trading volume. But the comparison isn’t with midnight today—it’s with the rolling 24 hours before now, roughly 0.024 around 15:38 yesterday afternoon. It was still near its low then, so the calculation shows a gain of more than 200%. It had already touched a high of 0.08299 at 08:30 this morning, and the current price is about 8.9% below that high. If the price doesn’t rise much further, after around 16:15 the reference price will move up to about 0.030, and the gain at the same current price could fall to around 154%. By 17:30, the reference price will be around 0.056, leaving a gain of only about 35%. Meanwhile, $BTC is around 73,600, down about 0.3%, so the broader market is nearly flat—not a full-on bull market lifting it.
Here are three steps to keep in mind: when you see a 24-hour gain, first ask what price it’s being compared with and how soon that low will roll out of the window; then check how far the current price has fallen from its high, rather than assuming that “still at the top of the list” means the move is just starting. As the window rolls forward, the displayed gain will shrink on its own. That doesn’t mean the price has suddenly crashed, and it’s no reason to chase based on the old gain.
The percentages on the top gainers list keep rolling; they aren’t fixed from midnight today. Next time you check the list, will you first ask, “Is it still being compared with yesterday’s low?”
For informational purposes only; this is not investment advice.
#合约 #TopGainers
This afternoon’s $AGT is a good example. The contract is currently around 0.0756, up about +215.4% over 24 hours, with roughly 686 million U in trading volume. But the comparison isn’t with midnight today—it’s with the rolling 24 hours before now, roughly 0.024 around 15:38 yesterday afternoon. It was still near its low then, so the calculation shows a gain of more than 200%. It had already touched a high of 0.08299 at 08:30 this morning, and the current price is about 8.9% below that high. If the price doesn’t rise much further, after around 16:15 the reference price will move up to about 0.030, and the gain at the same current price could fall to around 154%. By 17:30, the reference price will be around 0.056, leaving a gain of only about 35%. Meanwhile, $BTC is around 73,600, down about 0.3%, so the broader market is nearly flat—not a full-on bull market lifting it.
Here are three steps to keep in mind: when you see a 24-hour gain, first ask what price it’s being compared with and how soon that low will roll out of the window; then check how far the current price has fallen from its high, rather than assuming that “still at the top of the list” means the move is just starting. As the window rolls forward, the displayed gain will shrink on its own. That doesn’t mean the price has suddenly crashed, and it’s no reason to chase based on the old gain.
The percentages on the top gainers list keep rolling; they aren’t fixed from midnight today. Next time you check the list, will you first ask, “Is it still being compared with yesterday’s low?”
For informational purposes only; this is not investment advice.
#合约 #TopGainers
318
·
--
#币安神算子 The market is never short of opportunities, but capital and patience are limited. A little less impulsiveness, a little more thought—I hope to gain something today, too. #BinanceOracle
#币安神算子 The market is never short of opportunities, but capital and patience are limited. A little less impulsiveness, a little more thought—I hope to gain something today, too. #BinanceOracle

·
--
When you see the price make a second run at the morning high, it’s easy to think, “This time it’ll definitely break through,” and jump in just before it gets there—that’s one of the most common traps today.
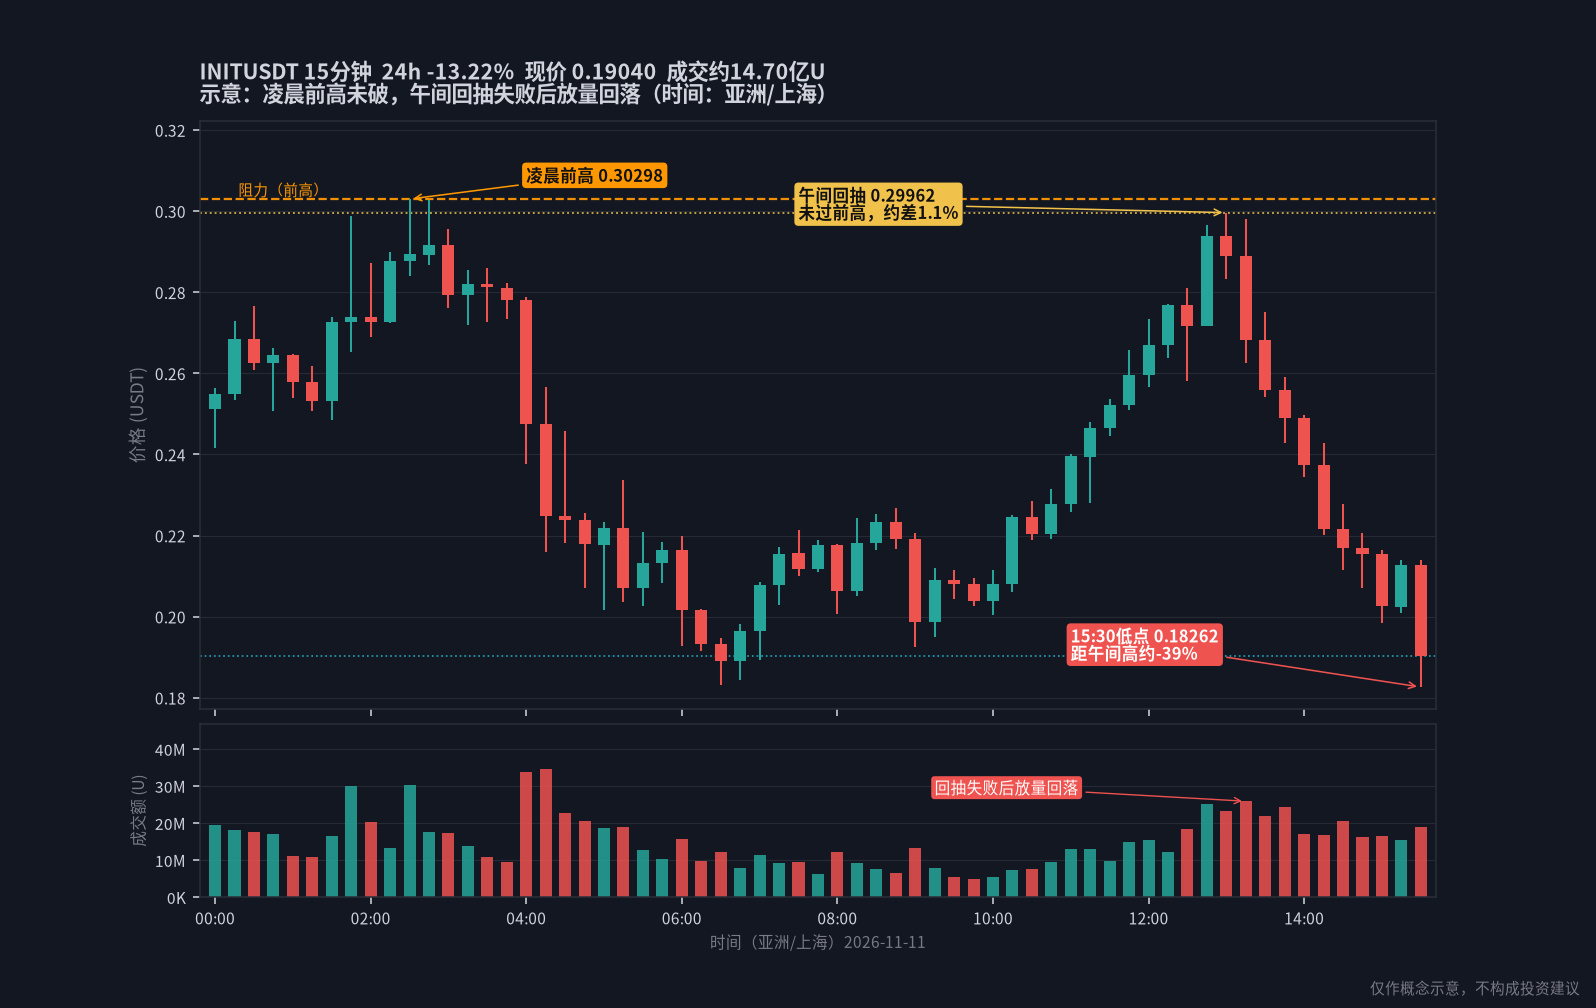
This afternoon’s $INIT is a perfect example. Around 2:30 a.m., it first reached about 0.30298. Around 13:00, it pulled back to a high of about 0.29962—just 1.1% below the previous high. But it only touched that level with its upper wick; the candle didn’t close above it. Over the next two and a half hours or so, trading volume picked up as the price fell. At 15:30, it briefly dropped to around 0.18262, and it’s now about 0.190—roughly 36% below the midday high. Futures trading volume was about 1.47 billion U. By comparison, $BTC was around 73847, down about 1.3%. The broader market was weak, but it wasn’t a full-scale crash.
Here are three steps to keep in mind: First, when the price retests a previous high, check whether it closes above that level and holds there. If it only touches the level without breaking through, the resistance is still in place. Next, check whether the rally stalls on rising volume and whether the pullback also happens on rising volume—a surge in volume means the selling pressure is real. Until a breakout is confirmed, don’t treat “it’s just a little short” as a reason to chase the price higher. It’s better to wait for the chart structure to develop, or treat the area around the previous high as a place to reduce your position and watch.
A near-break of the previous high is often not an opportunity—it means the resistance is still there. Would you still chase the price at “just one step away” after today’s failed retest?
For informational purposes only; this is not investment advice.
#合约 #TechnicalAnalysis
When you see the price make a second run at the morning high, it’s easy to think, “This time it’ll definitely break through,” and jump in just before it gets there—that’s one of the most common traps today.
This afternoon’s $INIT is a perfect example. Around 2:30 a.m., it first reached about 0.30298. Around 13:00, it pulled back to a high of about 0.29962—just 1.1% below the previous high. But it only touched that level with its upper wick; the candle didn’t close above it. Over the next two and a half hours or so, trading volume picked up as the price fell. At 15:30, it briefly dropped to around 0.18262, and it’s now about 0.190—roughly 36% below the midday high. Futures trading volume was about 1.47 billion U. By comparison, $BTC was around 73847, down about 1.3%. The broader market was weak, but it wasn’t a full-scale crash.
Here are three steps to keep in mind: First, when the price retests a previous high, check whether it closes above that level and holds there. If it only touches the level without breaking through, the resistance is still in place. Next, check whether the rally stalls on rising volume and whether the pullback also happens on rising volume—a surge in volume means the selling pressure is real. Until a breakout is confirmed, don’t treat “it’s just a little short” as a reason to chase the price higher. It’s better to wait for the chart structure to develop, or treat the area around the previous high as a place to reduce your position and watch.
A near-break of the previous high is often not an opportunity—it means the resistance is still there. Would you still chase the price at “just one step away” after today’s failed retest?
For informational purposes only; this is not investment advice.
#合约 #TechnicalAnalysis
This afternoon’s $INIT is a perfect example. Around 2:30 a.m., it first reached about 0.30298. Around 13:00, it pulled back to a high of about 0.29962—just 1.1% below the previous high. But it only touched that level with its upper wick; the candle didn’t close above it. Over the next two and a half hours or so, trading volume picked up as the price fell. At 15:30, it briefly dropped to around 0.18262, and it’s now about 0.190—roughly 36% below the midday high. Futures trading volume was about 1.47 billion U. By comparison, $BTC was around 73847, down about 1.3%. The broader market was weak, but it wasn’t a full-scale crash.
Here are three steps to keep in mind: First, when the price retests a previous high, check whether it closes above that level and holds there. If it only touches the level without breaking through, the resistance is still in place. Next, check whether the rally stalls on rising volume and whether the pullback also happens on rising volume—a surge in volume means the selling pressure is real. Until a breakout is confirmed, don’t treat “it’s just a little short” as a reason to chase the price higher. It’s better to wait for the chart structure to develop, or treat the area around the previous high as a place to reduce your position and watch.
A near-break of the previous high is often not an opportunity—it means the resistance is still there. Would you still chase the price at “just one step away” after today’s failed retest?
For informational purposes only; this is not investment advice.
#合约 #TechnicalAnalysis
381
·
--
#币安神算子 Recent market volatility has been quite interesting. Ups and downs are normal, and managing risk well is more important than blindly chasing returns. #BinanceOracle
#币安神算子 Recent market volatility has been quite interesting. Ups and downs are normal, and managing risk well is more important than blindly chasing returns. #BinanceOracle

·
--
When people open a futures position and set leverage to 10x or 20x, many assume, “It won’t be a problem as long as the price doesn’t fall all the way back.” But the price doesn’t have to hit zero for your position to be liquidated first.
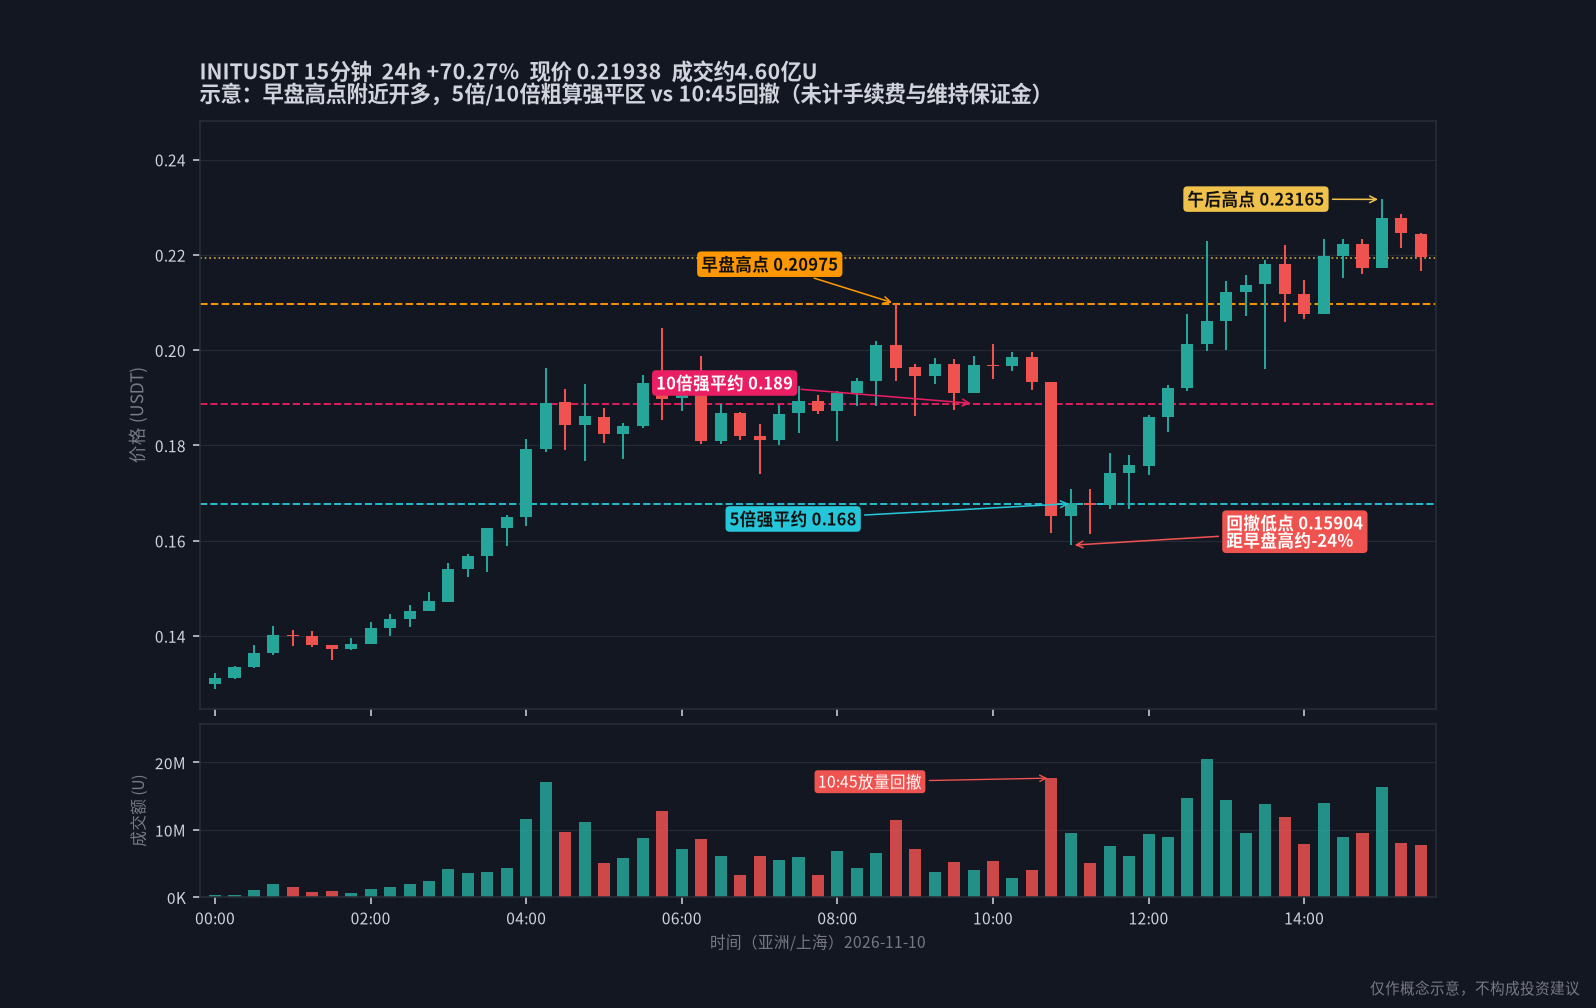
This afternoon’s $INIT is a case in point. The contract is up about +70.3%, with roughly 460 million U in trading volume. The current price is around 0.219, and the intraday high was about 0.232. Around 8:45 this morning, it first surged to about 0.210. Starting at 10:45, over roughly 15 minutes, the price plunged from around 0.193 to about 0.159—a drop of about 24% from the morning high.
Here’s a rough way to estimate liquidation levels (excluding fees and maintenance margin): a 10x long can withstand only about a 10% pullback, a 20x long about 5%, and a 5x long about 20%. If you chased a long at 10x near the morning high, a drop to around 0.189 could have liquidated you. Today’s red candle even broke through the approximate 0.168 level for a 5x position. Although the price later rallied to a new high of around 0.232, if your position is gone, that new high has nothing to do with you. By comparison, $BTC was up about +0.9% over the same period, and sat about 1% below its high—the volatility was on a completely different scale.
Before using leverage, calculate your liquidation price and check whether recent candles could swing down to that level. If the asset is highly volatile, reduce your leverage, use a smaller position, or switch to isolated margin. Don’t risk your entire principal on a single red candle.
The harder the price surges, the more high leverage looks like a countdown—not an accelerator. After seeing today’s 10:45 red candle, would you still use 10x to chase the top gainers?
For informational purposes only; this is not investment advice.
#合约 #Leverage
When people open a futures position and set leverage to 10x or 20x, many assume, “It won’t be a problem as long as the price doesn’t fall all the way back.” But the price doesn’t have to hit zero for your position to be liquidated first.
This afternoon’s $INIT is a case in point. The contract is up about +70.3%, with roughly 460 million U in trading volume. The current price is around 0.219, and the intraday high was about 0.232. Around 8:45 this morning, it first surged to about 0.210. Starting at 10:45, over roughly 15 minutes, the price plunged from around 0.193 to about 0.159—a drop of about 24% from the morning high.
Here’s a rough way to estimate liquidation levels (excluding fees and maintenance margin): a 10x long can withstand only about a 10% pullback, a 20x long about 5%, and a 5x long about 20%. If you chased a long at 10x near the morning high, a drop to around 0.189 could have liquidated you. Today’s red candle even broke through the approximate 0.168 level for a 5x position. Although the price later rallied to a new high of around 0.232, if your position is gone, that new high has nothing to do with you. By comparison, $BTC was up about +0.9% over the same period, and sat about 1% below its high—the volatility was on a completely different scale.
Before using leverage, calculate your liquidation price and check whether recent candles could swing down to that level. If the asset is highly volatile, reduce your leverage, use a smaller position, or switch to isolated margin. Don’t risk your entire principal on a single red candle.
The harder the price surges, the more high leverage looks like a countdown—not an accelerator. After seeing today’s 10:45 red candle, would you still use 10x to chase the top gainers?
For informational purposes only; this is not investment advice.
#合约 #Leverage
This afternoon’s $INIT is a case in point. The contract is up about +70.3%, with roughly 460 million U in trading volume. The current price is around 0.219, and the intraday high was about 0.232. Around 8:45 this morning, it first surged to about 0.210. Starting at 10:45, over roughly 15 minutes, the price plunged from around 0.193 to about 0.159—a drop of about 24% from the morning high.
Here’s a rough way to estimate liquidation levels (excluding fees and maintenance margin): a 10x long can withstand only about a 10% pullback, a 20x long about 5%, and a 5x long about 20%. If you chased a long at 10x near the morning high, a drop to around 0.189 could have liquidated you. Today’s red candle even broke through the approximate 0.168 level for a 5x position. Although the price later rallied to a new high of around 0.232, if your position is gone, that new high has nothing to do with you. By comparison, $BTC was up about +0.9% over the same period, and sat about 1% below its high—the volatility was on a completely different scale.
Before using leverage, calculate your liquidation price and check whether recent candles could swing down to that level. If the asset is highly volatile, reduce your leverage, use a smaller position, or switch to isolated margin. Don’t risk your entire principal on a single red candle.
The harder the price surges, the more high leverage looks like a countdown—not an accelerator. After seeing today’s 10:45 red candle, would you still use 10x to chase the top gainers?
For informational purposes only; this is not investment advice.
#合约 #Leverage
341
·
--
#币安神算子 When the market is doing well, don't get too carried away; when it's doing poorly, don't panic too much. Stick to your own plan, and you'll go further in the market. #BinanceOracle
#币安神算子 When the market is doing well, don't get too carried away; when it's doing poorly, don't panic too much. Stick to your own plan, and you'll go further in the market. #BinanceOracle

·
--
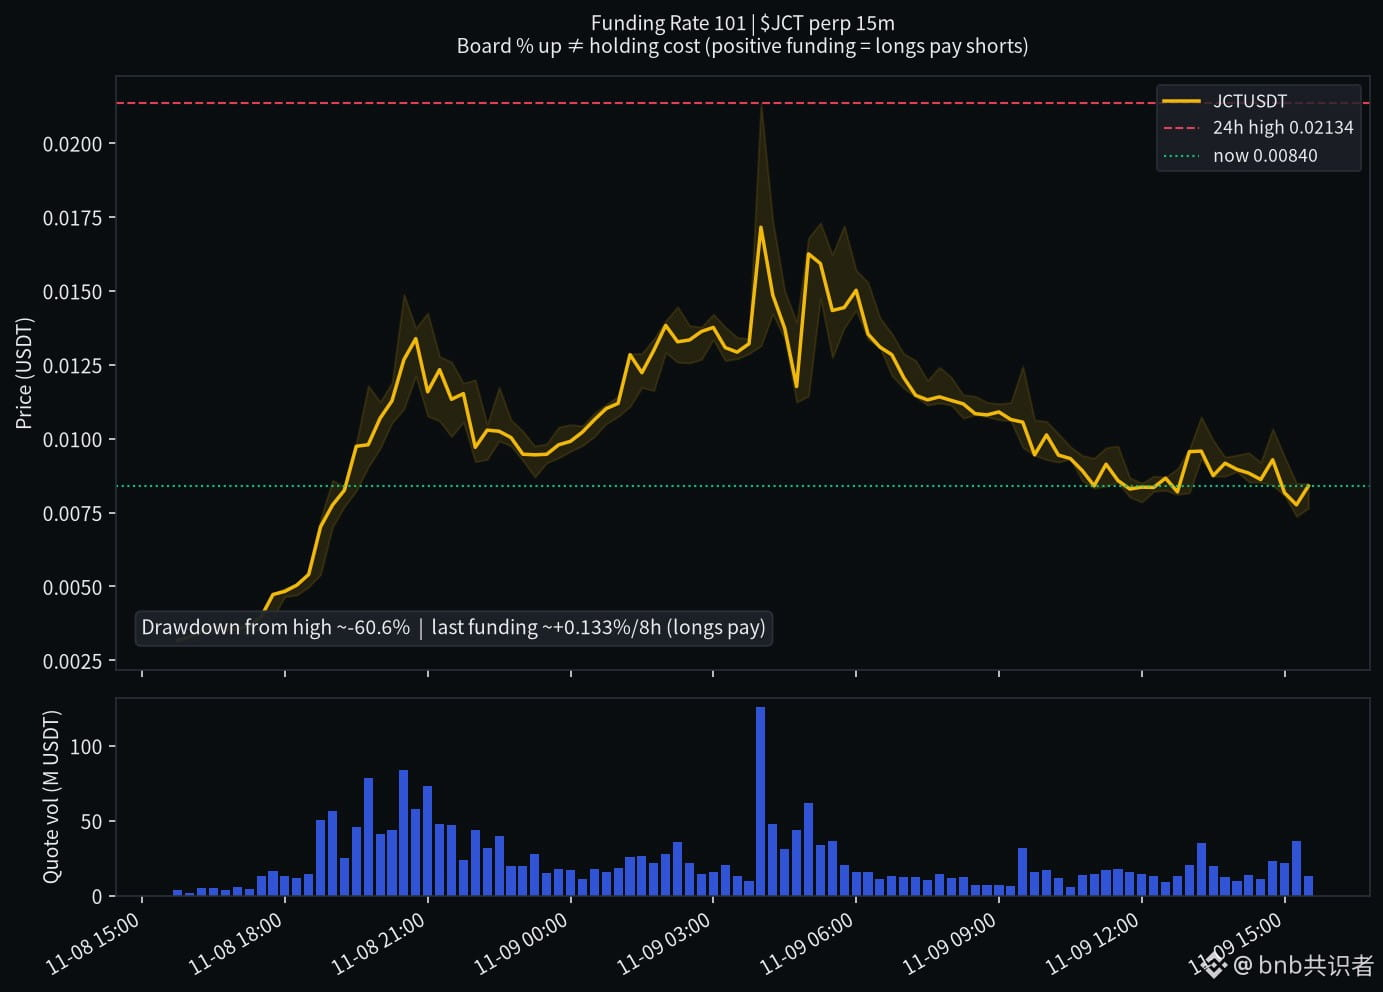
On the board, contract $JCT is still hovering on the gainers list—up about +153% over 24 hours, with roughly 2.29 billion U in trading volume. It’s easy to focus only on “how much it’s up.” But the current price is around 0.0085, down about 61% from the intraday high of around 0.0213. What’s less obvious is that the latest funding rate is around +0.13% per 8 hours (longs pay shorts).
What is the funding rate? Perpetual contracts have no expiry date, so the “funding rate” helps keep the contract price anchored to the spot price: when the rate is positive, longs pay based on their notional position every 8 hours; when it’s negative, shorts pay. The number may look small, but leverage can make it sting—a rate holding around 0.13% per interval, settled three times a day, would cost roughly 0.4% of the notional position per day. At 10x leverage, that’s roughly 4% of your margin per day (the rate can change; it’s not a fixed tax).
Here’s how to read it in three steps: ① Check whether the latest funding rate is positive or negative, and how large it is; ② Consider your leverage and how long you plan to hold; ③ Calculate the funding cost alongside your expected return—don’t just look at the gainers list. Compared with $BTC , which is down about 2.3% today, and a broadly weak market, “overheated longs” in narrative-driven tokens often show up first in the funding rate, not in the hype.
Next time something surges up the gainers list, will you check its funding rate first?
#合约 #资金费率 #Binance Square
For informational purposes only; not investment advice.
On the board, contract $JCT is still hovering on the gainers list—up about +153% over 24 hours, with roughly 2.29 billion U in trading volume. It’s easy to focus only on “how much it’s up.” But the current price is around 0.0085, down about 61% from the intraday high of around 0.0213. What’s less obvious is that the latest funding rate is around +0.13% per 8 hours (longs pay shorts).
What is the funding rate? Perpetual contracts have no expiry date, so the “funding rate” helps keep the contract price anchored to the spot price: when the rate is positive, longs pay based on their notional position every 8 hours; when it’s negative, shorts pay. The number may look small, but leverage can make it sting—a rate holding around 0.13% per interval, settled three times a day, would cost roughly 0.4% of the notional position per day. At 10x leverage, that’s roughly 4% of your margin per day (the rate can change; it’s not a fixed tax).
Here’s how to read it in three steps: ① Check whether the latest funding rate is positive or negative, and how large it is; ② Consider your leverage and how long you plan to hold; ③ Calculate the funding cost alongside your expected return—don’t just look at the gainers list. Compared with $BTC , which is down about 2.3% today, and a broadly weak market, “overheated longs” in narrative-driven tokens often show up first in the funding rate, not in the hype.
Next time something surges up the gainers list, will you check its funding rate first?
#合约 #资金费率 #Binance Square
For informational purposes only; not investment advice.
What is the funding rate? Perpetual contracts have no expiry date, so the “funding rate” helps keep the contract price anchored to the spot price: when the rate is positive, longs pay based on their notional position every 8 hours; when it’s negative, shorts pay. The number may look small, but leverage can make it sting—a rate holding around 0.13% per interval, settled three times a day, would cost roughly 0.4% of the notional position per day. At 10x leverage, that’s roughly 4% of your margin per day (the rate can change; it’s not a fixed tax).
Here’s how to read it in three steps: ① Check whether the latest funding rate is positive or negative, and how large it is; ② Consider your leverage and how long you plan to hold; ③ Calculate the funding cost alongside your expected return—don’t just look at the gainers list. Compared with $BTC , which is down about 2.3% today, and a broadly weak market, “overheated longs” in narrative-driven tokens often show up first in the funding rate, not in the hype.
Next time something surges up the gainers list, will you check its funding rate first?
#合约 #资金费率 #Binance Square
For informational purposes only; not investment advice.
84
·
--
#币安神算子 The market offers new opportunities every day. The key is to trust your own judgment, avoid blindly following the crowd, and rationally analyze every market move. #BinanceOracle
#币安神算子 The market offers new opportunities every day. The key is to trust your own judgment, avoid blindly following the crowd, and rationally analyze every market move. #BinanceOracle

3
·
--
Open the contract gainers list and the screen is full of big red numbers. Your finger moves faster than your brain—but “24-hour change” measures the difference from the same time yesterday, not how far the price is from its current high.
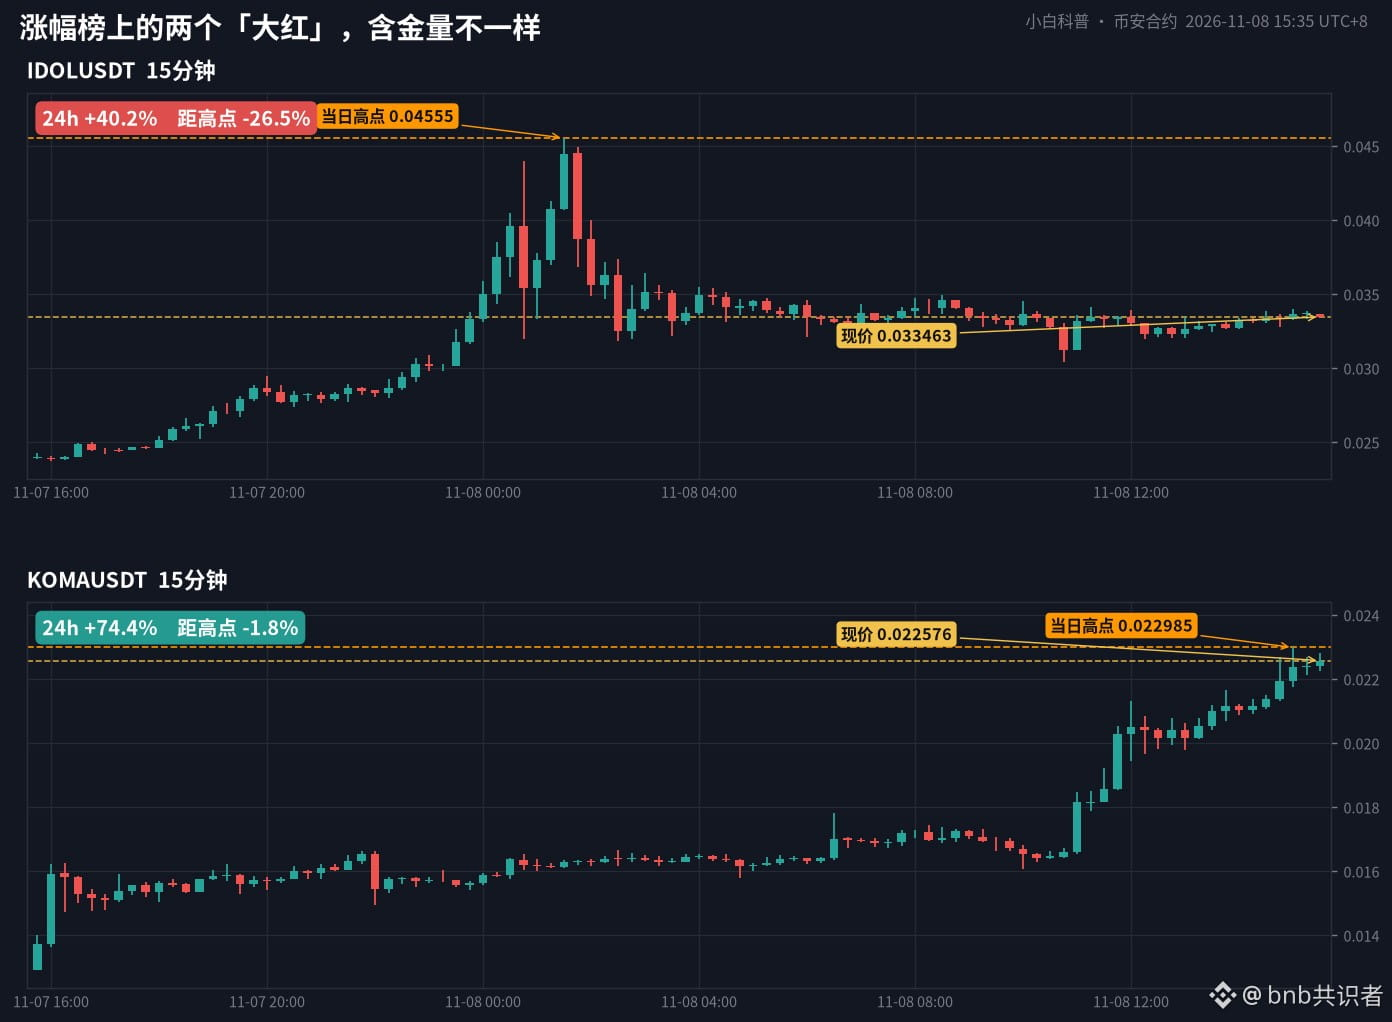
You can see the trap this afternoon: contract $IDOL is still up about +40.2%, with roughly 471 million U in trading volume and a current price around 0.0335. But its intraday high was about 0.0456, and it has already pulled back around 26.5% from the peak. Nearby, contract $KOMA is up about +74.4%, with roughly 112 million U in trading volume and a current price around 0.0226—just about 1.8% below its high, still near a new peak. Both are big green candles on the leaderboard: one has slid down from the summit, while the other is still near the top.
So when you open the candlestick chart, do three things first: check the gap between the high and the current price. If the pullback is already substantial, much of the move shown on the leaderboard may have already happened. Then check whether the pullback came with heavy volume—if it did, that suggests real selling pressure. If you still decide to follow, use a limit order and plan your exit first. Don’t treat the gainers list like a buy button.
The gainers list is useful for spotting unusual moves, not as a signal to jump in. With these two numbers side by side today, which one would you be more willing to chase?
For informational purposes only; this is not investment advice.
#合约 #TopGainers
Open the contract gainers list and the screen is full of big red numbers. Your finger moves faster than your brain—but “24-hour change” measures the difference from the same time yesterday, not how far the price is from its current high.
You can see the trap this afternoon: contract $IDOL is still up about +40.2%, with roughly 471 million U in trading volume and a current price around 0.0335. But its intraday high was about 0.0456, and it has already pulled back around 26.5% from the peak. Nearby, contract $KOMA is up about +74.4%, with roughly 112 million U in trading volume and a current price around 0.0226—just about 1.8% below its high, still near a new peak. Both are big green candles on the leaderboard: one has slid down from the summit, while the other is still near the top.
So when you open the candlestick chart, do three things first: check the gap between the high and the current price. If the pullback is already substantial, much of the move shown on the leaderboard may have already happened. Then check whether the pullback came with heavy volume—if it did, that suggests real selling pressure. If you still decide to follow, use a limit order and plan your exit first. Don’t treat the gainers list like a buy button.
The gainers list is useful for spotting unusual moves, not as a signal to jump in. With these two numbers side by side today, which one would you be more willing to chase?
For informational purposes only; this is not investment advice.
#合约 #TopGainers
You can see the trap this afternoon: contract $IDOL is still up about +40.2%, with roughly 471 million U in trading volume and a current price around 0.0335. But its intraday high was about 0.0456, and it has already pulled back around 26.5% from the peak. Nearby, contract $KOMA is up about +74.4%, with roughly 112 million U in trading volume and a current price around 0.0226—just about 1.8% below its high, still near a new peak. Both are big green candles on the leaderboard: one has slid down from the summit, while the other is still near the top.
So when you open the candlestick chart, do three things first: check the gap between the high and the current price. If the pullback is already substantial, much of the move shown on the leaderboard may have already happened. Then check whether the pullback came with heavy volume—if it did, that suggests real selling pressure. If you still decide to follow, use a limit order and plan your exit first. Don’t treat the gainers list like a buy button.
The gainers list is useful for spotting unusual moves, not as a signal to jump in. With these two numbers side by side today, which one would you be more willing to chase?
For informational purposes only; this is not investment advice.
#合约 #TopGainers
492
·
--
#币安神算子 When the market is doing well, don't get carried away; when it's doing poorly, don't panic. Stick to your own plan to go further in the market. #BinanceOracle
#币安神算子 When the market is doing well, don't get carried away; when it's doing poorly, don't panic. Stick to your own plan to go further in the market. #BinanceOracle

3
·
--
$ONE rose by more than 50 points in a day on the order book. You quickly tap “Buy at Market,” only to get filled at a price well above the latest price you were watching—that’s not a delay, it’s slippage.
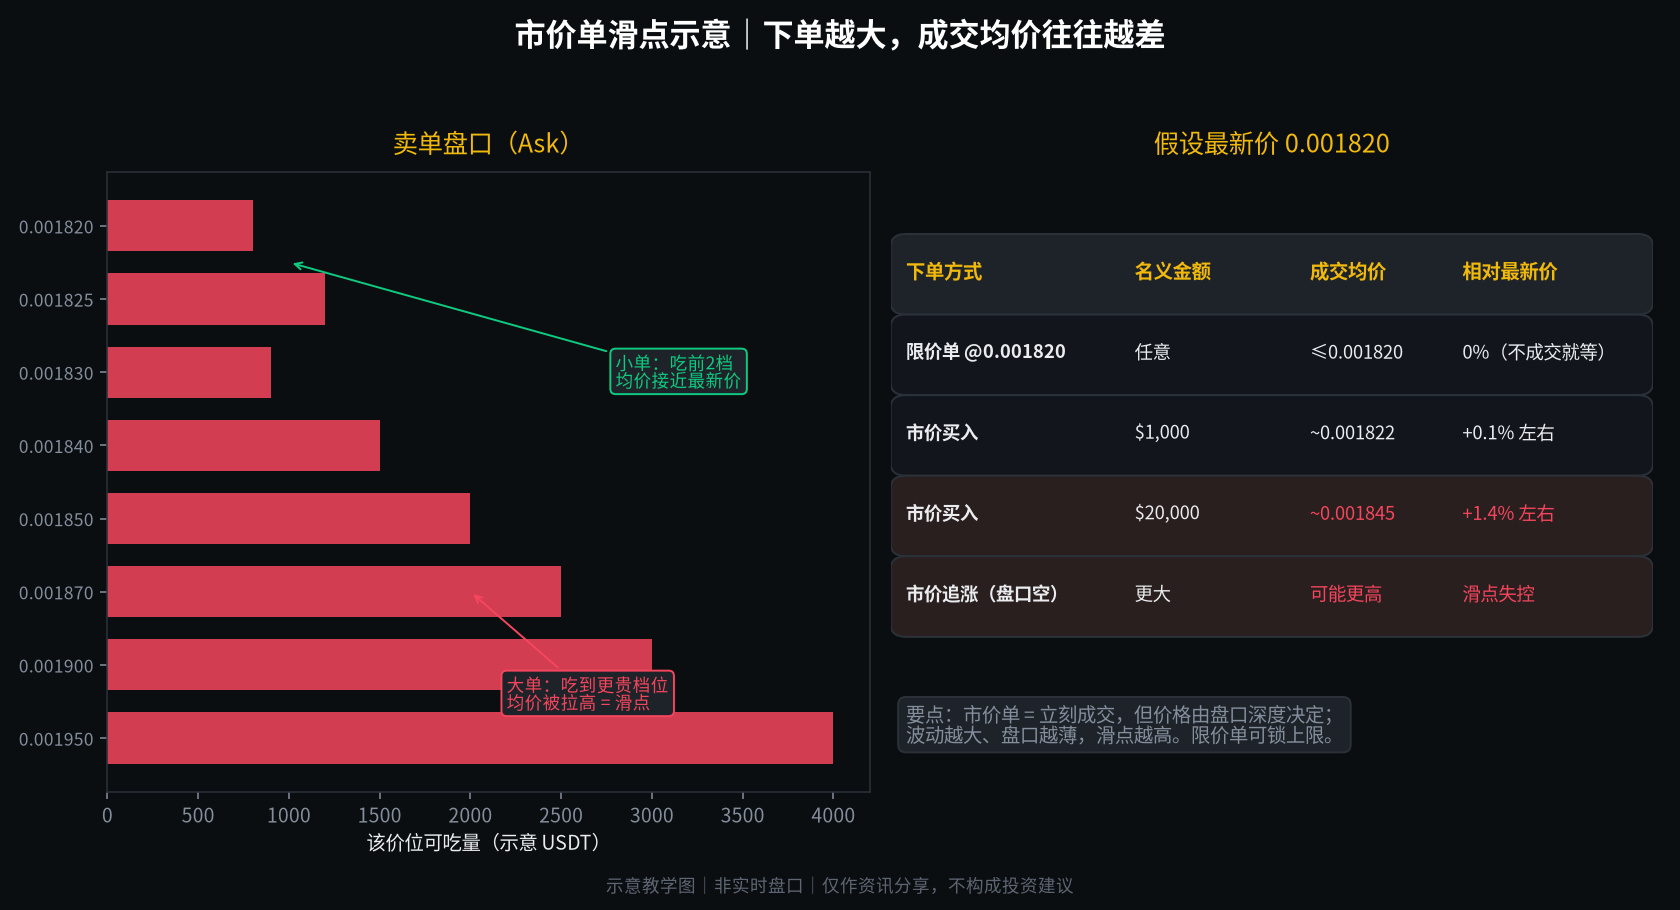
The essence of a market order is immediate execution: the system consumes sell orders starting from the best ask and moving upward until your full quantity is filled. When the order book is thin and volatility is high, the next few price levels can be much more expensive, pushing up your average fill price. Here are three steps to follow: ① Check the order book depth; don’t look only at the latest price. ② When chasing a rally, favor limit orders and set the highest price you’re willing to pay. ③ If you must use a market order, split it into smaller amounts or set a maximum slippage limit in your trading settings.
Today’s comparison: contract $ONE is up about 57%, with roughly 300 million U in trading volume; $AKE ’s intraday high is more than double its low; $BTC is still moving sideways around 76,000. On days when a hot trend accelerates like this, chasing with market orders makes it especially easy to “overpay.”
A good-looking gain ≠ a good-looking fill price. Do you check the order book before placing an order, or do you usually go straight to a market order? #合约交易 #Beginner Tutorial
For informational purposes only; this is not investment advice.
$ONE rose by more than 50 points in a day on the order book. You quickly tap “Buy at Market,” only to get filled at a price well above the latest price you were watching—that’s not a delay, it’s slippage.
The essence of a market order is immediate execution: the system consumes sell orders starting from the best ask and moving upward until your full quantity is filled. When the order book is thin and volatility is high, the next few price levels can be much more expensive, pushing up your average fill price. Here are three steps to follow: ① Check the order book depth; don’t look only at the latest price. ② When chasing a rally, favor limit orders and set the highest price you’re willing to pay. ③ If you must use a market order, split it into smaller amounts or set a maximum slippage limit in your trading settings.
Today’s comparison: contract $ONE is up about 57%, with roughly 300 million U in trading volume; $AKE ’s intraday high is more than double its low; $BTC is still moving sideways around 76,000. On days when a hot trend accelerates like this, chasing with market orders makes it especially easy to “overpay.”
A good-looking gain ≠ a good-looking fill price. Do you check the order book before placing an order, or do you usually go straight to a market order? #合约交易 #Beginner Tutorial
For informational purposes only; this is not investment advice.
The essence of a market order is immediate execution: the system consumes sell orders starting from the best ask and moving upward until your full quantity is filled. When the order book is thin and volatility is high, the next few price levels can be much more expensive, pushing up your average fill price. Here are three steps to follow: ① Check the order book depth; don’t look only at the latest price. ② When chasing a rally, favor limit orders and set the highest price you’re willing to pay. ③ If you must use a market order, split it into smaller amounts or set a maximum slippage limit in your trading settings.
Today’s comparison: contract $ONE is up about 57%, with roughly 300 million U in trading volume; $AKE ’s intraday high is more than double its low; $BTC is still moving sideways around 76,000. On days when a hot trend accelerates like this, chasing with market orders makes it especially easy to “overpay.”
A good-looking gain ≠ a good-looking fill price. Do you check the order book before placing an order, or do you usually go straight to a market order? #合约交易 #Beginner Tutorial
For informational purposes only; this is not investment advice.
709
·
--
#币安神算子 Come to Binance Square to see what everyone thinks about the market. Everyone has their own ideas, and exchanging thoughts can help us discover different perspectives. #BinanceOracle
#币安神算子 Come to Binance Square to see what everyone thinks about the market. Everyone has their own ideas, and exchanging thoughts can help us discover different perspectives. #BinanceOracle

1
·
--
Been trading all day but your points haven’t budged? First, check whether your balance has fallen into this trap.
Binance Alpha points = balance points + trading volume points, calculated on a rolling 15-day basis. Starting 2025-10-22: if your account’s total assets, valued in USD, are below $100, neither trading volume points nor task points will accrue until your balance rises above $100. Selling also earns no points—only buying counts.
Three steps to check: ① Confirm your total assets are ≥$100; ② Then place buy orders on Alpha; ③ Remember that points from older days drop off as the 15-day window rolls forward. Don’t waste your trades during inactive periods.
For informational purposes only; this is not investment advice.
Been trading all day but your points haven’t budged? First, check whether your balance has fallen into this trap.
Binance Alpha points = balance points + trading volume points, calculated on a rolling 15-day basis. Starting 2025-10-22: if your account’s total assets, valued in USD, are below $100, neither trading volume points nor task points will accrue until your balance rises above $100. Selling also earns no points—only buying counts.
Three steps to check: ① Confirm your total assets are ≥$100; ② Then place buy orders on Alpha; ③ Remember that points from older days drop off as the 15-day window rolls forward. Don’t waste your trades during inactive periods.
For informational purposes only; this is not investment advice.
Binance Alpha points = balance points + trading volume points, calculated on a rolling 15-day basis. Starting 2025-10-22: if your account’s total assets, valued in USD, are below $100, neither trading volume points nor task points will accrue until your balance rises above $100. Selling also earns no points—only buying counts.
Three steps to check: ① Confirm your total assets are ≥$100; ② Then place buy orders on Alpha; ③ Remember that points from older days drop off as the 15-day window rolls forward. Don’t waste your trades during inactive periods.
For informational purposes only; this is not investment advice.
106
·
--
Quick check-in: Proof of Agent keeps participating. On-chain identity will become standard sooner or later. Glad I got my handle early.
Agent #3136
#ProofofAgent
Quick check-in: Proof of Agent keeps participating. On-chain identity will become standard sooner or later. Glad I got my handle early.
Agent #3136
#ProofofAgent
Agent #3136
#ProofofAgent
·
--
#币安神算子 The market brings new opportunities every day. The key is to make your own judgments, avoid blindly following the crowd, and analyze every market move rationally. #BinanceOracle
#币安神算子 The market brings new opportunities every day. The key is to make your own judgments, avoid blindly following the crowd, and analyze every market move rationally. #BinanceOracle

2
·
--
The moment you tap “Confirm,” your wallet may already be wide open.
When people buy crypto on-chain for the first time, they often see a pop-up that says Approve and assume it’s just like a transfer—that once they tap, they’re done. But what they’re actually approving is “allowing a contract to withdraw a certain amount of that token from your wallet at any time.”
The biggest pitfall: the page often defaults to “Unlimited” approval. If the contract gets hacked or you land on a fake site, someone could drain all of that token from your wallet without asking you to confirm again.
In plain English: ① Check that the Spender in the pop-up is the legitimate contract you just connected to; ② Set the amount to exactly what you need for this transaction—for example, if you’re spending 100 USDT, approve 100. Don’t choose Unlimited; ③ After the transaction, revoke the approval once you’re done, using “Approved tokens” in your wallet or a block explorer.
For informational purposes only; this is not investment advice.
The moment you tap “Confirm,” your wallet may already be wide open.
When people buy crypto on-chain for the first time, they often see a pop-up that says Approve and assume it’s just like a transfer—that once they tap, they’re done. But what they’re actually approving is “allowing a contract to withdraw a certain amount of that token from your wallet at any time.”
The biggest pitfall: the page often defaults to “Unlimited” approval. If the contract gets hacked or you land on a fake site, someone could drain all of that token from your wallet without asking you to confirm again.
In plain English: ① Check that the Spender in the pop-up is the legitimate contract you just connected to; ② Set the amount to exactly what you need for this transaction—for example, if you’re spending 100 USDT, approve 100. Don’t choose Unlimited; ③ After the transaction, revoke the approval once you’re done, using “Approved tokens” in your wallet or a block explorer.
For informational purposes only; this is not investment advice.
When people buy crypto on-chain for the first time, they often see a pop-up that says Approve and assume it’s just like a transfer—that once they tap, they’re done. But what they’re actually approving is “allowing a contract to withdraw a certain amount of that token from your wallet at any time.”
The biggest pitfall: the page often defaults to “Unlimited” approval. If the contract gets hacked or you land on a fake site, someone could drain all of that token from your wallet without asking you to confirm again.
In plain English: ① Check that the Spender in the pop-up is the legitimate contract you just connected to; ② Set the amount to exactly what you need for this transaction—for example, if you’re spending 100 USDT, approve 100. Don’t choose Unlimited; ③ After the transaction, revoke the approval once you’re done, using “Approved tokens” in your wallet or a block explorer.
For informational purposes only; this is not investment advice.
67
Log in to explore more content
Join global crypto users on Binance Square
⚡️ Get latest and useful information about crypto.
💬 Trusted by the world’s largest crypto exchange.
👍 Discover real insights from verified creators.
Email / Phone number