
霧切響子
11 Posts

霧切響子
Report
Block User
4 Following
48 Followers
20 Liked
Posts
All
Quotes
·
--
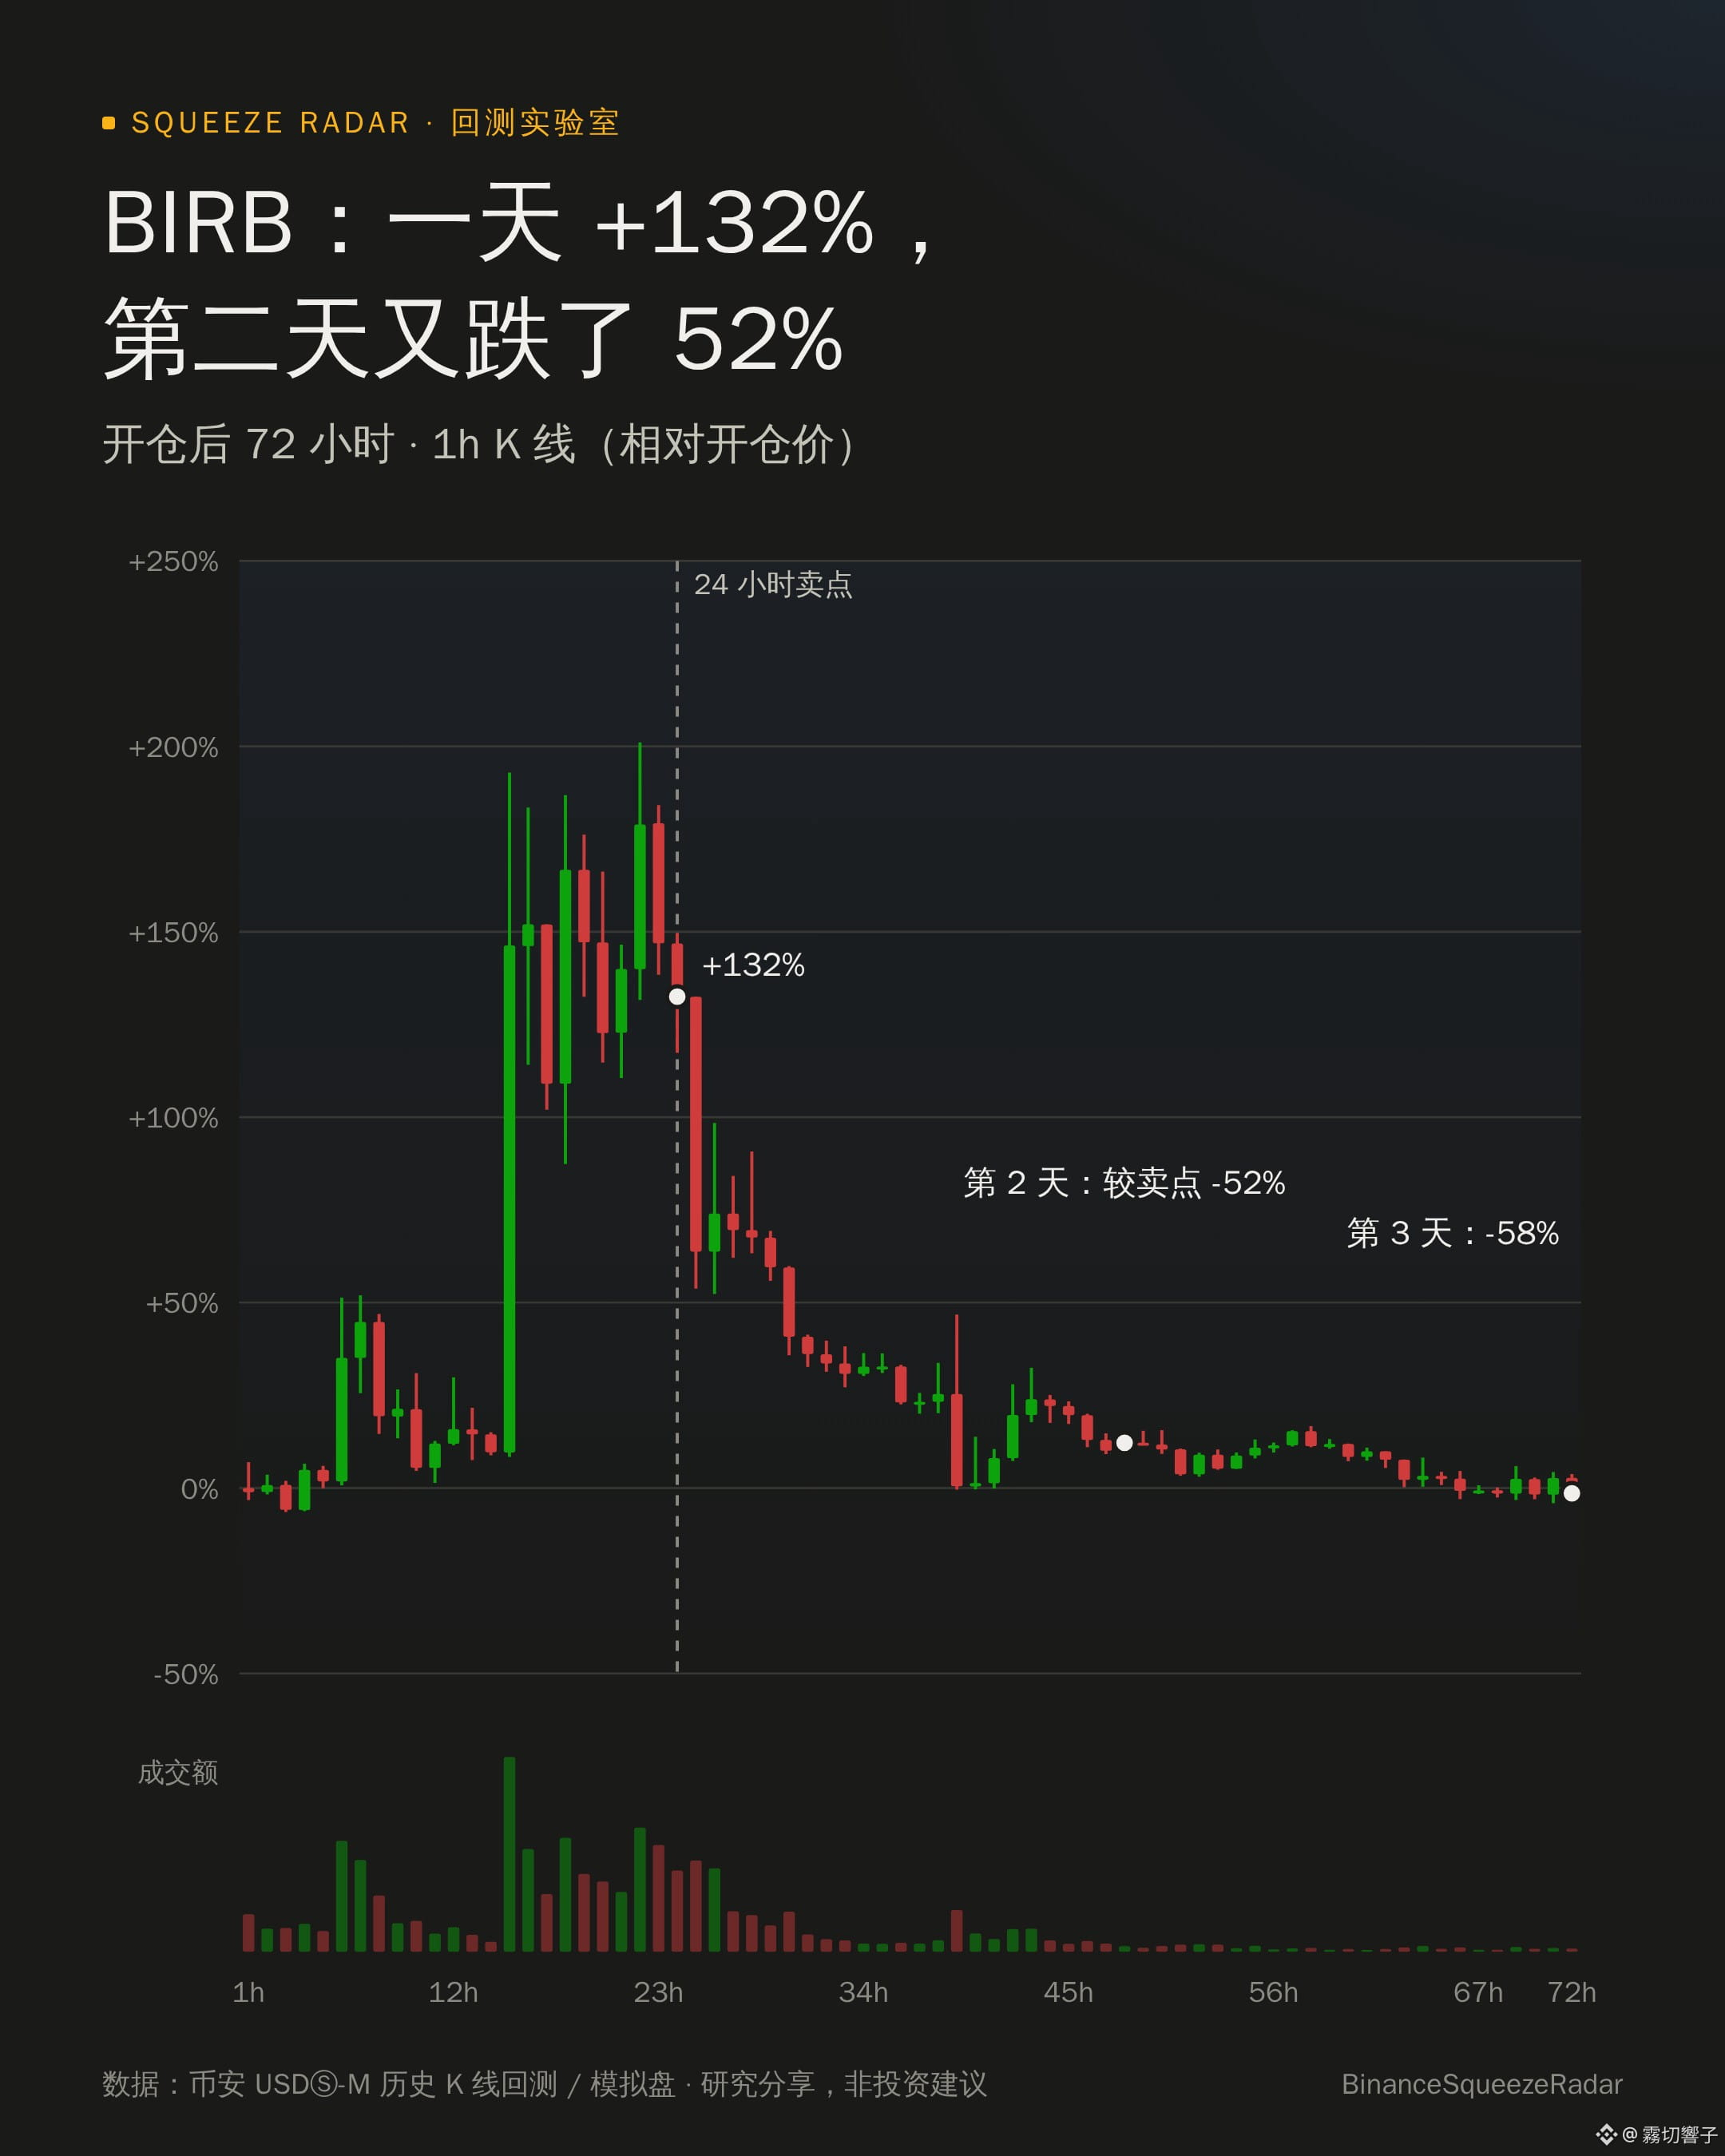
$BIRB rose 132% in one day. Those who were still holding the next day saw it fall 52% from its 24-hour high.
I backtested 10 months of wild crypto coins. Once they passed the 24-hour mark, they never returned to that price.
What about you—would you have held on the next day?
📌 Backtested data, not investment advice
$BIRB rose 132% in one day. Those who were still holding the next day saw it fall 52% from its 24-hour high.
I backtested 10 months of wild crypto coins. Once they passed the 24-hour mark, they never returned to that price.
What about you—would you have held on the next day?
📌 Backtested data, not investment advice
I backtested 10 months of wild crypto coins. Once they passed the 24-hour mark, they never returned to that price.
What about you—would you have held on the next day?
📌 Backtested data, not investment advice
338
·
--
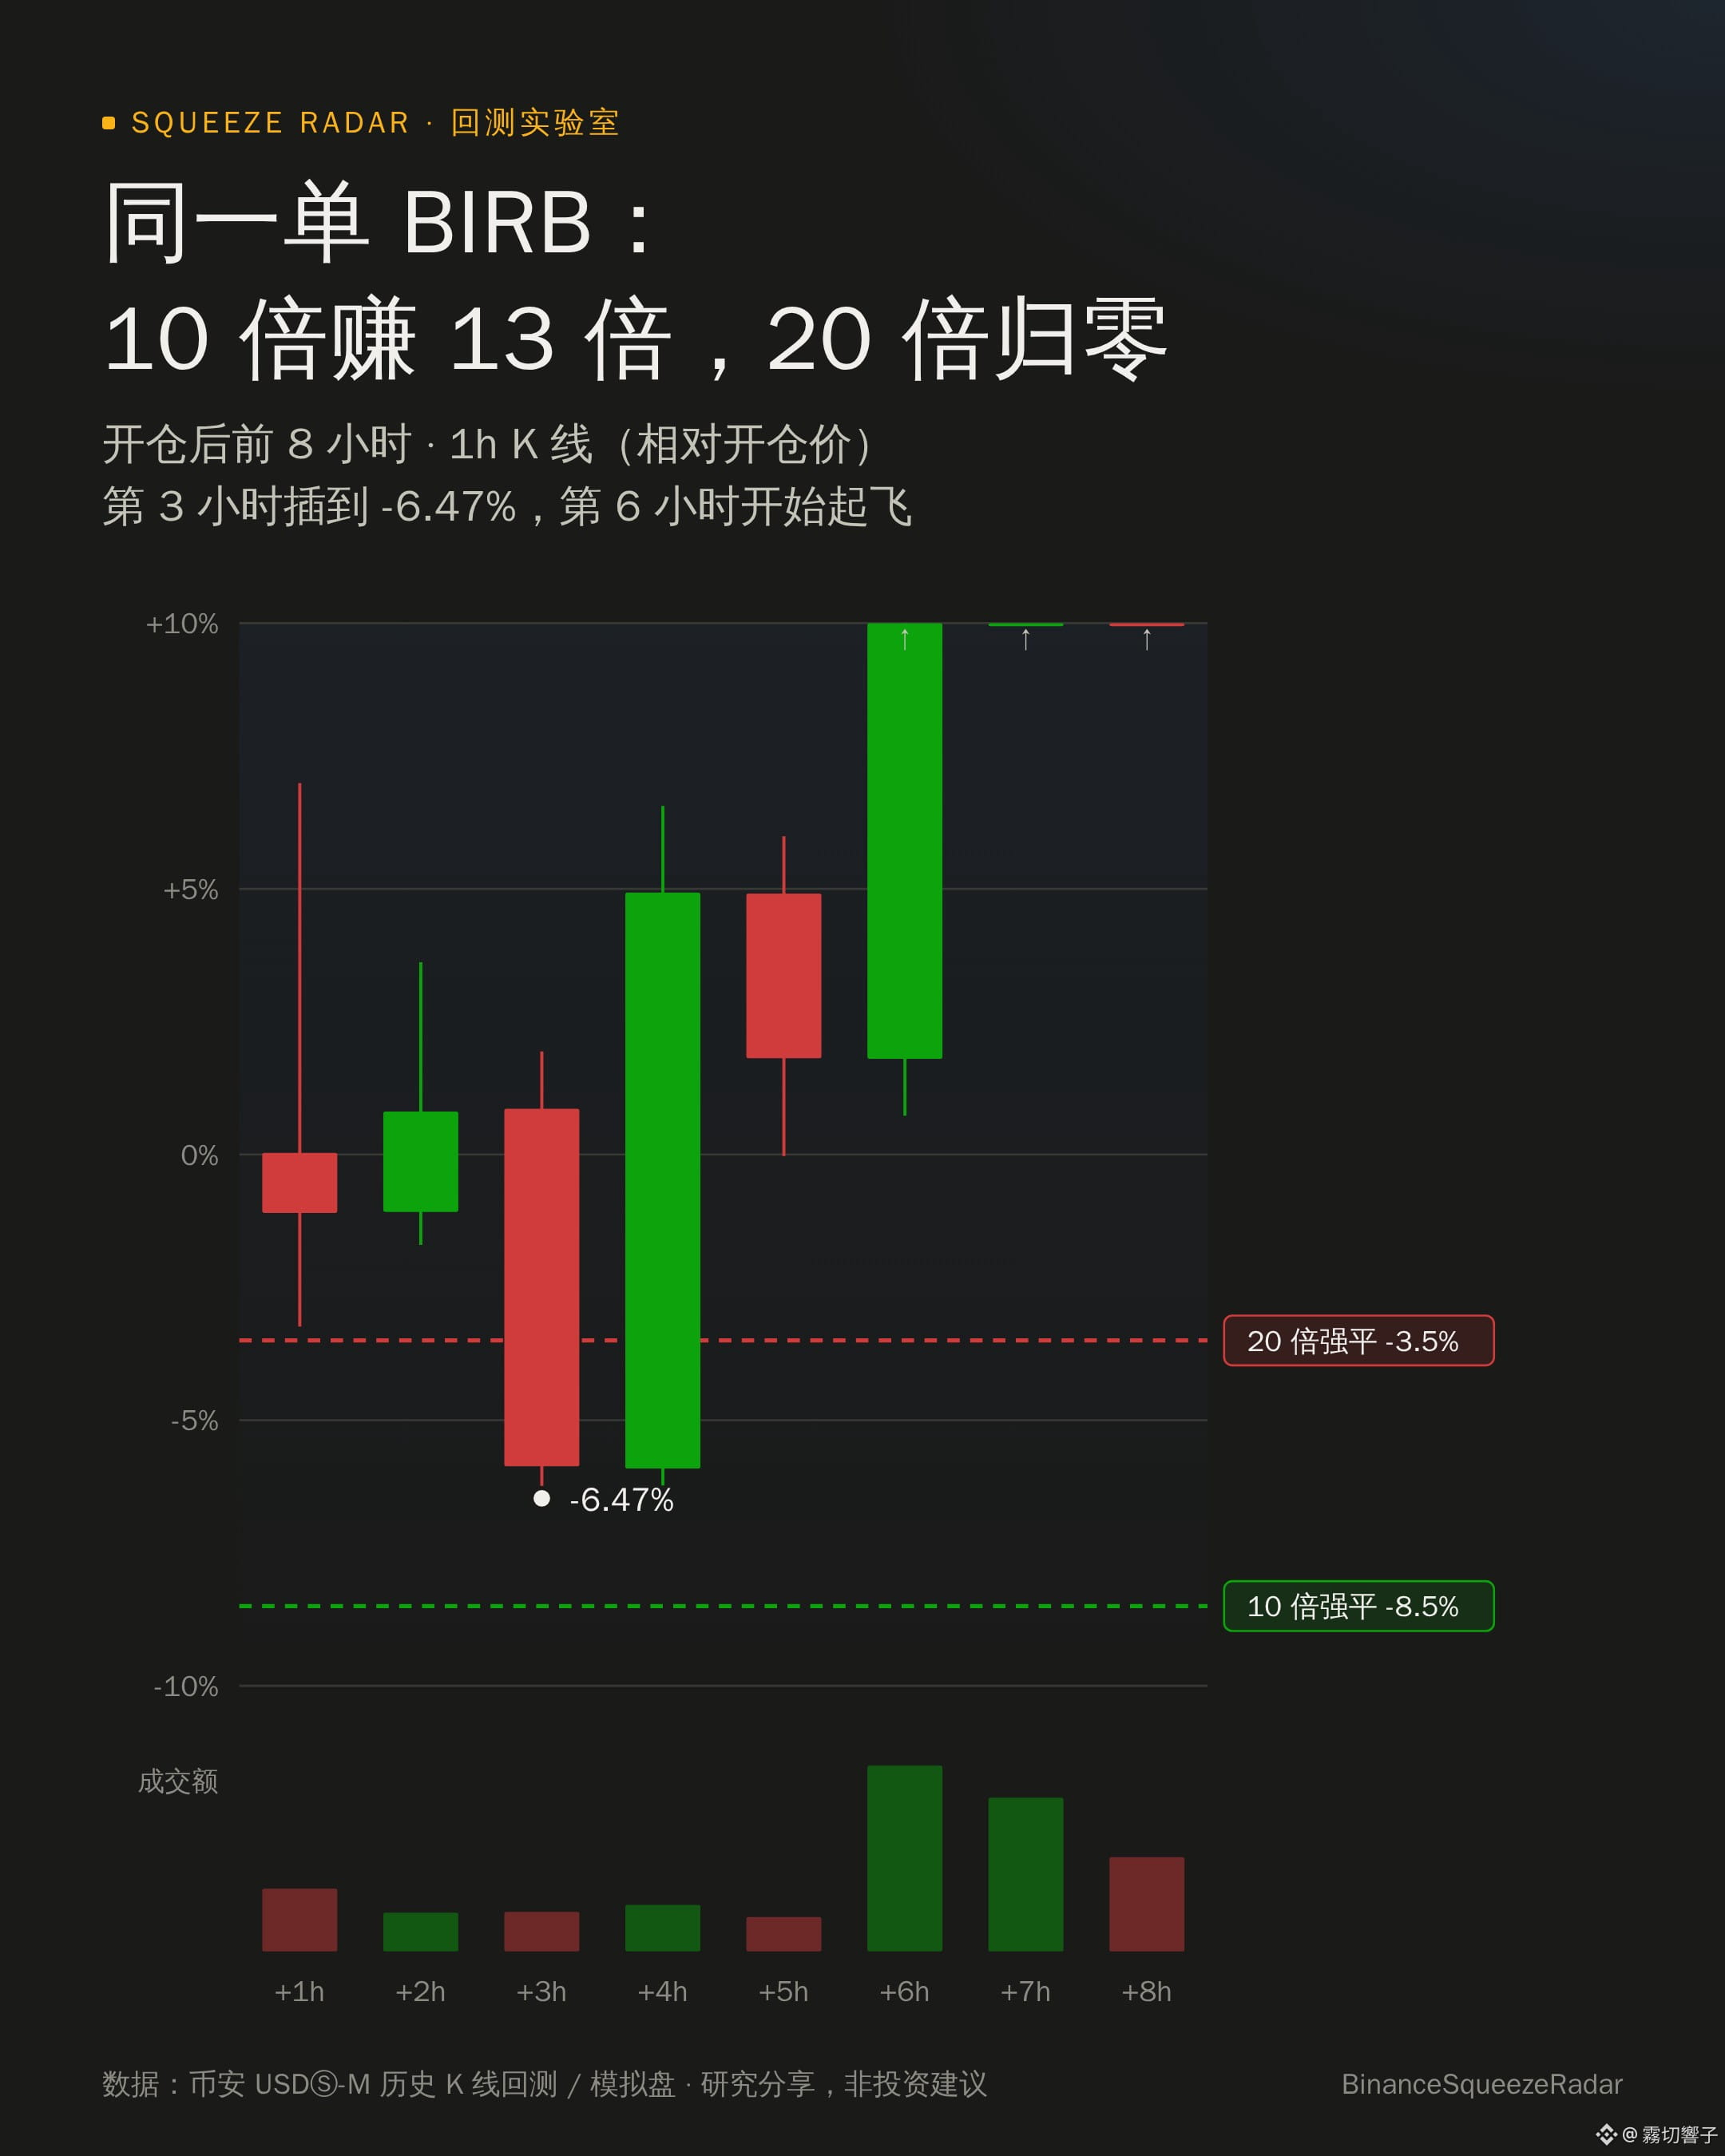
Same trade, $BIRB : At 10x leverage, it made 13 times the margin in 24 hours; at 20x, it was liquidated before it even took off.
In the third hour, it first dipped to -6.47%: the liquidation threshold was -3.5% at 20x and -8.5% at 10x.
Same direction—the leverage made all the difference between life and death. In a 10-month backtest, an account using 12x leverage was wiped out in just two months.
What leverage do you usually use?
📌 Backtest data, not investment advice
Same trade, $BIRB : At 10x leverage, it made 13 times the margin in 24 hours; at 20x, it was liquidated before it even took off.
In the third hour, it first dipped to -6.47%: the liquidation threshold was -3.5% at 20x and -8.5% at 10x.
Same direction—the leverage made all the difference between life and death. In a 10-month backtest, an account using 12x leverage was wiped out in just two months.
What leverage do you usually use?
📌 Backtest data, not investment advice
In the third hour, it first dipped to -6.47%: the liquidation threshold was -3.5% at 20x and -8.5% at 10x.
Same direction—the leverage made all the difference between life and death. In a 10-month backtest, an account using 12x leverage was wiped out in just two months.
What leverage do you usually use?
📌 Backtest data, not investment advice
1
292
·
--
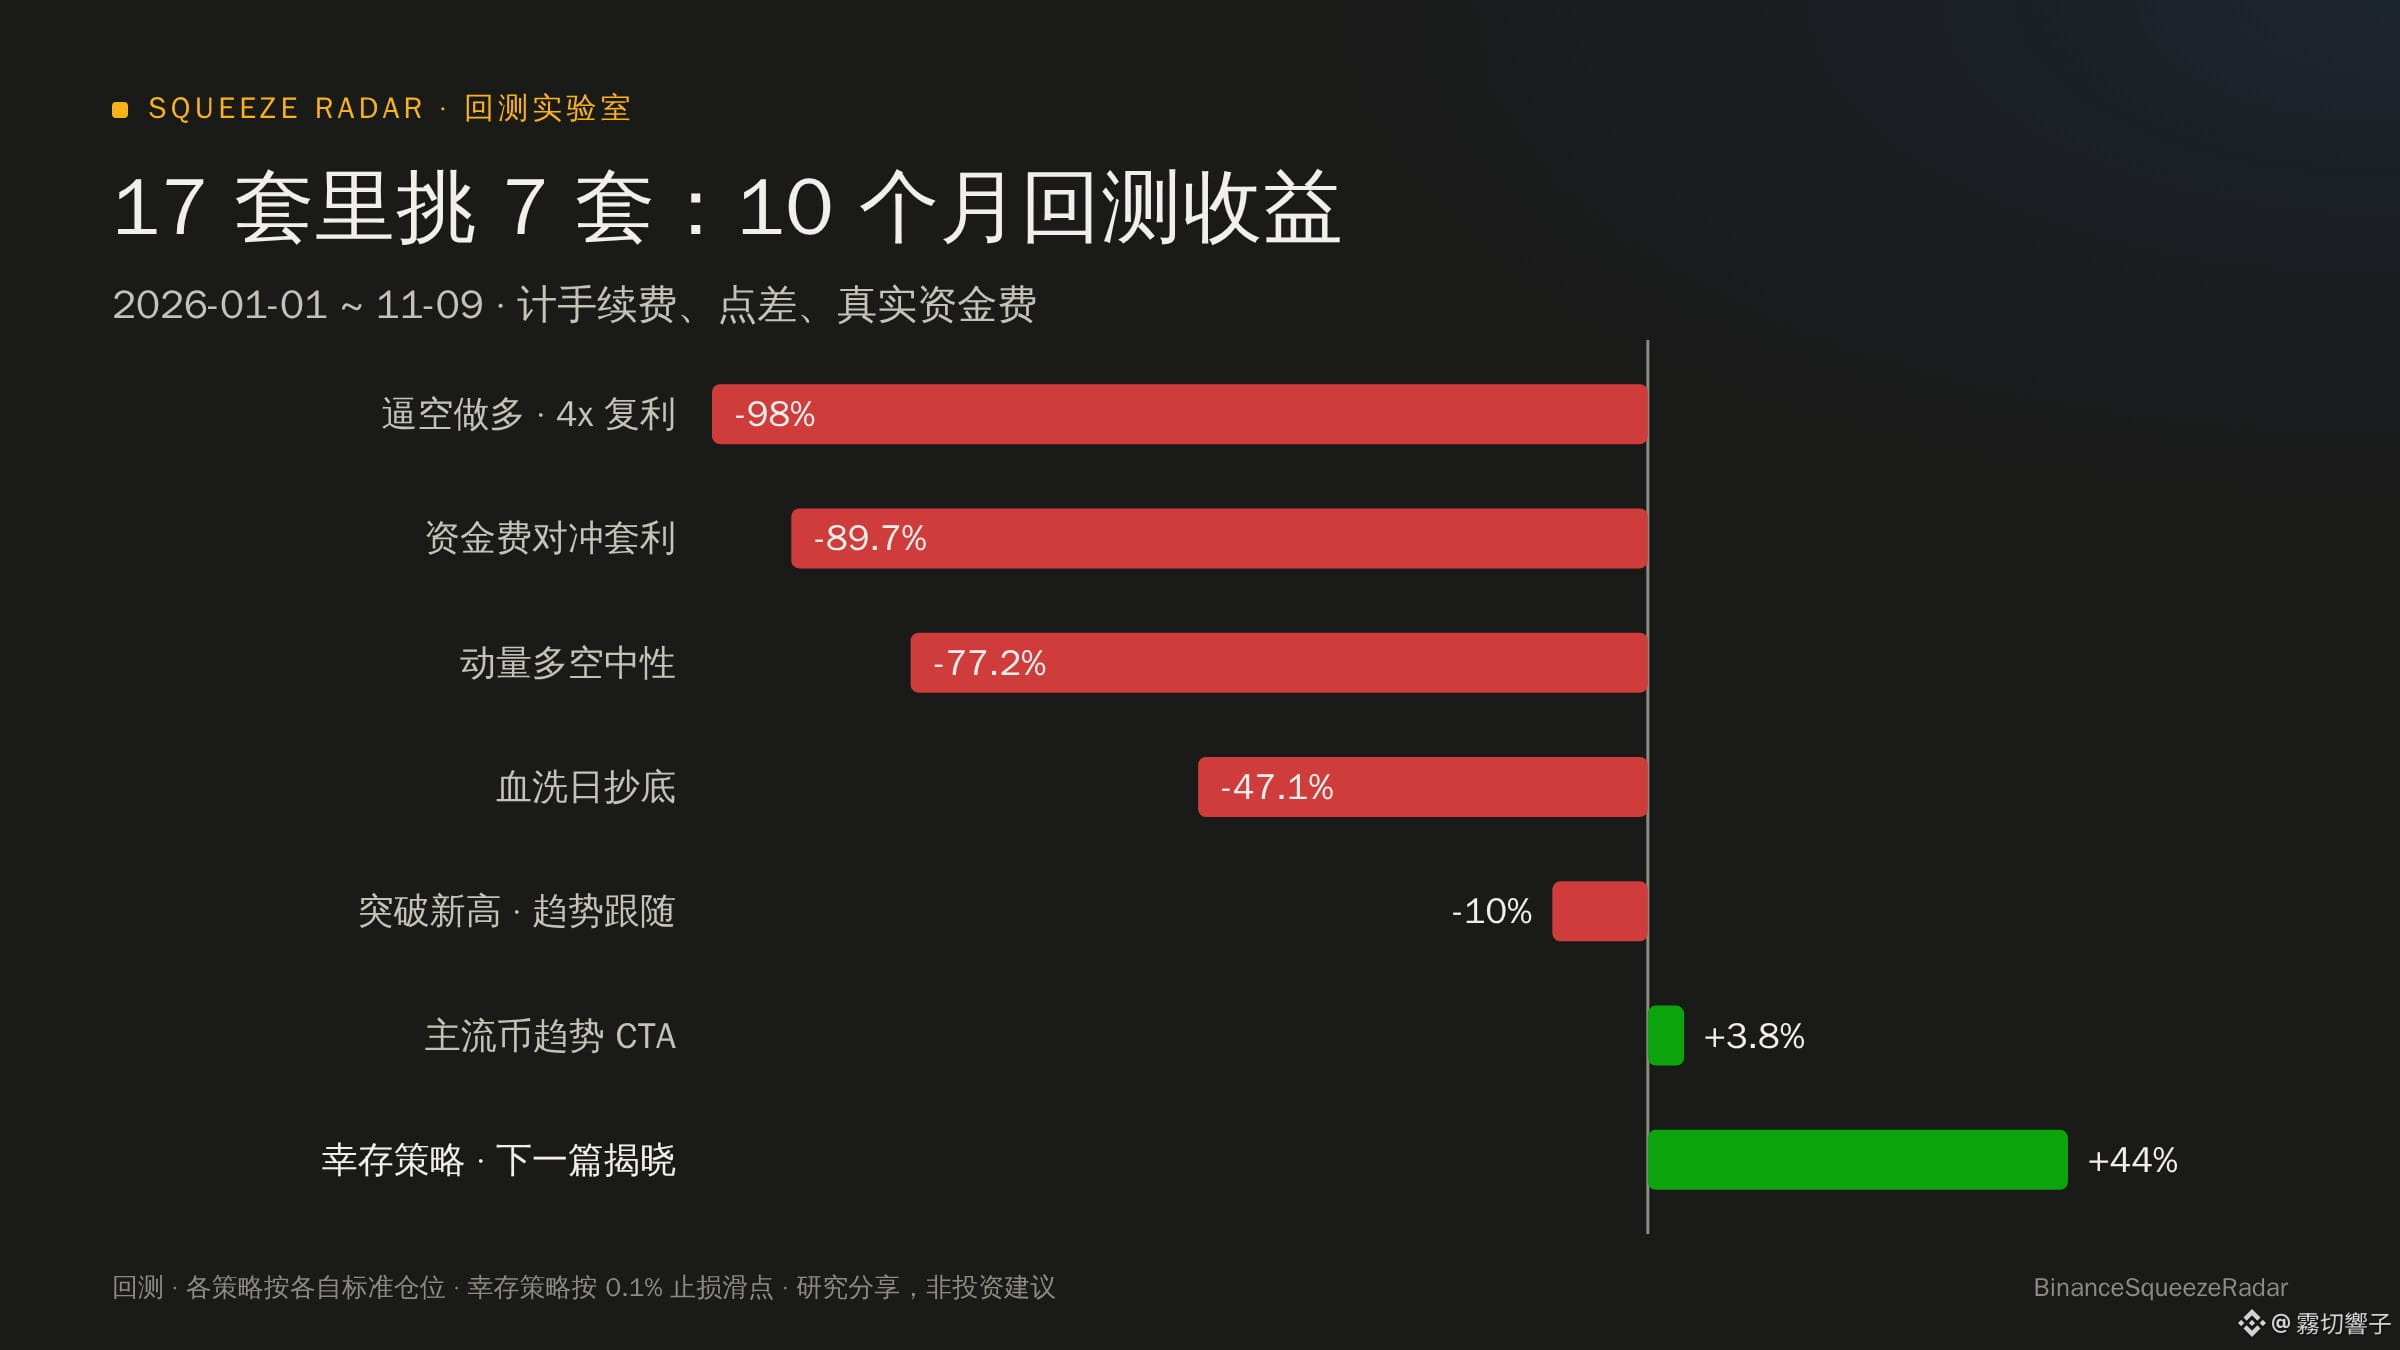
I pulled 883 contracts from this year and ran 17 strategies. Almost all of them were wiped out. The one that survived in the end was a bit counterintuitive.
I've been writing scripts to test strategies these past few days. I originally wanted to find a reliable way to compound positions, but ended up downloading all 883 of Binance's USDT perpetual contracts from January to November this year (including those that had already been delisted and gone to zero) and running them through the tests. Those “surefire” strategies people often talk about in the community basically all failed when tested against a full 10 months of data.
Here are a few results that really challenged my assumptions:
1. Why do backtests posted online double your money, while my own runs end in liquidation?
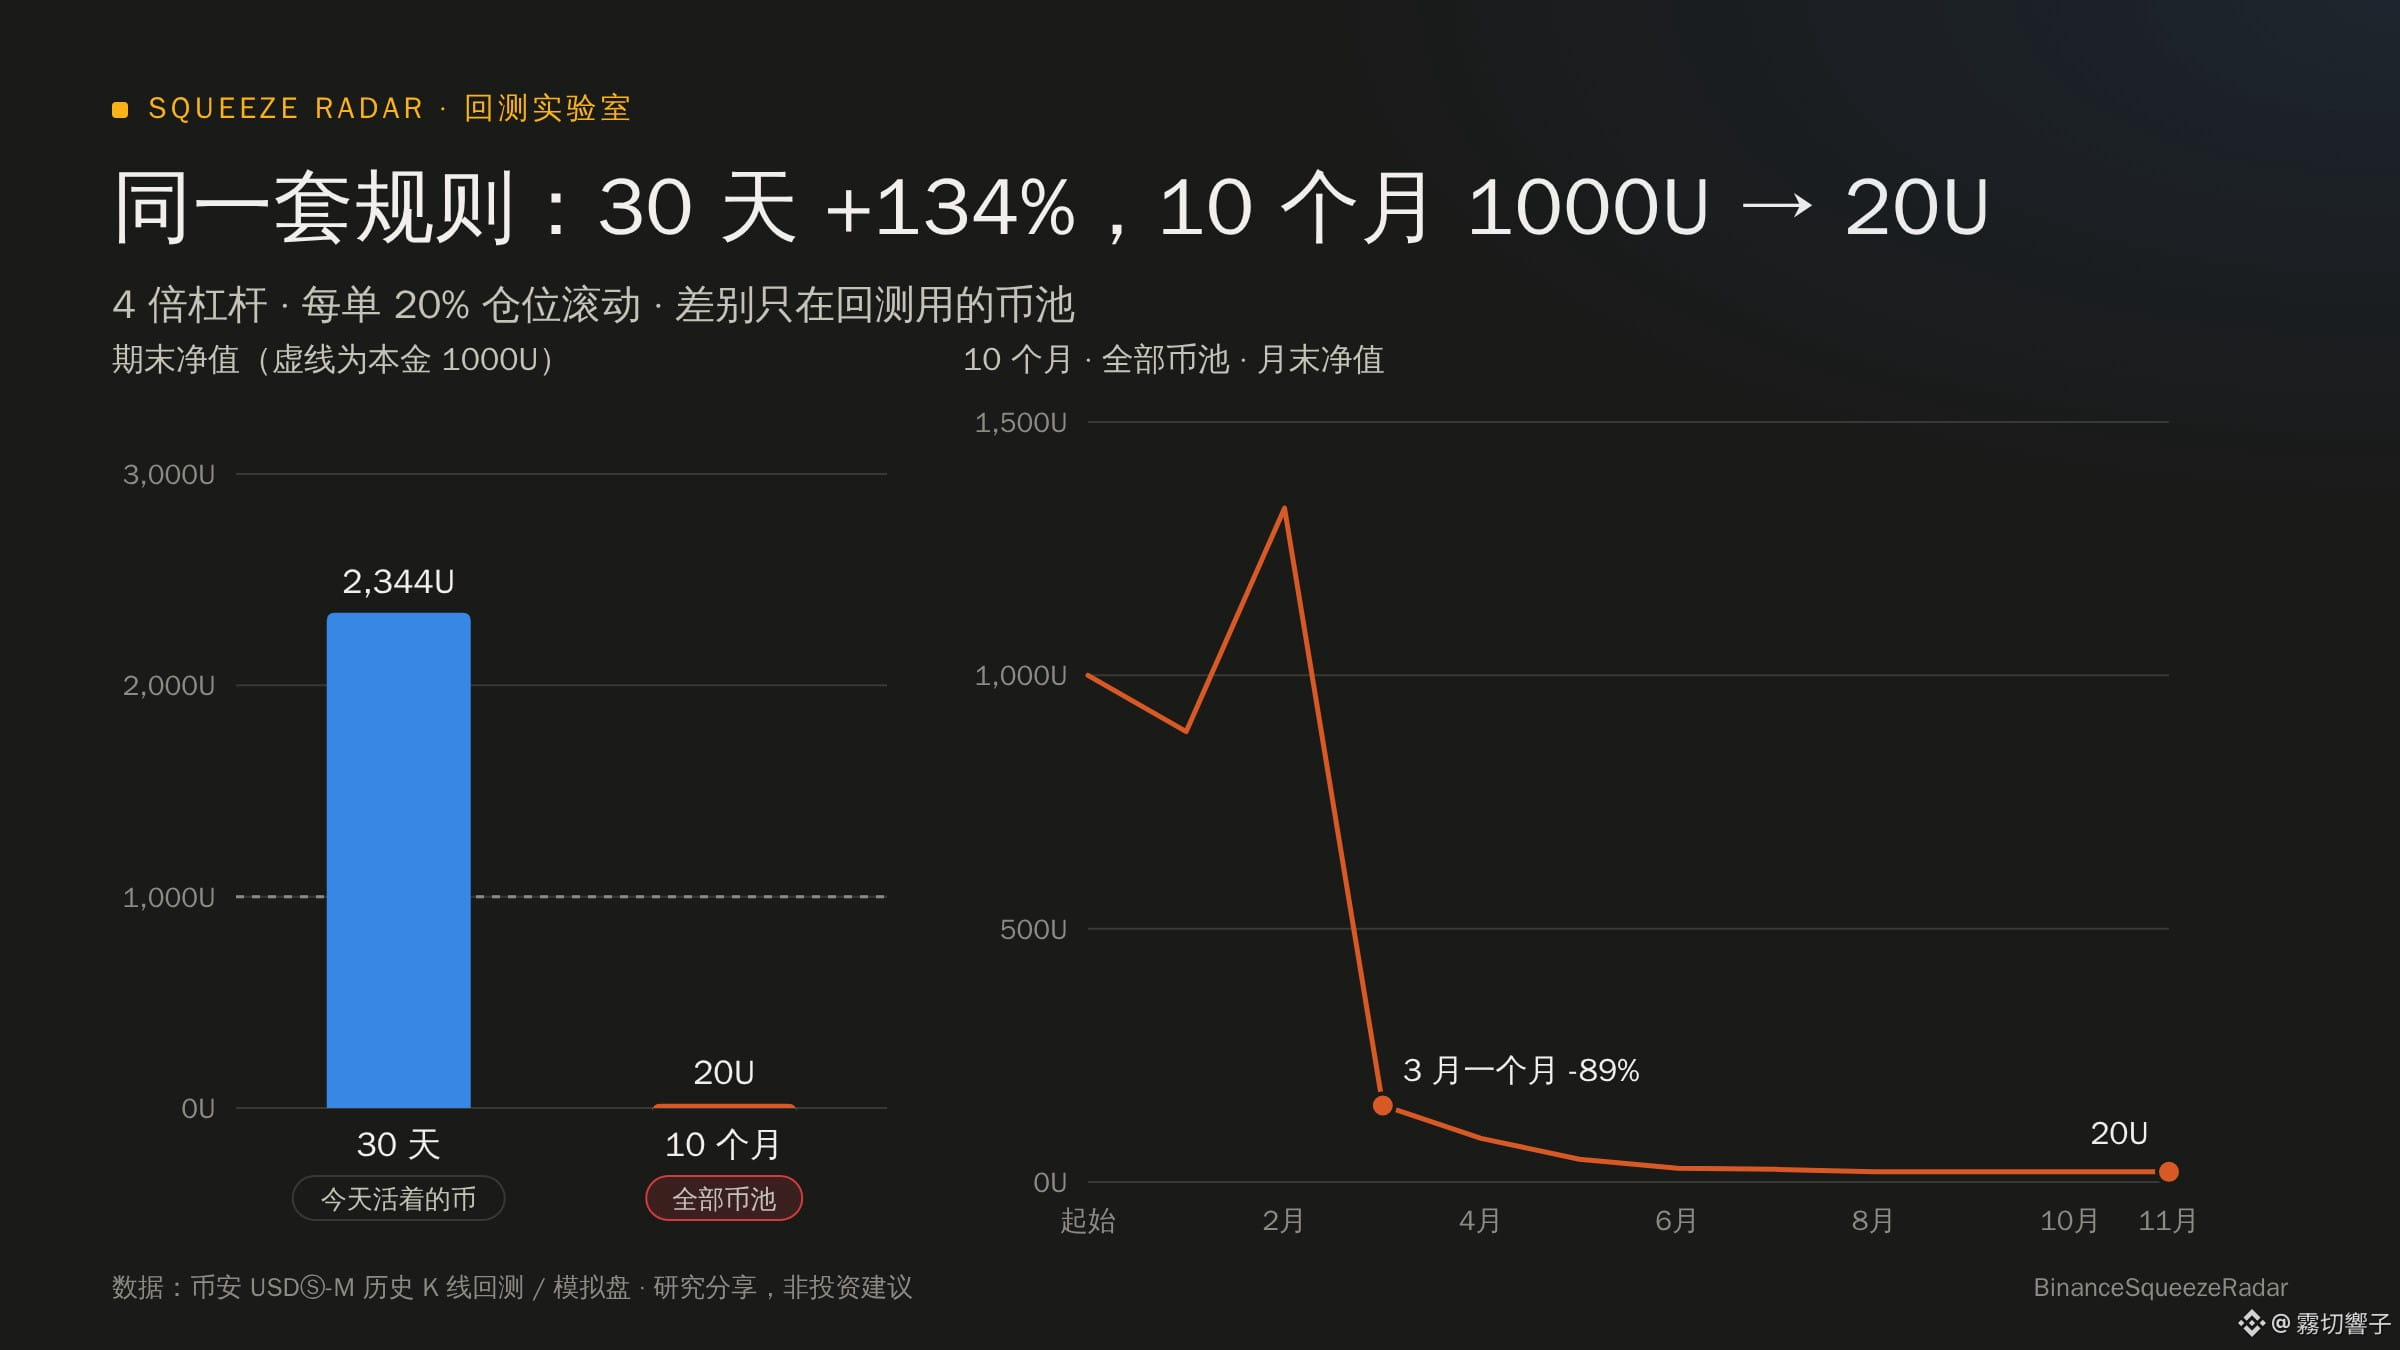
Using the same momentum-chasing rule (4x leverage, rolling 20% of the account into each trade), I first tested only the most recent 30 days and only coins that are still active today. The return was +134%—looked like a money-printing machine.
Then, to be safe, I extended the test to 10 months and included all the coins that hadn't yet been delisted at the time. After rerunning it, the initial 1,000 USDT was down to just 20 USDT.
A lot of people make money in backtests simply because they use today's perspective to choose the coin pool, filtering out the coins that died from the start.
2. Are “extremely negative funding rates + a surge in open interest” really signs of an impending short squeeze?
When watching the market, people often assume that if shorts are too crowded, prices are bound to rise and squeeze them out.
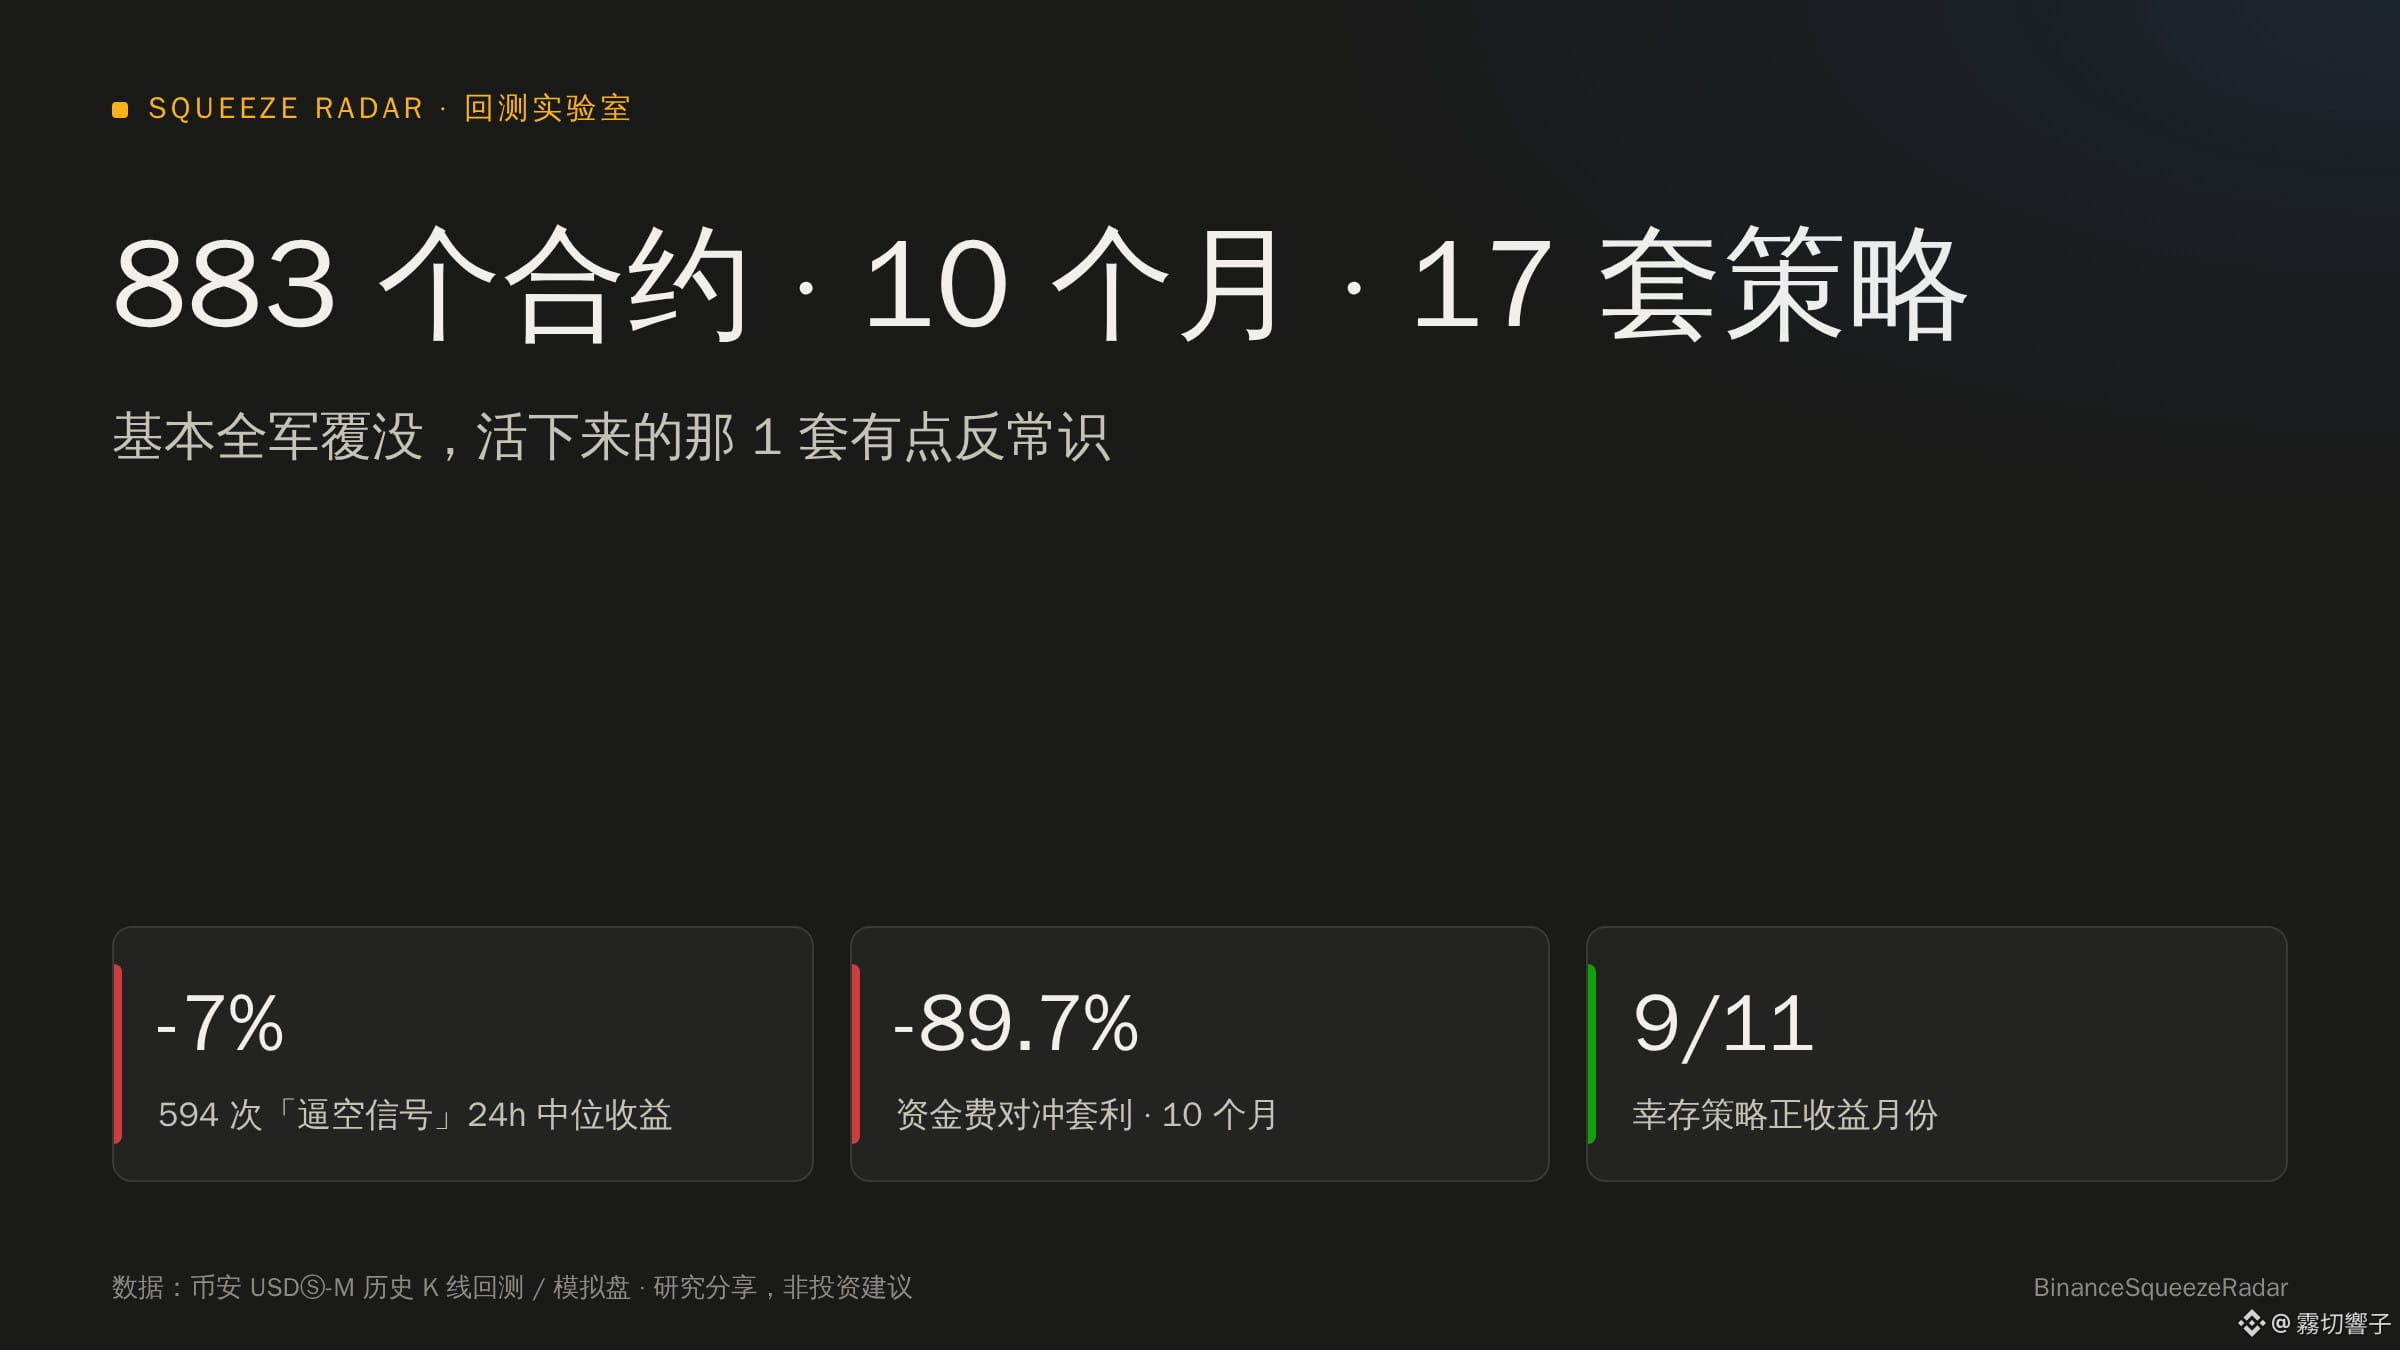
I found 594 instances of this standard signal in the 10-month dataset. But if you went long on them, the win rate was only around 26%. Also, in each of the 11 months, the median return after holding for 24 hours was negative (around -7% overall). In seven out of ten cases, prices pulled back after spiking.
3. The supposedly effortless funding-rate arbitrage hedge lost 89.7% over 10 months.
I tried going long on the coins with the most negative funding rates while shorting those with the highest positive rates, thinking the two sides would hedge each other and deliver steady returns.
After running the test, I found that altcoins with extremely negative funding rates are often coins that have just been pumped. The next day's price drop leaves a hole that funding payments simply can't fill.
4. I caught a +507% move in $RAVE , but the account still ended up losing money.
I tested a trend strategy based on “a breakout to a 30-day high on rising volume + a trailing stop.”
It did catch big movers like $RAVE (+507%) and $LSK (+317%), but nearly 80% of the more than 1,600 breakouts across the market ended in losses. With every stop-out costing 6%, the account was already ground down before a big mover ever came along.
5. Is it worth holding on to coins that have skyrocketed?
Take $BIRB , which rose 132% in a single day recently. If you strictly closed the position after 24 hours, the price never returned to that level afterward.
If you decided to hold on for another day, it fell 51.7% from its price at the 24-hour mark; after two more days, it was down 57.6%. The buying pressure fueling the short squeeze had basically burned out within a day.
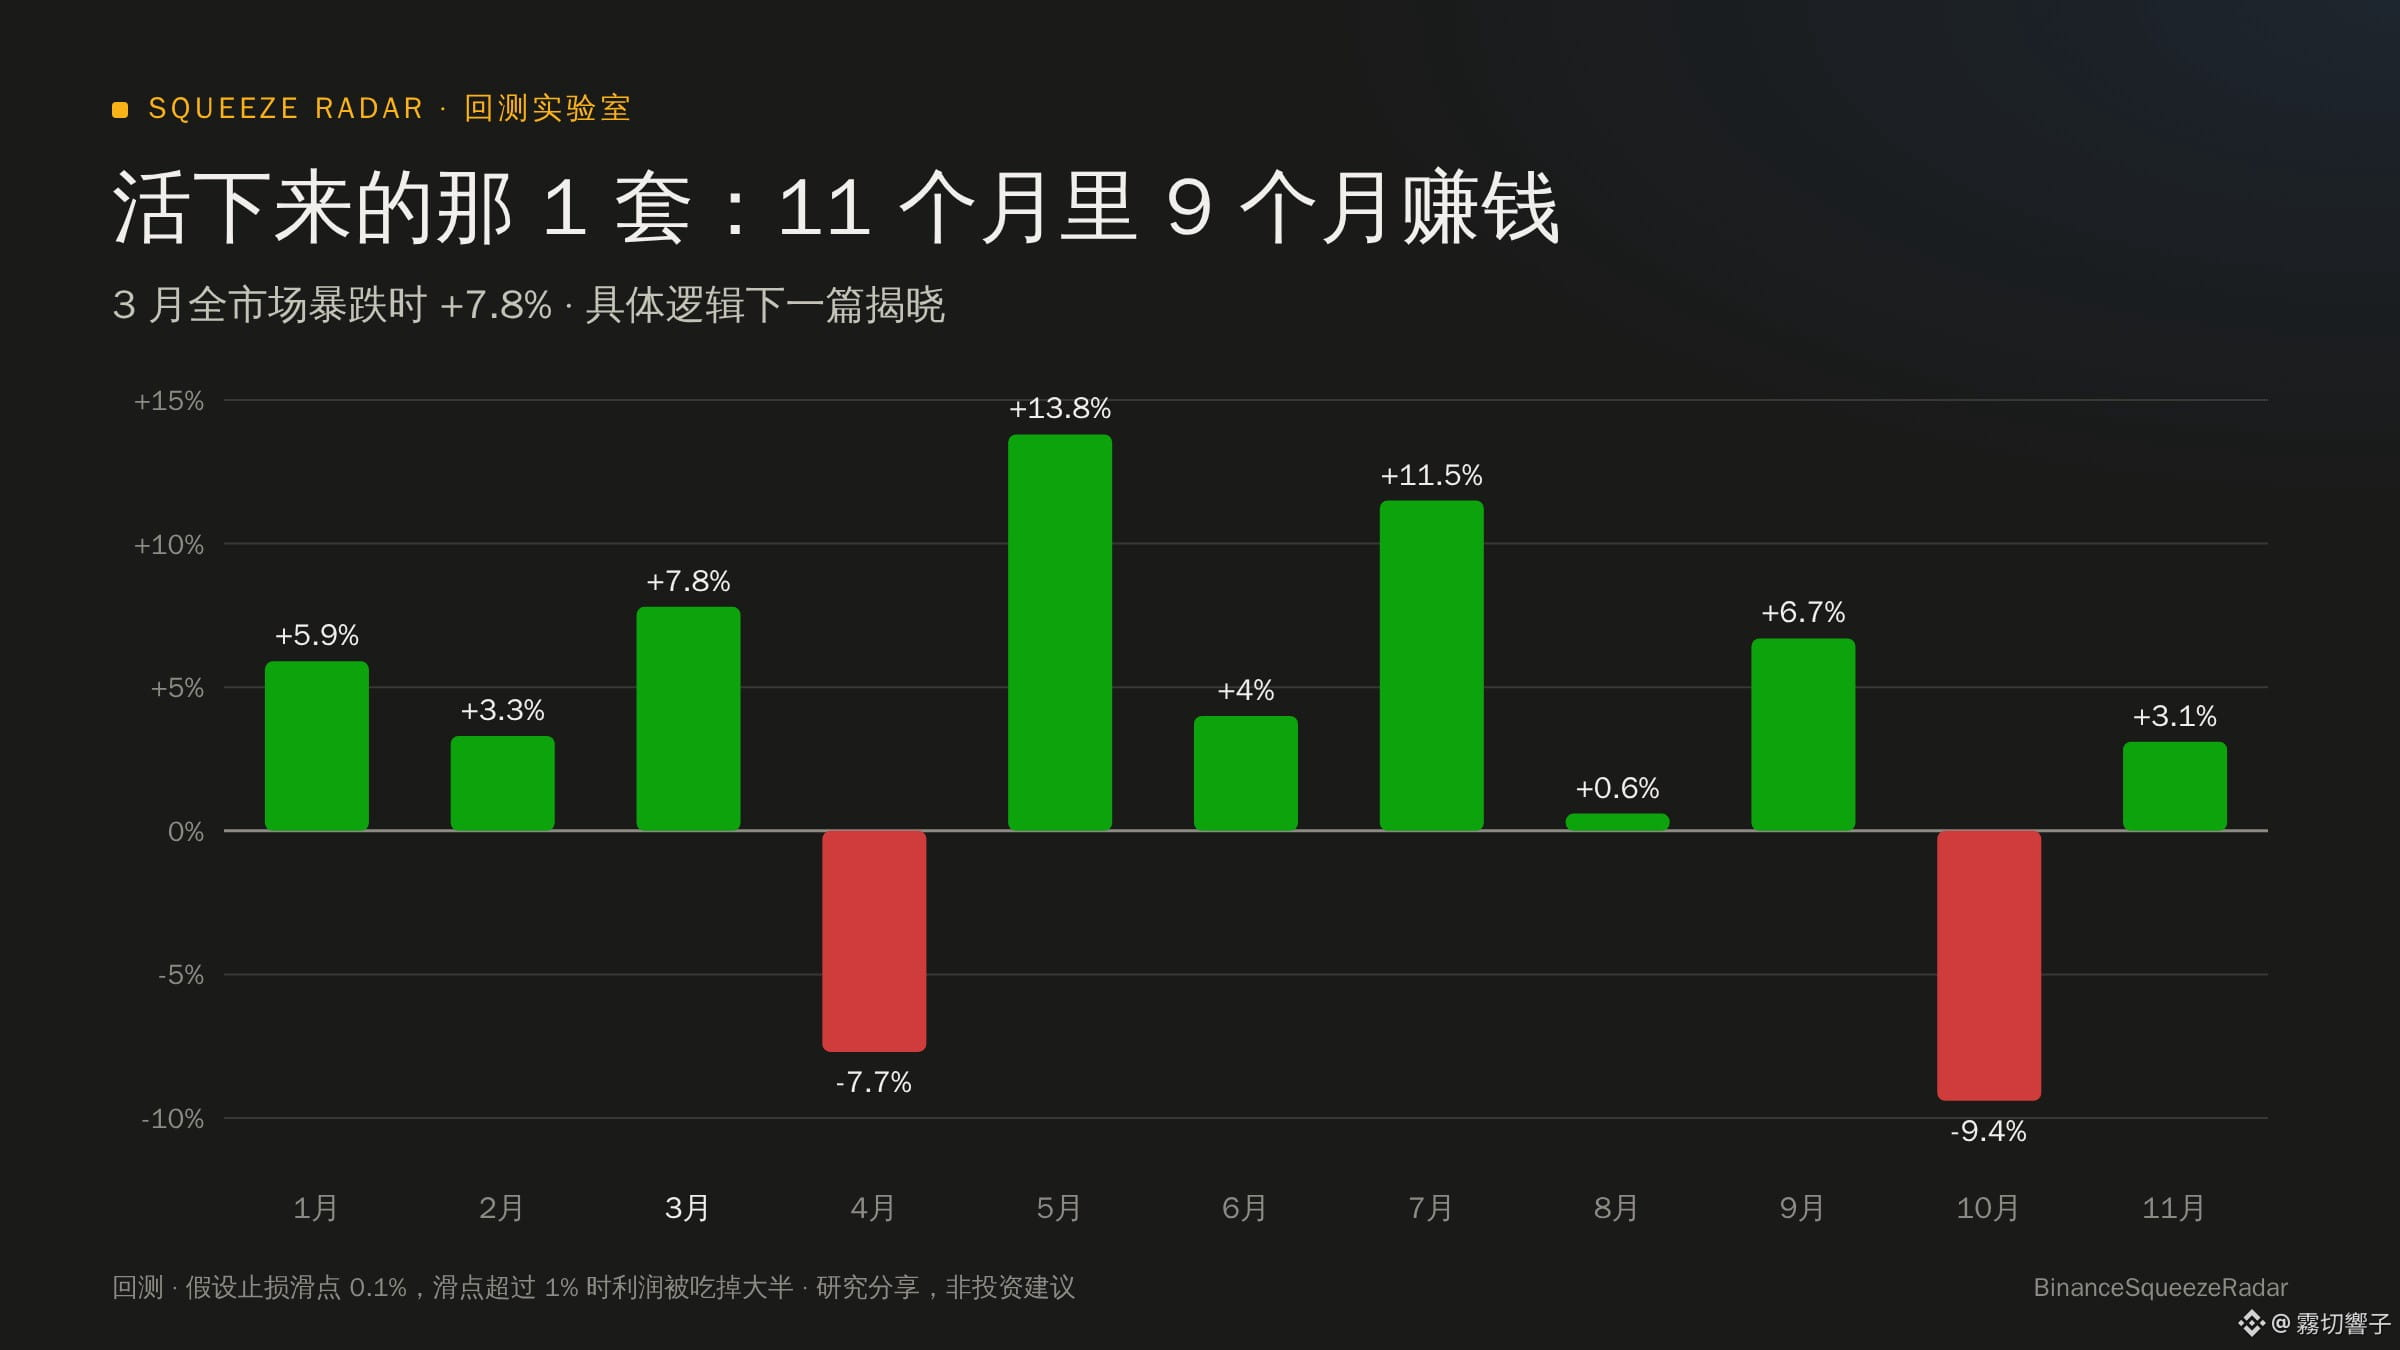
After all that testing, only 1 of the 17 strategies held up in both the first and second halves of the year:
It had positive returns in 9 of the 11 months, and even made 7.8% in March, when the whole market plunged.
This strategy completely gives up on going long and doesn't use high leverage. Instead, it focuses on weak coins further down the ranks that nobody is paying attention to, which suddenly surge abnormally, and trades against them.
But it currently has one critical flaw: it depends heavily on order-book depth when stop-loss orders are executed. If a sudden wick causes stop-loss slippage to exceed 1%, most of the profits get eaten up.
I've now set this script up on a server in Tokyo. It checks the live bid and ask order books once a minute so I can see how much slippage there really is. I'll post the actual daily trading results here as they come in, exactly as they are, whether gains or losses.
In the next post, I'll go into detail about how this contrarian strategy identifies when market makers are running out of steam. Follow if you're interested.
📌 The above is based on historical backtests and simulated trading research, and does not constitute investment advice.
$BIRB $RAVE $LSK
#量化 #合约交易 #Altcoins
I pulled 883 contracts from this year and ran 17 strategies. Almost all of them were wiped out. The one that survived in the end was a bit counterintuitive.
I've been writing scripts to test strategies these past few days. I originally wanted to find a reliable way to compound positions, but ended up downloading all 883 of Binance's USDT perpetual contracts from January to November this year (including those that had already been delisted and gone to zero) and running them through the tests. Those “surefire” strategies people often talk about in the community basically all failed when tested against a full 10 months of data.
Here are a few results that really challenged my assumptions:
1. Why do backtests posted online double your money, while my own runs end in liquidation?
Using the same momentum-chasing rule (4x leverage, rolling 20% of the account into each trade), I first tested only the most recent 30 days and only coins that are still active today. The return was +134%—looked like a money-printing machine.
Then, to be safe, I extended the test to 10 months and included all the coins that hadn't yet been delisted at the time. After rerunning it, the initial 1,000 USDT was down to just 20 USDT.
A lot of people make money in backtests simply because they use today's perspective to choose the coin pool, filtering out the coins that died from the start.
2. Are “extremely negative funding rates + a surge in open interest” really signs of an impending short squeeze?
When watching the market, people often assume that if shorts are too crowded, prices are bound to rise and squeeze them out.
I found 594 instances of this standard signal in the 10-month dataset. But if you went long on them, the win rate was only around 26%. Also, in each of the 11 months, the median return after holding for 24 hours was negative (around -7% overall). In seven out of ten cases, prices pulled back after spiking.
3. The supposedly effortless funding-rate arbitrage hedge lost 89.7% over 10 months.
I tried going long on the coins with the most negative funding rates while shorting those with the highest positive rates, thinking the two sides would hedge each other and deliver steady returns.
After running the test, I found that altcoins with extremely negative funding rates are often coins that have just been pumped. The next day's price drop leaves a hole that funding payments simply can't fill.
4. I caught a +507% move in $RAVE , but the account still ended up losing money.
I tested a trend strategy based on “a breakout to a 30-day high on rising volume + a trailing stop.”
It did catch big movers like $RAVE (+507%) and $LSK (+317%), but nearly 80% of the more than 1,600 breakouts across the market ended in losses. With every stop-out costing 6%, the account was already ground down before a big mover ever came along.
5. Is it worth holding on to coins that have skyrocketed?
Take $BIRB , which rose 132% in a single day recently. If you strictly closed the position after 24 hours, the price never returned to that level afterward.
If you decided to hold on for another day, it fell 51.7% from its price at the 24-hour mark; after two more days, it was down 57.6%. The buying pressure fueling the short squeeze had basically burned out within a day.
After all that testing, only 1 of the 17 strategies held up in both the first and second halves of the year:
It had positive returns in 9 of the 11 months, and even made 7.8% in March, when the whole market plunged.
This strategy completely gives up on going long and doesn't use high leverage. Instead, it focuses on weak coins further down the ranks that nobody is paying attention to, which suddenly surge abnormally, and trades against them.
But it currently has one critical flaw: it depends heavily on order-book depth when stop-loss orders are executed. If a sudden wick causes stop-loss slippage to exceed 1%, most of the profits get eaten up.
I've now set this script up on a server in Tokyo. It checks the live bid and ask order books once a minute so I can see how much slippage there really is. I'll post the actual daily trading results here as they come in, exactly as they are, whether gains or losses.
In the next post, I'll go into detail about how this contrarian strategy identifies when market makers are running out of steam. Follow if you're interested.
📌 The above is based on historical backtests and simulated trading research, and does not constitute investment advice.
$BIRB $RAVE $LSK
#量化 #合约交易 #Altcoins
I've been writing scripts to test strategies these past few days. I originally wanted to find a reliable way to compound positions, but ended up downloading all 883 of Binance's USDT perpetual contracts from January to November this year (including those that had already been delisted and gone to zero) and running them through the tests. Those “surefire” strategies people often talk about in the community basically all failed when tested against a full 10 months of data.
Here are a few results that really challenged my assumptions:
1. Why do backtests posted online double your money, while my own runs end in liquidation?
Using the same momentum-chasing rule (4x leverage, rolling 20% of the account into each trade), I first tested only the most recent 30 days and only coins that are still active today. The return was +134%—looked like a money-printing machine.
Then, to be safe, I extended the test to 10 months and included all the coins that hadn't yet been delisted at the time. After rerunning it, the initial 1,000 USDT was down to just 20 USDT.
A lot of people make money in backtests simply because they use today's perspective to choose the coin pool, filtering out the coins that died from the start.
2. Are “extremely negative funding rates + a surge in open interest” really signs of an impending short squeeze?
When watching the market, people often assume that if shorts are too crowded, prices are bound to rise and squeeze them out.
I found 594 instances of this standard signal in the 10-month dataset. But if you went long on them, the win rate was only around 26%. Also, in each of the 11 months, the median return after holding for 24 hours was negative (around -7% overall). In seven out of ten cases, prices pulled back after spiking.
3. The supposedly effortless funding-rate arbitrage hedge lost 89.7% over 10 months.
I tried going long on the coins with the most negative funding rates while shorting those with the highest positive rates, thinking the two sides would hedge each other and deliver steady returns.
After running the test, I found that altcoins with extremely negative funding rates are often coins that have just been pumped. The next day's price drop leaves a hole that funding payments simply can't fill.
4. I caught a +507% move in $RAVE , but the account still ended up losing money.
I tested a trend strategy based on “a breakout to a 30-day high on rising volume + a trailing stop.”
It did catch big movers like $RAVE (+507%) and $LSK (+317%), but nearly 80% of the more than 1,600 breakouts across the market ended in losses. With every stop-out costing 6%, the account was already ground down before a big mover ever came along.
5. Is it worth holding on to coins that have skyrocketed?
Take $BIRB , which rose 132% in a single day recently. If you strictly closed the position after 24 hours, the price never returned to that level afterward.
If you decided to hold on for another day, it fell 51.7% from its price at the 24-hour mark; after two more days, it was down 57.6%. The buying pressure fueling the short squeeze had basically burned out within a day.
After all that testing, only 1 of the 17 strategies held up in both the first and second halves of the year:
It had positive returns in 9 of the 11 months, and even made 7.8% in March, when the whole market plunged.
This strategy completely gives up on going long and doesn't use high leverage. Instead, it focuses on weak coins further down the ranks that nobody is paying attention to, which suddenly surge abnormally, and trades against them.
But it currently has one critical flaw: it depends heavily on order-book depth when stop-loss orders are executed. If a sudden wick causes stop-loss slippage to exceed 1%, most of the profits get eaten up.
I've now set this script up on a server in Tokyo. It checks the live bid and ask order books once a minute so I can see how much slippage there really is. I'll post the actual daily trading results here as they come in, exactly as they are, whether gains or losses.
In the next post, I'll go into detail about how this contrarian strategy identifies when market makers are running out of steam. Follow if you're interested.
📌 The above is based on historical backtests and simulated trading research, and does not constitute investment advice.
$BIRB $RAVE $LSK
#量化 #合约交易 #Altcoins
1
1
889
·
--
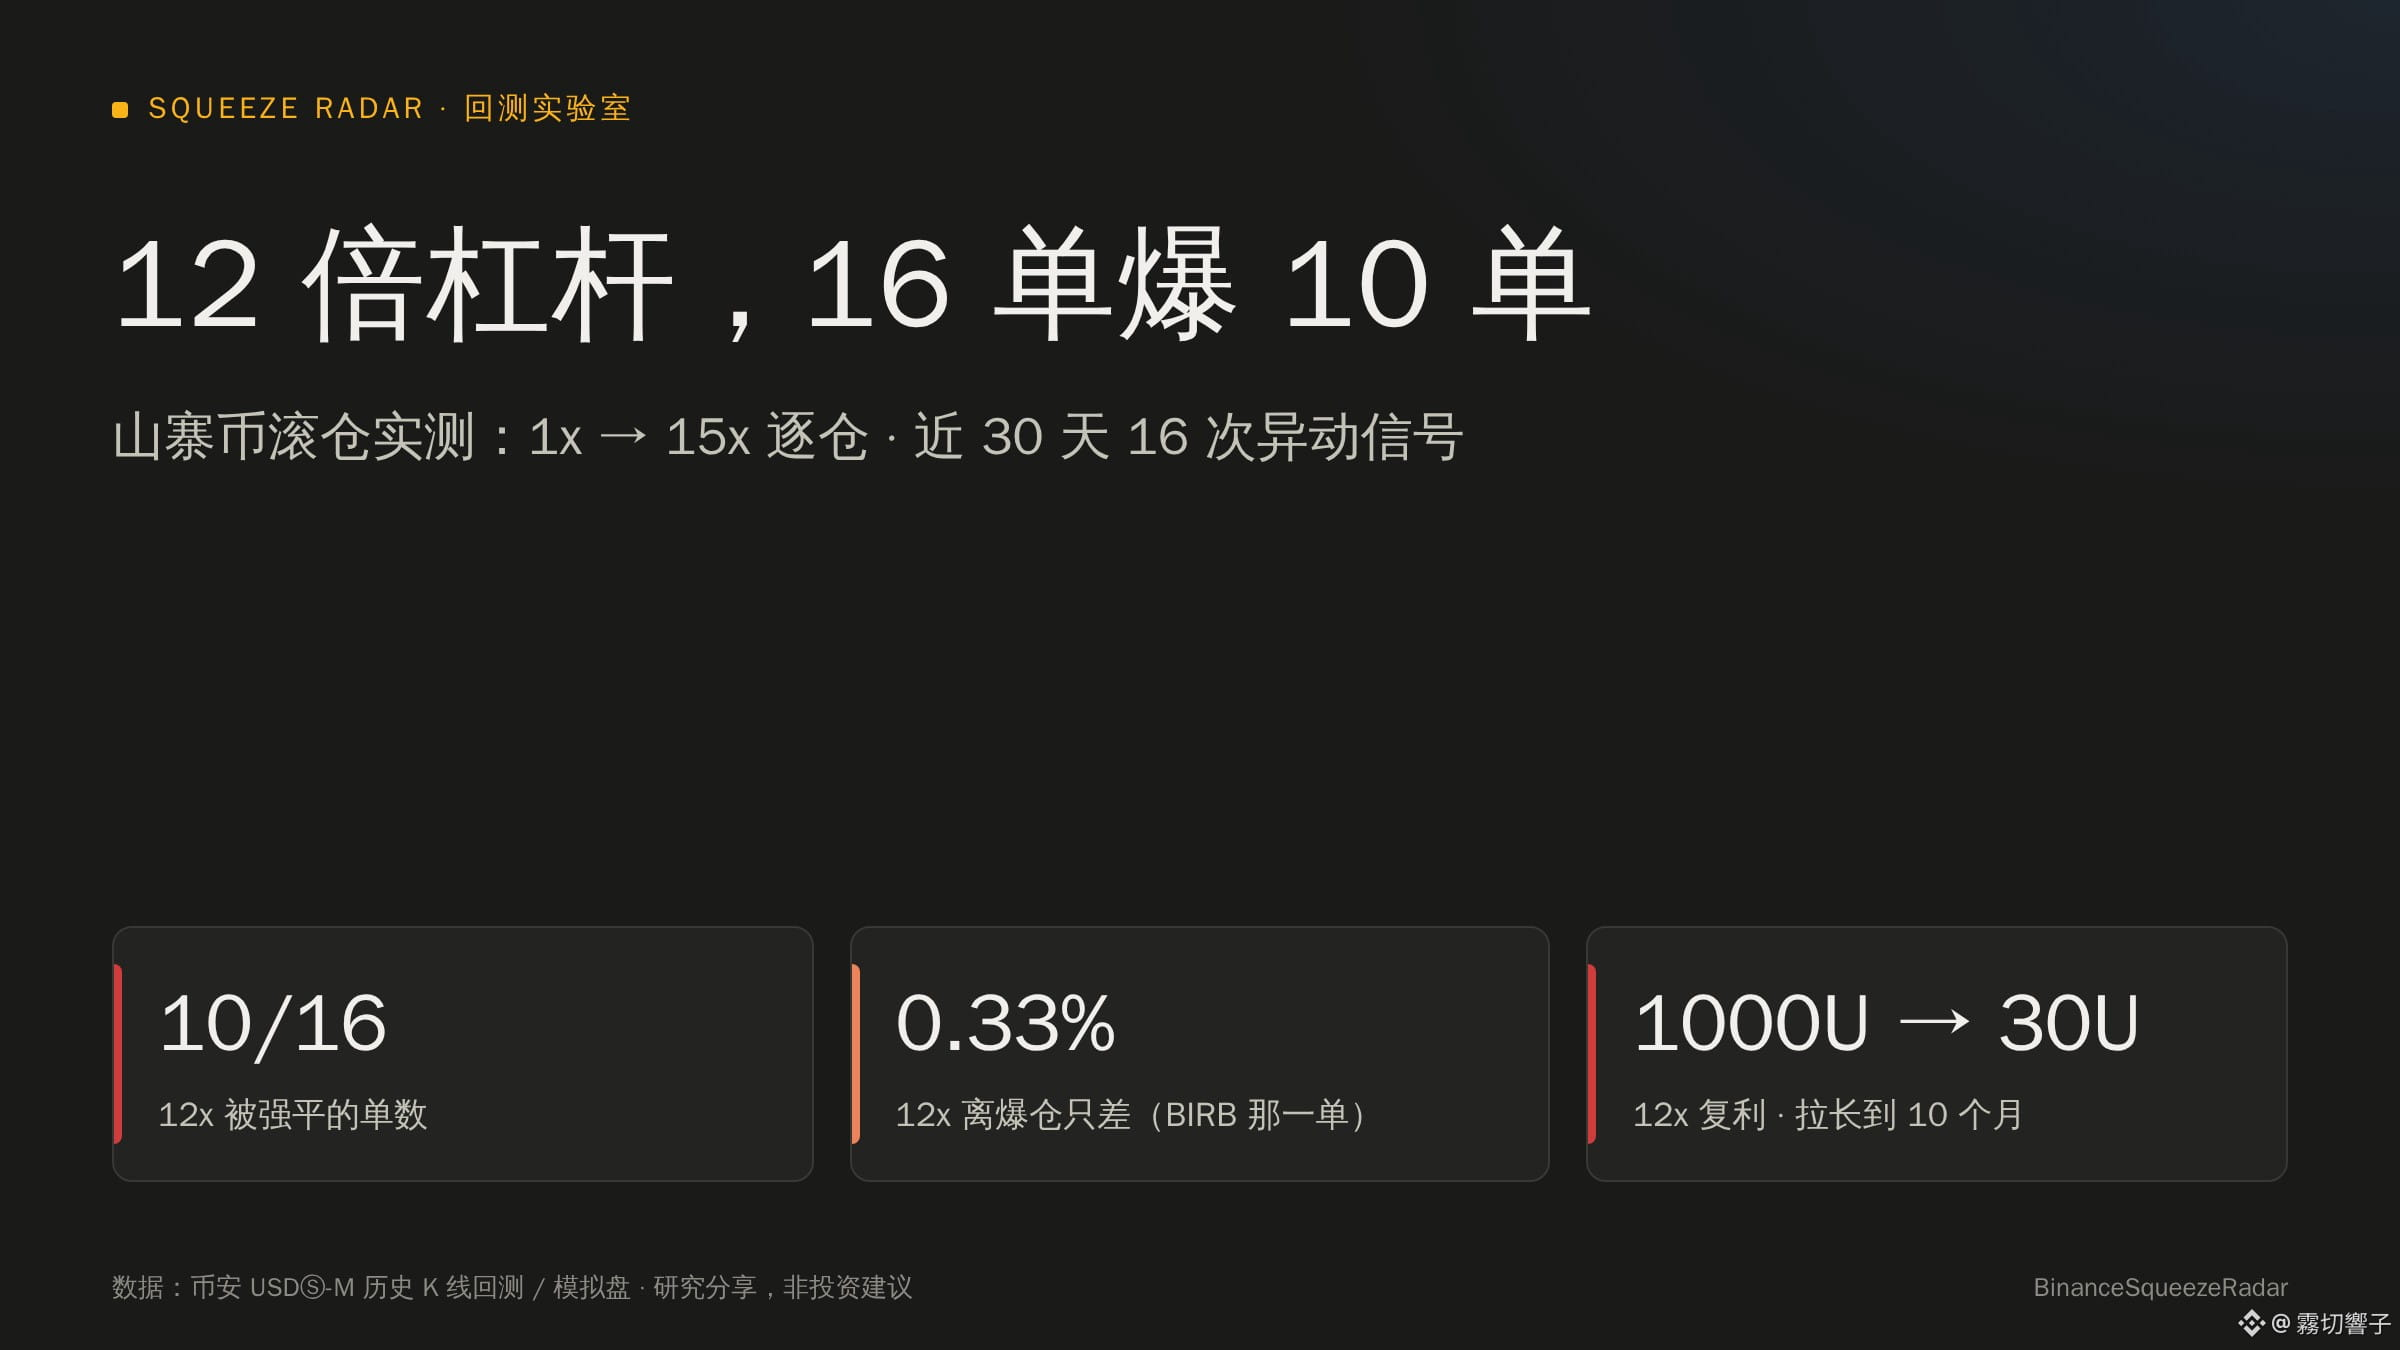
12x leverage: 10 of 16 trades liquidated. I tested altcoin compounding from 1x to 15x
You often see screenshots on the trading forum of people turning a few hundred U into tens of thousands with 10x or 20x leverage. What leverage is actually reasonable for altcoin futures? Using Binance historical data, I ran the same batch of altcoin volatility signals at every isolated-margin leverage level from 1x to 15x.
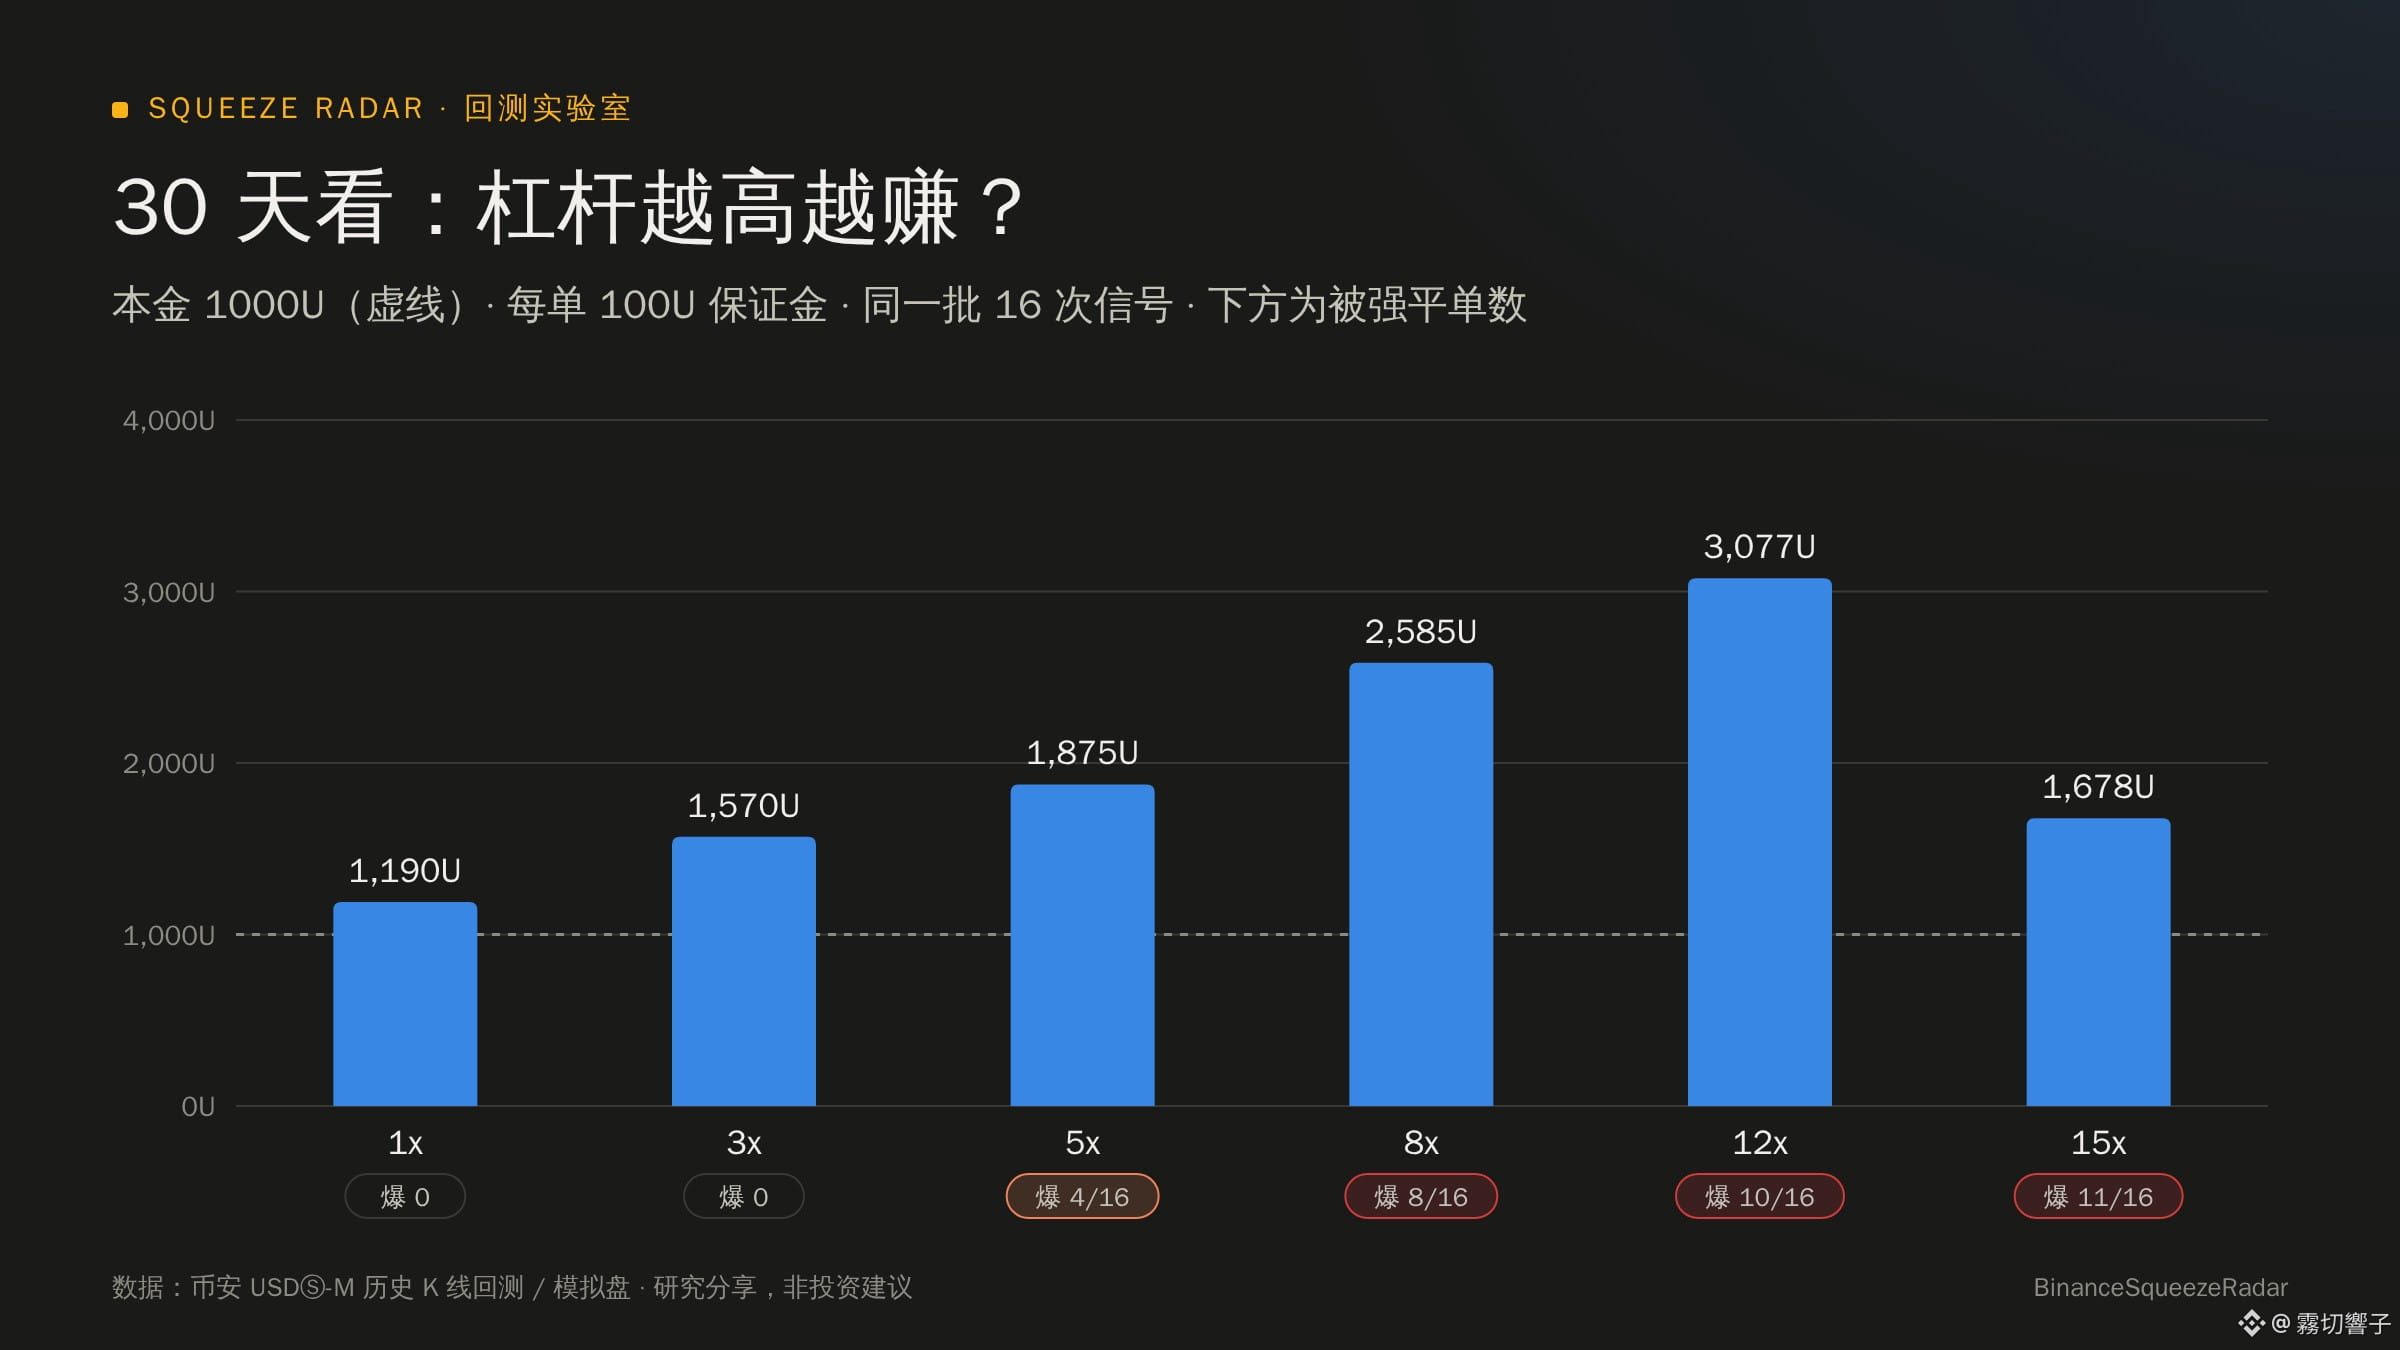
📊 Test 1: Past 30 days, 16 signals, 1000U starting capital, 100U margin per trade
Leverage|Ending equity|Liquidated|Max drawdown
1x|1190U|0/16|-8%
3x|1570U|0/16|-18%
5x|1875U|4/16|-28%
8x|2585U|8/16|-27%
12x|3077U|10/16|-35%
15x|1678U|11/16|-46%
It looks like 12x made the most—but it all came down to one trade.
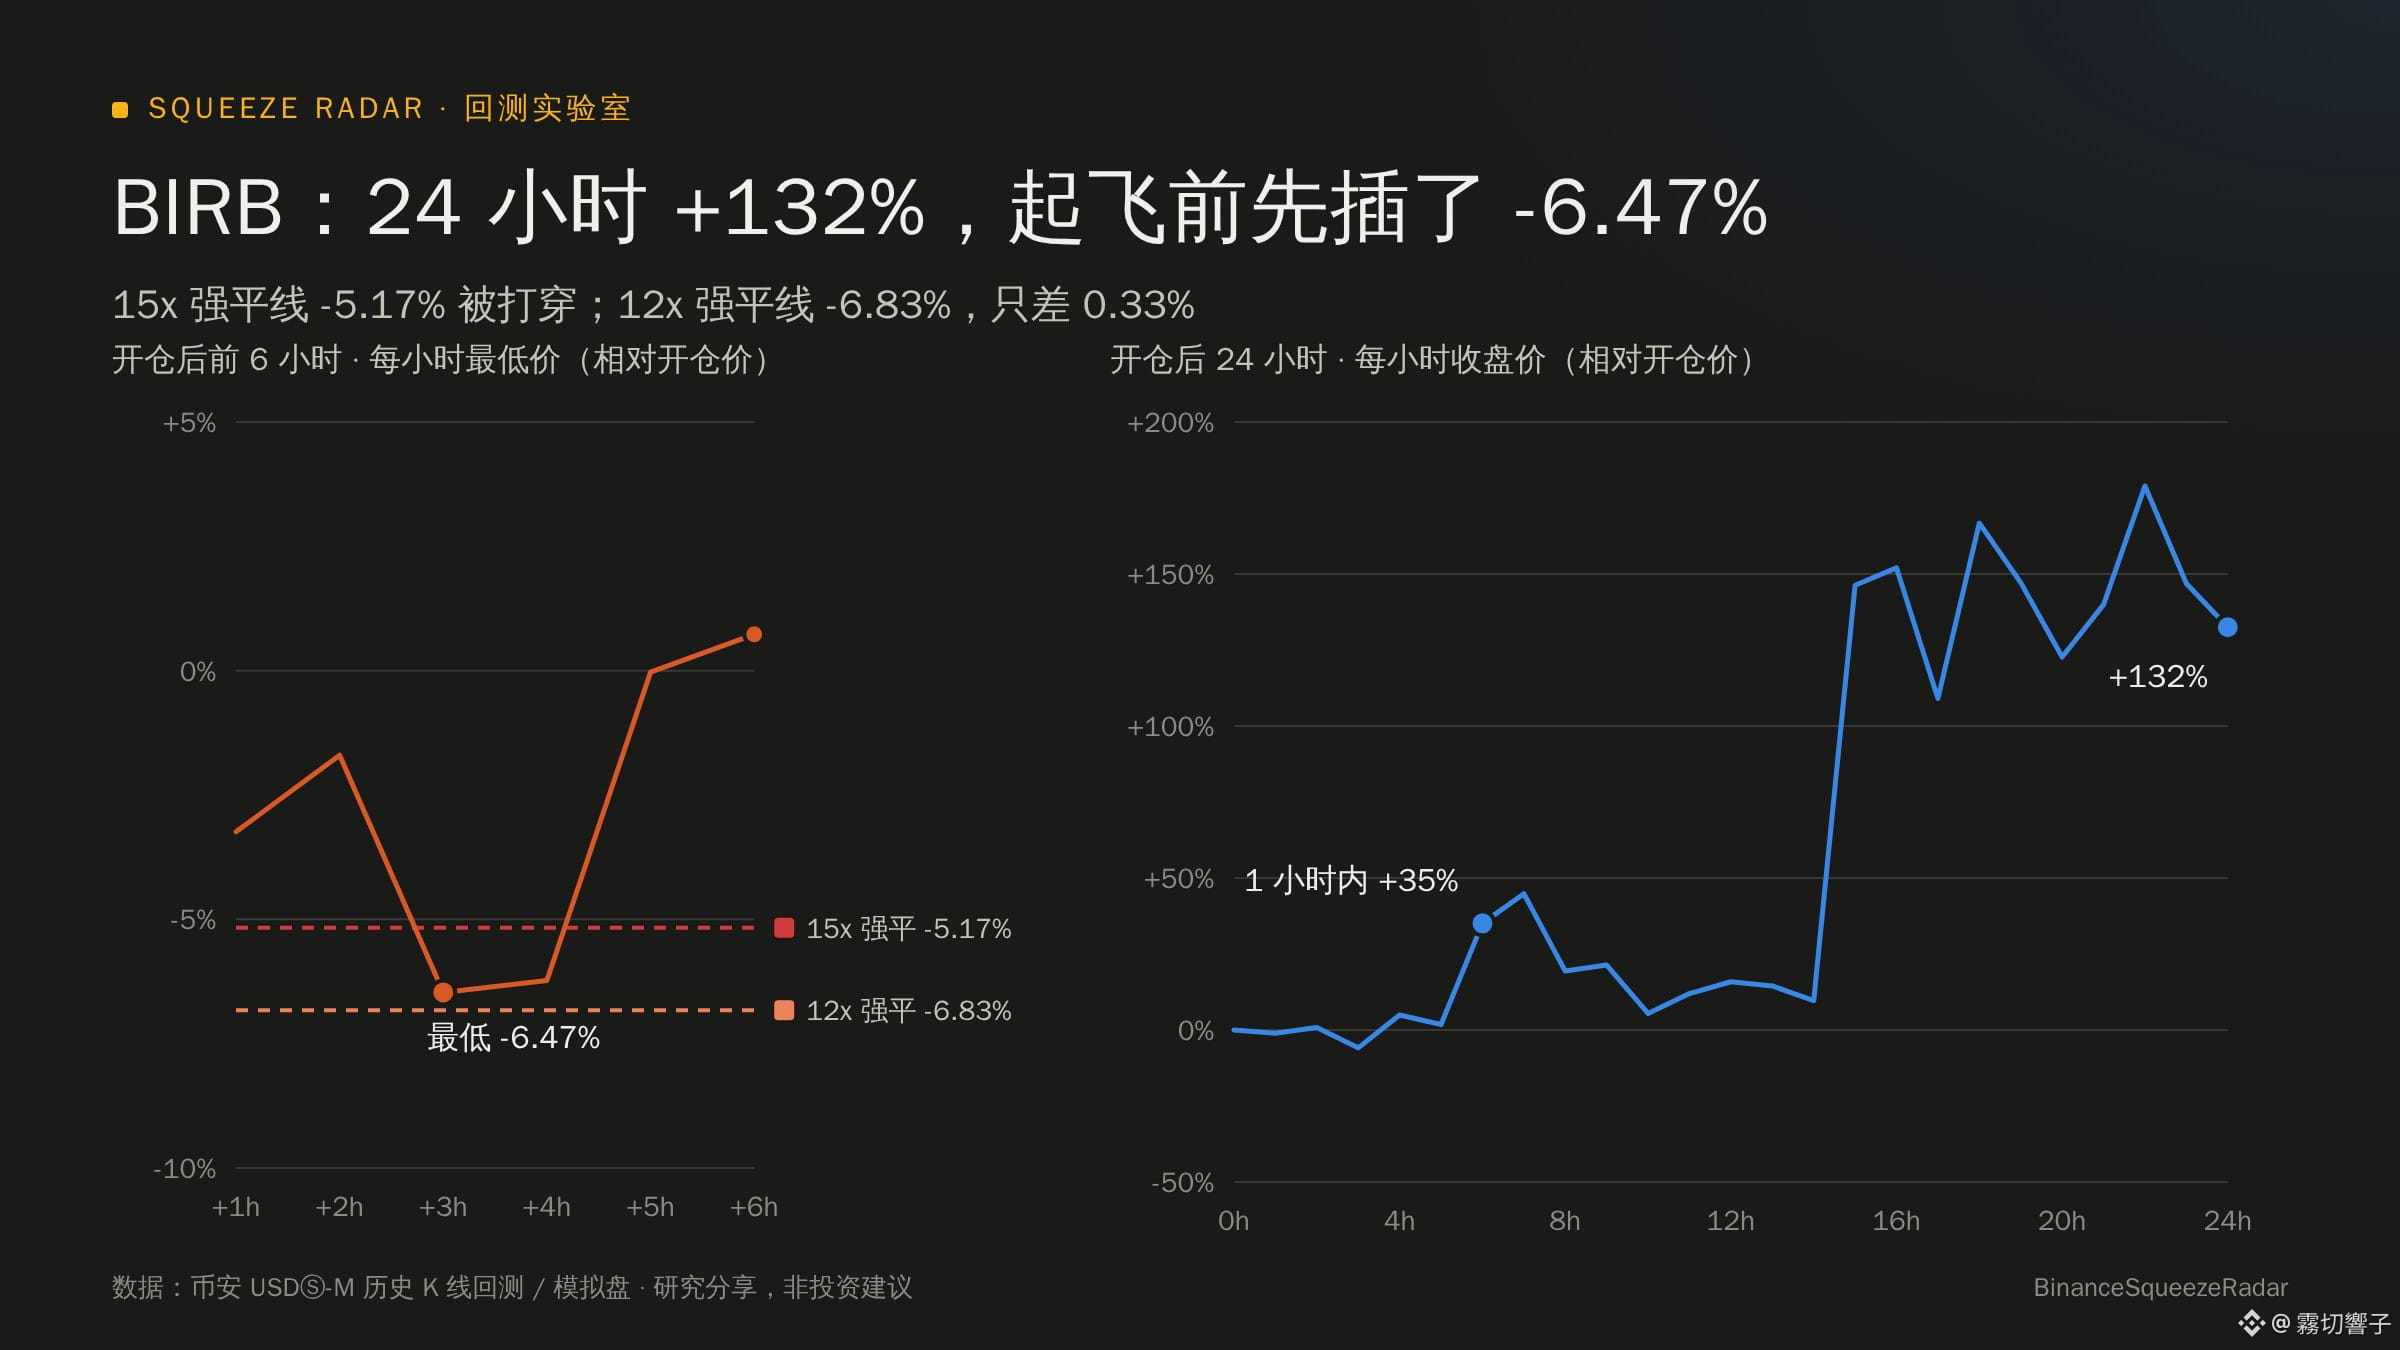
🎯 $BIRB : It rose 132% in 24 hours, but first dipped -6.5% before taking off
· At 15x, the liquidation threshold was about -5.17% → a shakeout wick took it out before the rally; it captured none of the move
· At 12x, the liquidation threshold was about -6.83% → it survived by just 0.33%
First place for 12x came down entirely to that 0.33% bit of luck. And in live trading, liquidation is calculated using mark price and tiered maintenance margin, so the actual safety buffer is even thinner.
📉 Test 2: Extend the period to 10 months, and the luck runs out
From January to November 2026, the same signals triggered 594 times:
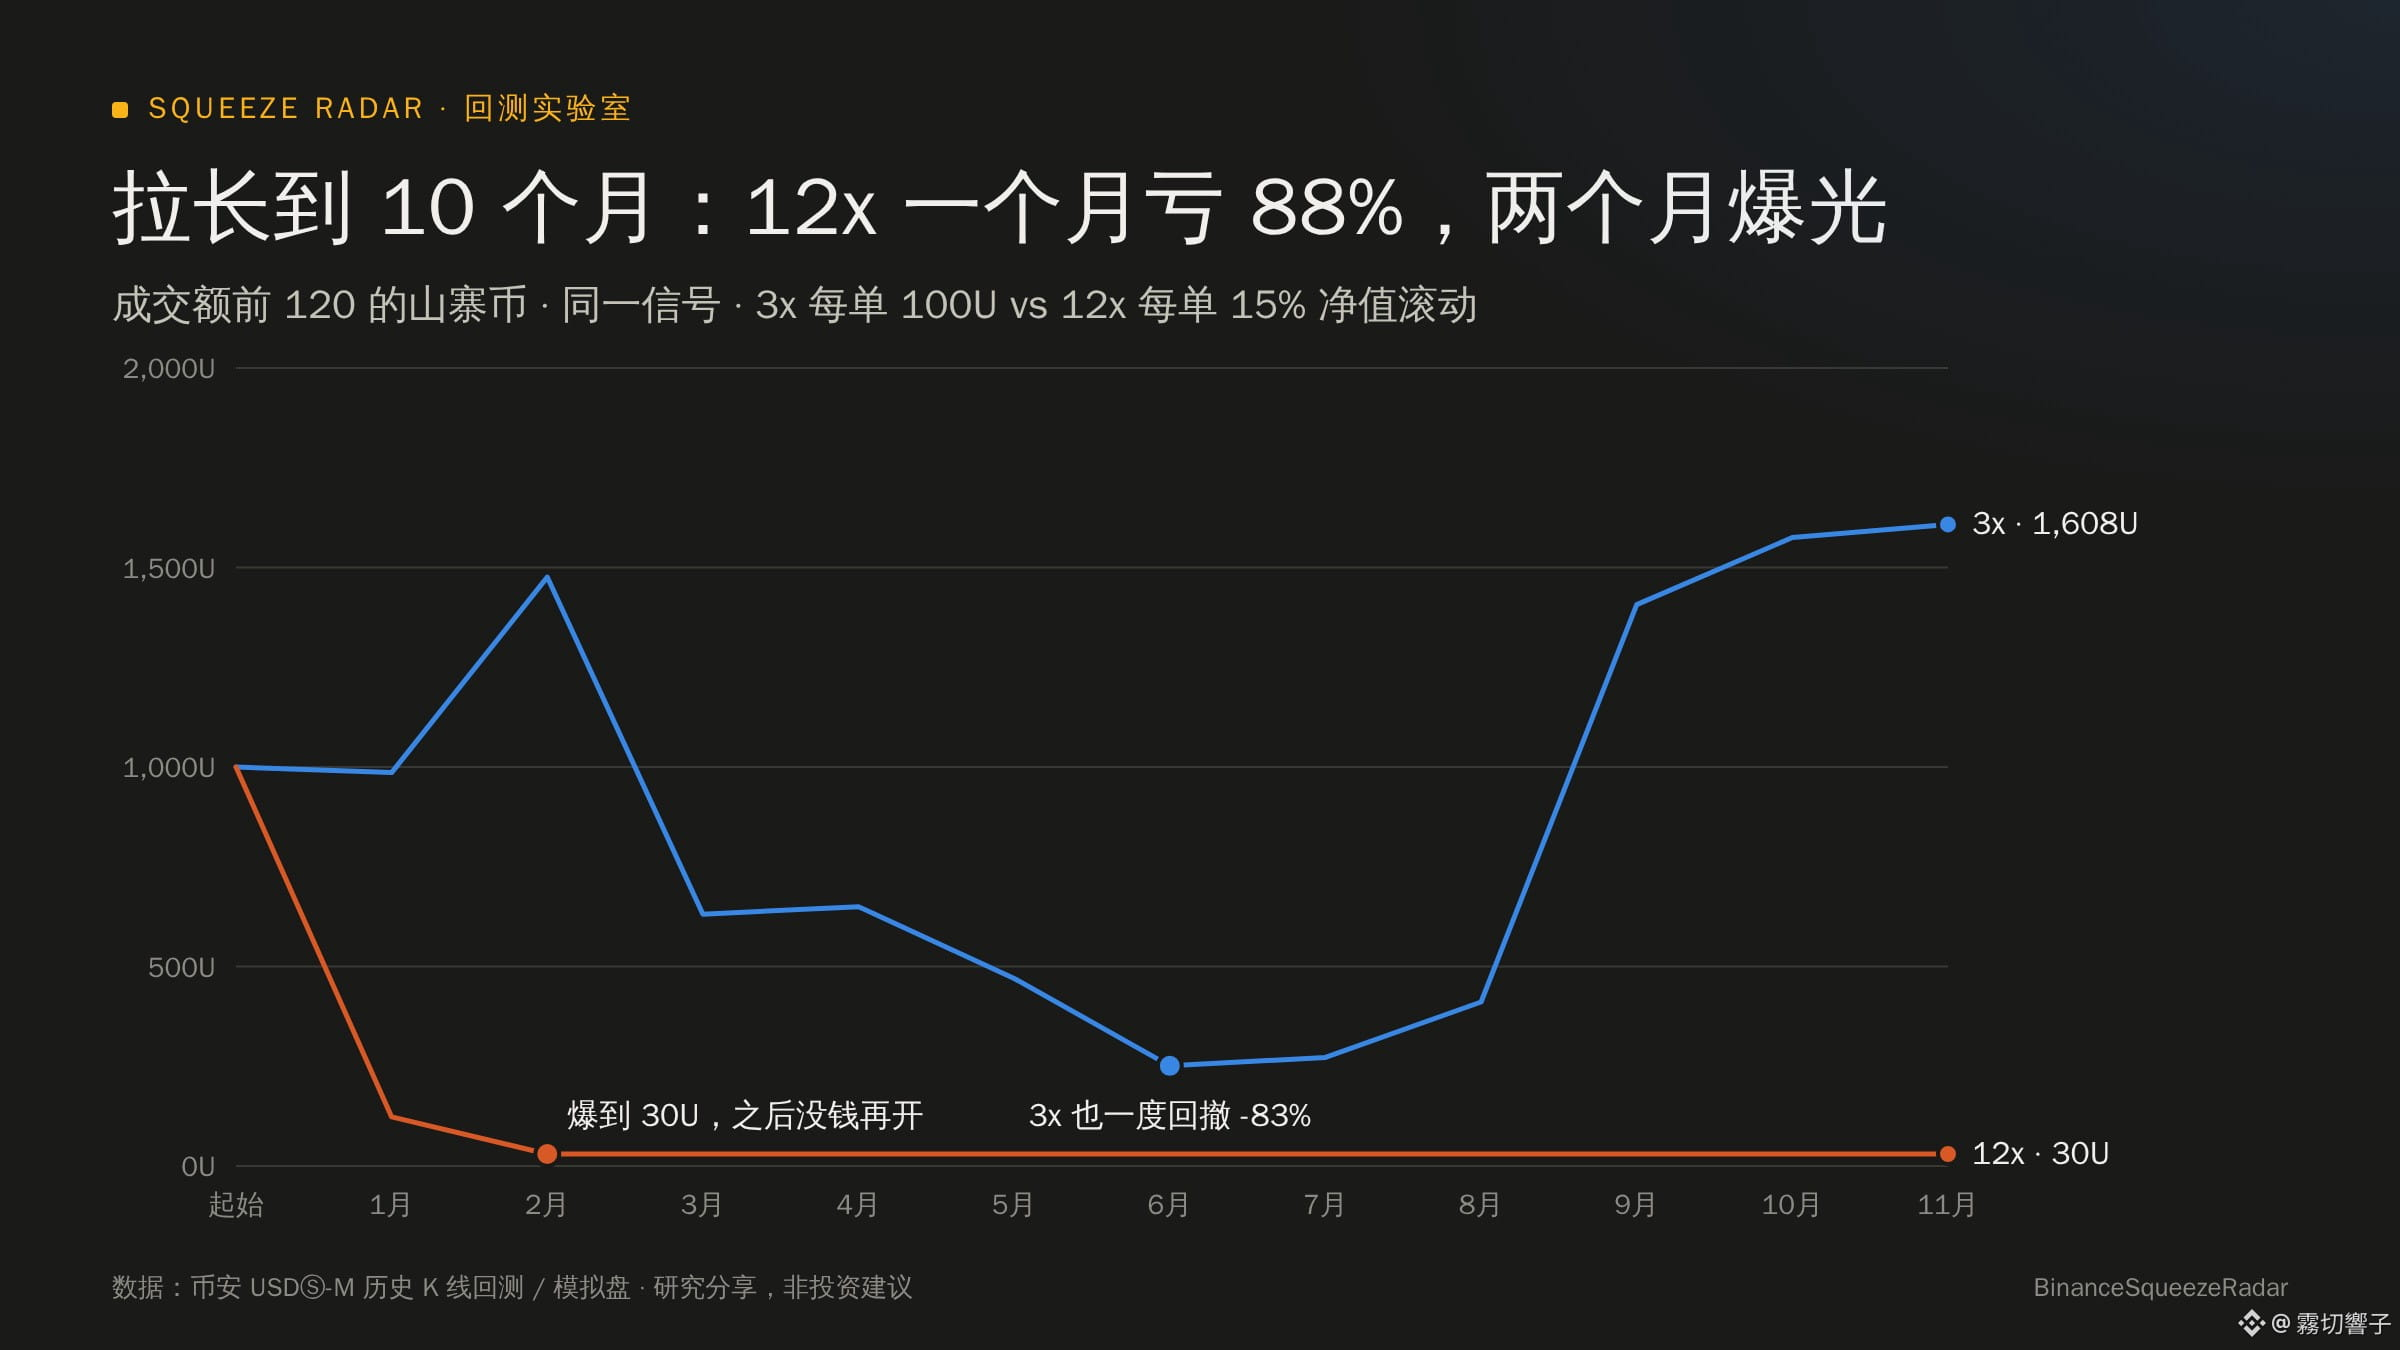
· Calculating each 100U trade independently: 3x lost a total of -1933U; 12x lost a total of -12491U
· 12x compounding account: 1000U → 30U; 28 of the first 39 trades were liquidated, leaving no funds to trade afterward
The leverage that makes the most in the short term is often the quickest to wipe out over the long term.
🔁 Test 3: Adding to a position with unrealized profits makes things riskier
Still using $BIRB : It surged from +1.8% to +35% within an hour, triggering the rule to «add to the position with unrealized profits up to 10x». As a result, 70% of the position was bought at +35%, pushing the overall liquidation threshold up to +11.85%.
It then pulled back normally to +4.6% (still in profit), and the account was liquidated to zero.
Meanwhile, an account opened at 3x and left untouched captured the entire rise: +413U.
🖥 Live simulation test
I set up a 12x simulated test track on a server (matched against the real-time order book, no real money involved). The two trades opened on November 10, $INIT and $CYBER , were both liquidated during normal pullbacks within hours of opening.
💡 Conclusion
1. 5–10% wicks up or down are routine for altcoins. Above 10x, the liquidation threshold is effectively within the range of normal price movements.
2. Higher leverage makes the most in short-term backtests, usually because one trade narrowly avoided liquidation. Look at a longer period.
3. Adding to a position with unrealized profits raises the average entry price and the liquidation threshold— the higher the price goes, the riskier it gets.
4. To capture a big move, you need low leverage you can stick with, not a high-leverage gamble.
📌 Data from Binance historical candlestick backtests and simulated trading records. Shared for research purposes; not investment advice.
$BIRB $INIT $CYBER
#合约 #杠杆 #滚仓 #TradingInsights
12x leverage: 10 of 16 trades liquidated. I tested altcoin compounding from 1x to 15x
You often see screenshots on the trading forum of people turning a few hundred U into tens of thousands with 10x or 20x leverage. What leverage is actually reasonable for altcoin futures? Using Binance historical data, I ran the same batch of altcoin volatility signals at every isolated-margin leverage level from 1x to 15x.
📊 Test 1: Past 30 days, 16 signals, 1000U starting capital, 100U margin per trade
Leverage|Ending equity|Liquidated|Max drawdown
1x|1190U|0/16|-8%
3x|1570U|0/16|-18%
5x|1875U|4/16|-28%
8x|2585U|8/16|-27%
12x|3077U|10/16|-35%
15x|1678U|11/16|-46%
It looks like 12x made the most—but it all came down to one trade.
🎯 $BIRB : It rose 132% in 24 hours, but first dipped -6.5% before taking off
· At 15x, the liquidation threshold was about -5.17% → a shakeout wick took it out before the rally; it captured none of the move
· At 12x, the liquidation threshold was about -6.83% → it survived by just 0.33%
First place for 12x came down entirely to that 0.33% bit of luck. And in live trading, liquidation is calculated using mark price and tiered maintenance margin, so the actual safety buffer is even thinner.
📉 Test 2: Extend the period to 10 months, and the luck runs out
From January to November 2026, the same signals triggered 594 times:
· Calculating each 100U trade independently: 3x lost a total of -1933U; 12x lost a total of -12491U
· 12x compounding account: 1000U → 30U; 28 of the first 39 trades were liquidated, leaving no funds to trade afterward
The leverage that makes the most in the short term is often the quickest to wipe out over the long term.
🔁 Test 3: Adding to a position with unrealized profits makes things riskier
Still using $BIRB : It surged from +1.8% to +35% within an hour, triggering the rule to «add to the position with unrealized profits up to 10x». As a result, 70% of the position was bought at +35%, pushing the overall liquidation threshold up to +11.85%.
It then pulled back normally to +4.6% (still in profit), and the account was liquidated to zero.
Meanwhile, an account opened at 3x and left untouched captured the entire rise: +413U.
🖥 Live simulation test
I set up a 12x simulated test track on a server (matched against the real-time order book, no real money involved). The two trades opened on November 10, $INIT and $CYBER , were both liquidated during normal pullbacks within hours of opening.
💡 Conclusion
1. 5–10% wicks up or down are routine for altcoins. Above 10x, the liquidation threshold is effectively within the range of normal price movements.
2. Higher leverage makes the most in short-term backtests, usually because one trade narrowly avoided liquidation. Look at a longer period.
3. Adding to a position with unrealized profits raises the average entry price and the liquidation threshold— the higher the price goes, the riskier it gets.
4. To capture a big move, you need low leverage you can stick with, not a high-leverage gamble.
📌 Data from Binance historical candlestick backtests and simulated trading records. Shared for research purposes; not investment advice.
$BIRB $INIT $CYBER
#合约 #杠杆 #滚仓 #TradingInsights
You often see screenshots on the trading forum of people turning a few hundred U into tens of thousands with 10x or 20x leverage. What leverage is actually reasonable for altcoin futures? Using Binance historical data, I ran the same batch of altcoin volatility signals at every isolated-margin leverage level from 1x to 15x.
📊 Test 1: Past 30 days, 16 signals, 1000U starting capital, 100U margin per trade
Leverage|Ending equity|Liquidated|Max drawdown
1x|1190U|0/16|-8%
3x|1570U|0/16|-18%
5x|1875U|4/16|-28%
8x|2585U|8/16|-27%
12x|3077U|10/16|-35%
15x|1678U|11/16|-46%
It looks like 12x made the most—but it all came down to one trade.
🎯 $BIRB : It rose 132% in 24 hours, but first dipped -6.5% before taking off
· At 15x, the liquidation threshold was about -5.17% → a shakeout wick took it out before the rally; it captured none of the move
· At 12x, the liquidation threshold was about -6.83% → it survived by just 0.33%
First place for 12x came down entirely to that 0.33% bit of luck. And in live trading, liquidation is calculated using mark price and tiered maintenance margin, so the actual safety buffer is even thinner.
📉 Test 2: Extend the period to 10 months, and the luck runs out
From January to November 2026, the same signals triggered 594 times:
· Calculating each 100U trade independently: 3x lost a total of -1933U; 12x lost a total of -12491U
· 12x compounding account: 1000U → 30U; 28 of the first 39 trades were liquidated, leaving no funds to trade afterward
The leverage that makes the most in the short term is often the quickest to wipe out over the long term.
🔁 Test 3: Adding to a position with unrealized profits makes things riskier
Still using $BIRB : It surged from +1.8% to +35% within an hour, triggering the rule to «add to the position with unrealized profits up to 10x». As a result, 70% of the position was bought at +35%, pushing the overall liquidation threshold up to +11.85%.
It then pulled back normally to +4.6% (still in profit), and the account was liquidated to zero.
Meanwhile, an account opened at 3x and left untouched captured the entire rise: +413U.
🖥 Live simulation test
I set up a 12x simulated test track on a server (matched against the real-time order book, no real money involved). The two trades opened on November 10, $INIT and $CYBER , were both liquidated during normal pullbacks within hours of opening.
💡 Conclusion
1. 5–10% wicks up or down are routine for altcoins. Above 10x, the liquidation threshold is effectively within the range of normal price movements.
2. Higher leverage makes the most in short-term backtests, usually because one trade narrowly avoided liquidation. Look at a longer period.
3. Adding to a position with unrealized profits raises the average entry price and the liquidation threshold— the higher the price goes, the riskier it gets.
4. To capture a big move, you need low leverage you can stick with, not a high-leverage gamble.
📌 Data from Binance historical candlestick backtests and simulated trading records. Shared for research purposes; not investment advice.
$BIRB $INIT $CYBER
#合约 #杠杆 #滚仓 #TradingInsights
1
3
1.1k
·
--
98% really no one else
98% really no one else

拾荒弟
·
--
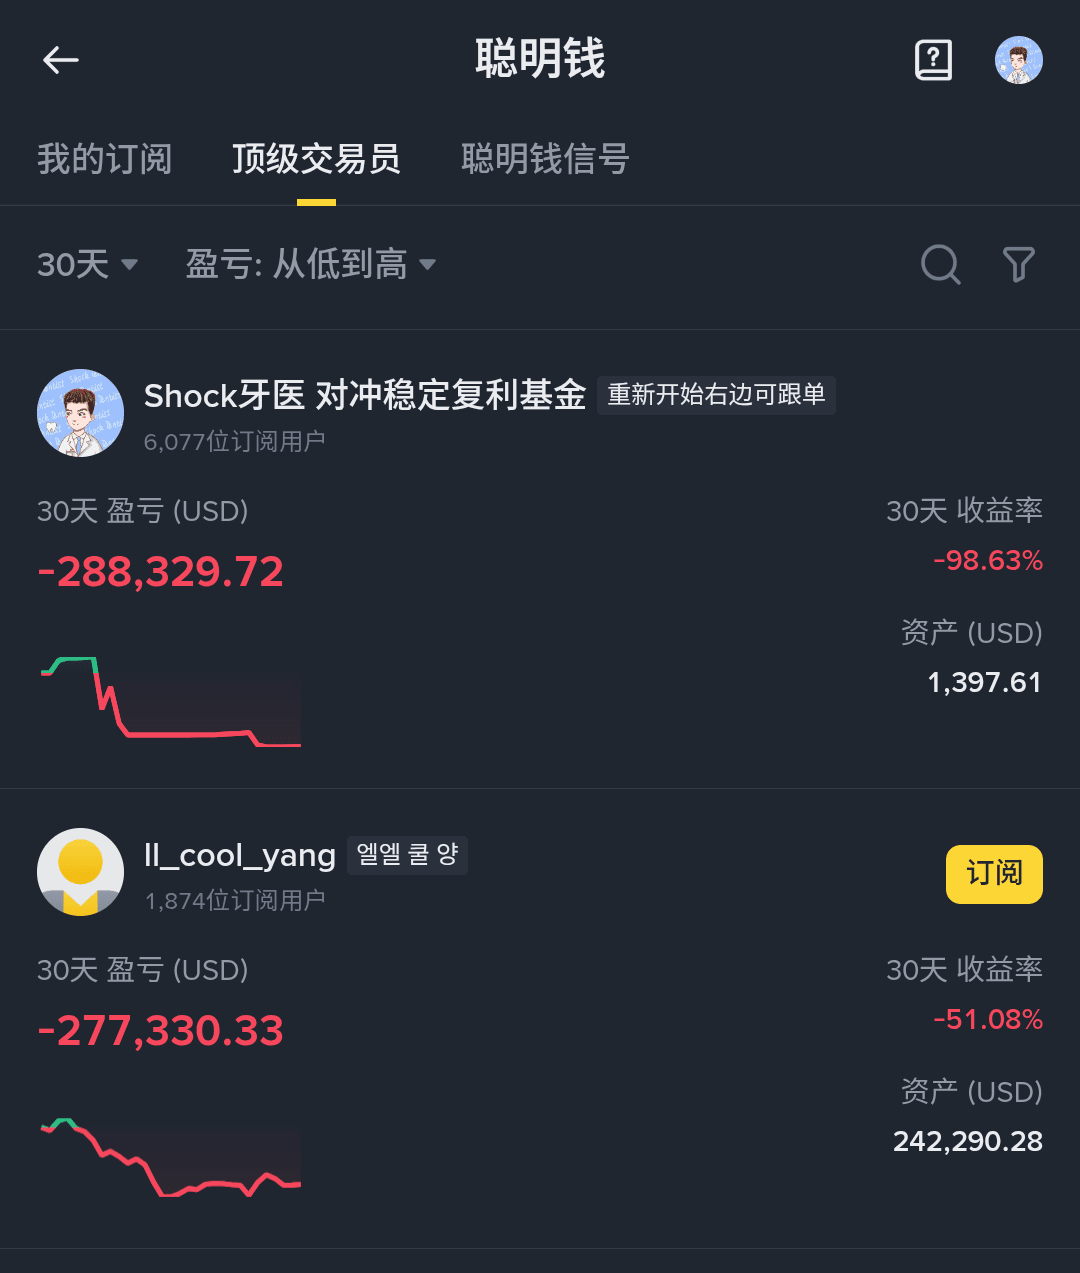
Good news: Smart money has made the list
Bad news: It's on the loss list
Bad news: It's on the loss list
·
--
There are still people following the order despite the loss.
There are still people following the order despite the loss.
拾荒弟
·
--
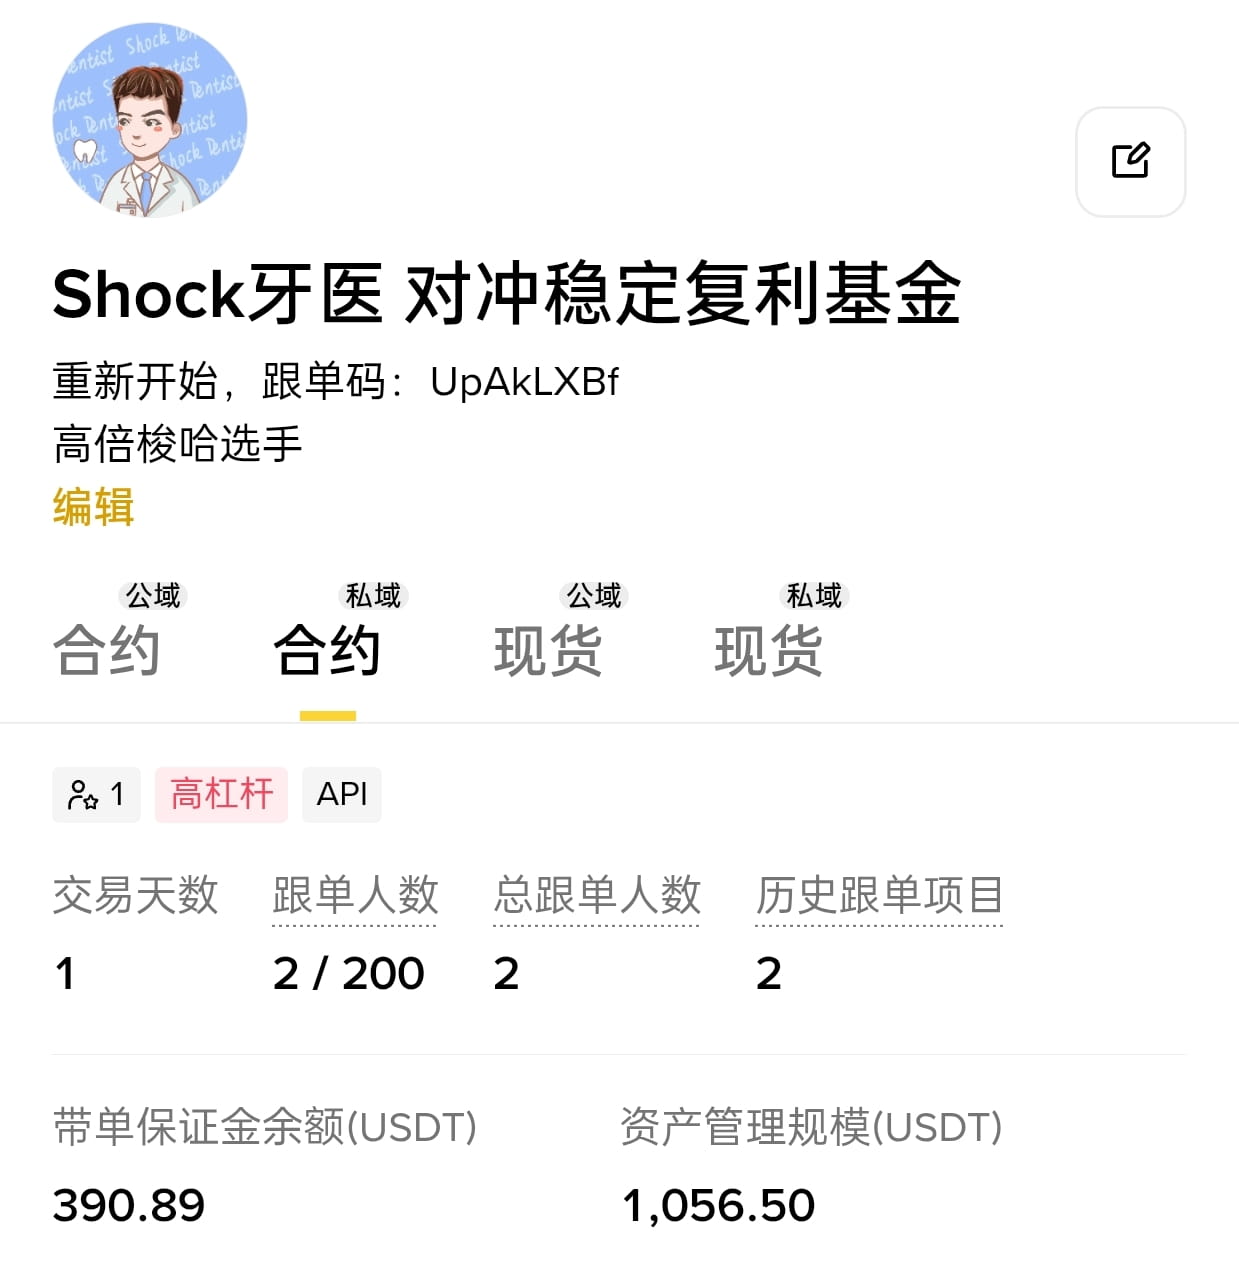
Last 300u, I have no choice
·
--
Bro, isn't this real trading purely hedging?
Bro, isn't this real trading purely hedging?

老烈火__稳定返涌
·
--
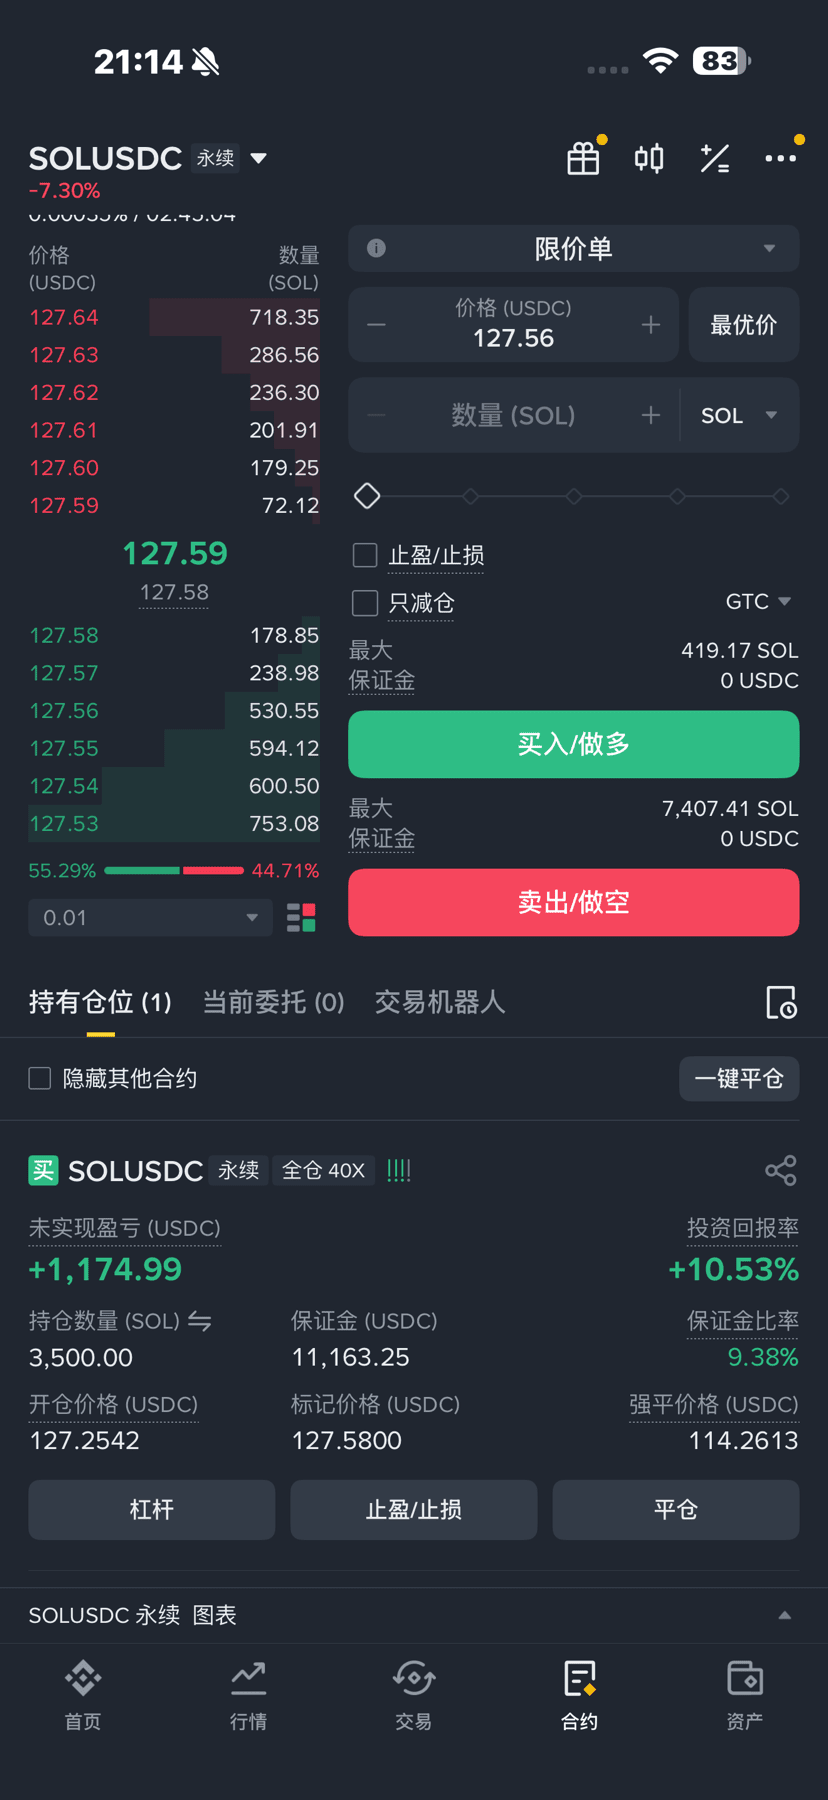
BullishJust opened a position and made money, luck is unstoppable! $SOL
·
--
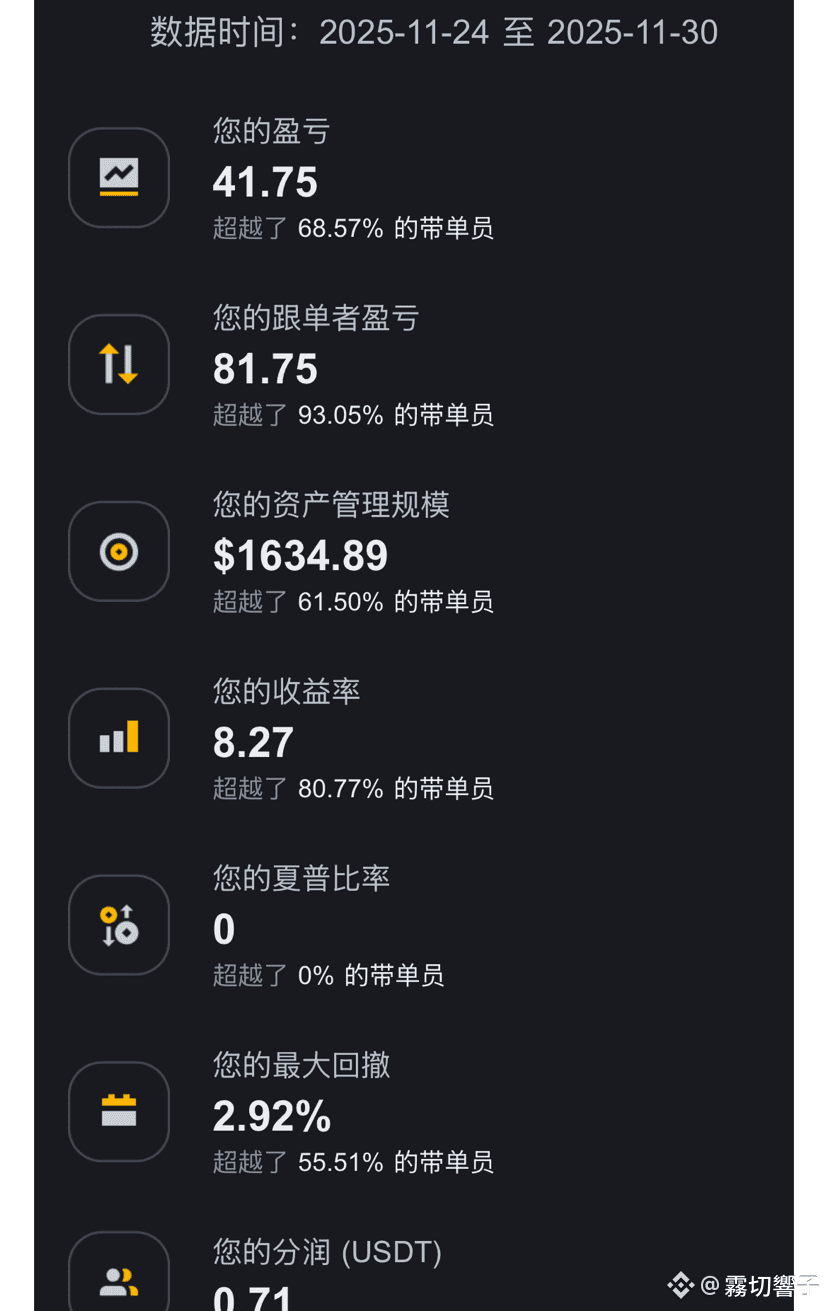
My small amount of capital can actually outperform 93% of traders 🤣🤣🤣
My small amount of capital can actually outperform 93% of traders 🤣🤣🤣
5
29
·
--
Bullish
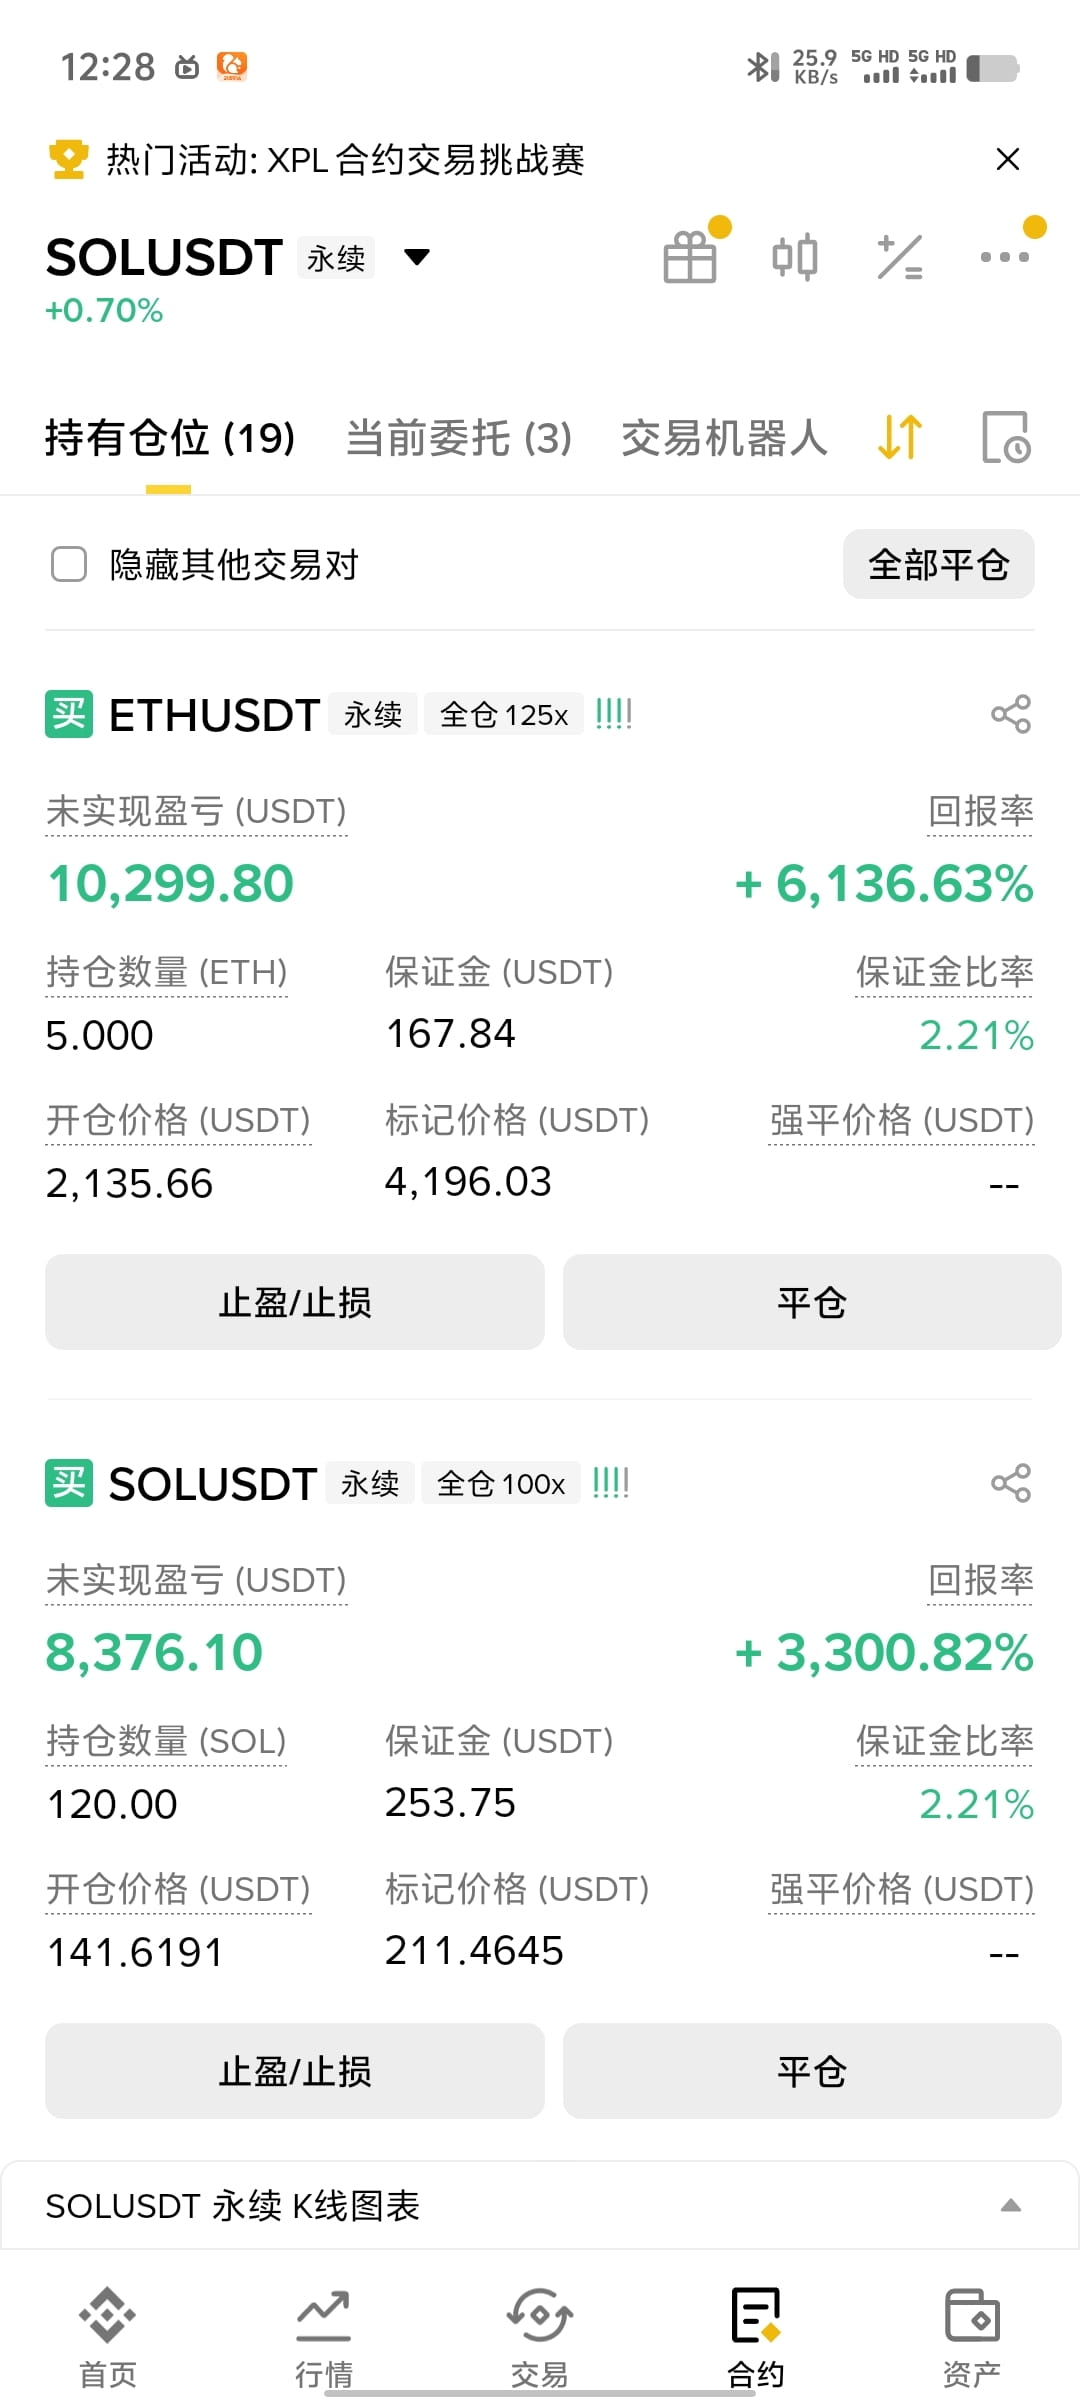
$BTC Last night's perfect W bottom
But I still dare not hold too long
{future}(BTCUSDT)
{future}(SOLUSDT)
$BTC Last night's perfect W bottom
But I still dare not hold too long
But I still dare not hold too long
1
28


Log in to explore more content
Join global crypto users on Binance Square
⚡️ Get latest and useful information about crypto.
💬 Trusted by the world’s largest crypto exchange.
👍 Discover real insights from verified creators.
Email / Phone number
Trending Topics
HuangExitNvidiaStrategyInFocus
104,050 views
1,135 Discussing
STOCKS | Nvidia’s Jensen Huang Resigns, Colette Kress Named as Interim CEO
Binance News
·29 Likes
·37.4k views
AnthropicRejectsIPODelayValuationinQuestion
711,644 views
5,362 Discussing
HedgeFundsCMEBitcoinNetShortsFall89%
308 views
23 Discussing