

Cheryl Linder dPq6
17 Posts

Cheryl Linder dPq6
Report
Block User
Open Trade
Frequent Trader
2.1 Years
16 Following
31 Followers
39 Liked
Posts
Portfolio
All
Quotes
1
1.6k
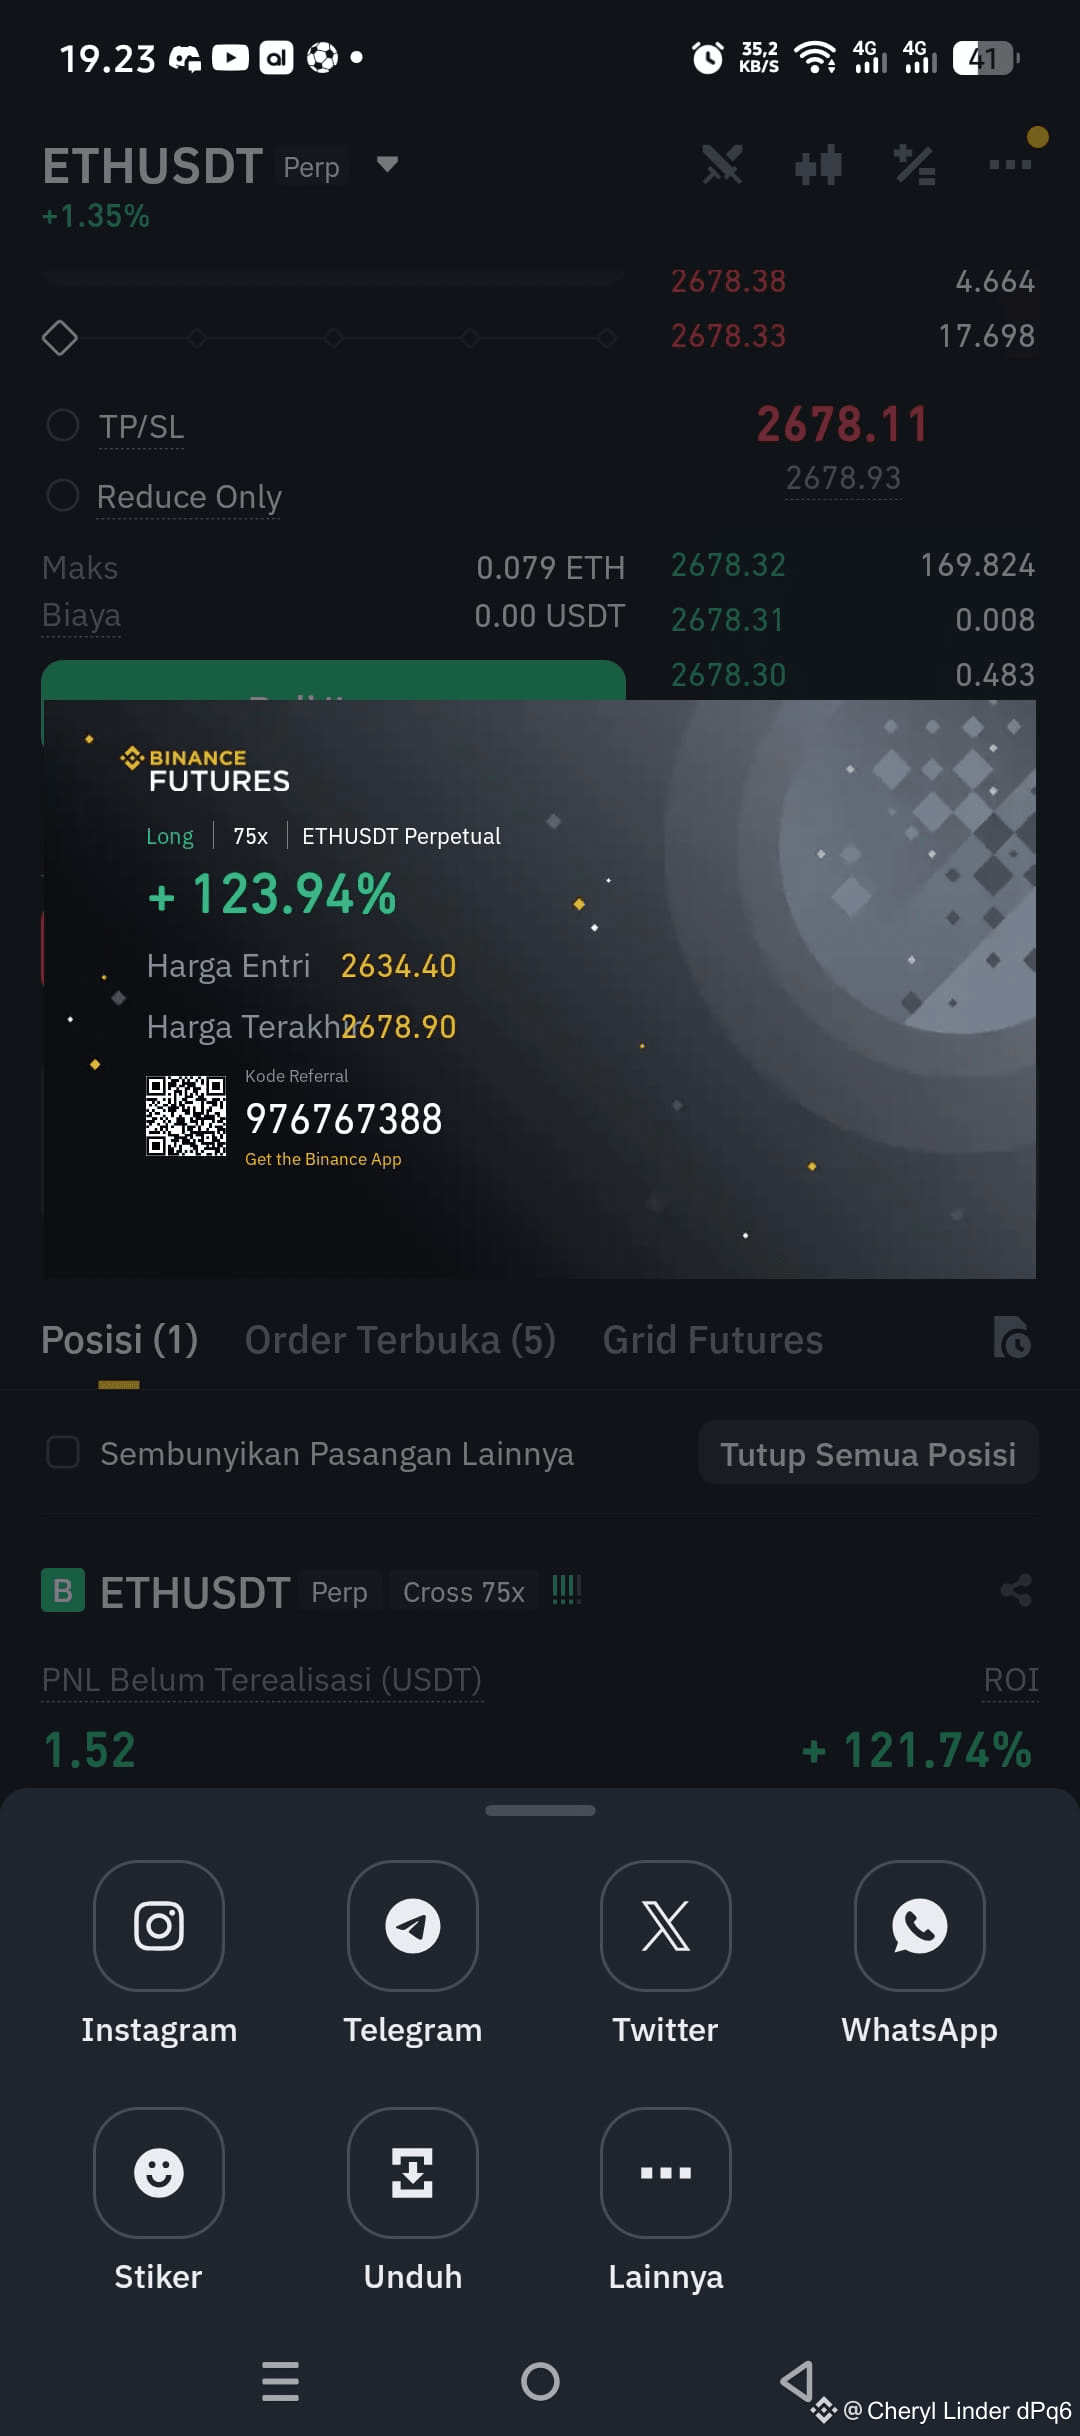
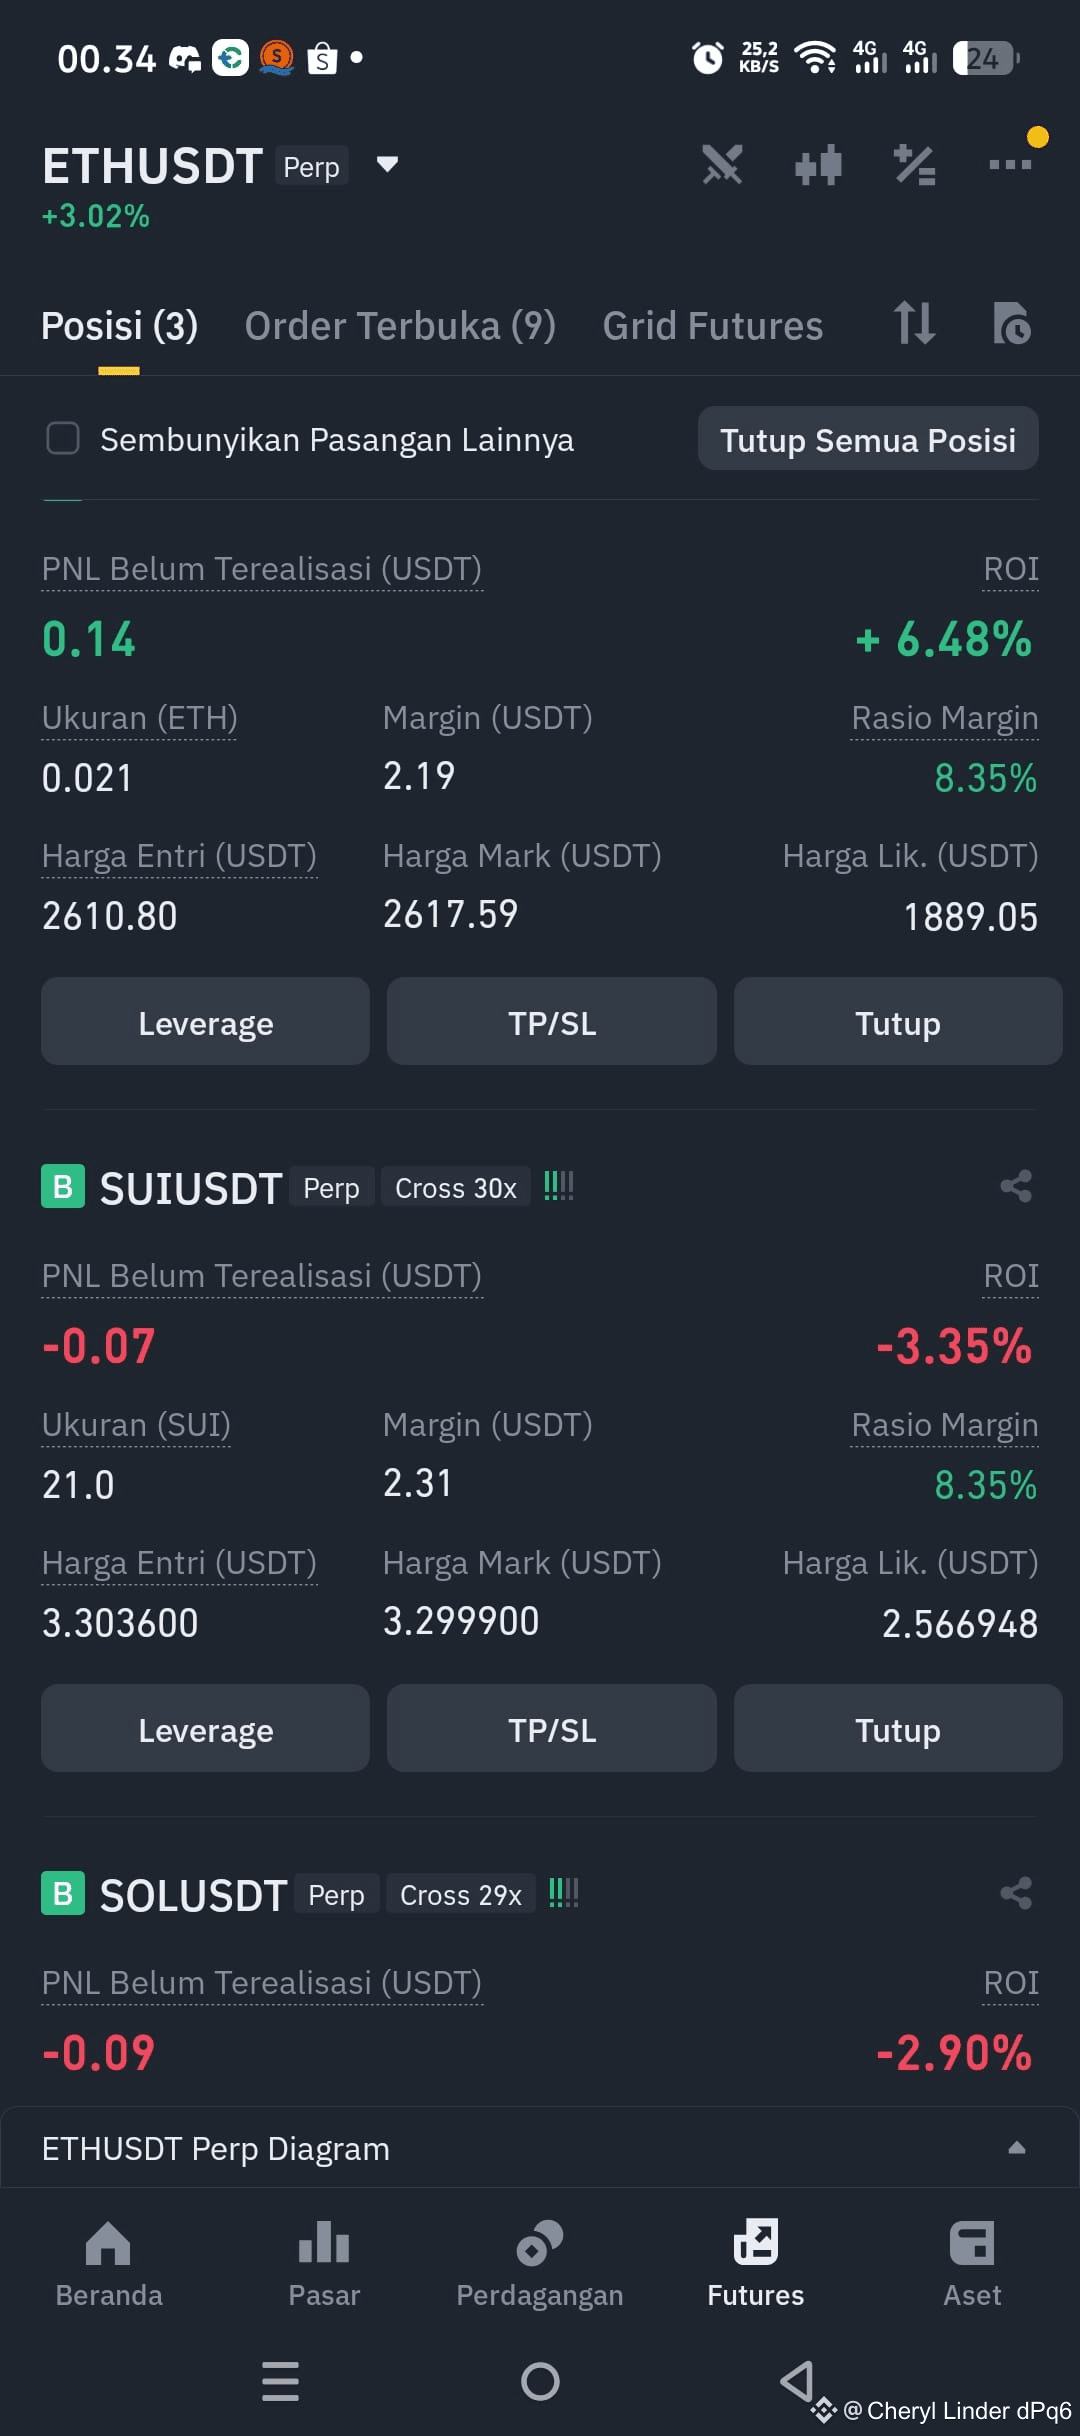
waiting for the US market to open, will it be a bull?
waiting for the US market to open, will it be a bull?
1
1
2.2k
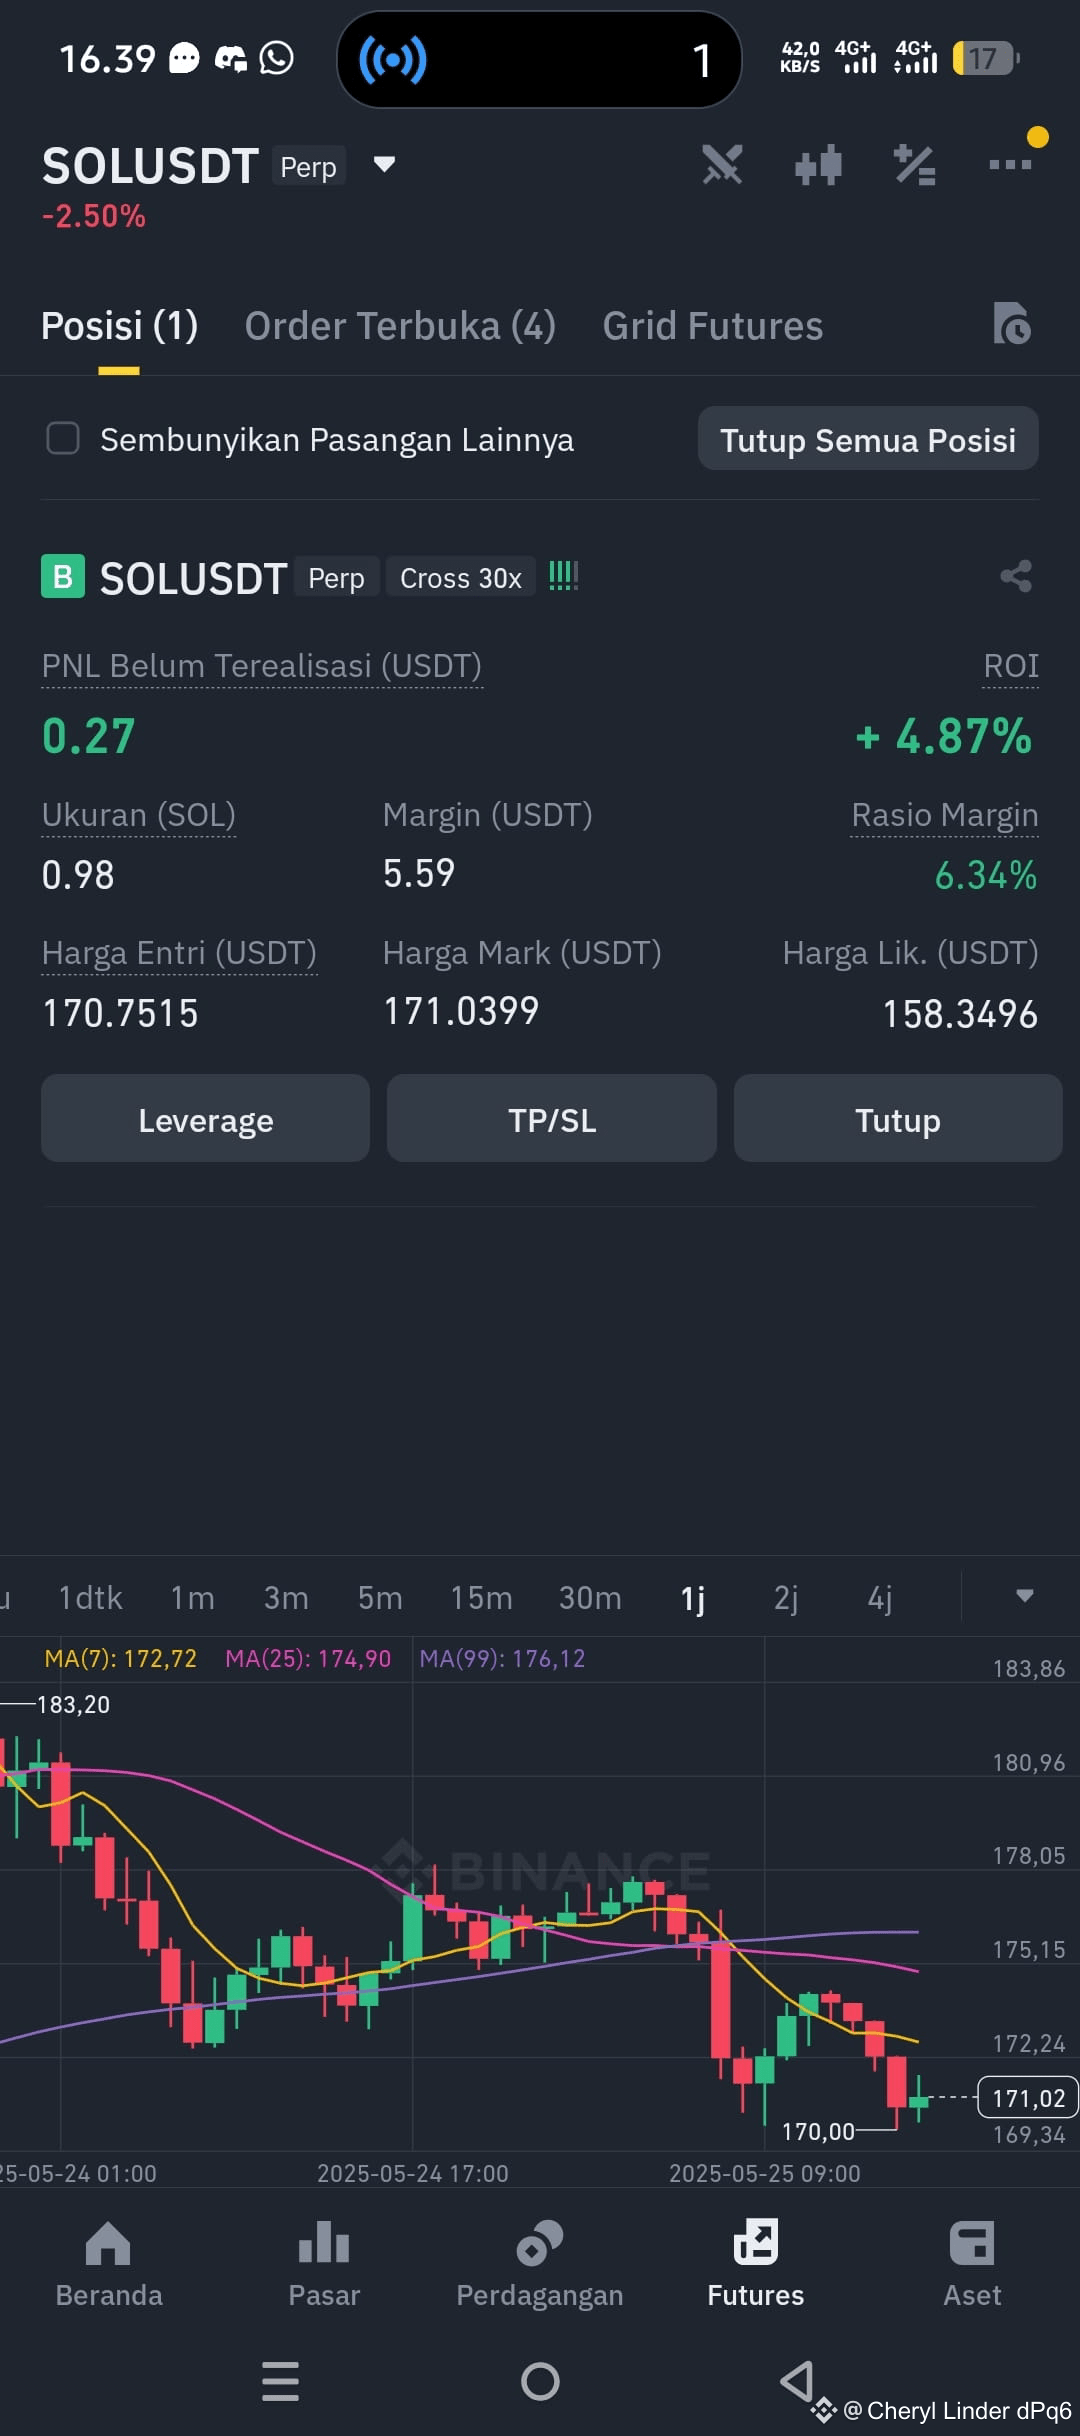
how about Solana, my friend, is this the right step?$SOL
how about Solana, my friend, is this the right step?$SOL
1
2
1.6k
hmm
hmm
Cheryl Linder dPq6
·
--
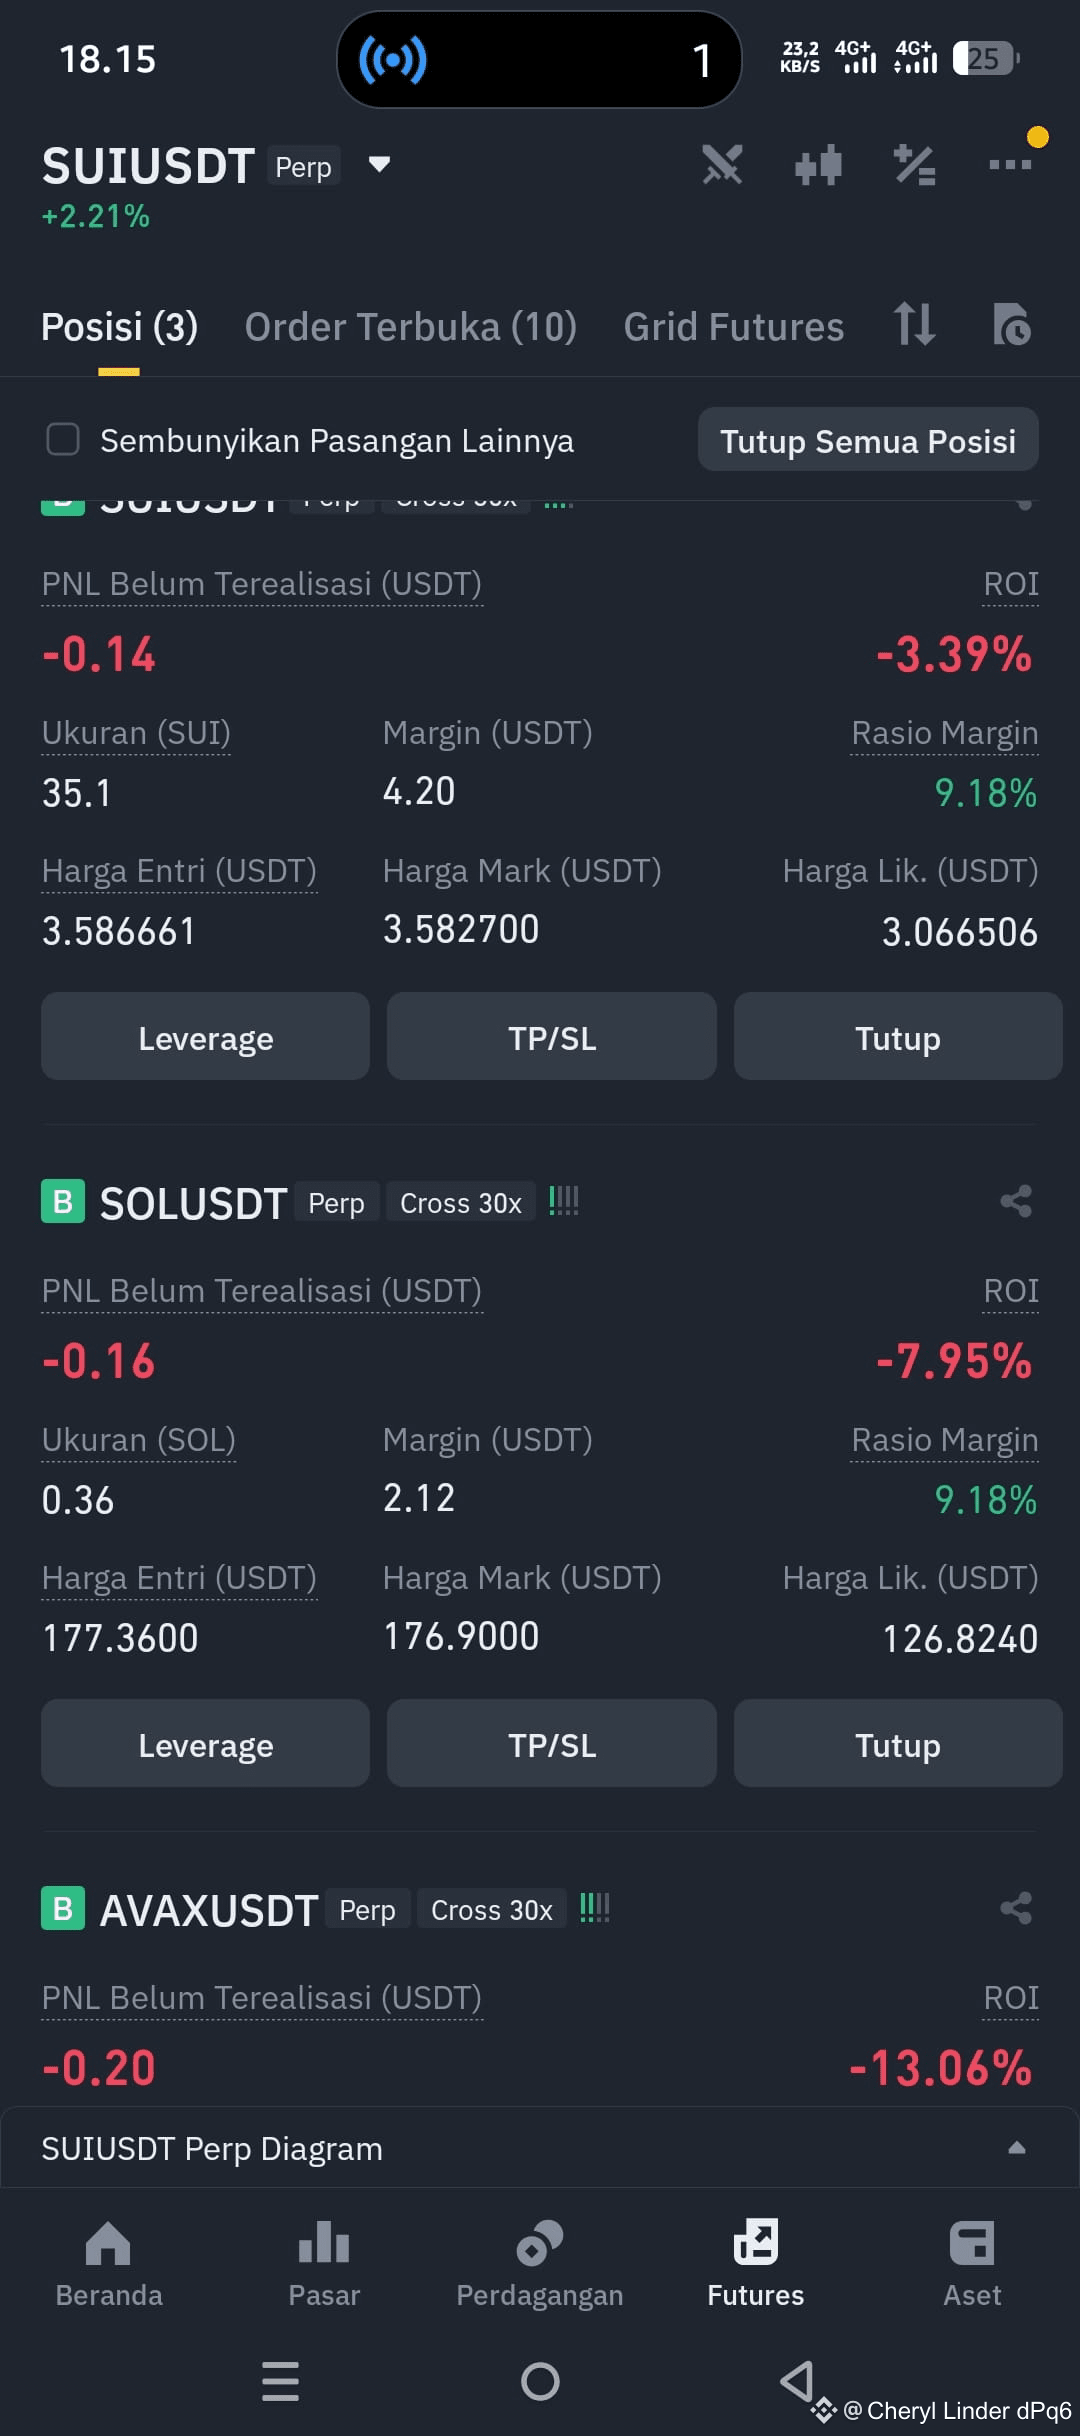
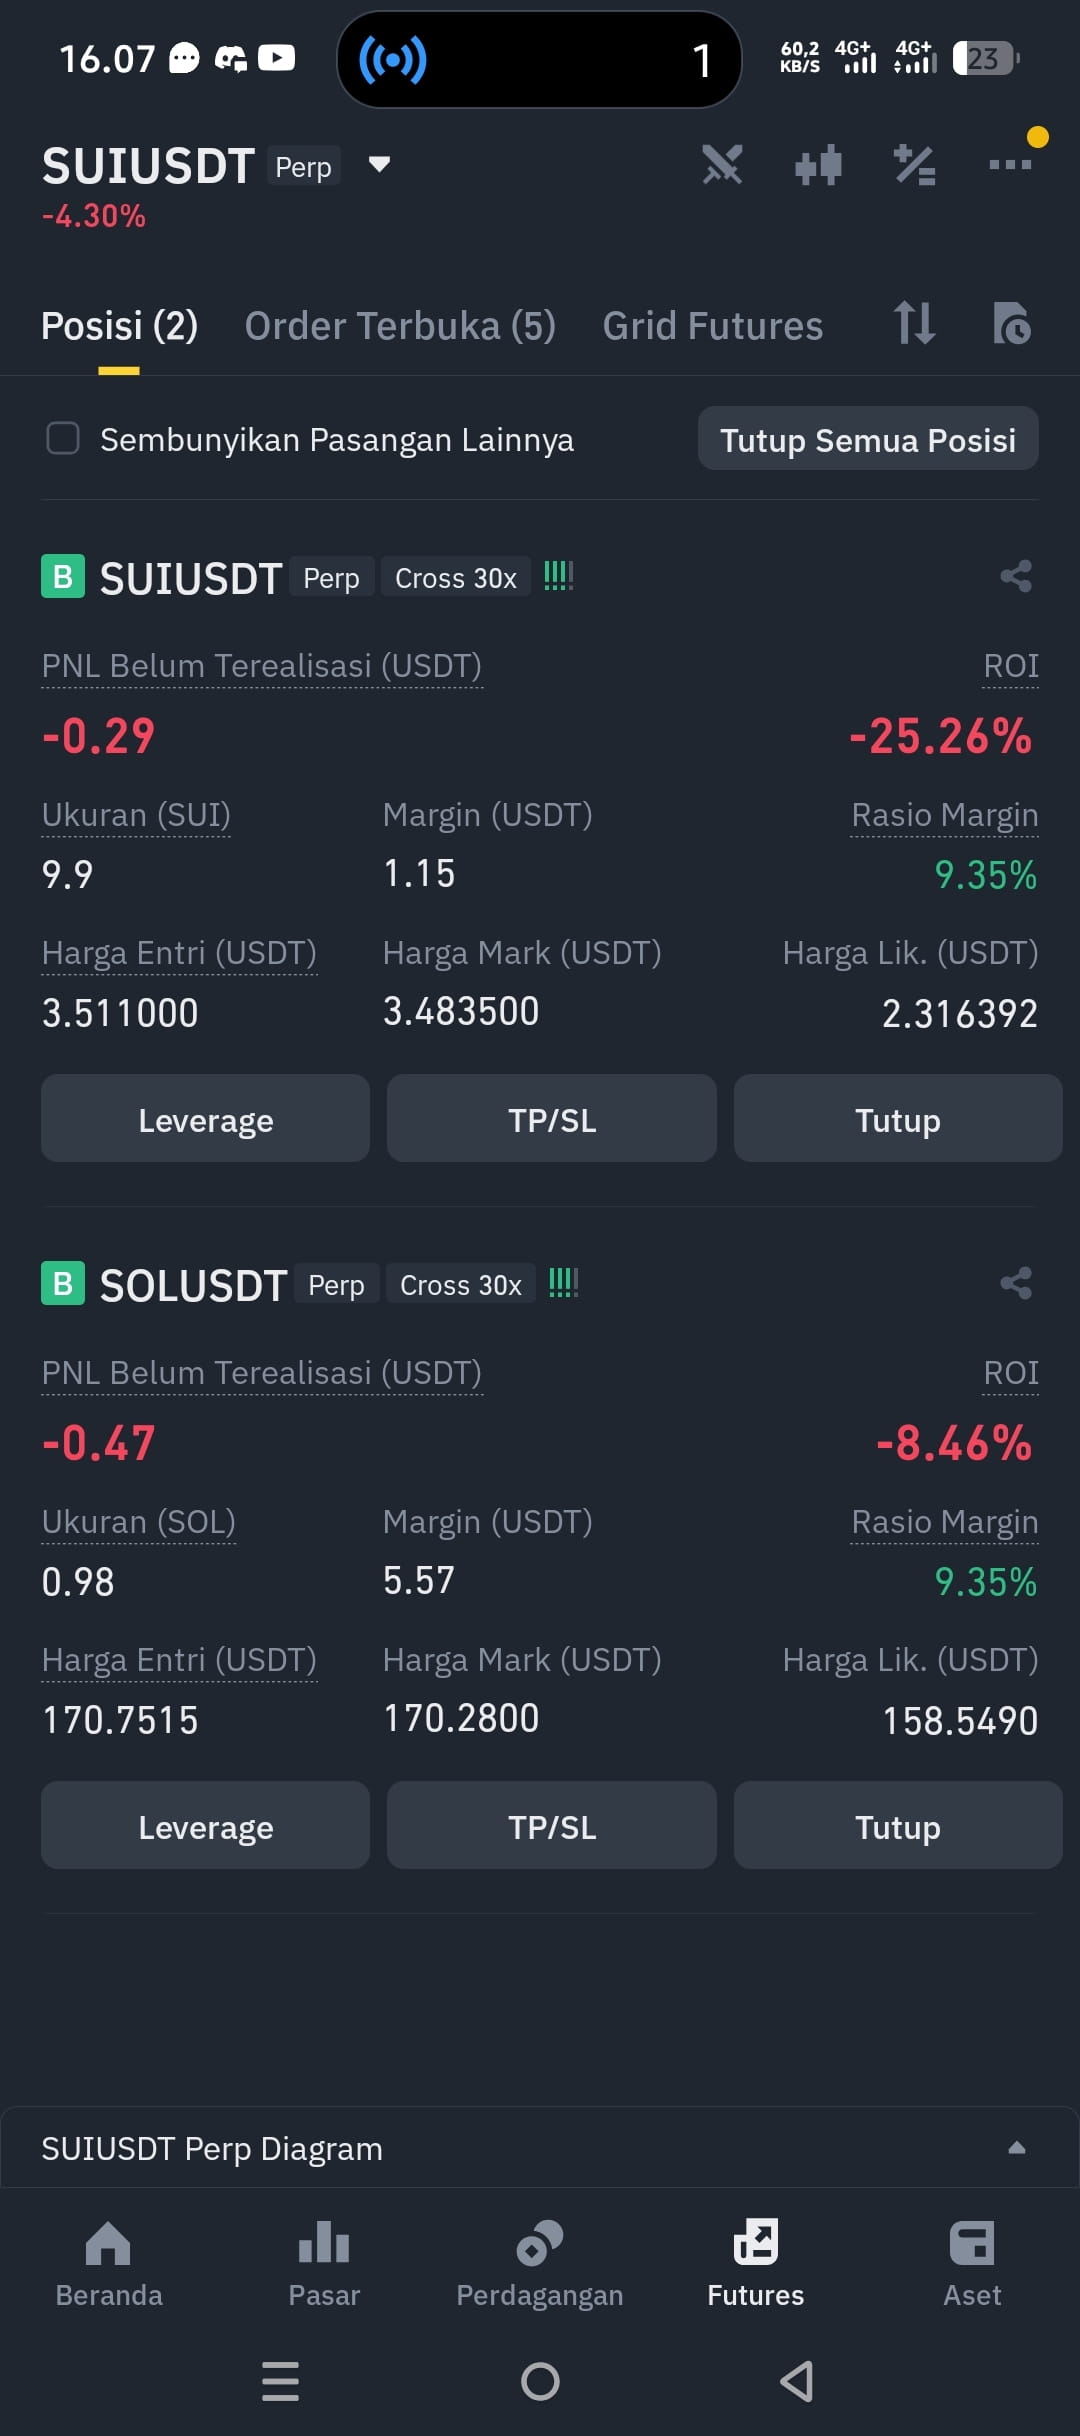
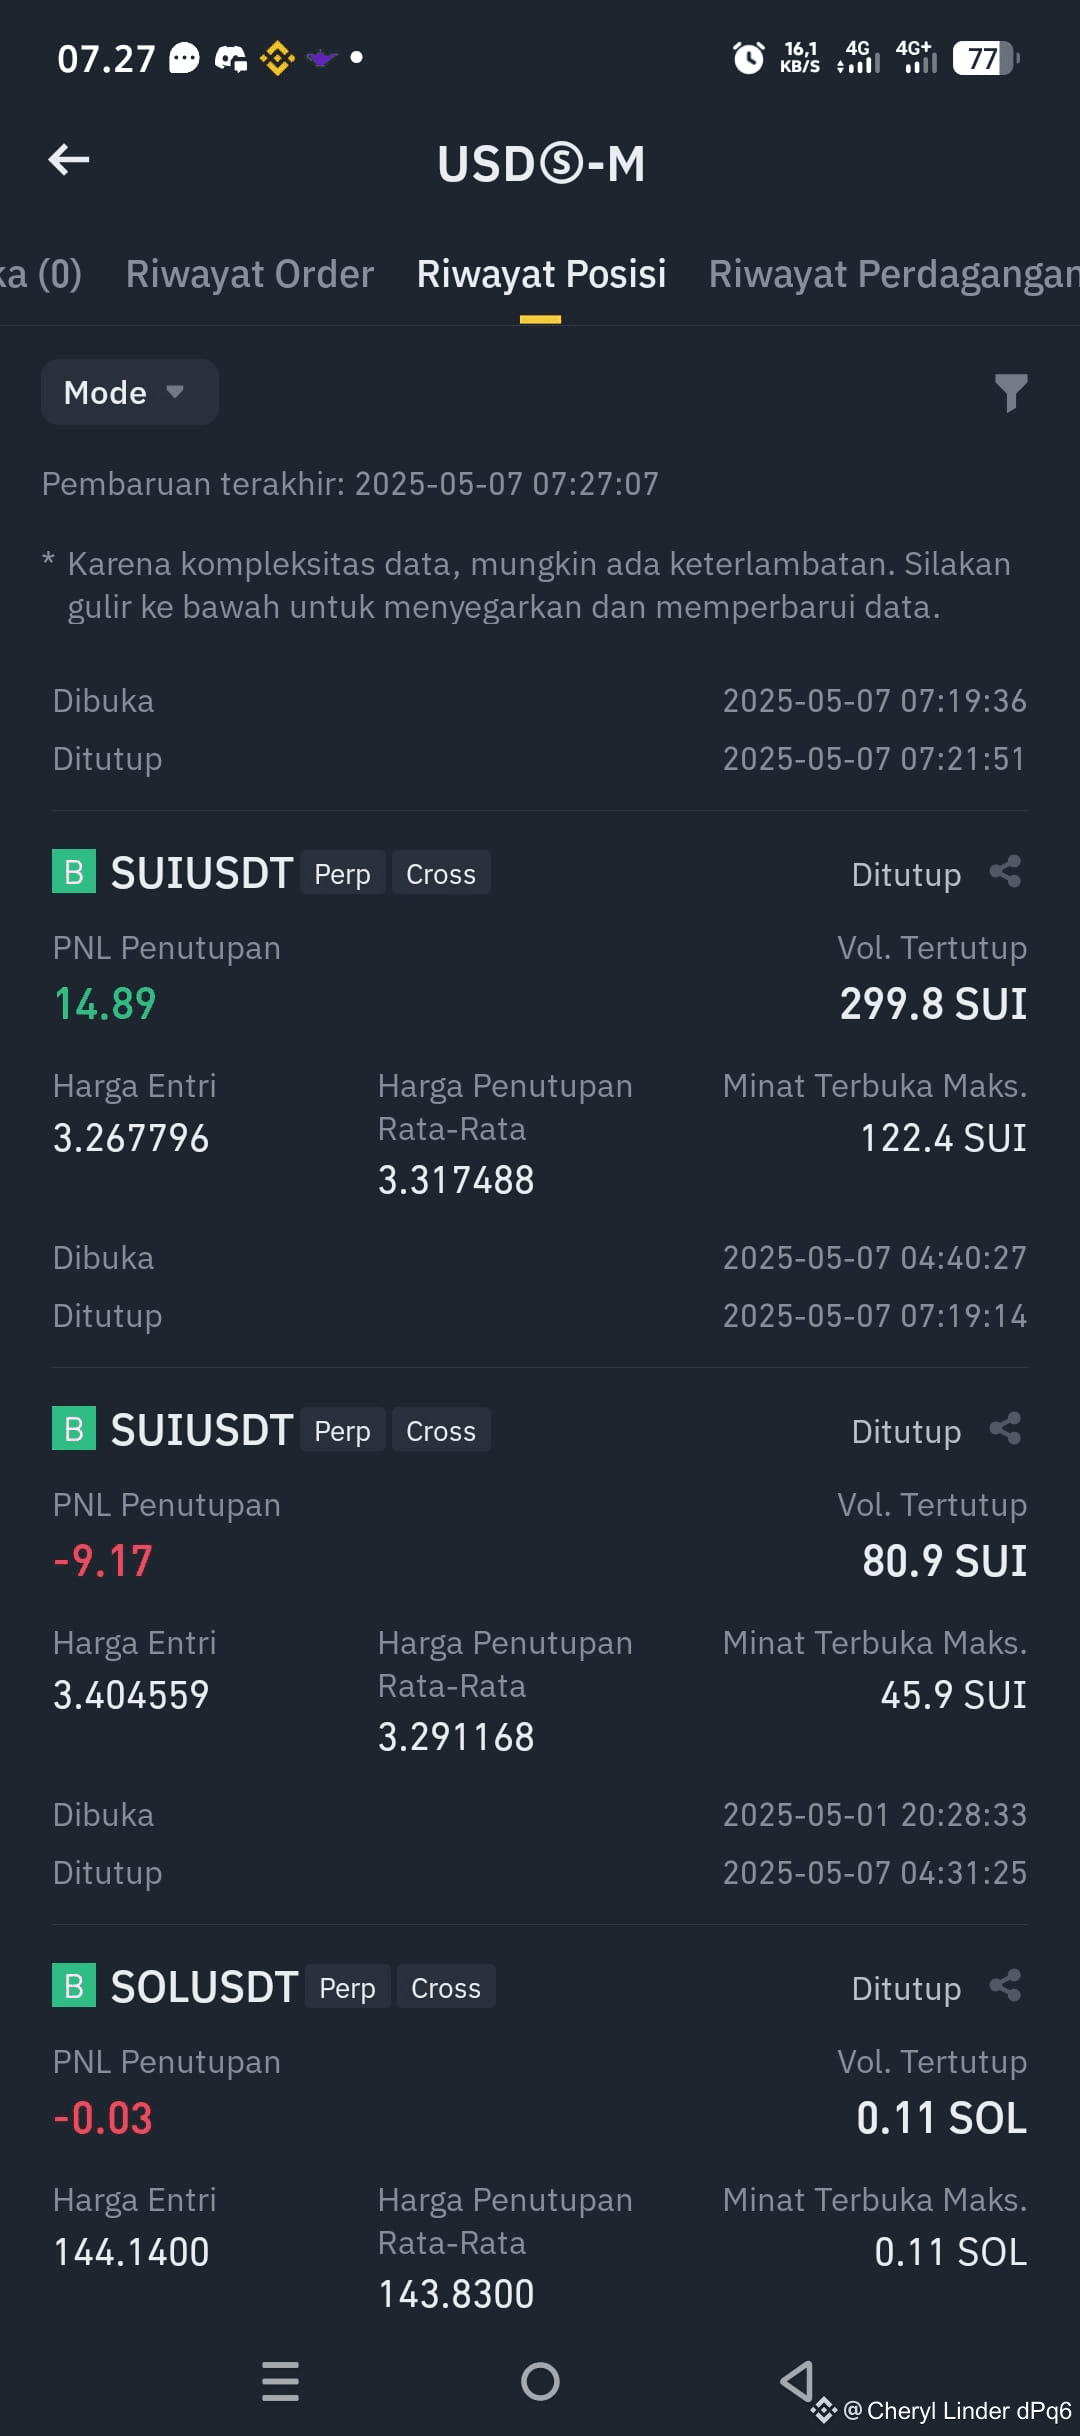
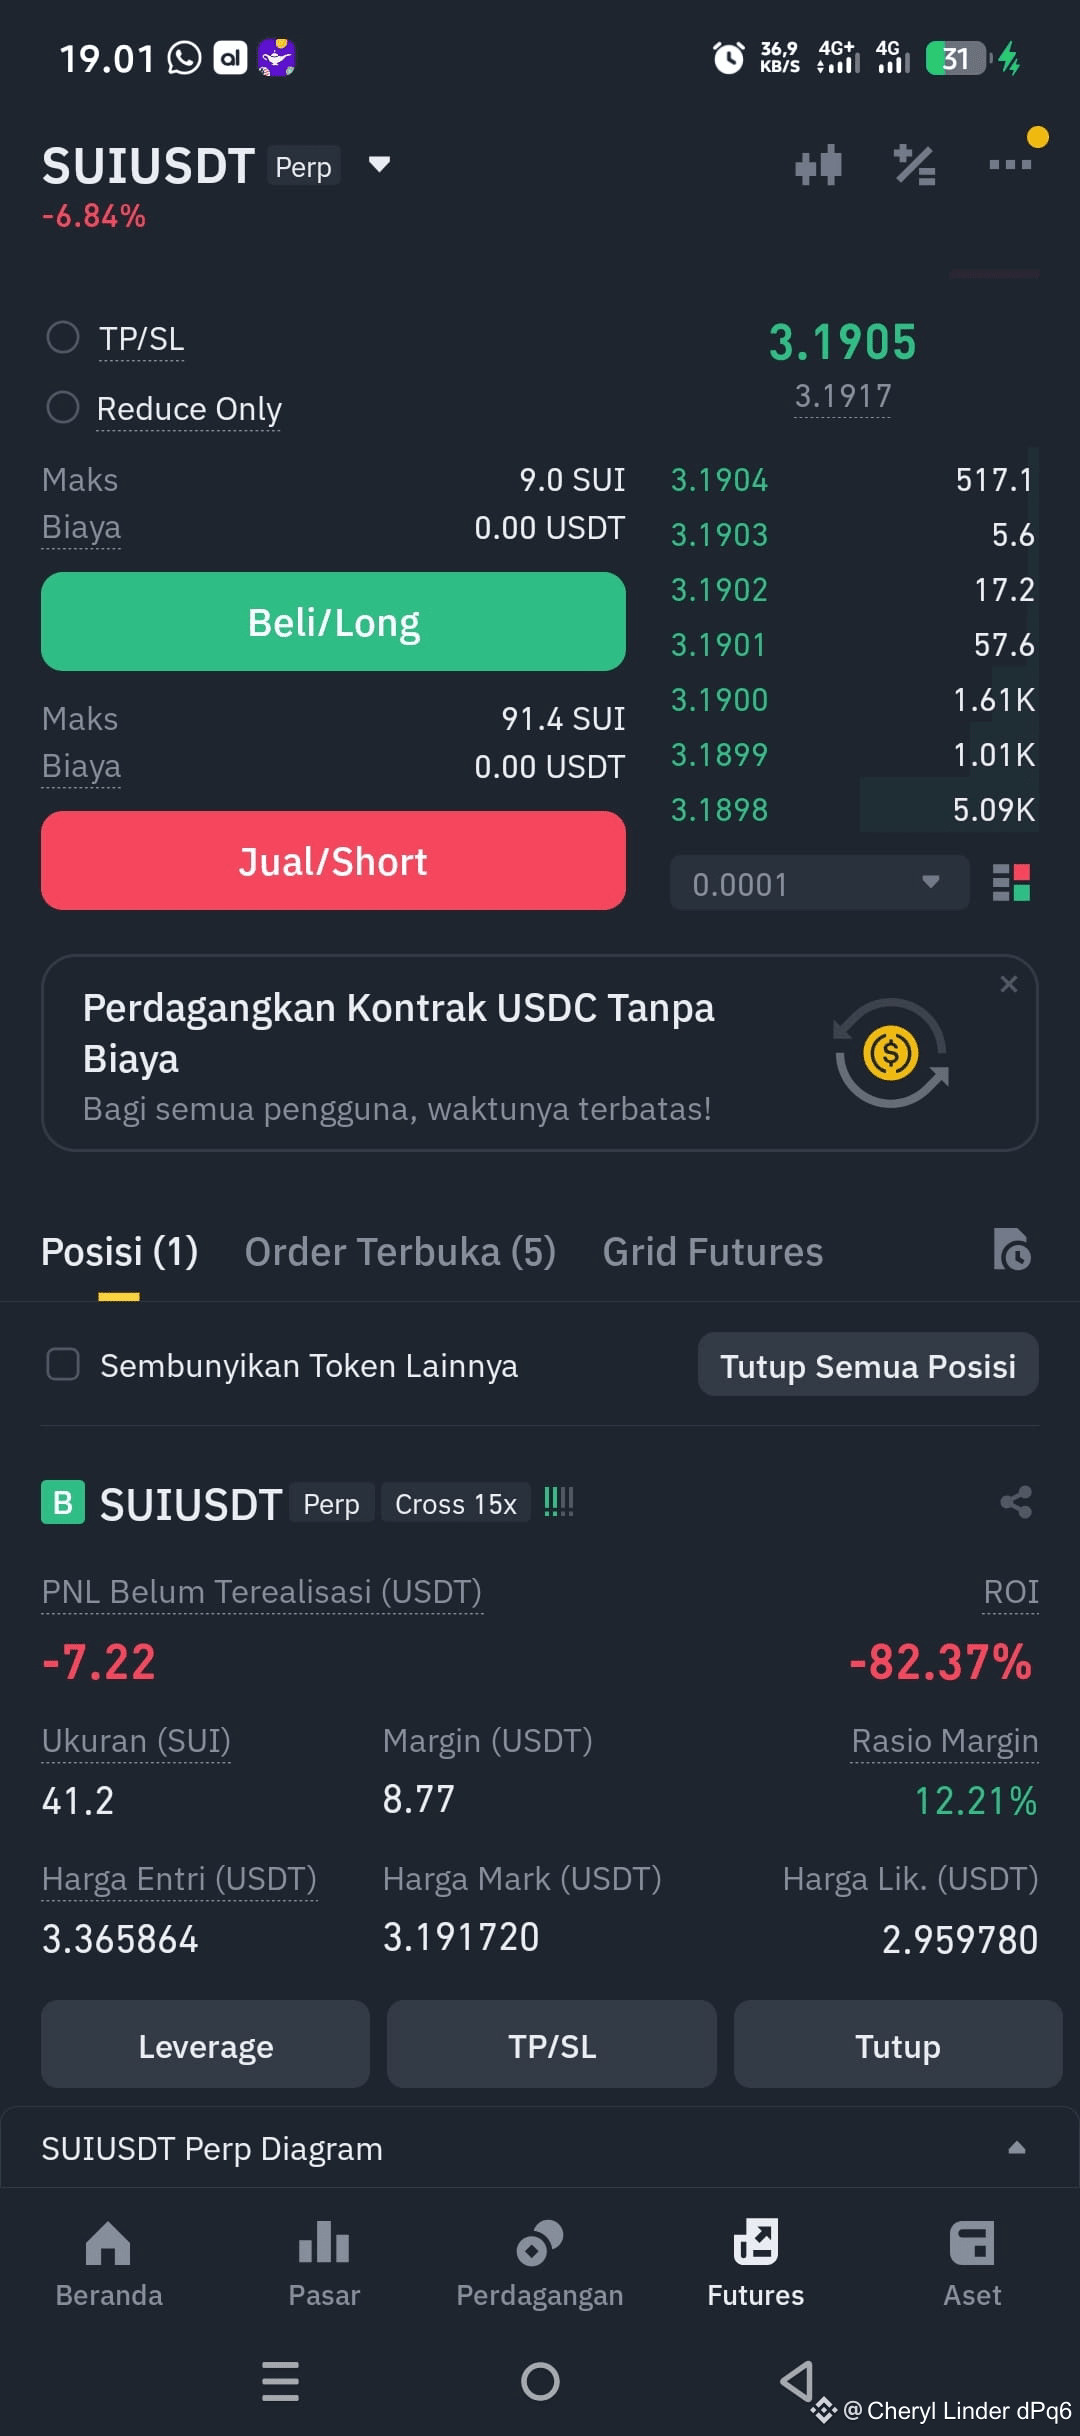
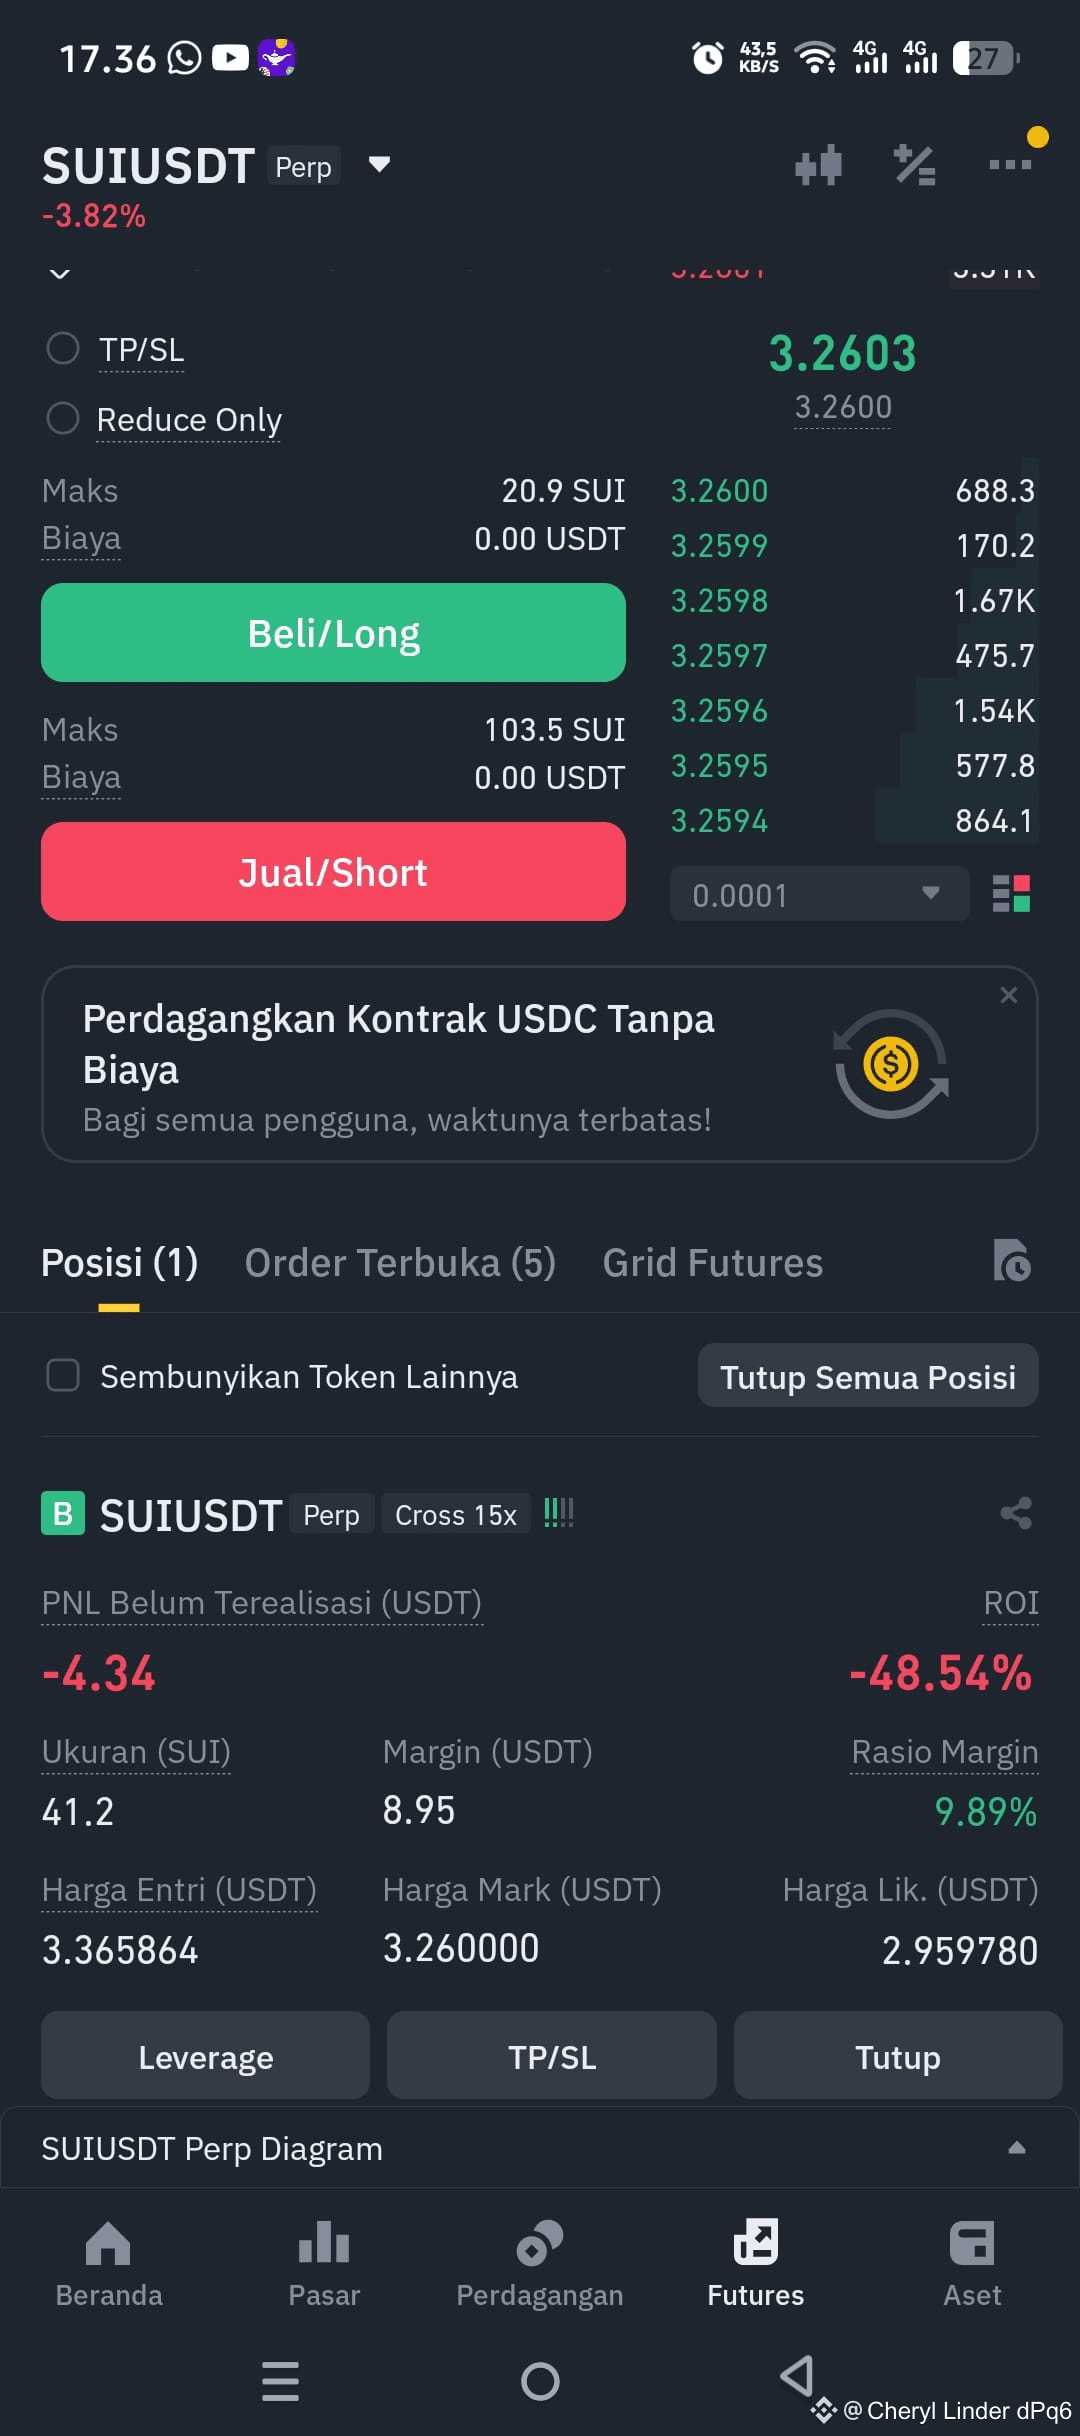
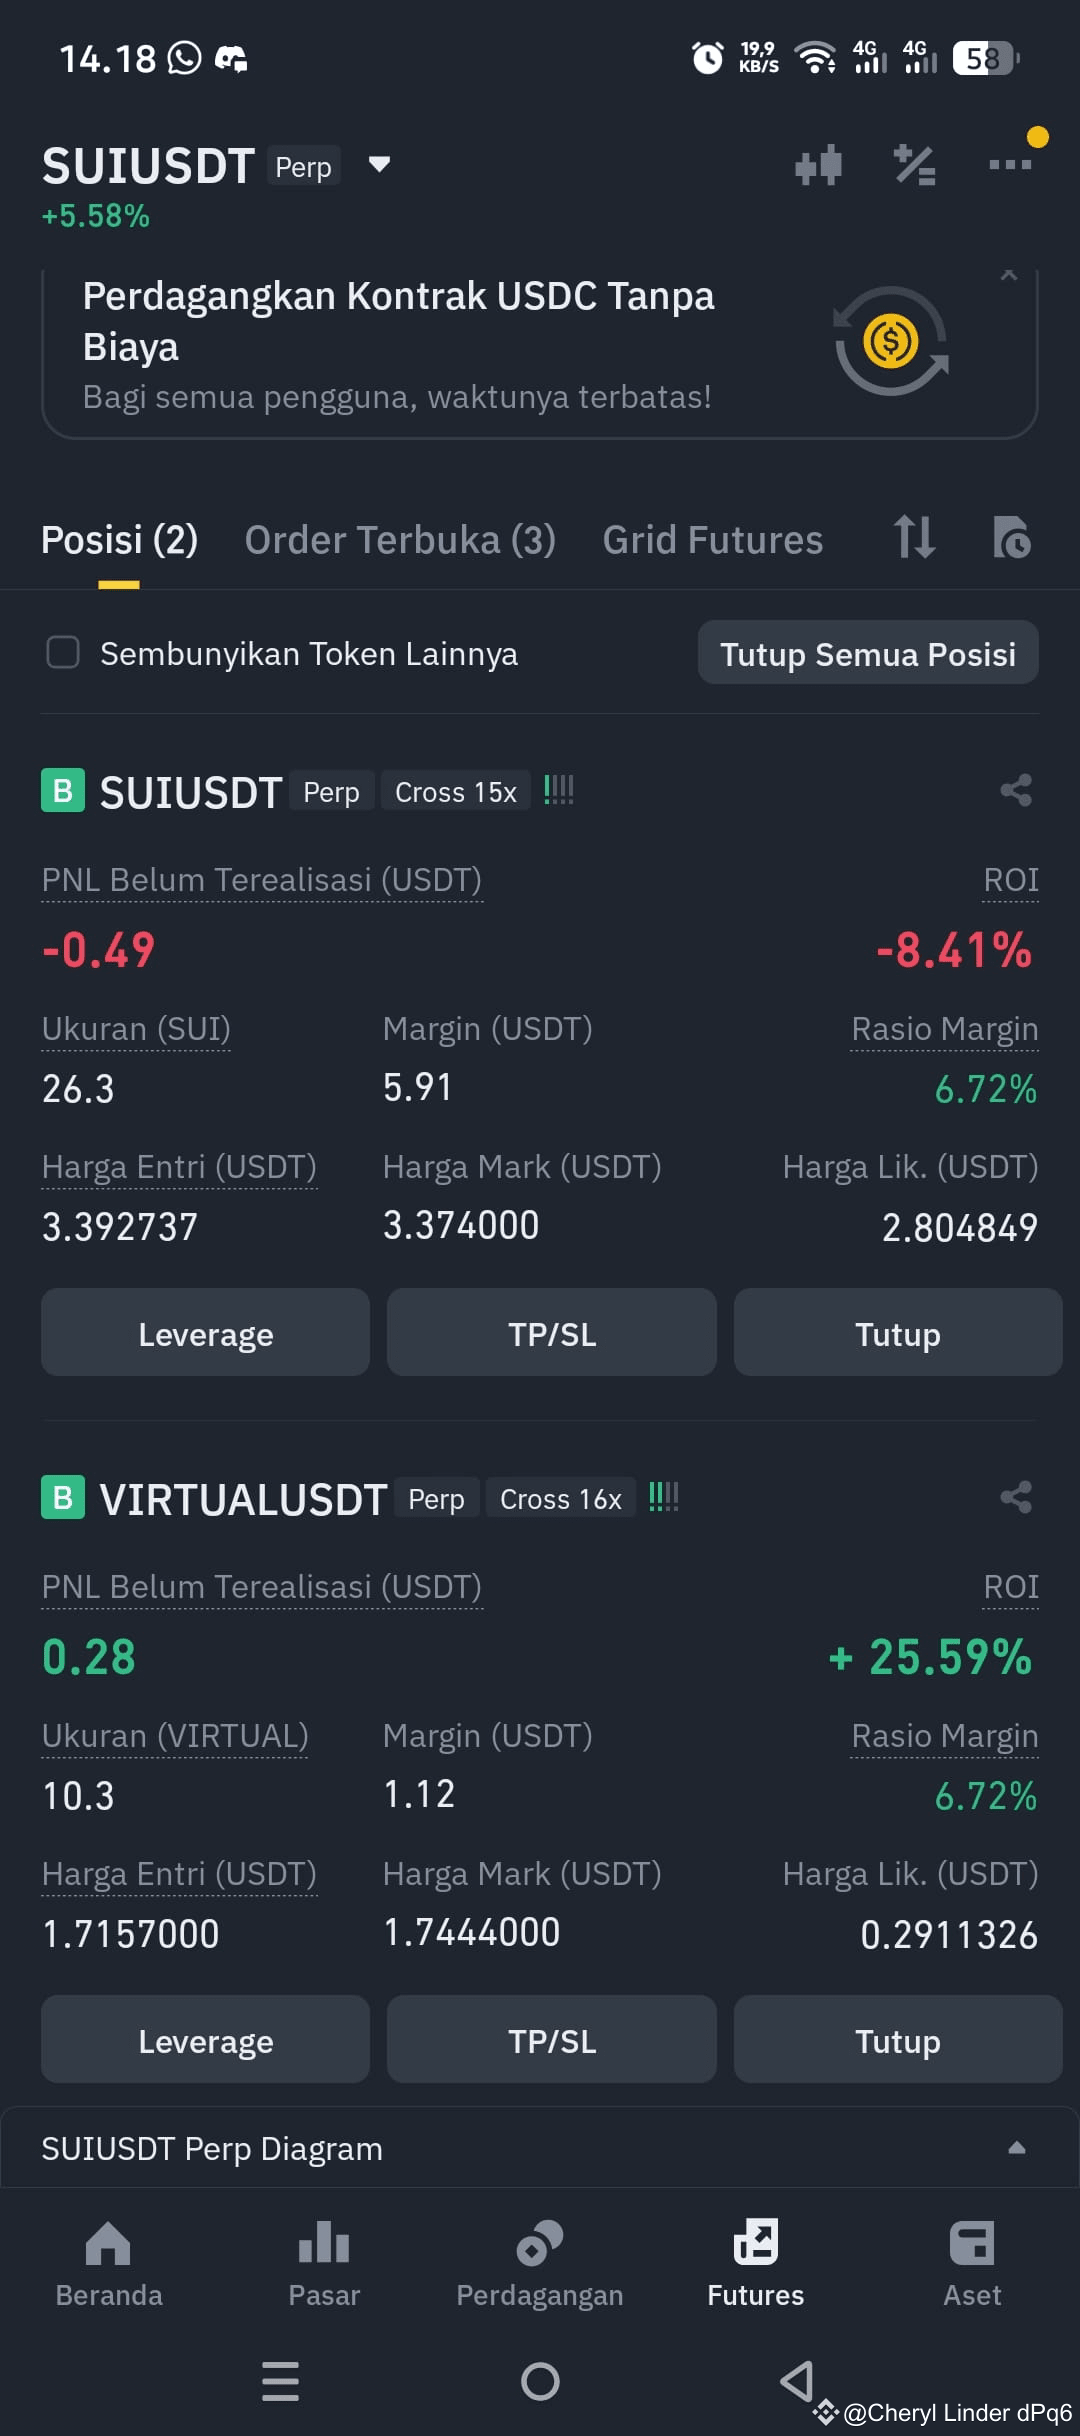
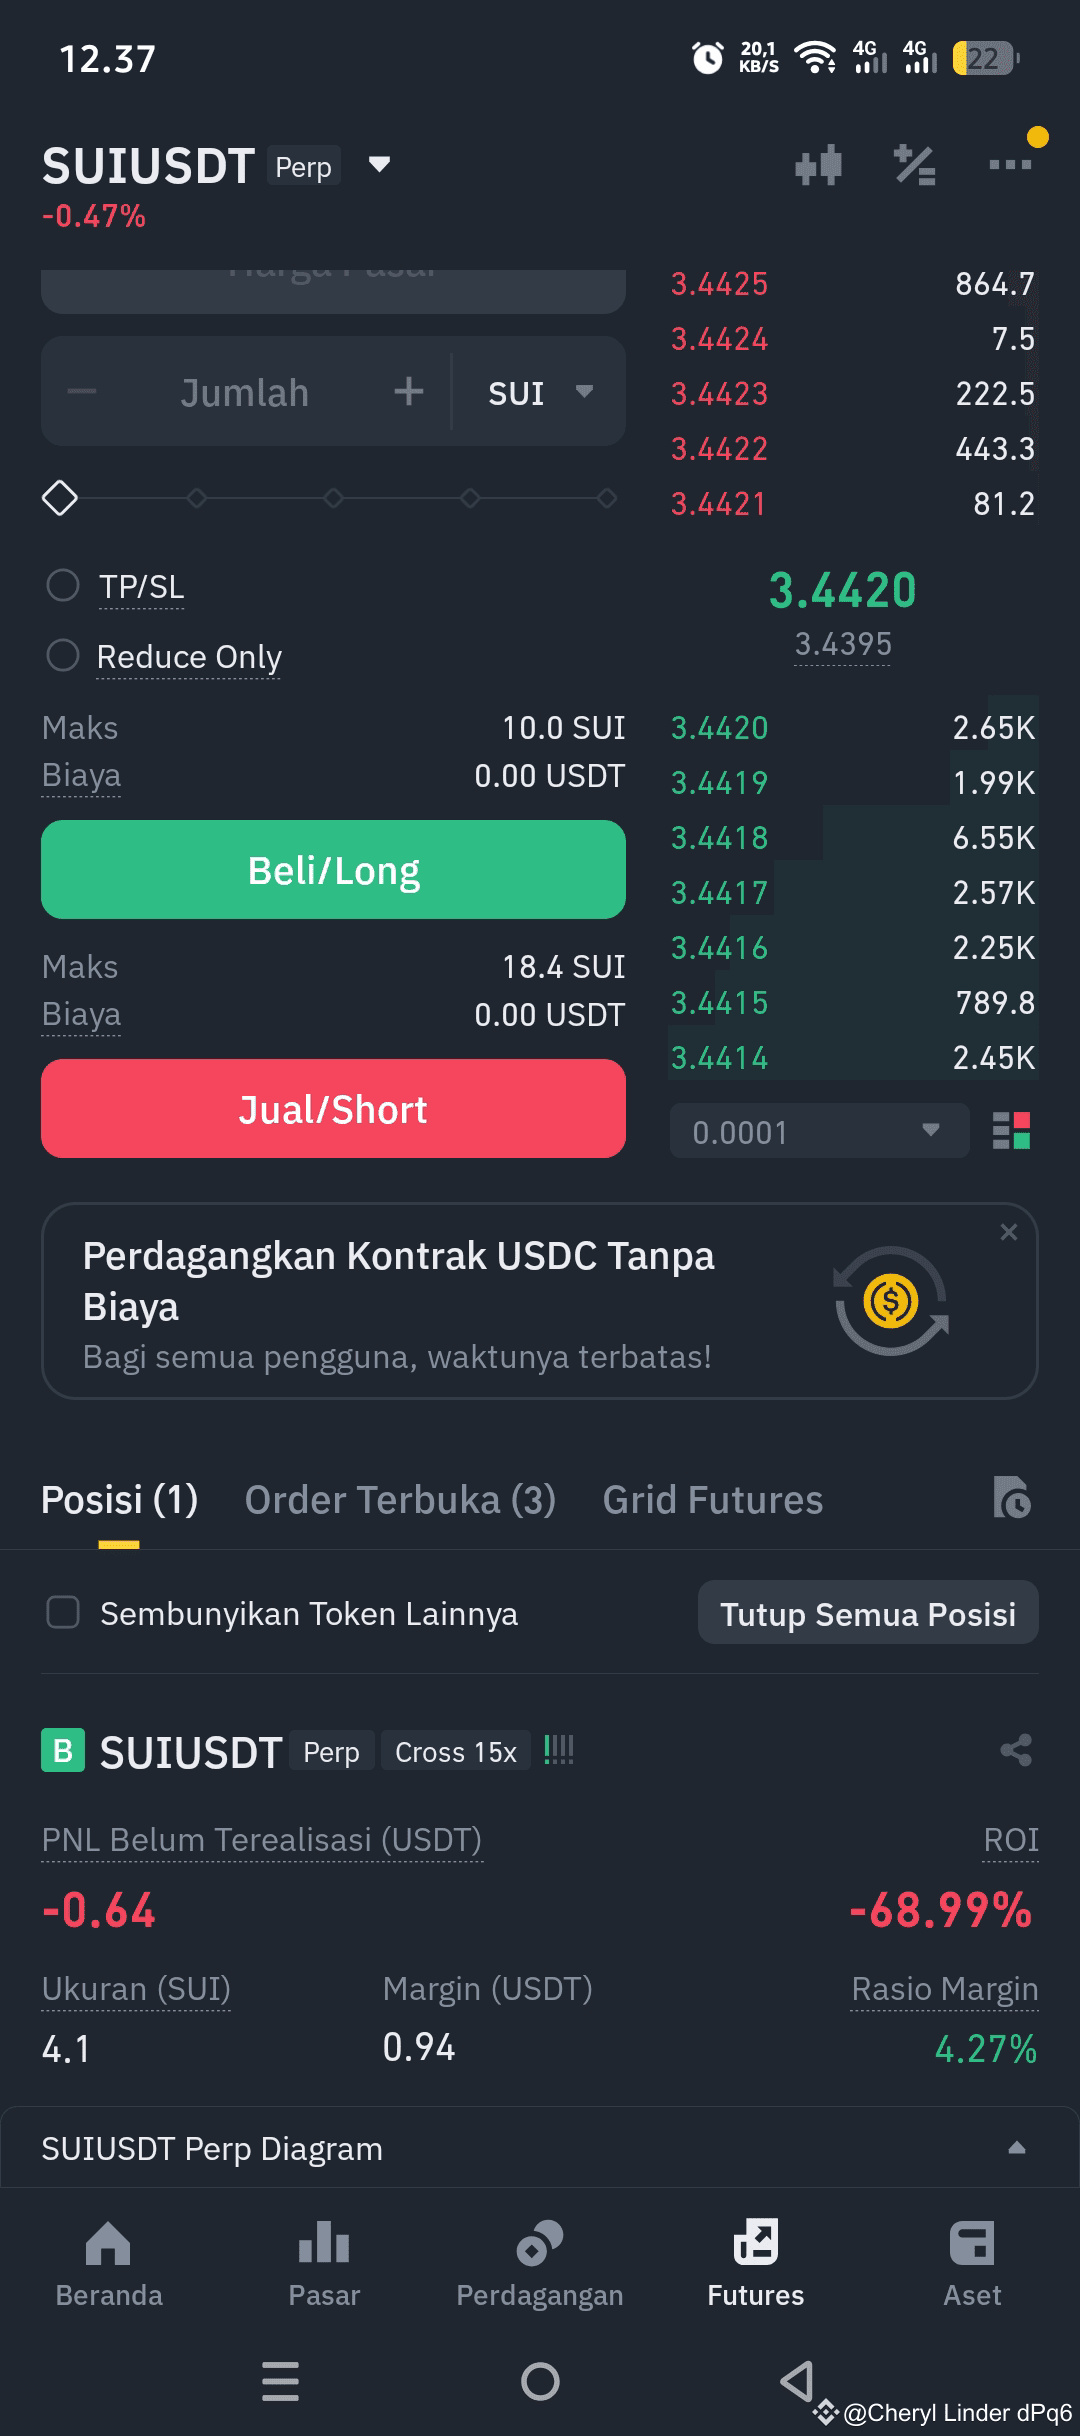
is this a wise step to hold? please provide advice$SUI $SOL
5
is this a wise step to hold? please provide advice$SUI $SOL
is this a wise step to hold? please provide advice$SUI $SOL
3
3
2
689
Timothy ronald
Timothy ronald

HalalCryptoQueen
·
--
Who is known as the “Crypto King”?#BinanceAlphaAlert

155
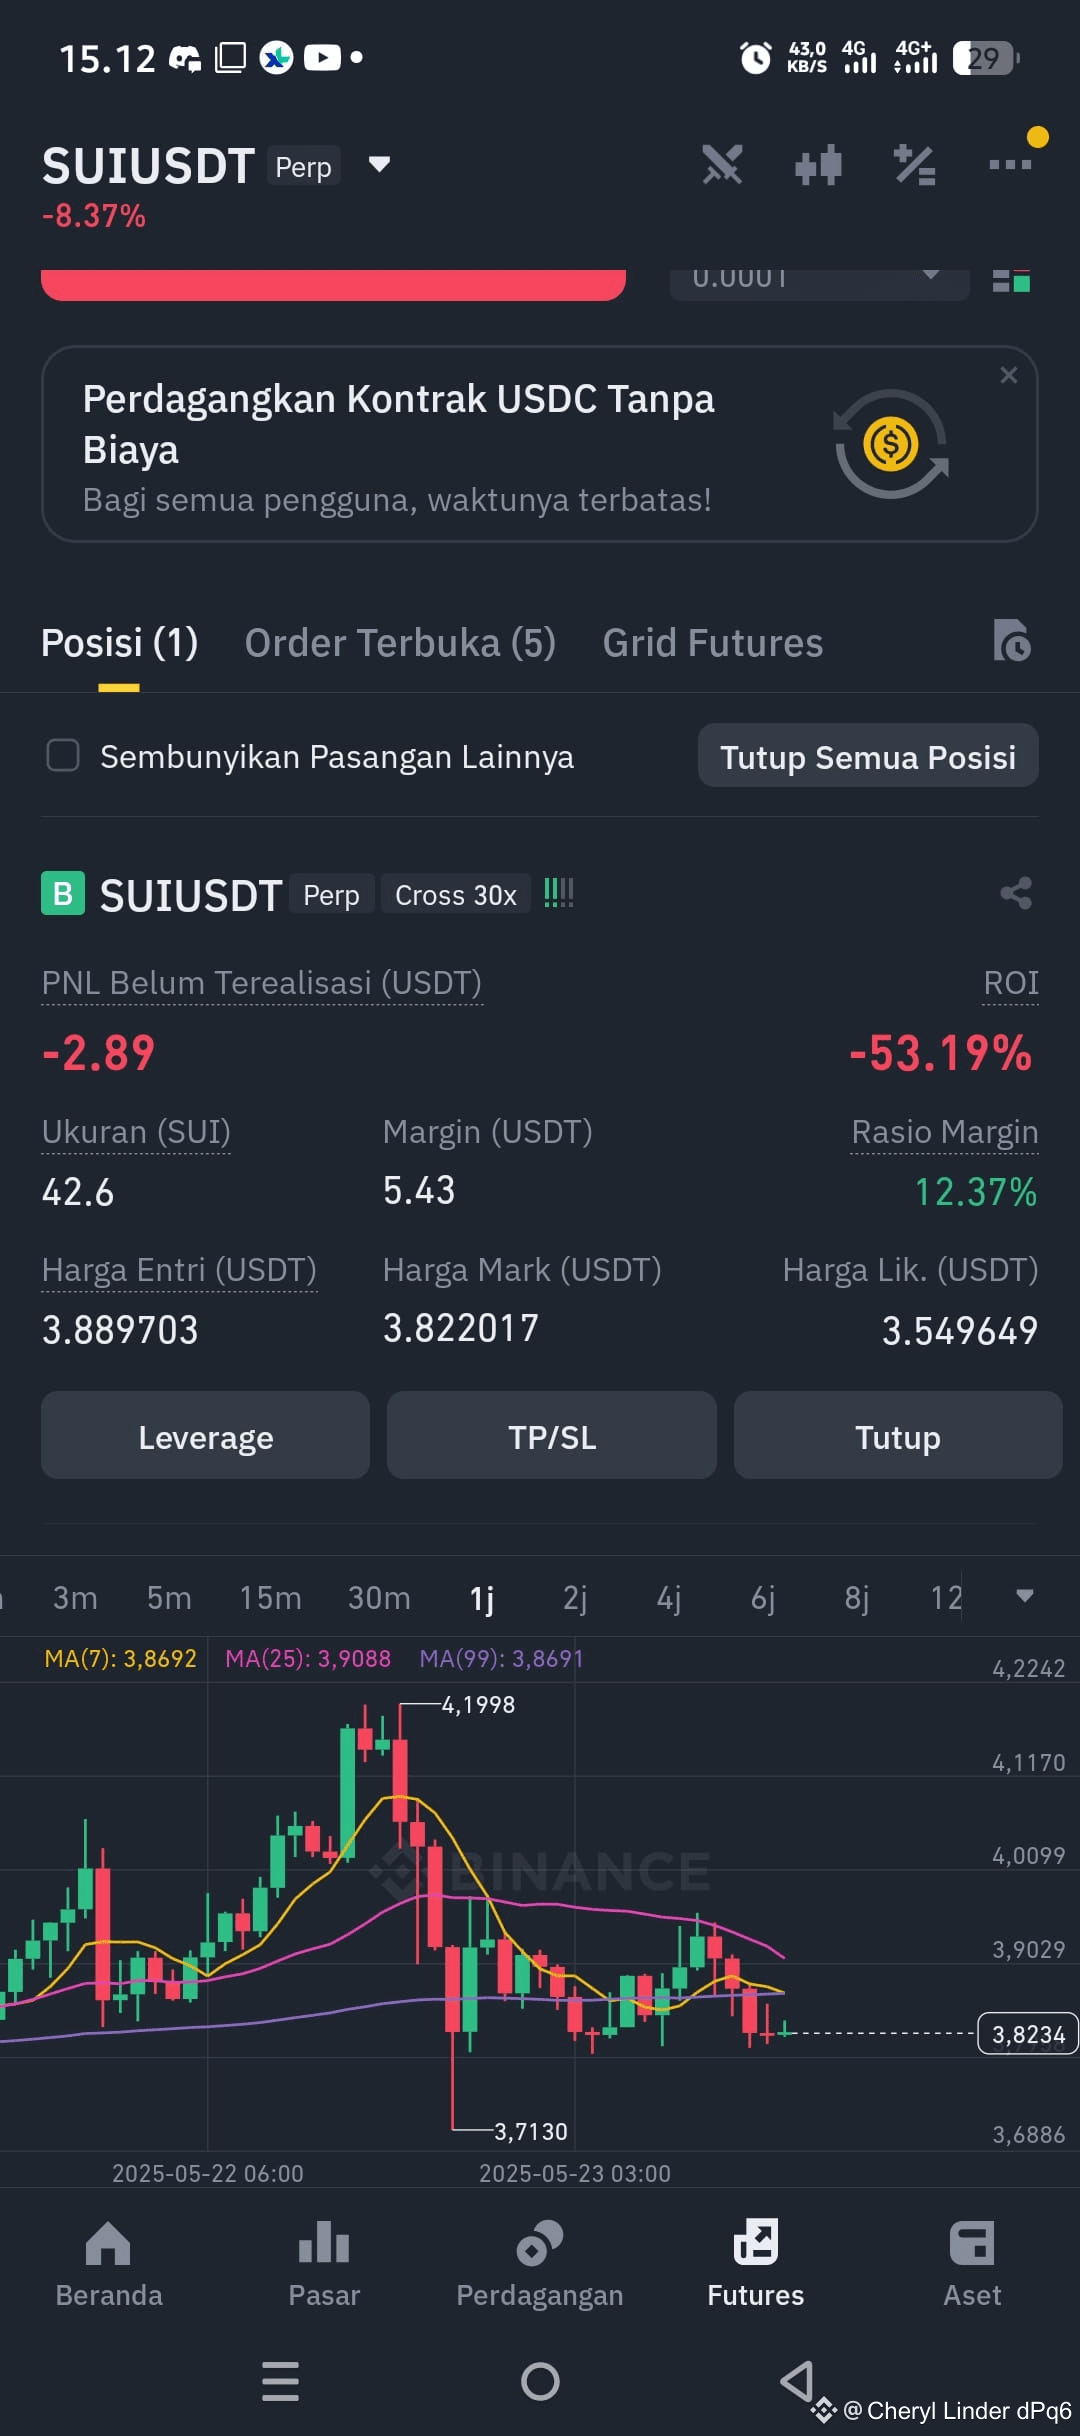
what do you think about the coin sui? should I cut my losses? #BTCBreaksATH110K $SUI
what do you think about the coin sui? should I cut my losses? #BTCBreaksATH110K $SUI
1
1
1
1.6k
how is the impact forecast on the friends market?
how is the impact forecast on the friends market?

Snufferr
·
--
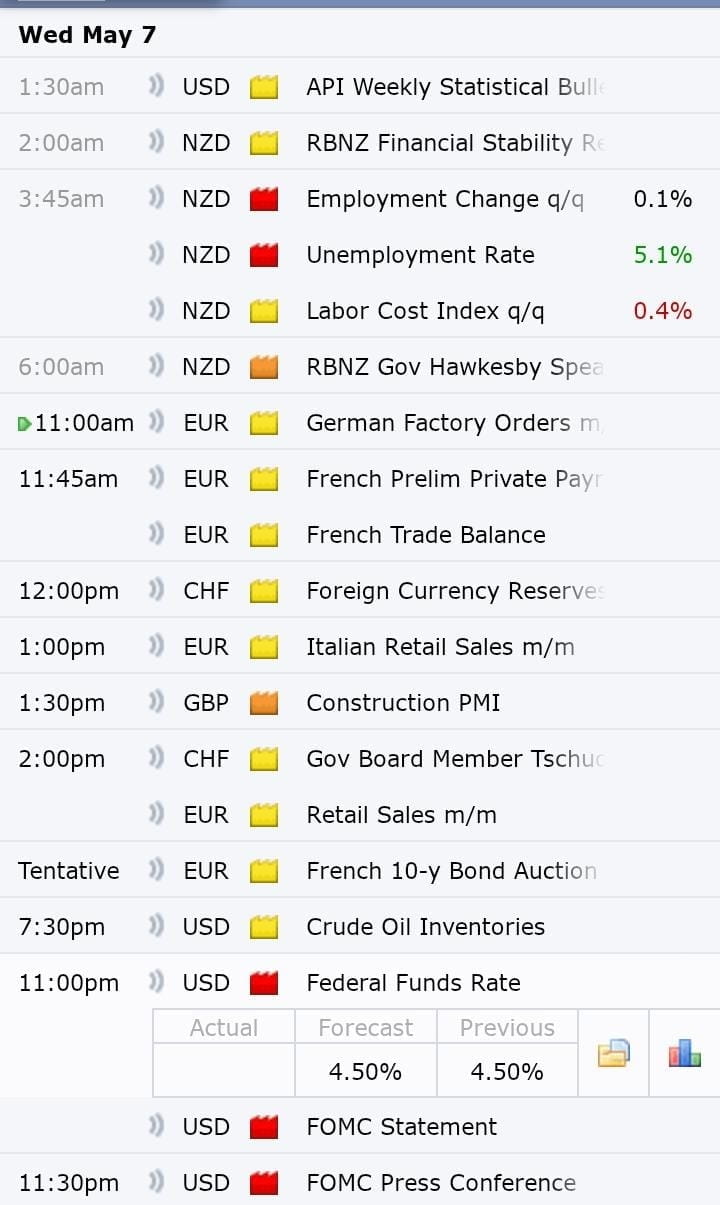
postponed rate cut
216
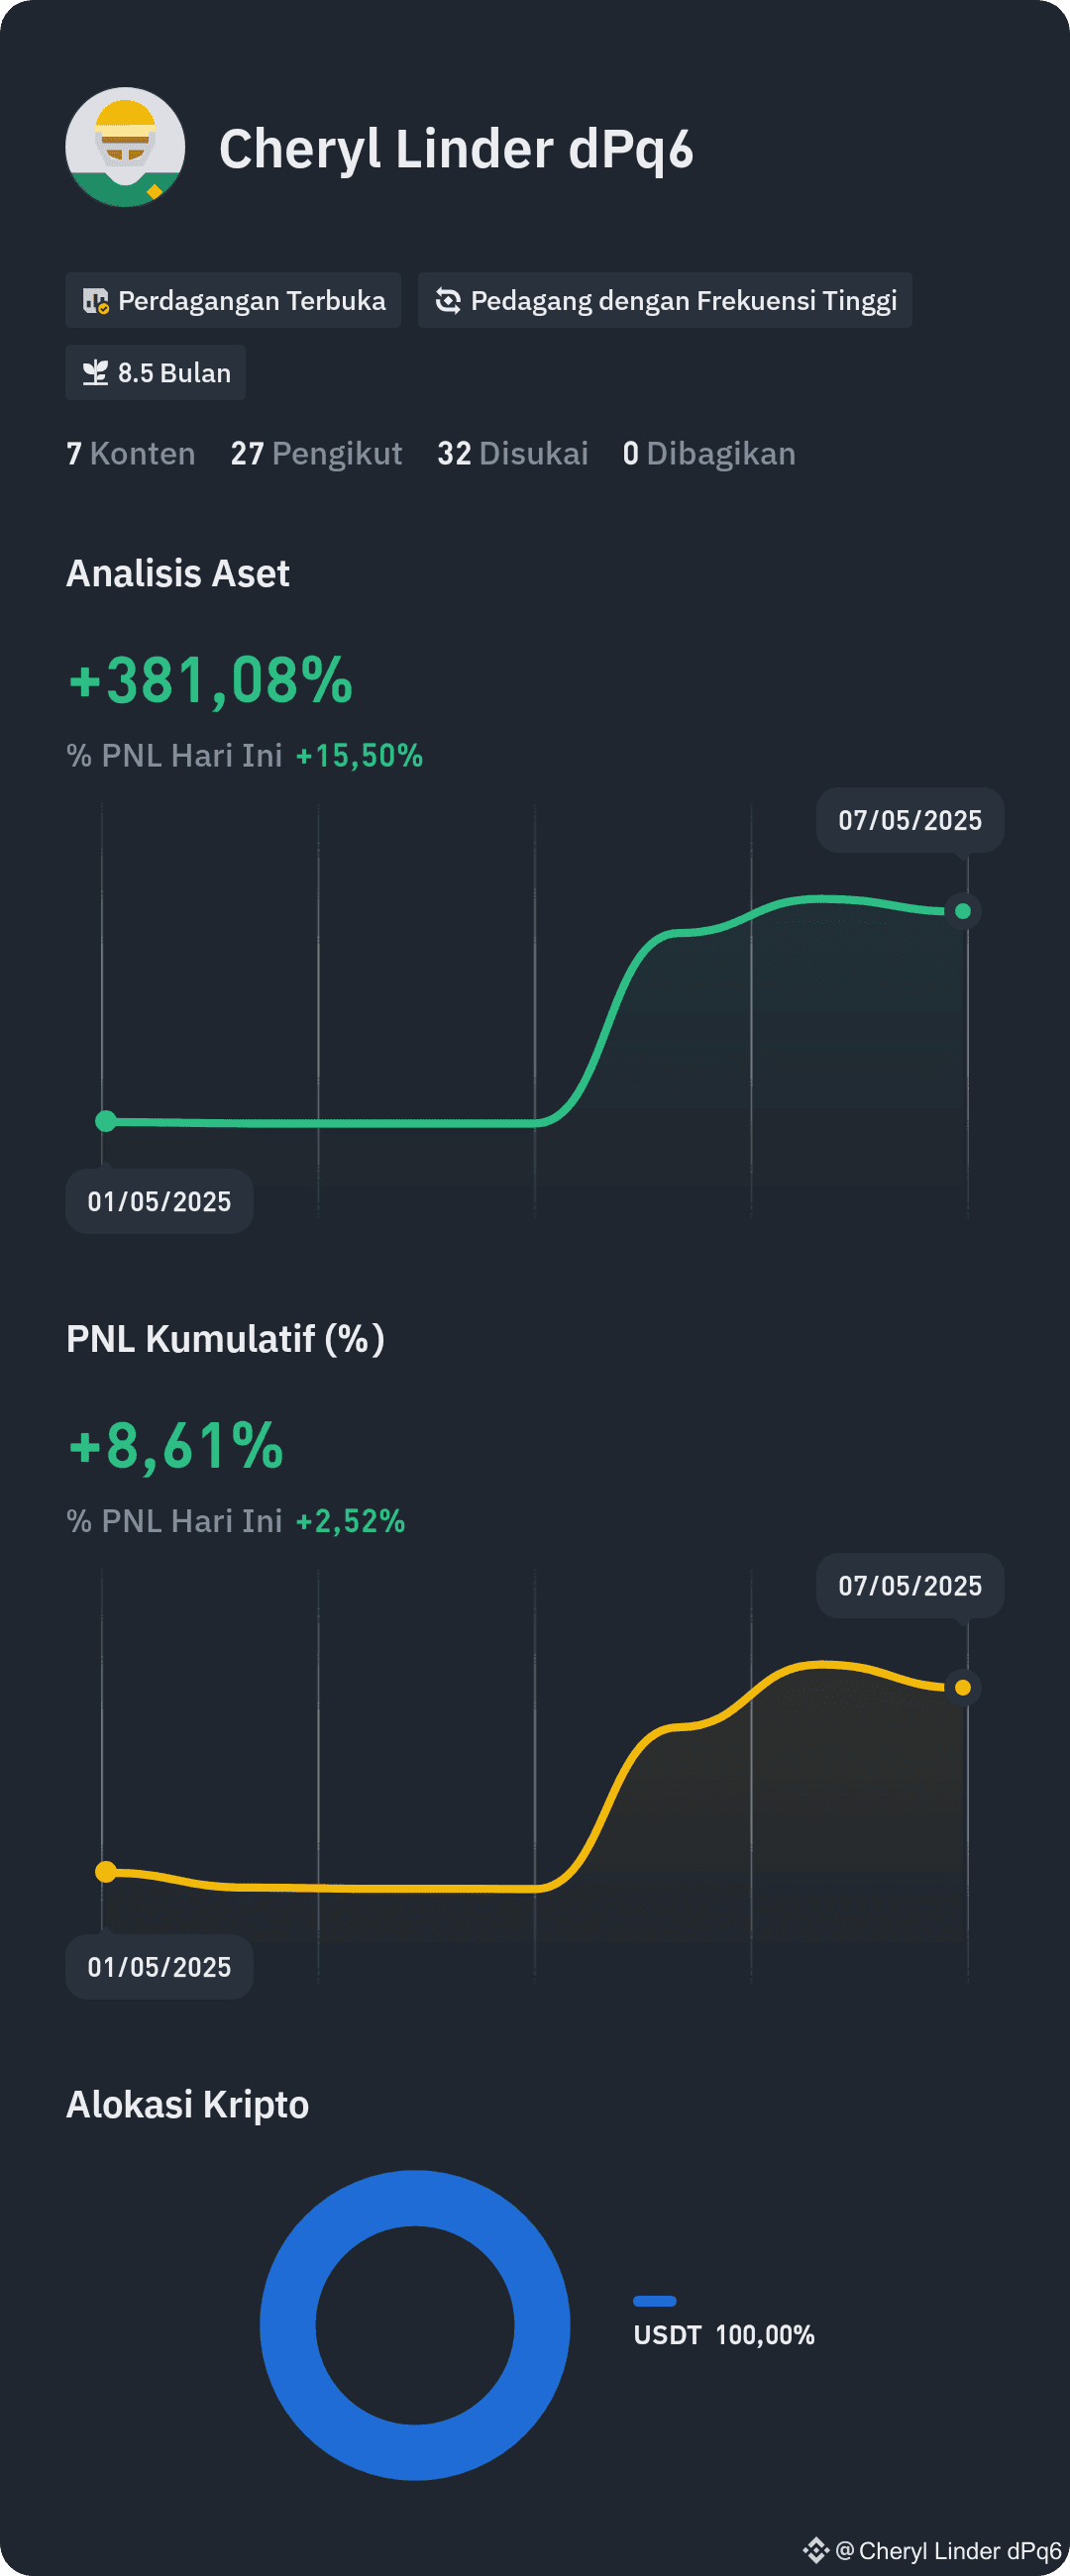
Explore my portfolio. Follow to see how I invest!
There are still many mistakes and failures, but don't give up yet, let's gooooo
$BTC #trump $TRUMP
Explore my portfolio. Follow to see how I invest!
There are still many mistakes and failures, but don't give up yet, let's gooooo
$BTC #trump $TRUMP
There are still many mistakes and failures, but don't give up yet, let's gooooo
$BTC #trump $TRUMP
1
386
Here are the signs you need to watch out for to assess whether this SUI momentum will continue bullish or reverse bearish:
---
Bullish Signs (Positive):
1. Price stays above MA(99) (currently around 3.27)
→ A strong sign that the uptrend structure is still maintained.
2. Breakout resistance at 3.45 with high volume
→ This will confirm the continuation of the uptrend, potential towards 3.58–3.87.
3. Positive MACD widening (DIF rising away from DEA)
→ Indicates that buying momentum continues to increase.
4. RSI rises above 60 and stabilizes there
→ Shows that buying strength is still dominant, not overbought.
---
Bearish Signs (Negative):
1. Price drops back and closes below MA(99) 4H (below 3.27)
→ This signals a failure of recovery and potential further decline.
2. Strong rejection from 3.45–3.50 with a long upper wick candle (shooting star)
→ Indicates high selling pressure from the resistance area.
3. RSI fails to rise above 60 and instead drops below 40
→ Potential loss of buyer strength.
4. MACD starts to crossover downwards again (DIF drops cutting DEA)
→ Early signal of bearish reversal.
---
Strategic Conclusion
As long as the price stays above MA(99) and there is no sharp rejection from 3.45, you can remain holding.
If a bearish engulfing or high selling volume appears when the price drops below 3.27, consider exiting temporarily.
Do you want me to help create a visual scenario of breakout and breakdown on the chart as well?
#BTCPrediction
Here are the signs you need to watch out for to assess whether this SUI momentum will continue bullish or reverse bearish:
---
Bullish Signs (Positive):
1. Price stays above MA(99) (currently around 3.27)
→ A strong sign that the uptrend structure is still maintained.
2. Breakout resistance at 3.45 with high volume
→ This will confirm the continuation of the uptrend, potential towards 3.58–3.87.
3. Positive MACD widening (DIF rising away from DEA)
→ Indicates that buying momentum continues to increase.
4. RSI rises above 60 and stabilizes there
→ Shows that buying strength is still dominant, not overbought.
---
Bearish Signs (Negative):
1. Price drops back and closes below MA(99) 4H (below 3.27)
→ This signals a failure of recovery and potential further decline.
2. Strong rejection from 3.45–3.50 with a long upper wick candle (shooting star)
→ Indicates high selling pressure from the resistance area.
3. RSI fails to rise above 60 and instead drops below 40
→ Potential loss of buyer strength.
4. MACD starts to crossover downwards again (DIF drops cutting DEA)
→ Early signal of bearish reversal.
---
Strategic Conclusion
As long as the price stays above MA(99) and there is no sharp rejection from 3.45, you can remain holding.
If a bearish engulfing or high selling volume appears when the price drops below 3.27, consider exiting temporarily.
Do you want me to help create a visual scenario of breakout and breakdown on the chart as well?
#BTCPrediction
---
Bullish Signs (Positive):
1. Price stays above MA(99) (currently around 3.27)
→ A strong sign that the uptrend structure is still maintained.
2. Breakout resistance at 3.45 with high volume
→ This will confirm the continuation of the uptrend, potential towards 3.58–3.87.
3. Positive MACD widening (DIF rising away from DEA)
→ Indicates that buying momentum continues to increase.
4. RSI rises above 60 and stabilizes there
→ Shows that buying strength is still dominant, not overbought.
---
Bearish Signs (Negative):
1. Price drops back and closes below MA(99) 4H (below 3.27)
→ This signals a failure of recovery and potential further decline.
2. Strong rejection from 3.45–3.50 with a long upper wick candle (shooting star)
→ Indicates high selling pressure from the resistance area.
3. RSI fails to rise above 60 and instead drops below 40
→ Potential loss of buyer strength.
4. MACD starts to crossover downwards again (DIF drops cutting DEA)
→ Early signal of bearish reversal.
---
Strategic Conclusion
As long as the price stays above MA(99) and there is no sharp rejection from 3.45, you can remain holding.
If a bearish engulfing or high selling volume appears when the price drops below 3.27, consider exiting temporarily.
Do you want me to help create a visual scenario of breakout and breakdown on the chart as well?
#BTCPrediction
406
Here are the signs you need to watch out for to assess whether this SUI momentum will continue bullish or reverse bearish:
---
Bullish Signs (Positive):
1. Price stays above MA(99) (currently around 3.27)
→ A strong sign that the uptrend structure is still intact.
2. Breakout resistance 3.45 with high volume
→ This will confirm the continuation of the uptrend, potential towards 3.58–3.87.
3. Positive MACD widening (DIF rising away from DEA)
→ Indicates that buying momentum continues to increase.
4. RSI rises above 60 and stabilizes there
→ Shows that buying strength is still dominant, not overbought yet.
---
Bearish Signs (Negative):
1. Price falls back and closes below MA(99) 4H (below 3.27)
→ This signals a failure of recovery and potential for a deeper decline.
2. Strong rejection from 3.45–3.50 with a long upper wick candle (shooting star)
→ Indicates high selling pressure from the resistance area.
3. RSI fails to rise above 60 and instead drops below 40
→ Potential loss of buyer strength.
4. MACD starts to crossover down again (DIF falls cutting DEA)
→ Early signal of bearish reversal.
---
Strategic Conclusion
As long as the price stays above MA(99) and there is no sharp rejection from 3.45, you can remain hold.
If a bearish engulfing or high sell volume appears when the price drops below 3.27, consider exiting temporarily.
Do you want me to help create a visual scenario of the breakout and breakdown on the chart as well?
$SUI
#MEMEAct
Here are the signs you need to watch out for to assess whether this SUI momentum will continue bullish or reverse bearish:
---
Bullish Signs (Positive):
1. Price stays above MA(99) (currently around 3.27)
→ A strong sign that the uptrend structure is still intact.
2. Breakout resistance 3.45 with high volume
→ This will confirm the continuation of the uptrend, potential towards 3.58–3.87.
3. Positive MACD widening (DIF rising away from DEA)
→ Indicates that buying momentum continues to increase.
4. RSI rises above 60 and stabilizes there
→ Shows that buying strength is still dominant, not overbought yet.
---
Bearish Signs (Negative):
1. Price falls back and closes below MA(99) 4H (below 3.27)
→ This signals a failure of recovery and potential for a deeper decline.
2. Strong rejection from 3.45–3.50 with a long upper wick candle (shooting star)
→ Indicates high selling pressure from the resistance area.
3. RSI fails to rise above 60 and instead drops below 40
→ Potential loss of buyer strength.
4. MACD starts to crossover down again (DIF falls cutting DEA)
→ Early signal of bearish reversal.
---
Strategic Conclusion
As long as the price stays above MA(99) and there is no sharp rejection from 3.45, you can remain hold.
If a bearish engulfing or high sell volume appears when the price drops below 3.27, consider exiting temporarily.
Do you want me to help create a visual scenario of the breakout and breakdown on the chart as well?
$SUI
#MEMEAct
---
Bullish Signs (Positive):
1. Price stays above MA(99) (currently around 3.27)
→ A strong sign that the uptrend structure is still intact.
2. Breakout resistance 3.45 with high volume
→ This will confirm the continuation of the uptrend, potential towards 3.58–3.87.
3. Positive MACD widening (DIF rising away from DEA)
→ Indicates that buying momentum continues to increase.
4. RSI rises above 60 and stabilizes there
→ Shows that buying strength is still dominant, not overbought yet.
---
Bearish Signs (Negative):
1. Price falls back and closes below MA(99) 4H (below 3.27)
→ This signals a failure of recovery and potential for a deeper decline.
2. Strong rejection from 3.45–3.50 with a long upper wick candle (shooting star)
→ Indicates high selling pressure from the resistance area.
3. RSI fails to rise above 60 and instead drops below 40
→ Potential loss of buyer strength.
4. MACD starts to crossover down again (DIF falls cutting DEA)
→ Early signal of bearish reversal.
---
Strategic Conclusion
As long as the price stays above MA(99) and there is no sharp rejection from 3.45, you can remain hold.
If a bearish engulfing or high sell volume appears when the price drops below 3.27, consider exiting temporarily.
Do you want me to help create a visual scenario of the breakout and breakdown on the chart as well?
$SUI
#MEMEAct
371
8
2
13
2.8k
Log in to explore more content
Join global crypto users on Binance Square
⚡️ Get latest and useful information about crypto.
💬 Trusted by the world’s largest crypto exchange.
👍 Discover real insights from verified creators.
Email / Phone number
Trending Topics
CircleMints500MUSDCOnSolana
94,337 views
2,064 Discussing
#circlemints500musdconsolana
🚨 $500M USDC MINTED ON SOLANA! 💵🔥
Circle Treasury just minted 500M USDC on Solana, pushing total global supply to $75.2B! 📈✨
💡 Quick Reality Check:
🔹 Minting = Fresh Inventory Creation (Not instant buying power!🛒
🔹 Real Trigger = Capital Deployment into DeFi, Exchanges & Pools! 🌐🚀
🎯 Coins to Watch:
⚡ $SOL — Network activity is booming, and fresh liquidity continues to drive ecosystem growth!
💎 $RARE — A high-volatility altcoin that reacts fast to fresh market liquidity and sentiment!🪐
💥 Are you accumulating now or waiting for full capital deployment? Drop your thoughts below! 👇✨
#CircleMints500MUSDCOnSolana
#PolymarketBankFailureBetsDrawFDICConcern
#BlackRockBuildsTokenizedPortfoliosForOndo
#BitwiseFilesToListNEARETFOnNYSEArca
Hifza Rubab
·4 Likes
·4.5k views
PolymarketBankFailureBetsDrawFDICConcern
95,125 views
1,837 Discussing
BlackRockBuildsTokenizedPortfoliosForOndo
88,326 views
1,298 Discussing