

远卓分析
25 Posts

远卓分析
Report
Block User
公众号:远卓分析
0 Following
1 Followers
0 Liked
Posts
All
Quotes
·
--
9.30 Er Bing Market Analysis:
Er Bing moved up from 2674 to 2698, a modest rise of 24 points, following Bitcoin as it traced out a short-term rebound. This round represents a small repair within the range. Bullish momentum is not particularly strong, and the market has yet to break free from the choppy consolidation structure.
Daily timeframe:
Er Bing current price is 2695. The market has entered a wait-and-see tug-of-war between long and short sides, forming a consolidation pattern that acts as an upswing continuation. The overall larger trend has not turned bearish. After consecutive advances, price is now in a rest-and-washout phase. Price holding key moving averages indicates that major capital has not exited. The MACD has its two lines above the zero line and has formed a golden cross; the red histogram bars are slowly expanding, suggesting healthy bullish momentum. The Bollinger Bands are tightening; the current price is near the midline at 2679. The near-term upside target looks toward the upper band at 2731. The lower defensive floor is at 2626. Overall indicators lean bullish, but the market needs to successfully break above 2704 to confirm that a new uptrend has officially begun.
4-hour timeframe:
The EMA15 is curling downward, indicating that the short-term strong rally has ended and the market has shifted into range-bound consolidation. The Bollinger Bands are also tightening in parallel; price is oscillating around the midline, and the long-short battle has escalated into a fever pitch. The MACD DIF is converging toward DEA; the red histogram is nearly dissipating, and short-term bullish strength is clearly weakening, while shorts begin to release momentum modestly. 2740 above is the key resistance. The Bollinger lower band at 2644 is an important support. Until the 4-hour candlesticks can hold above 2740, it will be difficult for the next leg higher to start. Most likely, price will continue to grind sideways within a range, waiting for a directional decision.
Trading suggestions:
Range-bound trading between 2650 and 2750; trade the swings back and forth, and aim to profit from the oscillations.
9.30 Er Bing Market Analysis:
Er Bing moved up from 2674 to 2698, a modest rise of 24 points, following Bitcoin as it traced out a short-term rebound. This round represents a small repair within the range. Bullish momentum is not particularly strong, and the market has yet to break free from the choppy consolidation structure.
Daily timeframe:
Er Bing current price is 2695. The market has entered a wait-and-see tug-of-war between long and short sides, forming a consolidation pattern that acts as an upswing continuation. The overall larger trend has not turned bearish. After consecutive advances, price is now in a rest-and-washout phase. Price holding key moving averages indicates that major capital has not exited. The MACD has its two lines above the zero line and has formed a golden cross; the red histogram bars are slowly expanding, suggesting healthy bullish momentum. The Bollinger Bands are tightening; the current price is near the midline at 2679. The near-term upside target looks toward the upper band at 2731. The lower defensive floor is at 2626. Overall indicators lean bullish, but the market needs to successfully break above 2704 to confirm that a new uptrend has officially begun.
4-hour timeframe:
The EMA15 is curling downward, indicating that the short-term strong rally has ended and the market has shifted into range-bound consolidation. The Bollinger Bands are also tightening in parallel; price is oscillating around the midline, and the long-short battle has escalated into a fever pitch. The MACD DIF is converging toward DEA; the red histogram is nearly dissipating, and short-term bullish strength is clearly weakening, while shorts begin to release momentum modestly. 2740 above is the key resistance. The Bollinger lower band at 2644 is an important support. Until the 4-hour candlesticks can hold above 2740, it will be difficult for the next leg higher to start. Most likely, price will continue to grind sideways within a range, waiting for a directional decision.
Trading suggestions:
Range-bound trading between 2650 and 2750; trade the swings back and forth, and aim to profit from the oscillations.
Er Bing moved up from 2674 to 2698, a modest rise of 24 points, following Bitcoin as it traced out a short-term rebound. This round represents a small repair within the range. Bullish momentum is not particularly strong, and the market has yet to break free from the choppy consolidation structure.
Daily timeframe:
Er Bing current price is 2695. The market has entered a wait-and-see tug-of-war between long and short sides, forming a consolidation pattern that acts as an upswing continuation. The overall larger trend has not turned bearish. After consecutive advances, price is now in a rest-and-washout phase. Price holding key moving averages indicates that major capital has not exited. The MACD has its two lines above the zero line and has formed a golden cross; the red histogram bars are slowly expanding, suggesting healthy bullish momentum. The Bollinger Bands are tightening; the current price is near the midline at 2679. The near-term upside target looks toward the upper band at 2731. The lower defensive floor is at 2626. Overall indicators lean bullish, but the market needs to successfully break above 2704 to confirm that a new uptrend has officially begun.
4-hour timeframe:
The EMA15 is curling downward, indicating that the short-term strong rally has ended and the market has shifted into range-bound consolidation. The Bollinger Bands are also tightening in parallel; price is oscillating around the midline, and the long-short battle has escalated into a fever pitch. The MACD DIF is converging toward DEA; the red histogram is nearly dissipating, and short-term bullish strength is clearly weakening, while shorts begin to release momentum modestly. 2740 above is the key resistance. The Bollinger lower band at 2644 is an important support. Until the 4-hour candlesticks can hold above 2740, it will be difficult for the next leg higher to start. Most likely, price will continue to grind sideways within a range, waiting for a directional decision.
Trading suggestions:
Range-bound trading between 2650 and 2750; trade the swings back and forth, and aim to profit from the oscillations.
247
·
--
9.30 Big Coin Market Analysis
The Big Coin started its upward move from 83,000, surged to 83,950. This round of gains covered 950 points, and a short-term pullback rebound and rally is now underway. The market has temporarily released bullish momentum, but it is still within a consolidation range for now. Don’t rush to judge a trend reversal; focus on whether the overhead resistance can be effectively broken, and use changes in trading volume to determine the sustainability of the move.
Big Coin (Daily) level:
Price has held above multiple EMA moving averages across several periods. The long- and mid-term bullish structure remains intact. The Bollinger Bands continue to tighten, indicating the market has entered a phase of building energy and consolidation. The current price is holding above the middle band. The MACD’s two lines are still running above the zero axis, but the strength of the bullish advance is gradually weakening. A bearish divergence/negative-backup signal appears, and the pressure for an upward breakout is increasing. The prior high at 87,385 is an important resistance level; 80,180 is the first support, and 76,460 is a deeper strong support. As long as the 30-EMA is not effectively broken to the downside, the larger bullish trend remains unchanged. In the short term, price is likely to stay in high-level consolidation while waiting for a clear direction to emerge.
(4-Hour) level:
The Big Coin is currently in a consolidation phase after a pullback from the highs. The MA5 and MA20 are highly clustered, meaning the short-term long/short holding costs are slowly converging. The market currently has no clear direction. The RSI is around 44, sitting in a neutral-to-weak zone. Momentum to push higher is somewhat lacking, but it hasn’t entered an extreme weakness area. For now, there’s no need to be overly bearish—continue waiting for the market to choose a breakout direction.
Short-term trading suggestions:
Big Coin long 82,800–83,200 | Target: 85,800–86,200
Big Coin short 86,000–85,000 | Target: 82,500–83,000
9.30 Big Coin Market Analysis
The Big Coin started its upward move from 83,000, surged to 83,950. This round of gains covered 950 points, and a short-term pullback rebound and rally is now underway. The market has temporarily released bullish momentum, but it is still within a consolidation range for now. Don’t rush to judge a trend reversal; focus on whether the overhead resistance can be effectively broken, and use changes in trading volume to determine the sustainability of the move.
Big Coin (Daily) level:
Price has held above multiple EMA moving averages across several periods. The long- and mid-term bullish structure remains intact. The Bollinger Bands continue to tighten, indicating the market has entered a phase of building energy and consolidation. The current price is holding above the middle band. The MACD’s two lines are still running above the zero axis, but the strength of the bullish advance is gradually weakening. A bearish divergence/negative-backup signal appears, and the pressure for an upward breakout is increasing. The prior high at 87,385 is an important resistance level; 80,180 is the first support, and 76,460 is a deeper strong support. As long as the 30-EMA is not effectively broken to the downside, the larger bullish trend remains unchanged. In the short term, price is likely to stay in high-level consolidation while waiting for a clear direction to emerge.
(4-Hour) level:
The Big Coin is currently in a consolidation phase after a pullback from the highs. The MA5 and MA20 are highly clustered, meaning the short-term long/short holding costs are slowly converging. The market currently has no clear direction. The RSI is around 44, sitting in a neutral-to-weak zone. Momentum to push higher is somewhat lacking, but it hasn’t entered an extreme weakness area. For now, there’s no need to be overly bearish—continue waiting for the market to choose a breakout direction.
Short-term trading suggestions:
Big Coin long 82,800–83,200 | Target: 85,800–86,200
Big Coin short 86,000–85,000 | Target: 82,500–83,000
The Big Coin started its upward move from 83,000, surged to 83,950. This round of gains covered 950 points, and a short-term pullback rebound and rally is now underway. The market has temporarily released bullish momentum, but it is still within a consolidation range for now. Don’t rush to judge a trend reversal; focus on whether the overhead resistance can be effectively broken, and use changes in trading volume to determine the sustainability of the move.
Big Coin (Daily) level:
Price has held above multiple EMA moving averages across several periods. The long- and mid-term bullish structure remains intact. The Bollinger Bands continue to tighten, indicating the market has entered a phase of building energy and consolidation. The current price is holding above the middle band. The MACD’s two lines are still running above the zero axis, but the strength of the bullish advance is gradually weakening. A bearish divergence/negative-backup signal appears, and the pressure for an upward breakout is increasing. The prior high at 87,385 is an important resistance level; 80,180 is the first support, and 76,460 is a deeper strong support. As long as the 30-EMA is not effectively broken to the downside, the larger bullish trend remains unchanged. In the short term, price is likely to stay in high-level consolidation while waiting for a clear direction to emerge.
(4-Hour) level:
The Big Coin is currently in a consolidation phase after a pullback from the highs. The MA5 and MA20 are highly clustered, meaning the short-term long/short holding costs are slowly converging. The market currently has no clear direction. The RSI is around 44, sitting in a neutral-to-weak zone. Momentum to push higher is somewhat lacking, but it hasn’t entered an extreme weakness area. For now, there’s no need to be overly bearish—continue waiting for the market to choose a breakout direction.
Short-term trading suggestions:
Big Coin long 82,800–83,200 | Target: 85,800–86,200
Big Coin short 86,000–85,000 | Target: 82,500–83,000
158
·
--
Big pie 82950 entered, 83840 exited. Took 890 points and made a profit of 5300u. Second pie 2656 entered, 2694 exited. Took 38 points and made a profit of 7000u. The most common false breakouts happen in the ranging/oscillation zone, so we can't enter randomly in the middle of the range. Wait until price reaches the boundaries of the range, then after confirming absorption/support or selling pressure, consider setting up the trade.
Big pie 82950 entered, 83840 exited. Took 890 points and made a profit of 5300u. Second pie 2656 entered, 2694 exited. Took 38 points and made a profit of 7000u. The most common false breakouts happen in the ranging/oscillation zone, so we can't enter randomly in the middle of the range. Wait until price reaches the boundaries of the range, then after confirming absorption/support or selling pressure, consider setting up the trade.



175
·
--
See translation
早盘行情分析预测成功,白盘行情实在是太磨叽了,本来想拿到目标位的,吃了半段波动就离场了,祝大家国庆愉快,有一个美好的假期
早盘行情分析预测成功,白盘行情实在是太磨叽了,本来想拿到目标位的,吃了半段波动就离场了,祝大家国庆愉快,有一个美好的假期



远卓分析
·
--
9.30 Yesterday’s Recap and Morning Session Analysis
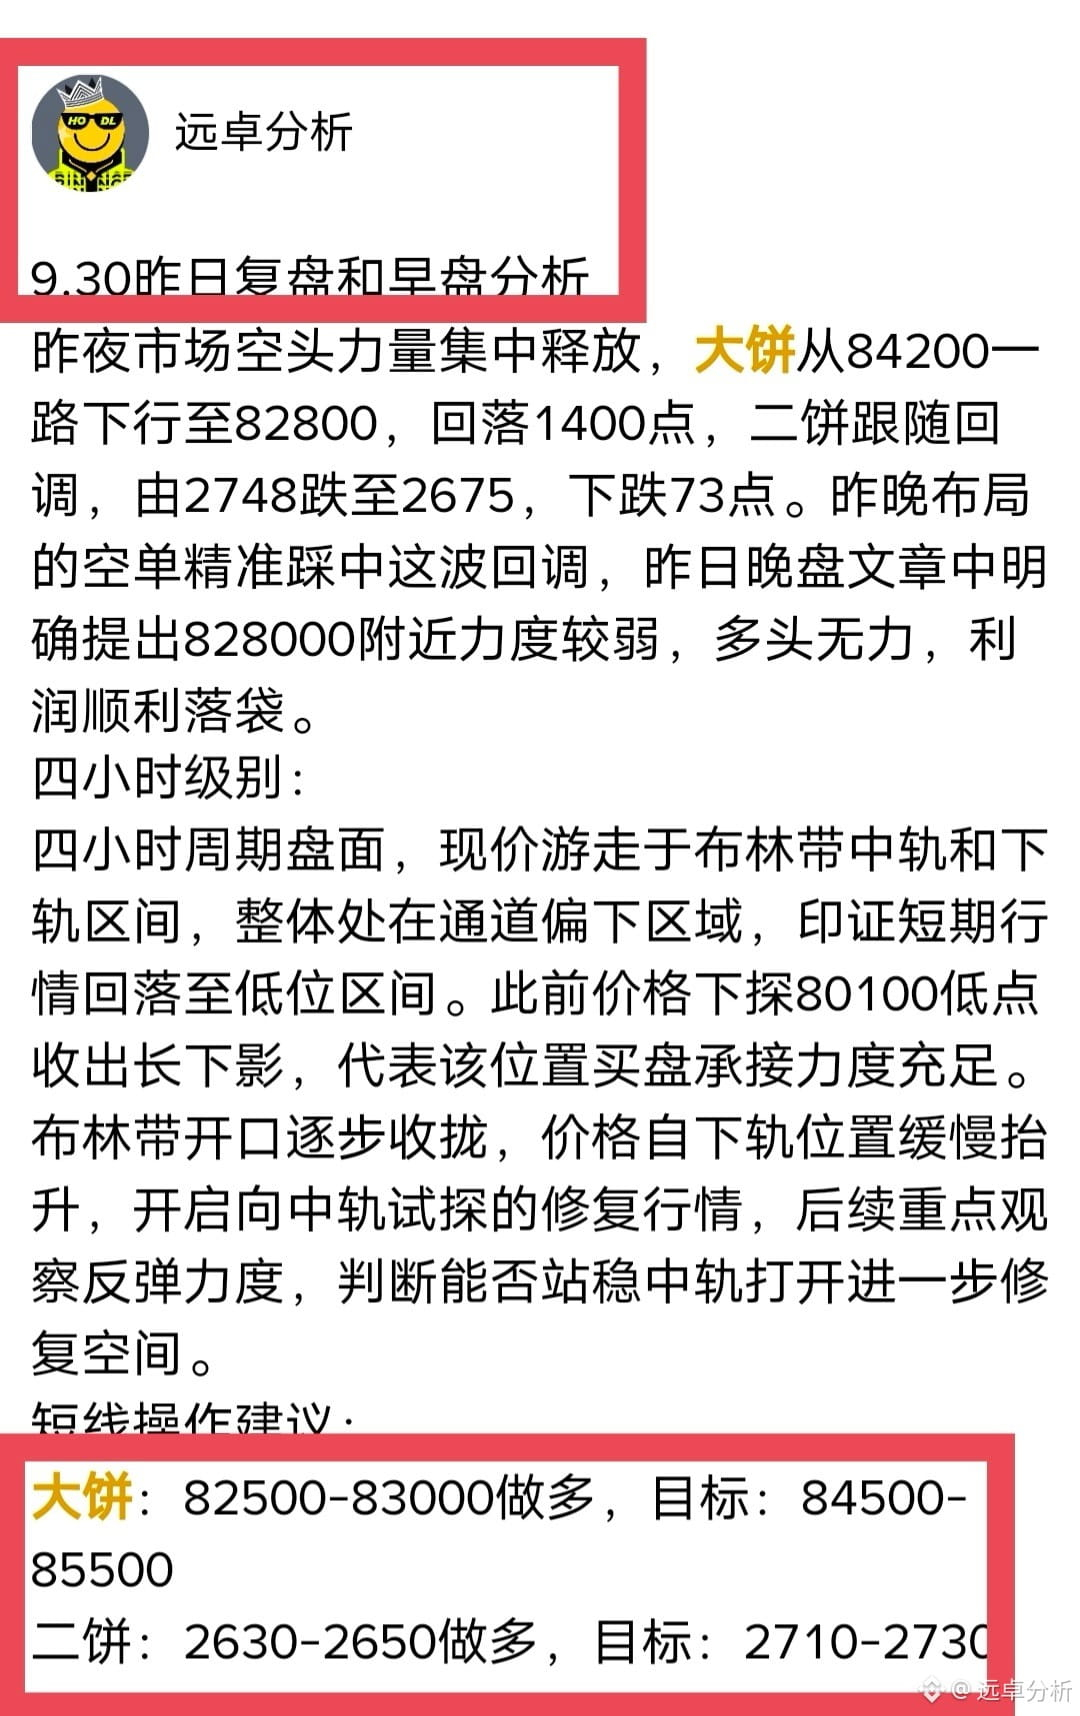
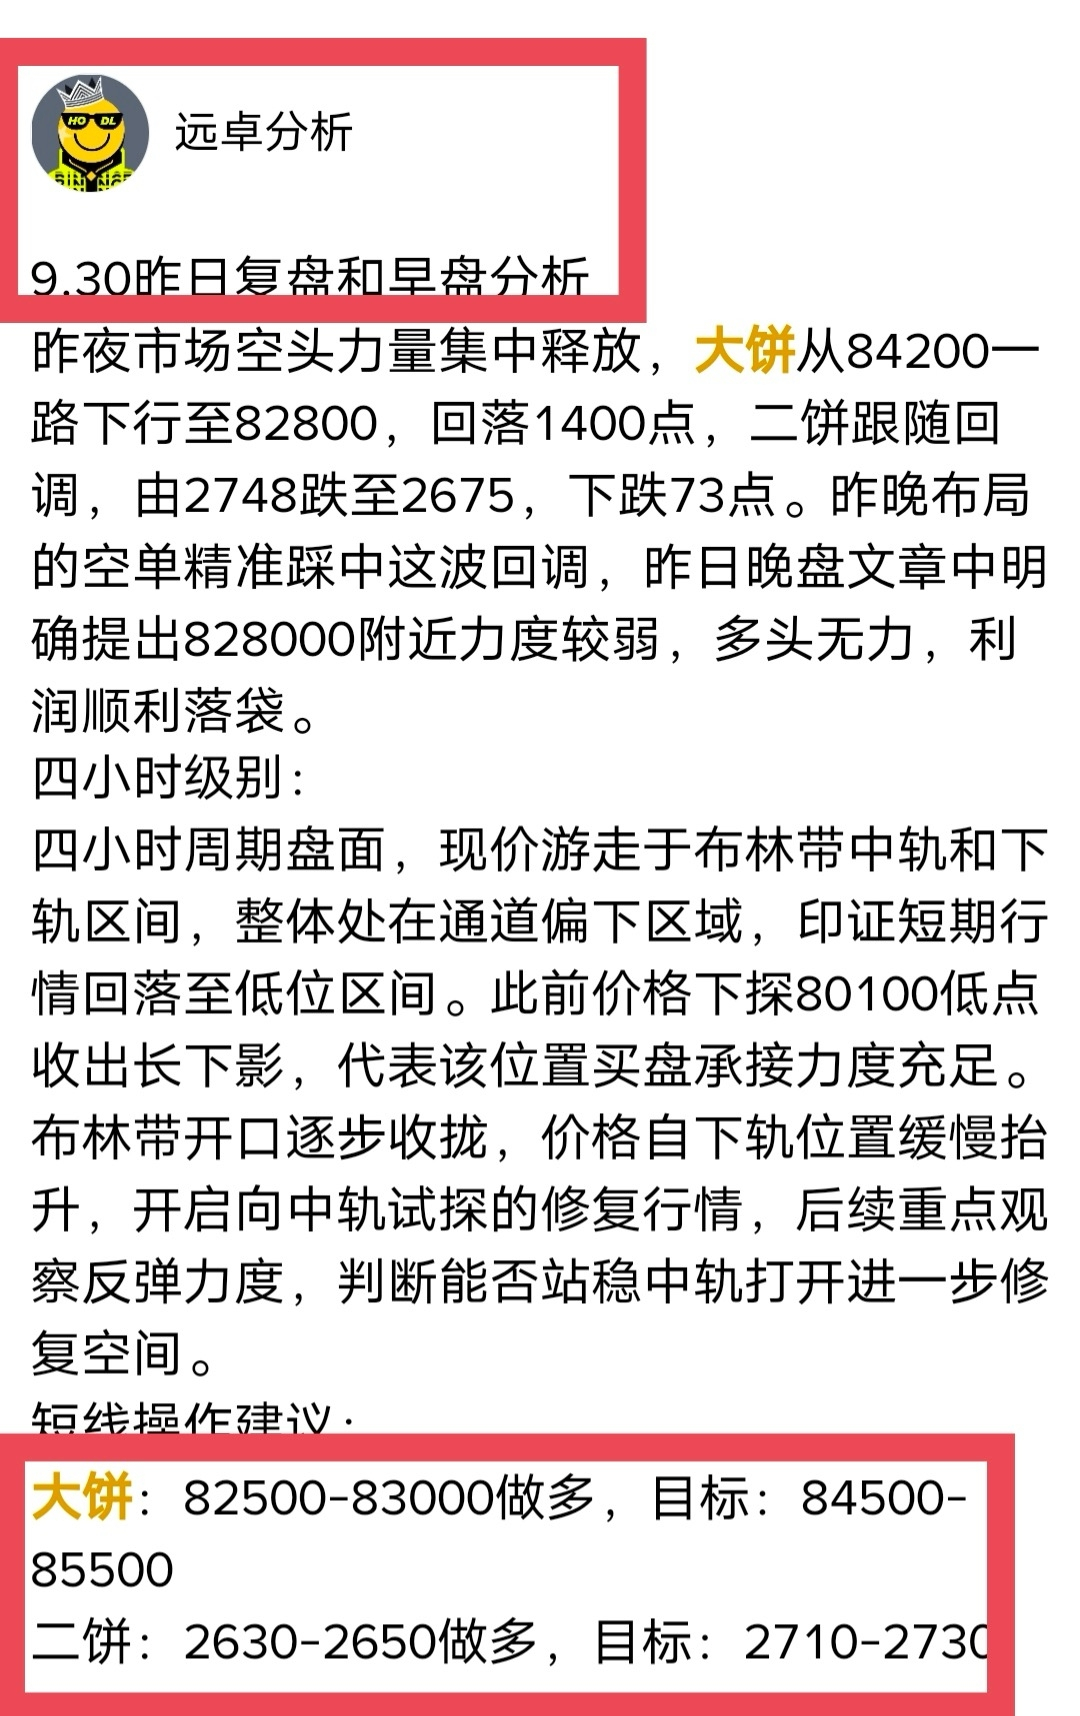
Last night, bearish pressure concentrated and was released. Big BTC (the “big pie”) fell all the way from 84,200 to 82,800, dropping 1,400 points. The second BTC (the “second pie”) followed in the pullback, moving from 2,748 down to 2,675, a decline of 73 points. The short positions placed last night precisely caught this pullback. In the article from last night’s late session, it was clearly stated that around 828,000 the momentum was weak and the bulls lacked strength—profits were successfully taken.
Big BTC (daily timeframe):
On the daily timeframe, price is holding above multiple EMA moving averages, maintaining the broader medium-to-long-term bullish structure. The Bollinger Bands are gradually narrowing, and the market has entered a range-bound consolidation phase with buildup. Price is staying above the middle band. The MACD indicator is still above the zero line, but bullish momentum continues to weaken; a bearish divergence at the top is showing, suggesting that near-term upward momentum is insufficient. The prior high at 87,385 forms a key resistance, 80,180 serves as the first line of defense, and 76,460 is deep support. As the larger trend’s bullish foundation is still intact, until a key moving average is lost, prioritize a high-range consolidation mindset—stay patient and wait for the chart to break and choose a direction.
Four-hour timeframe:
On the four-hour chart, the current price is moving around the Bollinger middle band and lower band range. Overall, it is in the lower part of the channel, confirming that the short-term market has pulled back into a low-range area. Previously, price probed down to the 80,100 low and formed a long lower wick, indicating sufficient buy-side support at that level. The Bollinger Bands’ opening is gradually tightening; price is slowly rising from the lower band position, initiating a corrective move toward testing the middle band. Going forward, focus on the strength of the rebound to judge whether it can hold above the middle band and open further repair room.
Short-term trading suggestions:
Big BTC: Go long at 82,500–83,000, target: 84,500–85,500
Second BTC: Go long at 2,630–2,650, target: 2,710–2,730
Last night, bearish pressure concentrated and was released. Big BTC (the “big pie”) fell all the way from 84,200 to 82,800, dropping 1,400 points. The second BTC (the “second pie”) followed in the pullback, moving from 2,748 down to 2,675, a decline of 73 points. The short positions placed last night precisely caught this pullback. In the article from last night’s late session, it was clearly stated that around 828,000 the momentum was weak and the bulls lacked strength—profits were successfully taken.
Big BTC (daily timeframe):
On the daily timeframe, price is holding above multiple EMA moving averages, maintaining the broader medium-to-long-term bullish structure. The Bollinger Bands are gradually narrowing, and the market has entered a range-bound consolidation phase with buildup. Price is staying above the middle band. The MACD indicator is still above the zero line, but bullish momentum continues to weaken; a bearish divergence at the top is showing, suggesting that near-term upward momentum is insufficient. The prior high at 87,385 forms a key resistance, 80,180 serves as the first line of defense, and 76,460 is deep support. As the larger trend’s bullish foundation is still intact, until a key moving average is lost, prioritize a high-range consolidation mindset—stay patient and wait for the chart to break and choose a direction.
Four-hour timeframe:
On the four-hour chart, the current price is moving around the Bollinger middle band and lower band range. Overall, it is in the lower part of the channel, confirming that the short-term market has pulled back into a low-range area. Previously, price probed down to the 80,100 low and formed a long lower wick, indicating sufficient buy-side support at that level. The Bollinger Bands’ opening is gradually tightening; price is slowly rising from the lower band position, initiating a corrective move toward testing the middle band. Going forward, focus on the strength of the rebound to judge whether it can hold above the middle band and open further repair room.
Short-term trading suggestions:
Big BTC: Go long at 82,500–83,000, target: 84,500–85,500
Second BTC: Go long at 2,630–2,650, target: 2,710–2,730
49
·
--
9.30 Yesterday’s Recap and Morning Session Analysis
Last night, bearish pressure concentrated and was released. Big BTC (the “big pie”) fell all the way from 84,200 to 82,800, dropping 1,400 points. The second BTC (the “second pie”) followed in the pullback, moving from 2,748 down to 2,675, a decline of 73 points. The short positions placed last night precisely caught this pullback. In the article from last night’s late session, it was clearly stated that around 828,000 the momentum was weak and the bulls lacked strength—profits were successfully taken.
Big BTC (daily timeframe):
On the daily timeframe, price is holding above multiple EMA moving averages, maintaining the broader medium-to-long-term bullish structure. The Bollinger Bands are gradually narrowing, and the market has entered a range-bound consolidation phase with buildup. Price is staying above the middle band. The MACD indicator is still above the zero line, but bullish momentum continues to weaken; a bearish divergence at the top is showing, suggesting that near-term upward momentum is insufficient. The prior high at 87,385 forms a key resistance, 80,180 serves as the first line of defense, and 76,460 is deep support. As the larger trend’s bullish foundation is still intact, until a key moving average is lost, prioritize a high-range consolidation mindset—stay patient and wait for the chart to break and choose a direction.
Four-hour timeframe:
On the four-hour chart, the current price is moving around the Bollinger middle band and lower band range. Overall, it is in the lower part of the channel, confirming that the short-term market has pulled back into a low-range area. Previously, price probed down to the 80,100 low and formed a long lower wick, indicating sufficient buy-side support at that level. The Bollinger Bands’ opening is gradually tightening; price is slowly rising from the lower band position, initiating a corrective move toward testing the middle band. Going forward, focus on the strength of the rebound to judge whether it can hold above the middle band and open further repair room.
Short-term trading suggestions:
Big BTC: Go long at 82,500–83,000, target: 84,500–85,500
Second BTC: Go long at 2,630–2,650, target: 2,710–2,730
9.30 Yesterday’s Recap and Morning Session Analysis
Last night, bearish pressure concentrated and was released. Big BTC (the “big pie”) fell all the way from 84,200 to 82,800, dropping 1,400 points. The second BTC (the “second pie”) followed in the pullback, moving from 2,748 down to 2,675, a decline of 73 points. The short positions placed last night precisely caught this pullback. In the article from last night’s late session, it was clearly stated that around 828,000 the momentum was weak and the bulls lacked strength—profits were successfully taken.
Big BTC (daily timeframe):
On the daily timeframe, price is holding above multiple EMA moving averages, maintaining the broader medium-to-long-term bullish structure. The Bollinger Bands are gradually narrowing, and the market has entered a range-bound consolidation phase with buildup. Price is staying above the middle band. The MACD indicator is still above the zero line, but bullish momentum continues to weaken; a bearish divergence at the top is showing, suggesting that near-term upward momentum is insufficient. The prior high at 87,385 forms a key resistance, 80,180 serves as the first line of defense, and 76,460 is deep support. As the larger trend’s bullish foundation is still intact, until a key moving average is lost, prioritize a high-range consolidation mindset—stay patient and wait for the chart to break and choose a direction.
Four-hour timeframe:
On the four-hour chart, the current price is moving around the Bollinger middle band and lower band range. Overall, it is in the lower part of the channel, confirming that the short-term market has pulled back into a low-range area. Previously, price probed down to the 80,100 low and formed a long lower wick, indicating sufficient buy-side support at that level. The Bollinger Bands’ opening is gradually tightening; price is slowly rising from the lower band position, initiating a corrective move toward testing the middle band. Going forward, focus on the strength of the rebound to judge whether it can hold above the middle band and open further repair room.
Short-term trading suggestions:
Big BTC: Go long at 82,500–83,000, target: 84,500–85,500
Second BTC: Go long at 2,630–2,650, target: 2,710–2,730
Last night, bearish pressure concentrated and was released. Big BTC (the “big pie”) fell all the way from 84,200 to 82,800, dropping 1,400 points. The second BTC (the “second pie”) followed in the pullback, moving from 2,748 down to 2,675, a decline of 73 points. The short positions placed last night precisely caught this pullback. In the article from last night’s late session, it was clearly stated that around 828,000 the momentum was weak and the bulls lacked strength—profits were successfully taken.
Big BTC (daily timeframe):
On the daily timeframe, price is holding above multiple EMA moving averages, maintaining the broader medium-to-long-term bullish structure. The Bollinger Bands are gradually narrowing, and the market has entered a range-bound consolidation phase with buildup. Price is staying above the middle band. The MACD indicator is still above the zero line, but bullish momentum continues to weaken; a bearish divergence at the top is showing, suggesting that near-term upward momentum is insufficient. The prior high at 87,385 forms a key resistance, 80,180 serves as the first line of defense, and 76,460 is deep support. As the larger trend’s bullish foundation is still intact, until a key moving average is lost, prioritize a high-range consolidation mindset—stay patient and wait for the chart to break and choose a direction.
Four-hour timeframe:
On the four-hour chart, the current price is moving around the Bollinger middle band and lower band range. Overall, it is in the lower part of the channel, confirming that the short-term market has pulled back into a low-range area. Previously, price probed down to the 80,100 low and formed a long lower wick, indicating sufficient buy-side support at that level. The Bollinger Bands’ opening is gradually tightening; price is slowly rising from the lower band position, initiating a corrective move toward testing the middle band. Going forward, focus on the strength of the rebound to judge whether it can hold above the middle band and open further repair room.
Short-term trading suggestions:
Big BTC: Go long at 82,500–83,000, target: 84,500–85,500
Second BTC: Go long at 2,630–2,650, target: 2,710–2,730



1
205
·
--
Big pancake 83985 in, 83136 out, took down 849 points, profit 3032u
Second pancake 2718 in, 2678 out, took down 40 points, profit 4469u
Profit smoothly pocketed. In tonight’s after-hours article, it was clearly pointed out that around 82800 the strength is weaker—bulls lack momentum. If you see an article, don’t just look at the price levels; the content is the real essence. Operate in line with the market trend. In this kind of market, the trades are basically in your hands.
Big pancake 83985 in, 83136 out, took down 849 points, profit 3032u
Second pancake 2718 in, 2678 out, took down 40 points, profit 4469u
Profit smoothly pocketed. In tonight’s after-hours article, it was clearly pointed out that around 82800 the strength is weaker—bulls lack momentum. If you see an article, don’t just look at the price levels; the content is the real essence. Operate in line with the market trend. In this kind of market, the trades are basically in your hands.
Second pancake 2718 in, 2678 out, took down 40 points, profit 4469u
Profit smoothly pocketed. In tonight’s after-hours article, it was clearly pointed out that around 82800 the strength is weaker—bulls lack momentum. If you see an article, don’t just look at the price levels; the content is the real essence. Operate in line with the market trend. In this kind of market, the trades are basically in your hands.



259
·
--
Yesterday’s after-hours short order verification—when the US stock market opened, we entered at key turning points. Our target was 83,000. The market triggered perfectly; the day’s low was 82,800 in the early morning. Nothing could be more precise than this.
Yesterday’s after-hours short order verification—when the US stock market opened, we entered at key turning points. Our target was 83,000. The market triggered perfectly; the day’s low was 82,800 in the early morning. Nothing could be more precise than this.



远卓分析
·
--
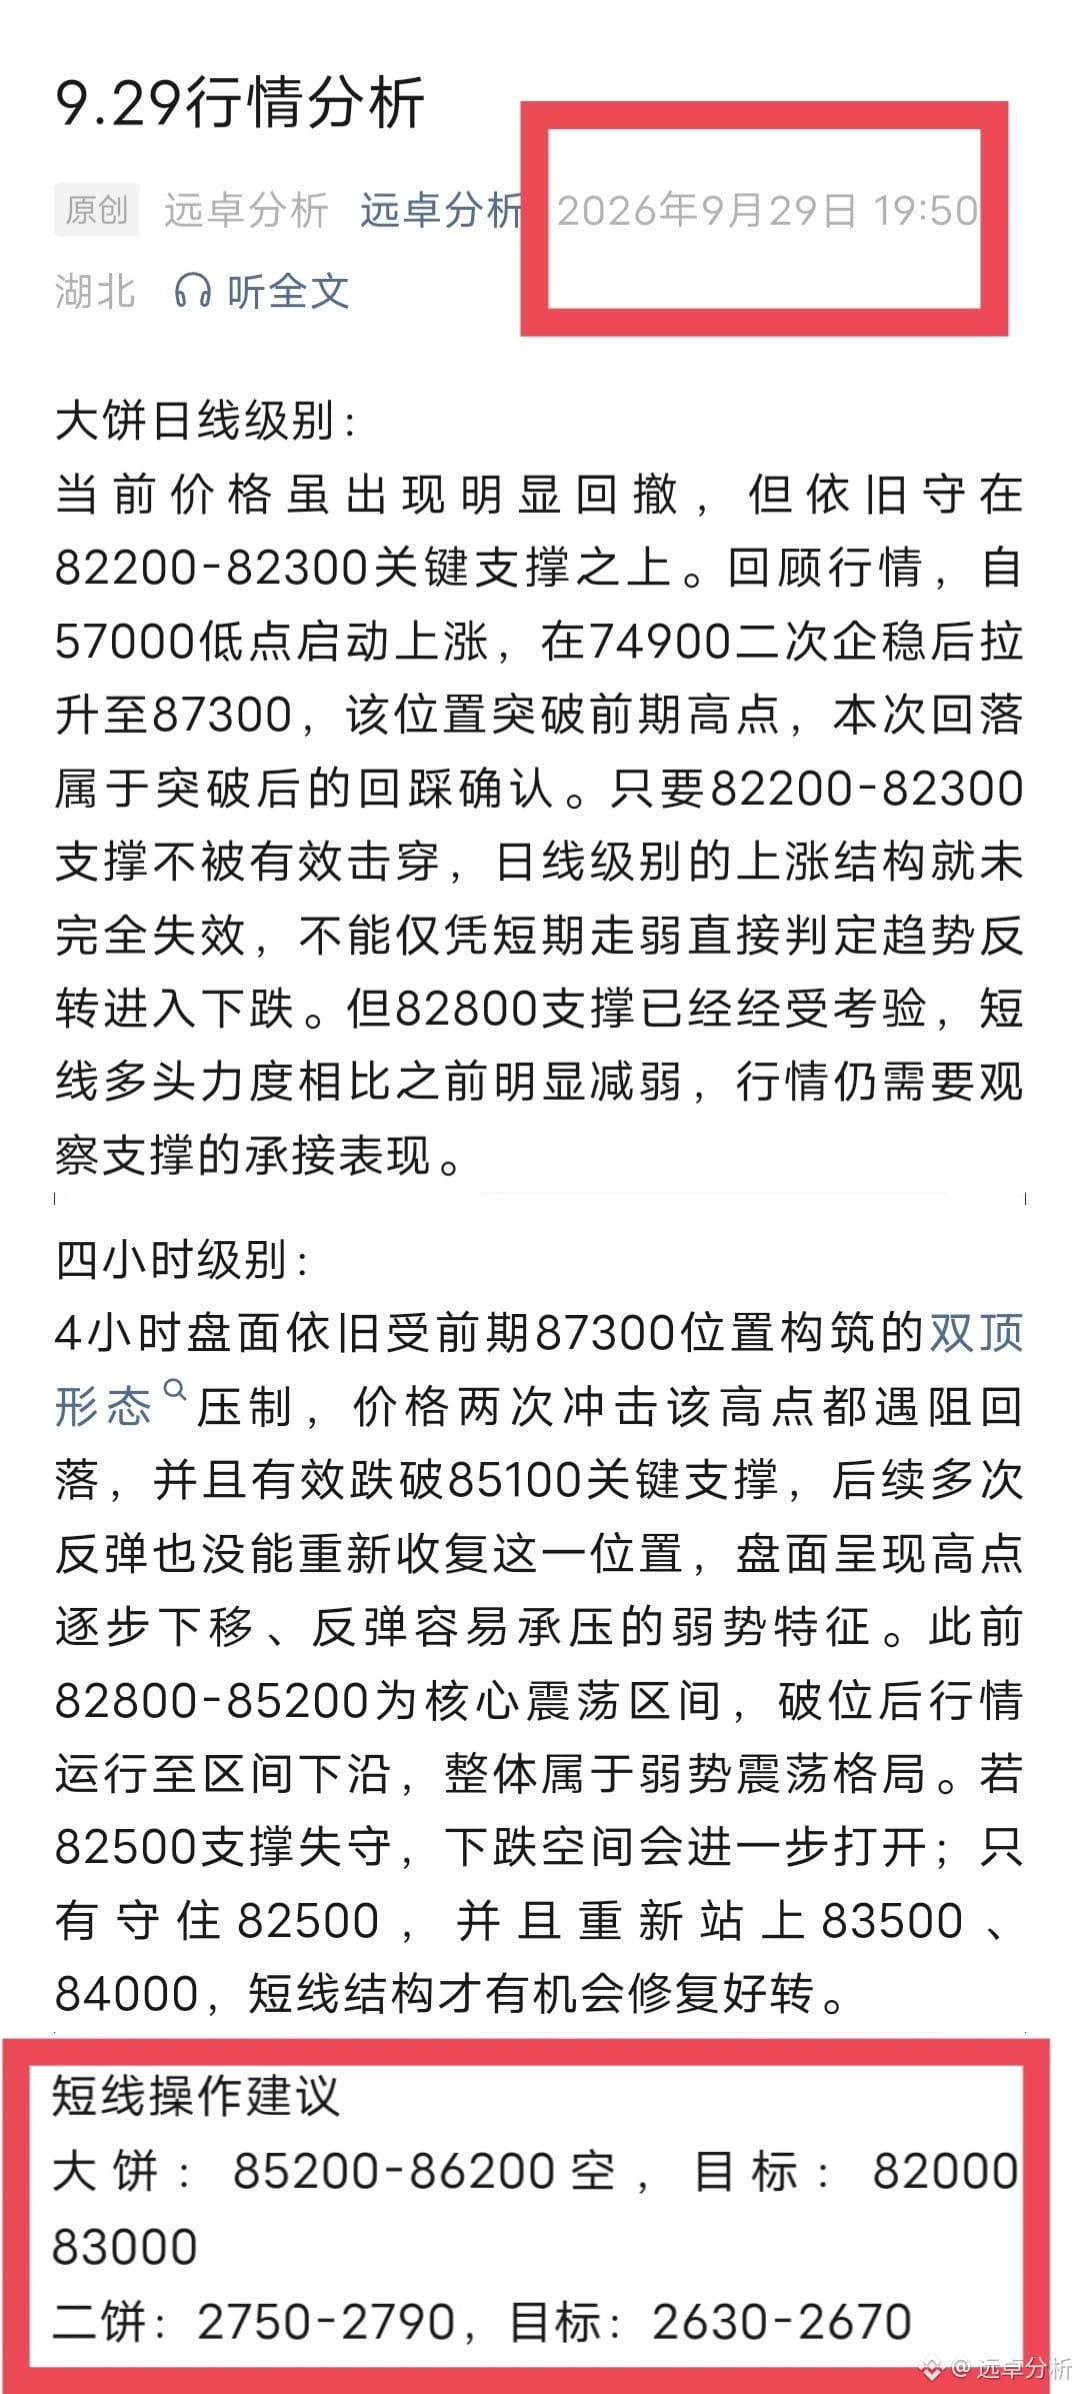
9.29 Big Pie Market Analysis
Hello everyone, I’m YuanZhuo Analysis. In the early-morning hours, the big pie (Bitcoin) quickly dropped from 84,300 to 82,800. The short-term pullback was nearly 1,500 points. Heavy sell pressure concentrated and released, driving the price to probe quickly lower. The chart shows clear short-term weakness under pressure. During midday, starting around 83,000, it gained momentum upward, with the high reaching 84,200—pushing up about 1,200 points in the short term. Buy orders clustered at the low levels, and the market then saw a fast rebound.
Next, the key is to watch whether the breakout above nearby resistance is truly effective. If price meets resistance and stalls, the market may drop again.
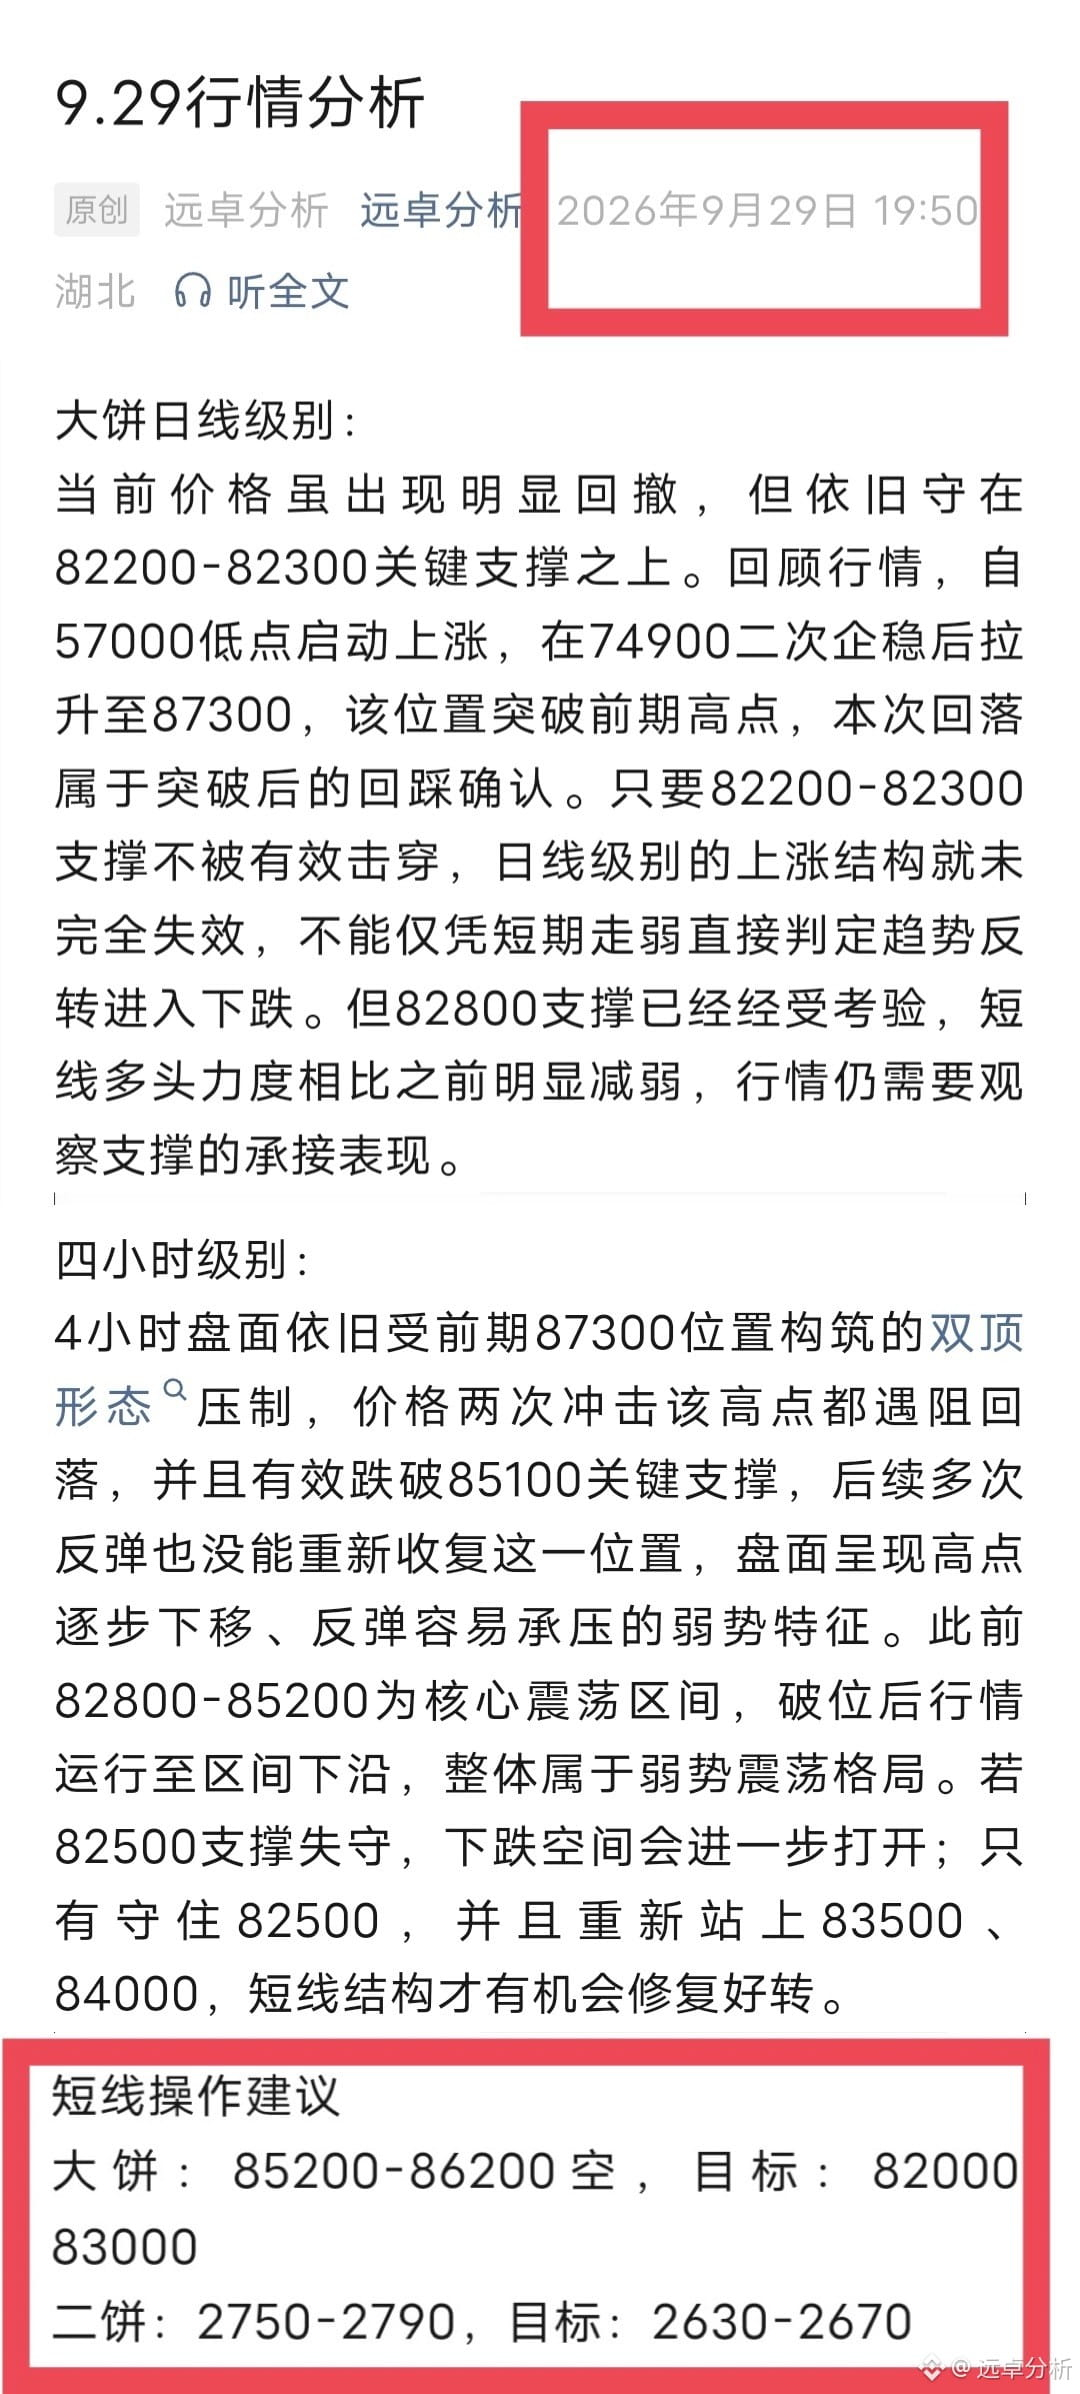
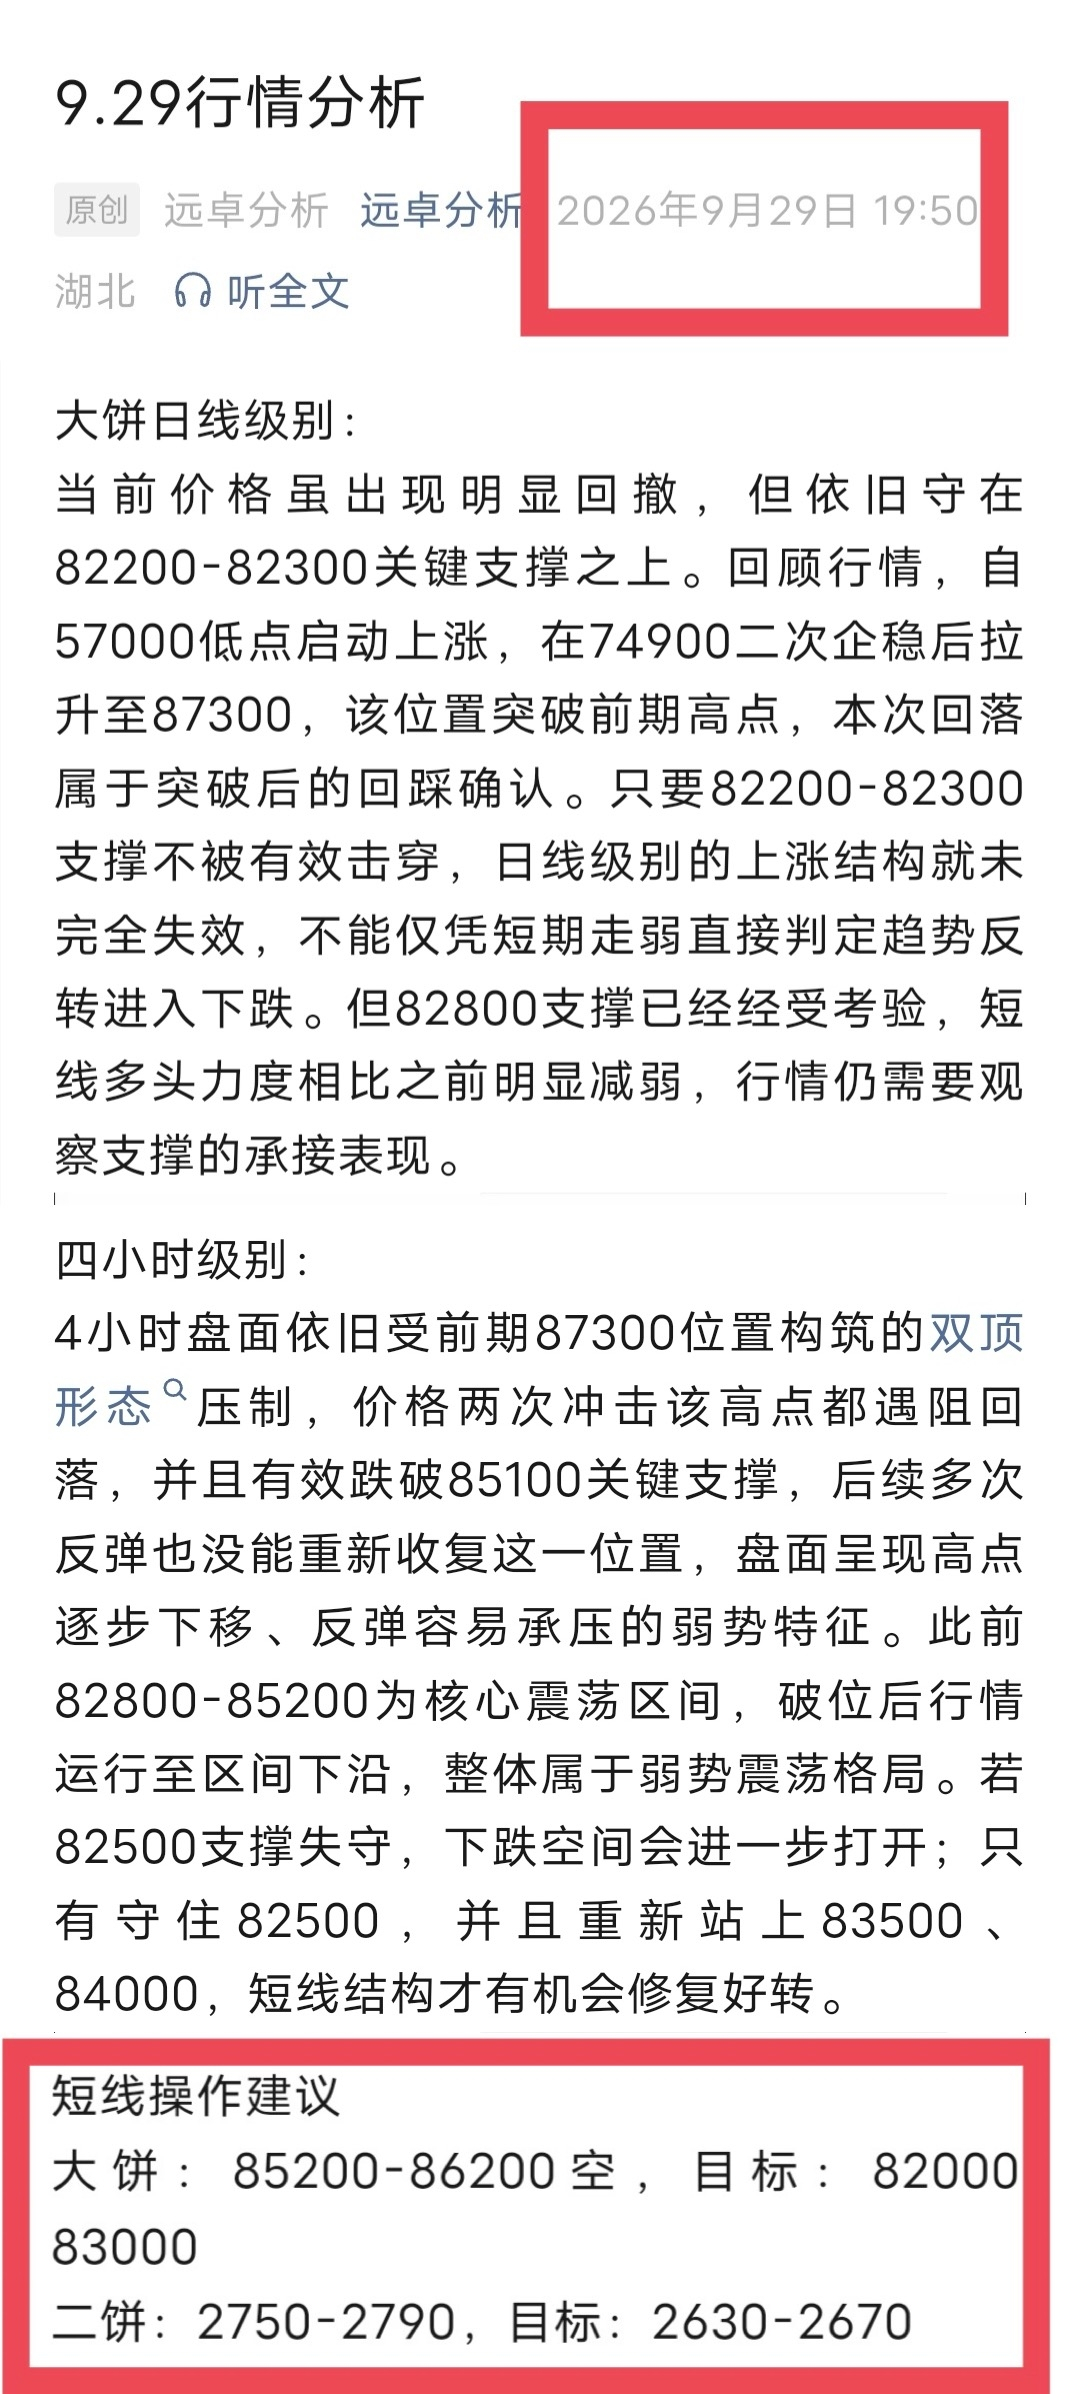
Big Pie (Daily timeframe): Although the current price has shown a clear retracement, it is still holding above the key support zone of 82,200–82,300. Looking back at the move: it began rising from the 57,000 low, then after a second stabilization at 74,900, it surged to 87,300. That level broke above the previous high. The current pullback is essentially a pullback/confirmation after the breakout. As long as support at 82,200–82,300 is not decisively broken, the daily uptrend structure has not been completely invalidated. You should not conclude a trend reversal and move into a downtrend solely because of short-term weakness. However, the 82,800 support has already been tested, and short-term bullish strength is noticeably weaker than before. The market still needs to be observed for how support is being absorbed.
4-Hour timeframe: The 4-hour chart is still being suppressed by the double-top structure formed around the earlier 87,300 area. Price has struck that high twice, but both times failed and pulled back. It also effectively broke below the key support at 85,100. After that, multiple rebounds were unable to regain this level, and the chart shows weak characteristics: highs gradually moving lower, and rebounds being easy to press down. Previously, 82,800–85,200 was the core consolidation range. After the breakdown, price moved to the lower edge of that range, and overall it remains in a weak consolidation pattern. If support at 82,500 breaks, further downside room will open up. Only by holding 82,500, and then regaining above 83,500 and 84,000, will the short-term structure have a chance to repair and improve.
At the current stage, the big pie has entered a correction period. Volume and price are contracting together, forming a ‘volume-decline pullback’ pattern. In the broader macro picture, October rate-hike expectations have risen to over 70%, yet Bitcoin did not follow with a sharp drop. Inside the market, demand-driven buy orders provide some support strength. Signals of divergence have appeared in indicators on the larger cycle. For reference, after the August period of increased volume and subsequent sideways movement: earlier price rose to make four consecutive higher highs, then pulled back from around 82,000 to 75,000. If over the next two days price decisively breaks below the 82,000 support, and further probes toward the 80,000 psychological level, that area is worth paying special attention to for setting up opportunities.
Short-term trading suggestions
Big Pie: Sell/short 85,200–86,200, targets: 82,000–83,000
Hello everyone, I’m YuanZhuo Analysis. In the early-morning hours, the big pie (Bitcoin) quickly dropped from 84,300 to 82,800. The short-term pullback was nearly 1,500 points. Heavy sell pressure concentrated and released, driving the price to probe quickly lower. The chart shows clear short-term weakness under pressure. During midday, starting around 83,000, it gained momentum upward, with the high reaching 84,200—pushing up about 1,200 points in the short term. Buy orders clustered at the low levels, and the market then saw a fast rebound.
Next, the key is to watch whether the breakout above nearby resistance is truly effective. If price meets resistance and stalls, the market may drop again.
Big Pie (Daily timeframe): Although the current price has shown a clear retracement, it is still holding above the key support zone of 82,200–82,300. Looking back at the move: it began rising from the 57,000 low, then after a second stabilization at 74,900, it surged to 87,300. That level broke above the previous high. The current pullback is essentially a pullback/confirmation after the breakout. As long as support at 82,200–82,300 is not decisively broken, the daily uptrend structure has not been completely invalidated. You should not conclude a trend reversal and move into a downtrend solely because of short-term weakness. However, the 82,800 support has already been tested, and short-term bullish strength is noticeably weaker than before. The market still needs to be observed for how support is being absorbed.
4-Hour timeframe: The 4-hour chart is still being suppressed by the double-top structure formed around the earlier 87,300 area. Price has struck that high twice, but both times failed and pulled back. It also effectively broke below the key support at 85,100. After that, multiple rebounds were unable to regain this level, and the chart shows weak characteristics: highs gradually moving lower, and rebounds being easy to press down. Previously, 82,800–85,200 was the core consolidation range. After the breakdown, price moved to the lower edge of that range, and overall it remains in a weak consolidation pattern. If support at 82,500 breaks, further downside room will open up. Only by holding 82,500, and then regaining above 83,500 and 84,000, will the short-term structure have a chance to repair and improve.
At the current stage, the big pie has entered a correction period. Volume and price are contracting together, forming a ‘volume-decline pullback’ pattern. In the broader macro picture, October rate-hike expectations have risen to over 70%, yet Bitcoin did not follow with a sharp drop. Inside the market, demand-driven buy orders provide some support strength. Signals of divergence have appeared in indicators on the larger cycle. For reference, after the August period of increased volume and subsequent sideways movement: earlier price rose to make four consecutive higher highs, then pulled back from around 82,000 to 75,000. If over the next two days price decisively breaks below the 82,000 support, and further probes toward the 80,000 psychological level, that area is worth paying special attention to for setting up opportunities.
Short-term trading suggestions
Big Pie: Sell/short 85,200–86,200, targets: 82,000–83,000
6
·
--
9.29 Analysis of Erbing:
Early in the morning, Erbing fell from 2720 to 2668, dropping 52 points in the short term. It moved in tandem with the broader market as both faced pressure and headed downward, releasing short-term selling pressure. Next, focus on whether support below can hold. If support stays intact, a rebound and repair is likely. If support is broken to the downside with increased volume, the pullback room will continue to expand. From the midday rebound off 2668 to 2717, price rose about 48 points—this is a short-term repair following the early-morning pullback. It suggests there is support/resumption around 2660–2670, but the rebound strength is still insufficient to confirm a trend strengthening. Going forward, the key is to watch whether 2700–2720 can hold steady. If price returns above 2720 with volume, the short-term repair is likely to have stronger continuity.
Erbing daily timeframe:
On the daily timeframe, candles alternate with small yin and small yang, showing that bulls and bears are locked in a tug-of-war. On the 4-hour timeframe, the DIF line crosses above the DEA to form a golden cross, and MACD’s red histogram appears, indicating that short-term bullish momentum has warmed up to some extent. However, this signal only reflects short-term repair. Until there is a valid breakout above the overhead pressure level, it should not be treated as a trend reversal. Instead, you can consider placing short positions in batches based on below the resistance zone, while setting stop-losses to guard against the risk of a breakout upward. Do not blindly go long just because short-period indicators have improved.
4-hour timeframe:
On the 4-hour timeframe, a strong bullish candle is formed, and the closing price is close to the session high. It completes an engulfing pattern over the previous bearish candle, suggesting that near-term buying momentum has recovered somewhat. The chart is currently probing upward toward the key resistance around 2730, where a large amount of trapped-positions selling pressure is likely concentrated. The focus is on whether price can achieve an effective breakout. If pressure causes a pullback at this level, the market may return to range-bound consolidation. Avoid chasing higher levels blindly when entering; you must control position sizing and manage risk.
Short-term trading suggestions
Erbing: Short at 2750–2790, targets: 2630–2670
9.29 Analysis of Erbing:
Early in the morning, Erbing fell from 2720 to 2668, dropping 52 points in the short term. It moved in tandem with the broader market as both faced pressure and headed downward, releasing short-term selling pressure. Next, focus on whether support below can hold. If support stays intact, a rebound and repair is likely. If support is broken to the downside with increased volume, the pullback room will continue to expand. From the midday rebound off 2668 to 2717, price rose about 48 points—this is a short-term repair following the early-morning pullback. It suggests there is support/resumption around 2660–2670, but the rebound strength is still insufficient to confirm a trend strengthening. Going forward, the key is to watch whether 2700–2720 can hold steady. If price returns above 2720 with volume, the short-term repair is likely to have stronger continuity.
Erbing daily timeframe:
On the daily timeframe, candles alternate with small yin and small yang, showing that bulls and bears are locked in a tug-of-war. On the 4-hour timeframe, the DIF line crosses above the DEA to form a golden cross, and MACD’s red histogram appears, indicating that short-term bullish momentum has warmed up to some extent. However, this signal only reflects short-term repair. Until there is a valid breakout above the overhead pressure level, it should not be treated as a trend reversal. Instead, you can consider placing short positions in batches based on below the resistance zone, while setting stop-losses to guard against the risk of a breakout upward. Do not blindly go long just because short-period indicators have improved.
4-hour timeframe:
On the 4-hour timeframe, a strong bullish candle is formed, and the closing price is close to the session high. It completes an engulfing pattern over the previous bearish candle, suggesting that near-term buying momentum has recovered somewhat. The chart is currently probing upward toward the key resistance around 2730, where a large amount of trapped-positions selling pressure is likely concentrated. The focus is on whether price can achieve an effective breakout. If pressure causes a pullback at this level, the market may return to range-bound consolidation. Avoid chasing higher levels blindly when entering; you must control position sizing and manage risk.
Short-term trading suggestions
Erbing: Short at 2750–2790, targets: 2630–2670
Early in the morning, Erbing fell from 2720 to 2668, dropping 52 points in the short term. It moved in tandem with the broader market as both faced pressure and headed downward, releasing short-term selling pressure. Next, focus on whether support below can hold. If support stays intact, a rebound and repair is likely. If support is broken to the downside with increased volume, the pullback room will continue to expand. From the midday rebound off 2668 to 2717, price rose about 48 points—this is a short-term repair following the early-morning pullback. It suggests there is support/resumption around 2660–2670, but the rebound strength is still insufficient to confirm a trend strengthening. Going forward, the key is to watch whether 2700–2720 can hold steady. If price returns above 2720 with volume, the short-term repair is likely to have stronger continuity.
Erbing daily timeframe:
On the daily timeframe, candles alternate with small yin and small yang, showing that bulls and bears are locked in a tug-of-war. On the 4-hour timeframe, the DIF line crosses above the DEA to form a golden cross, and MACD’s red histogram appears, indicating that short-term bullish momentum has warmed up to some extent. However, this signal only reflects short-term repair. Until there is a valid breakout above the overhead pressure level, it should not be treated as a trend reversal. Instead, you can consider placing short positions in batches based on below the resistance zone, while setting stop-losses to guard against the risk of a breakout upward. Do not blindly go long just because short-period indicators have improved.
4-hour timeframe:
On the 4-hour timeframe, a strong bullish candle is formed, and the closing price is close to the session high. It completes an engulfing pattern over the previous bearish candle, suggesting that near-term buying momentum has recovered somewhat. The chart is currently probing upward toward the key resistance around 2730, where a large amount of trapped-positions selling pressure is likely concentrated. The focus is on whether price can achieve an effective breakout. If pressure causes a pullback at this level, the market may return to range-bound consolidation. Avoid chasing higher levels blindly when entering; you must control position sizing and manage risk.
Short-term trading suggestions
Erbing: Short at 2750–2790, targets: 2630–2670



101
·
--
9.29 Big Pie Market Analysis
Hello everyone, I’m YuanZhuo Analysis. In the early-morning hours, the big pie (Bitcoin) quickly dropped from 84,300 to 82,800. The short-term pullback was nearly 1,500 points. Heavy sell pressure concentrated and released, driving the price to probe quickly lower. The chart shows clear short-term weakness under pressure. During midday, starting around 83,000, it gained momentum upward, with the high reaching 84,200—pushing up about 1,200 points in the short term. Buy orders clustered at the low levels, and the market then saw a fast rebound.
Next, the key is to watch whether the breakout above nearby resistance is truly effective. If price meets resistance and stalls, the market may drop again.
Big Pie (Daily timeframe): Although the current price has shown a clear retracement, it is still holding above the key support zone of 82,200–82,300. Looking back at the move: it began rising from the 57,000 low, then after a second stabilization at 74,900, it surged to 87,300. That level broke above the previous high. The current pullback is essentially a pullback/confirmation after the breakout. As long as support at 82,200–82,300 is not decisively broken, the daily uptrend structure has not been completely invalidated. You should not conclude a trend reversal and move into a downtrend solely because of short-term weakness. However, the 82,800 support has already been tested, and short-term bullish strength is noticeably weaker than before. The market still needs to be observed for how support is being absorbed.
4-Hour timeframe: The 4-hour chart is still being suppressed by the double-top structure formed around the earlier 87,300 area. Price has struck that high twice, but both times failed and pulled back. It also effectively broke below the key support at 85,100. After that, multiple rebounds were unable to regain this level, and the chart shows weak characteristics: highs gradually moving lower, and rebounds being easy to press down. Previously, 82,800–85,200 was the core consolidation range. After the breakdown, price moved to the lower edge of that range, and overall it remains in a weak consolidation pattern. If support at 82,500 breaks, further downside room will open up. Only by holding 82,500, and then regaining above 83,500 and 84,000, will the short-term structure have a chance to repair and improve.
At the current stage, the big pie has entered a correction period. Volume and price are contracting together, forming a ‘volume-decline pullback’ pattern. In the broader macro picture, October rate-hike expectations have risen to over 70%, yet Bitcoin did not follow with a sharp drop. Inside the market, demand-driven buy orders provide some support strength. Signals of divergence have appeared in indicators on the larger cycle. For reference, after the August period of increased volume and subsequent sideways movement: earlier price rose to make four consecutive higher highs, then pulled back from around 82,000 to 75,000. If over the next two days price decisively breaks below the 82,000 support, and further probes toward the 80,000 psychological level, that area is worth paying special attention to for setting up opportunities.
Short-term trading suggestions
Big Pie: Sell/short 85,200–86,200, targets: 82,000–83,000
9.29 Big Pie Market Analysis
Hello everyone, I’m YuanZhuo Analysis. In the early-morning hours, the big pie (Bitcoin) quickly dropped from 84,300 to 82,800. The short-term pullback was nearly 1,500 points. Heavy sell pressure concentrated and released, driving the price to probe quickly lower. The chart shows clear short-term weakness under pressure. During midday, starting around 83,000, it gained momentum upward, with the high reaching 84,200—pushing up about 1,200 points in the short term. Buy orders clustered at the low levels, and the market then saw a fast rebound.
Next, the key is to watch whether the breakout above nearby resistance is truly effective. If price meets resistance and stalls, the market may drop again.
Big Pie (Daily timeframe): Although the current price has shown a clear retracement, it is still holding above the key support zone of 82,200–82,300. Looking back at the move: it began rising from the 57,000 low, then after a second stabilization at 74,900, it surged to 87,300. That level broke above the previous high. The current pullback is essentially a pullback/confirmation after the breakout. As long as support at 82,200–82,300 is not decisively broken, the daily uptrend structure has not been completely invalidated. You should not conclude a trend reversal and move into a downtrend solely because of short-term weakness. However, the 82,800 support has already been tested, and short-term bullish strength is noticeably weaker than before. The market still needs to be observed for how support is being absorbed.
4-Hour timeframe: The 4-hour chart is still being suppressed by the double-top structure formed around the earlier 87,300 area. Price has struck that high twice, but both times failed and pulled back. It also effectively broke below the key support at 85,100. After that, multiple rebounds were unable to regain this level, and the chart shows weak characteristics: highs gradually moving lower, and rebounds being easy to press down. Previously, 82,800–85,200 was the core consolidation range. After the breakdown, price moved to the lower edge of that range, and overall it remains in a weak consolidation pattern. If support at 82,500 breaks, further downside room will open up. Only by holding 82,500, and then regaining above 83,500 and 84,000, will the short-term structure have a chance to repair and improve.
At the current stage, the big pie has entered a correction period. Volume and price are contracting together, forming a ‘volume-decline pullback’ pattern. In the broader macro picture, October rate-hike expectations have risen to over 70%, yet Bitcoin did not follow with a sharp drop. Inside the market, demand-driven buy orders provide some support strength. Signals of divergence have appeared in indicators on the larger cycle. For reference, after the August period of increased volume and subsequent sideways movement: earlier price rose to make four consecutive higher highs, then pulled back from around 82,000 to 75,000. If over the next two days price decisively breaks below the 82,000 support, and further probes toward the 80,000 psychological level, that area is worth paying special attention to for setting up opportunities.
Short-term trading suggestions
Big Pie: Sell/short 85,200–86,200, targets: 82,000–83,000
Hello everyone, I’m YuanZhuo Analysis. In the early-morning hours, the big pie (Bitcoin) quickly dropped from 84,300 to 82,800. The short-term pullback was nearly 1,500 points. Heavy sell pressure concentrated and released, driving the price to probe quickly lower. The chart shows clear short-term weakness under pressure. During midday, starting around 83,000, it gained momentum upward, with the high reaching 84,200—pushing up about 1,200 points in the short term. Buy orders clustered at the low levels, and the market then saw a fast rebound.
Next, the key is to watch whether the breakout above nearby resistance is truly effective. If price meets resistance and stalls, the market may drop again.
Big Pie (Daily timeframe): Although the current price has shown a clear retracement, it is still holding above the key support zone of 82,200–82,300. Looking back at the move: it began rising from the 57,000 low, then after a second stabilization at 74,900, it surged to 87,300. That level broke above the previous high. The current pullback is essentially a pullback/confirmation after the breakout. As long as support at 82,200–82,300 is not decisively broken, the daily uptrend structure has not been completely invalidated. You should not conclude a trend reversal and move into a downtrend solely because of short-term weakness. However, the 82,800 support has already been tested, and short-term bullish strength is noticeably weaker than before. The market still needs to be observed for how support is being absorbed.
4-Hour timeframe: The 4-hour chart is still being suppressed by the double-top structure formed around the earlier 87,300 area. Price has struck that high twice, but both times failed and pulled back. It also effectively broke below the key support at 85,100. After that, multiple rebounds were unable to regain this level, and the chart shows weak characteristics: highs gradually moving lower, and rebounds being easy to press down. Previously, 82,800–85,200 was the core consolidation range. After the breakdown, price moved to the lower edge of that range, and overall it remains in a weak consolidation pattern. If support at 82,500 breaks, further downside room will open up. Only by holding 82,500, and then regaining above 83,500 and 84,000, will the short-term structure have a chance to repair and improve.
At the current stage, the big pie has entered a correction period. Volume and price are contracting together, forming a ‘volume-decline pullback’ pattern. In the broader macro picture, October rate-hike expectations have risen to over 70%, yet Bitcoin did not follow with a sharp drop. Inside the market, demand-driven buy orders provide some support strength. Signals of divergence have appeared in indicators on the larger cycle. For reference, after the August period of increased volume and subsequent sideways movement: earlier price rose to make four consecutive higher highs, then pulled back from around 82,000 to 75,000. If over the next two days price decisively breaks below the 82,000 support, and further probes toward the 80,000 psychological level, that area is worth paying special attention to for setting up opportunities.
Short-term trading suggestions
Big Pie: Sell/short 85,200–86,200, targets: 82,000–83,000



1
97
·
--
The market arrives as scheduled, and the orders land smoothly.
Big BTC 84335 in, 83118 out—held down 1217 points, profit 8661 USD
Small BTC 2717 in, 2674 out—held down 43 points, profit 7013 USD
Long-term profits come from a system, not luck. Execute with good defense and take-profit discipline. In this kind of market, if you have profit, take it—otherwise you go to zero.
The market arrives as scheduled, and the orders land smoothly.
Big BTC 84335 in, 83118 out—held down 1217 points, profit 8661 USD
Small BTC 2717 in, 2674 out—held down 43 points, profit 7013 USD
Long-term profits come from a system, not luck. Execute with good defense and take-profit discipline. In this kind of market, if you have profit, take it—otherwise you go to zero.
Big BTC 84335 in, 83118 out—held down 1217 points, profit 8661 USD
Small BTC 2717 in, 2674 out—held down 43 points, profit 7013 USD
Long-term profits come from a system, not luck. Execute with good defense and take-profit discipline. In this kind of market, if you have profit, take it—otherwise you go to zero.
远卓分析
·
--
Just at the right time, yesterday’s after-hours rally came—everything was written according to the script. The market is never short of opportunities; what’s missing is the drive to patiently wait for them. The short positions from yesterday’s after-hours proved correct: we entered at the highest point and exited at the lowest level.



284
·
--
Just at the right time, yesterday’s after-hours rally came—everything was written according to the script. The market is never short of opportunities; what’s missing is the drive to patiently wait for them. The short positions from yesterday’s after-hours proved correct: we entered at the highest point and exited at the lowest level.
Just at the right time, yesterday’s after-hours rally came—everything was written according to the script. The market is never short of opportunities; what’s missing is the drive to patiently wait for them. The short positions from yesterday’s after-hours proved correct: we entered at the highest point and exited at the lowest level.



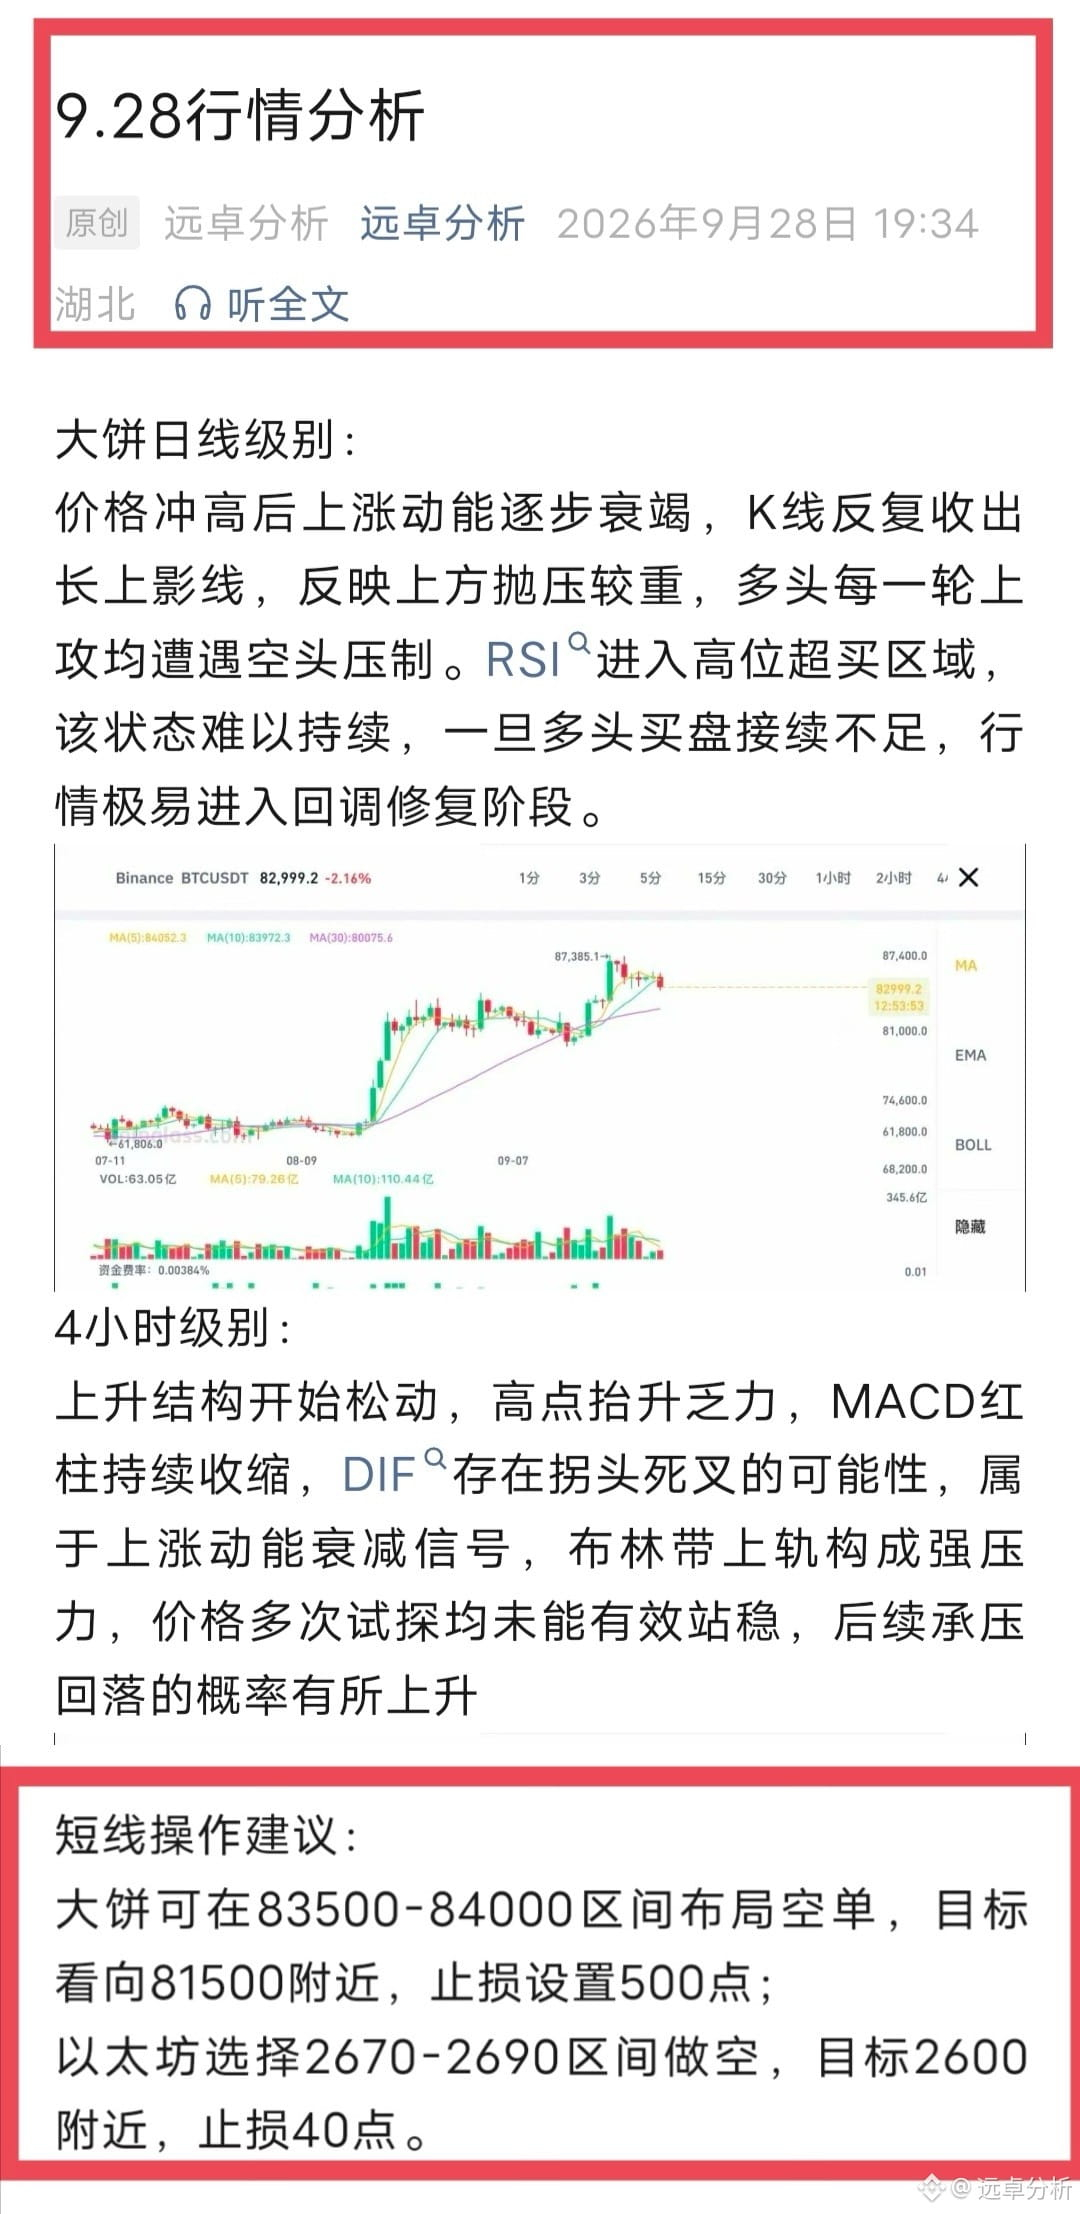
1
123
·
--
9.29 Morning Market Review
During the early-morning hours, the crypto market moved down in sync. BTC slid from 84,300 all the way to 82,800, dropping nearly 1,500 points; ETH dipped from 2,720 to 2,668, a pullback of 52 points. The leading decline in BTC weakened the overall order book. At high levels, profit-taking positions were concentrated and exited in bulk; long leverage positions were liquidated en masse, causing short-term upward momentum to fade quickly. This round appears to be a concentrated pullback following a surge, with selling pressure releasing heavily. Next, focus on the strength of support below. If support holds, the market may see a short-term rebound and repair; if support is breached on increasing volume, the downside room will continue to expand.
The near-term direction has gradually become clearer, and overall market sentiment is tilted bearish. The sell-off momentum resulting from the prior surge-and-retrace has not fully played out yet, and there remains further downside potential. The daily chart shows a continuous pattern of drifting lower; the support levels below are moving down persistently. The market keeps probing lows repeatedly, using this to build energy for a subsequent rebound. Compared with the earlier upward move in this cycle, bearish force is increasingly taking control of the market. Most likely, price will revisit the prior breakout/launch area to test the strength of buy-side order support there. Whether the bearish push can continue depends on whether key support breaks, and how trading volume (liquidity/volume) aligns.
Short-term trade ideas:
BTC 83,500–84,000 target 81,500–81,000
ETH 2,670–2,690 target 2,640–2,620
9.29 Morning Market Review
During the early-morning hours, the crypto market moved down in sync. BTC slid from 84,300 all the way to 82,800, dropping nearly 1,500 points; ETH dipped from 2,720 to 2,668, a pullback of 52 points. The leading decline in BTC weakened the overall order book. At high levels, profit-taking positions were concentrated and exited in bulk; long leverage positions were liquidated en masse, causing short-term upward momentum to fade quickly. This round appears to be a concentrated pullback following a surge, with selling pressure releasing heavily. Next, focus on the strength of support below. If support holds, the market may see a short-term rebound and repair; if support is breached on increasing volume, the downside room will continue to expand.
The near-term direction has gradually become clearer, and overall market sentiment is tilted bearish. The sell-off momentum resulting from the prior surge-and-retrace has not fully played out yet, and there remains further downside potential. The daily chart shows a continuous pattern of drifting lower; the support levels below are moving down persistently. The market keeps probing lows repeatedly, using this to build energy for a subsequent rebound. Compared with the earlier upward move in this cycle, bearish force is increasingly taking control of the market. Most likely, price will revisit the prior breakout/launch area to test the strength of buy-side order support there. Whether the bearish push can continue depends on whether key support breaks, and how trading volume (liquidity/volume) aligns.
Short-term trade ideas:
BTC 83,500–84,000 target 81,500–81,000
ETH 2,670–2,690 target 2,640–2,620
During the early-morning hours, the crypto market moved down in sync. BTC slid from 84,300 all the way to 82,800, dropping nearly 1,500 points; ETH dipped from 2,720 to 2,668, a pullback of 52 points. The leading decline in BTC weakened the overall order book. At high levels, profit-taking positions were concentrated and exited in bulk; long leverage positions were liquidated en masse, causing short-term upward momentum to fade quickly. This round appears to be a concentrated pullback following a surge, with selling pressure releasing heavily. Next, focus on the strength of support below. If support holds, the market may see a short-term rebound and repair; if support is breached on increasing volume, the downside room will continue to expand.
The near-term direction has gradually become clearer, and overall market sentiment is tilted bearish. The sell-off momentum resulting from the prior surge-and-retrace has not fully played out yet, and there remains further downside potential. The daily chart shows a continuous pattern of drifting lower; the support levels below are moving down persistently. The market keeps probing lows repeatedly, using this to build energy for a subsequent rebound. Compared with the earlier upward move in this cycle, bearish force is increasingly taking control of the market. Most likely, price will revisit the prior breakout/launch area to test the strength of buy-side order support there. Whether the bearish push can continue depends on whether key support breaks, and how trading volume (liquidity/volume) aligns.
Short-term trade ideas:
BTC 83,500–84,000 target 81,500–81,000
ETH 2,670–2,690 target 2,640–2,620
156
·
--

Article
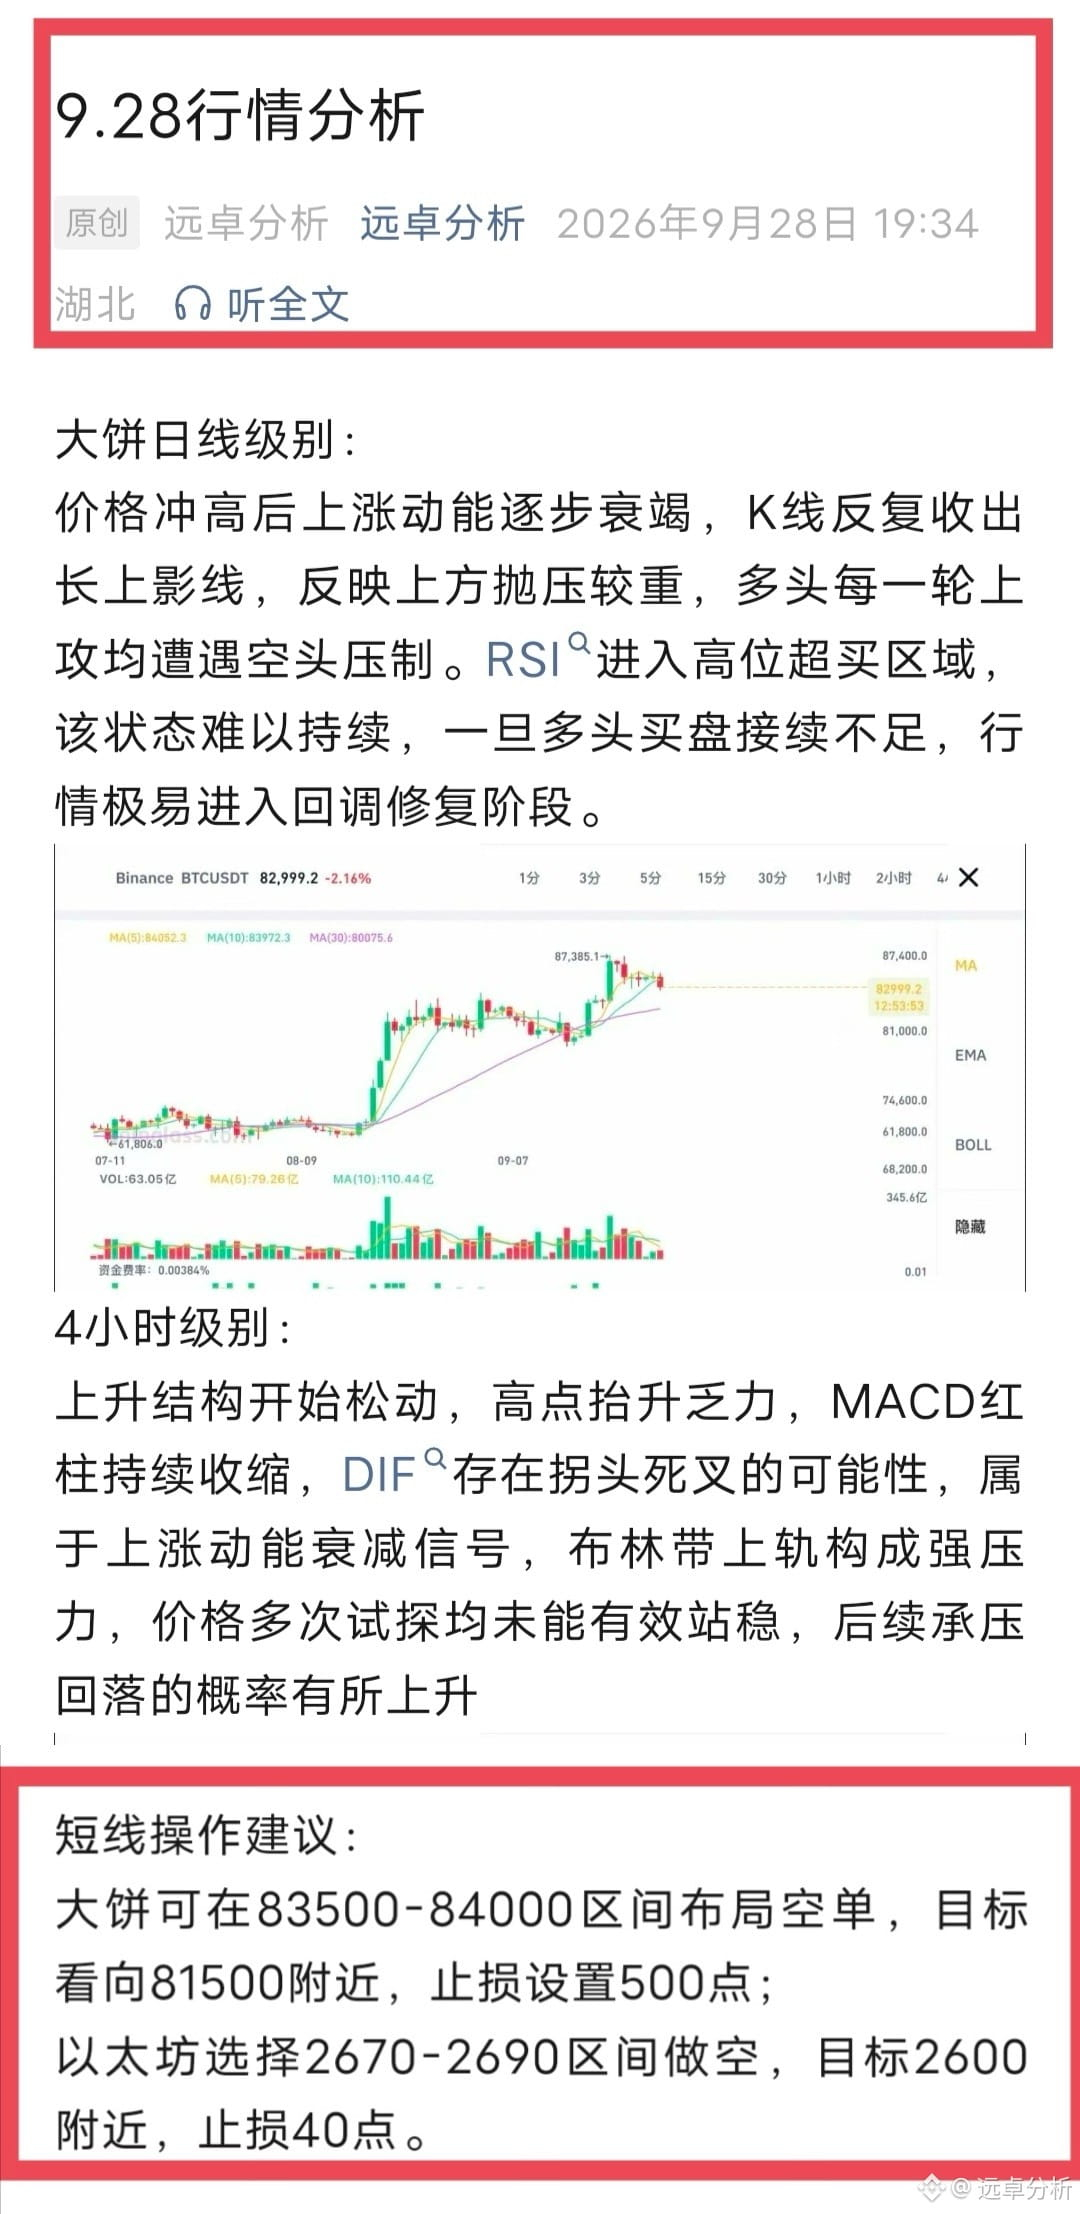
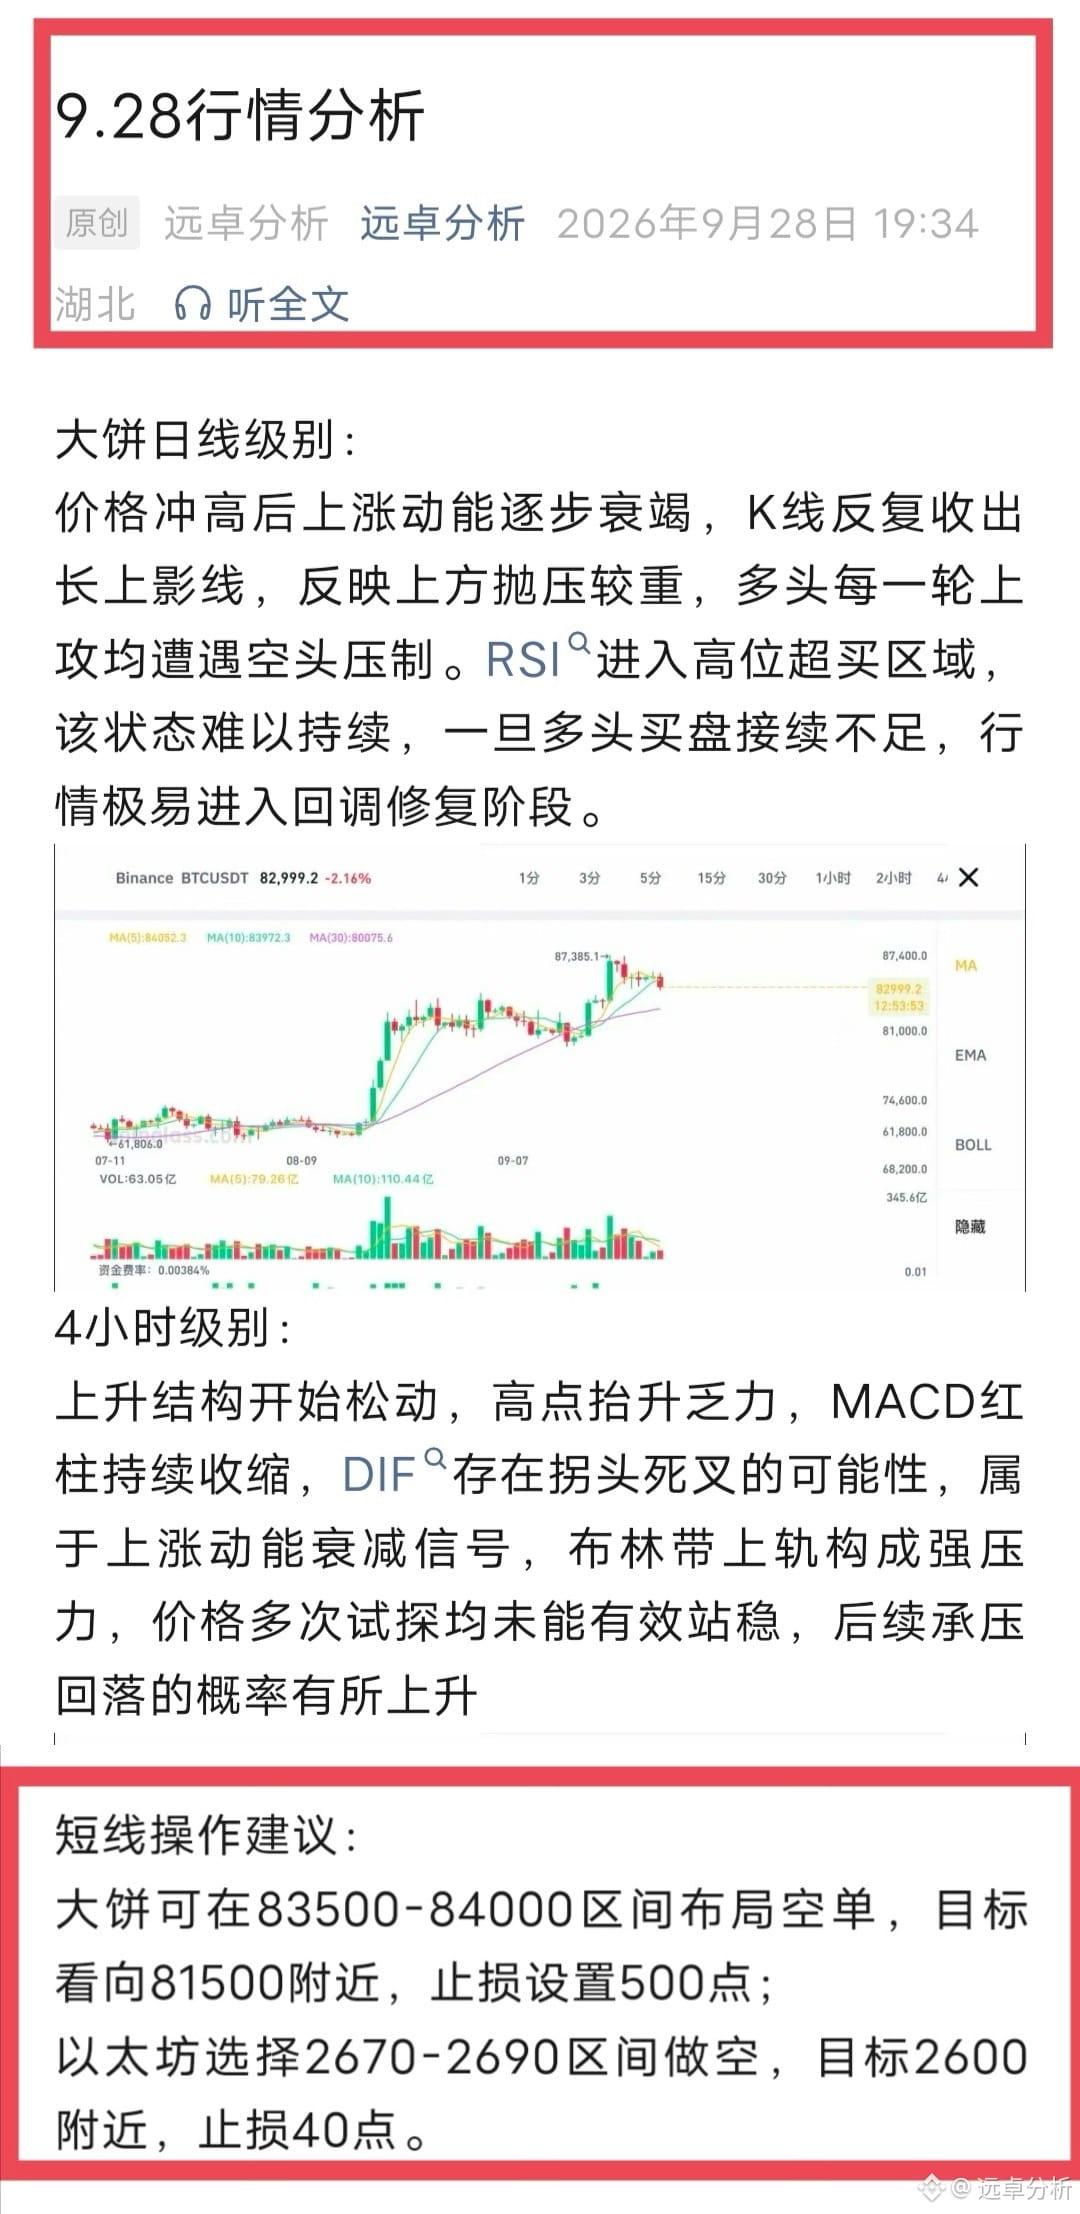
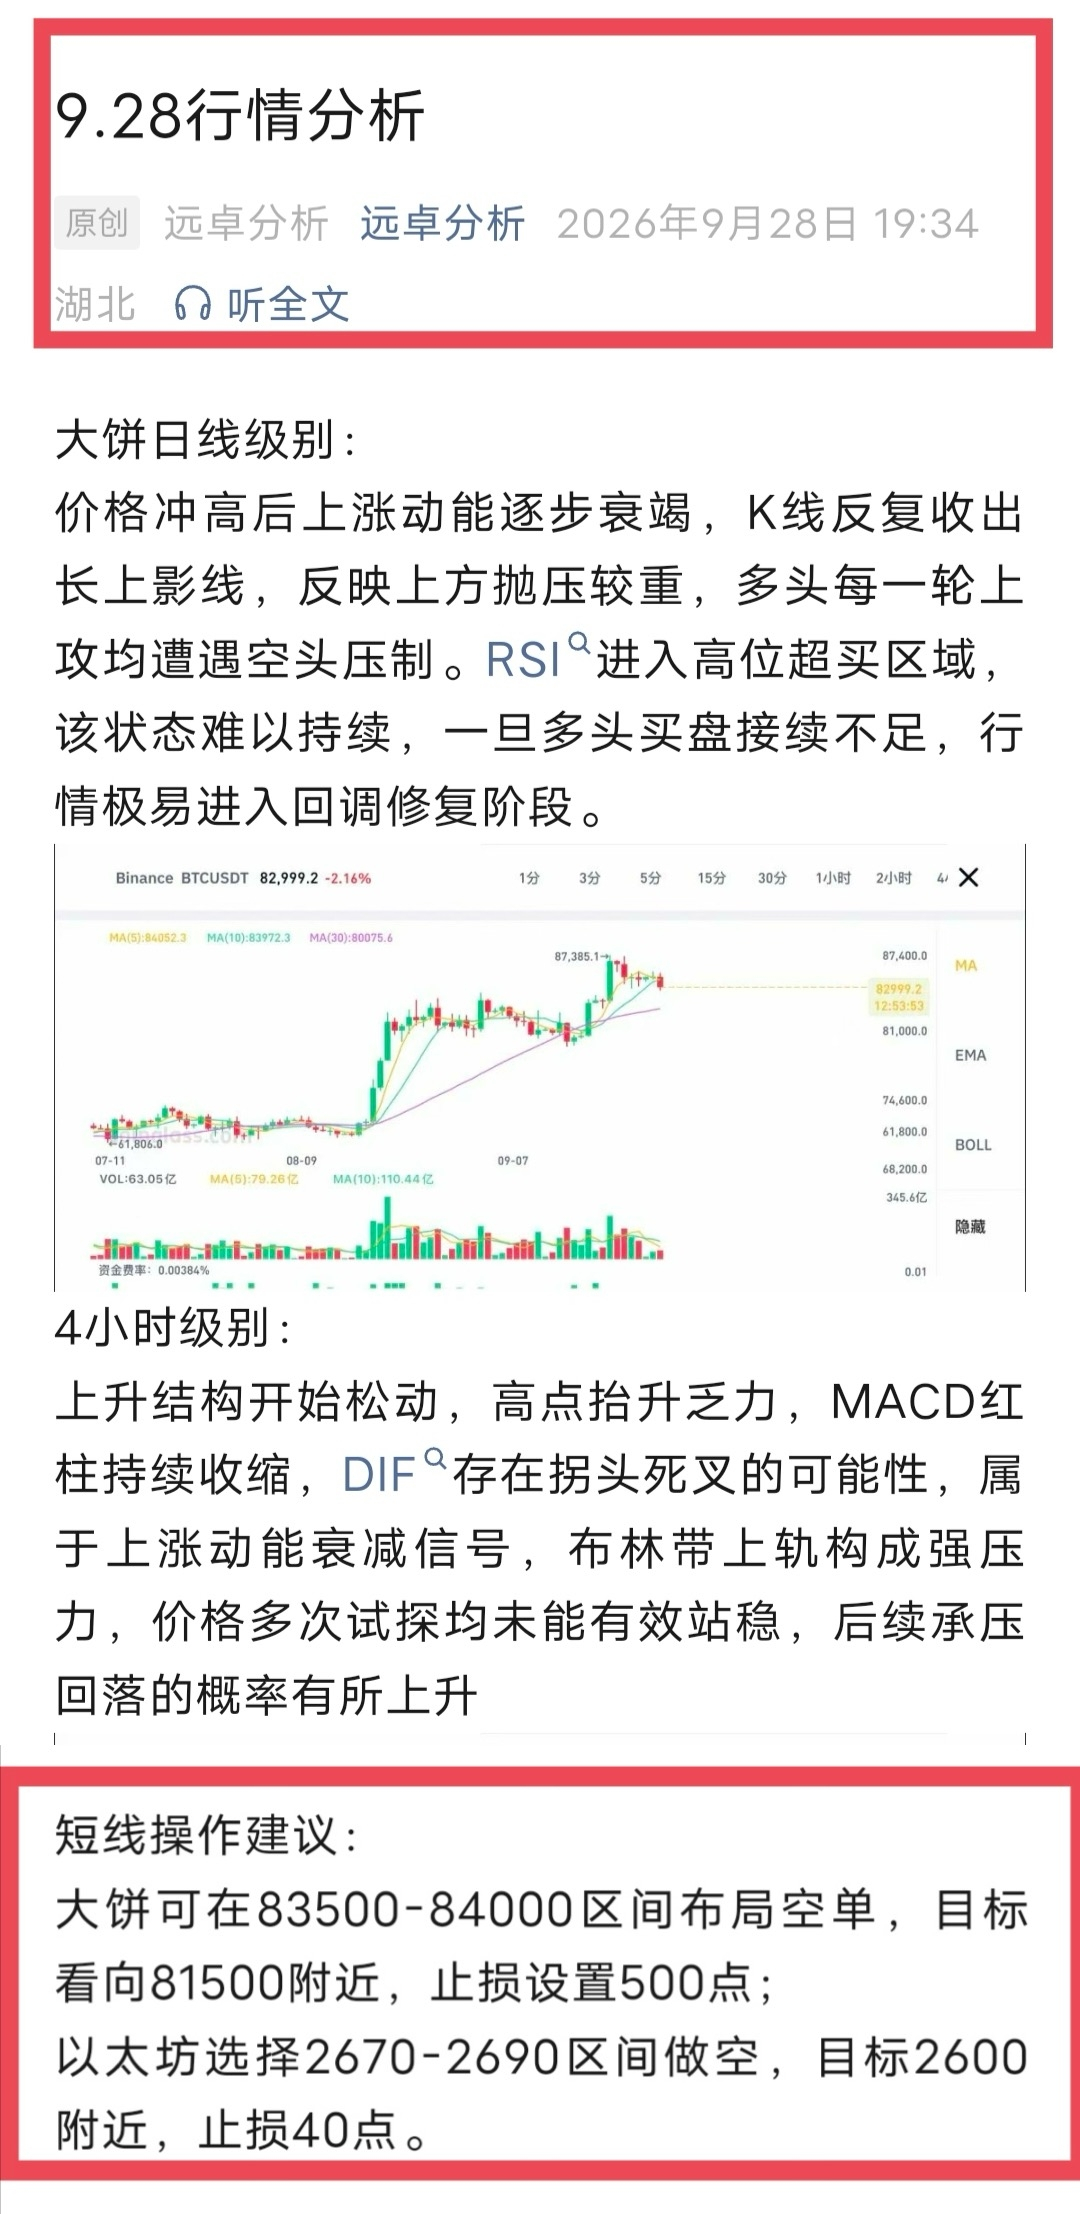
9.28 Market Analysis RecapHello everyone, I am Yuzhuo Analysis. Today, Bitcoin fell from 85,000 to 82,800, down nearly 2,200 points. Ethereum fell from 2,702 to 2,650, down nearly 52 points. The two major coins are both facing downward pressure and selling intensified at high levels. Leveraged long positions saw stop-losses trigger in large volume. In the short term, bullish momentum has quickly weakened. Next, we should focus on how strong the buying support is below. If the support holds, there is a possibility of a technical rebound and repair. Once there is a decisive breakdown of the key support with increased volume, the downside pullback room will expand further.
Big Pie (BTC) is under pressure and weakening on the chart, and the market has entered a rapid pullback. The recent highs keep moving lower, and the momentum for the bulls to counterattack has clearly exhausted. Selling pressure has been concentrated and released. In the short term, bearish force has taken the lead, so it is necessary to continuously monitor the effectiveness of the support below.
9.28 Market Analysis Recap
Hello everyone, I am Yuzhuo Analysis. Today, Bitcoin fell from 85,000 to 82,800, down nearly 2,200 points. Ethereum fell from 2,702 to 2,650, down nearly 52 points. The two major coins are both facing downward pressure and selling intensified at high levels. Leveraged long positions saw stop-losses trigger in large volume. In the short term, bullish momentum has quickly weakened. Next, we should focus on how strong the buying support is below. If the support holds, there is a possibility of a technical rebound and repair. Once there is a decisive breakdown of the key support with increased volume, the downside pullback room will expand further.
Big Pie (BTC) is under pressure and weakening on the chart, and the market has entered a rapid pullback. The recent highs keep moving lower, and the momentum for the bulls to counterattack has clearly exhausted. Selling pressure has been concentrated and released. In the short term, bearish force has taken the lead, so it is necessary to continuously monitor the effectiveness of the support below.
Big Pie (BTC) is under pressure and weakening on the chart, and the market has entered a rapid pullback. The recent highs keep moving lower, and the momentum for the bulls to counterattack has clearly exhausted. Selling pressure has been concentrated and released. In the short term, bearish force has taken the lead, so it is necessary to continuously monitor the effectiveness of the support below.
219
·
--
9.28 Morning Brief Analysis:
#Bitwise提交NEAR现货ETF最终招股书 #Bitget黑客转移8300万美元被盗XRP #SOL现货ETF周净流入1.88亿美元 #狗狗币ETF创上市来最大周流入
Hello everyone, I am Yuanzhuo Analysis. Looking back at yesterday’s market action, based on the overall market structure: yesterday, BTC fell from the 85,100 level, with the low dropping to the 84,100 range. The short-term decline totaled about 1,000 points. ETH faced pressure starting from 2,722 and pulled back to around 2,673, a short-term retracement of 39 points.
On the chart, overhead resistance is clearly suppressing price. The momentum of the bulls has somewhat slowed, and a round of short-term pullback has formed. The key focus now is the effectiveness of the support below. If support holds, the market may once again stabilize and repair through consolidation. If support is broken through effectively, the downside pullback space will open up further.
The market is still moving within an upward channel. Yesterday saw a high followed by a pullback; during the midnight phase, there was a round of downward probing. However, the bears did not form sustained downside momentum. After probing the lows, price closed with a strong bullish candlestick, and trading has reopened to the upside. This current pullback, in essence, is a test and confirmation of the validity of the low-level support below.
On the weekly structure, the market has completed a deep washout earlier. After probing the lows, a strongly consecutive bullish rebound pattern emerged. In recent weeks, the weekly candles show full bodies, and bullish momentum continues to release. Price has already moved out of the lower band range, has held above the weekly mid-band, and is now challenging the upper weekly band. This pattern reflects that the medium- to long-term bottom support is solid. Once a trend on the larger timeframe is established, it is unlikely to reverse easily in the short term, and it also provides macro support for the idea of going long on pullbacks. In terms of execution, avoid blindly chasing longs. First wait for the price to pull back to test support, and only after signs of stabilization appear, scale into long positions in batches. At the same time, manage risk strictly: if there is a high-volume breakdown of a key support level, the trend may weaken.
Short-term trading suggestions:
BTC: Go long around 83,400–83,000. Target: 85,500–86,000.
ETH: Go long around 2,640–2,620. Target: 2,710–2,730.
9.28 Morning Brief Analysis:
#Bitwise提交NEAR现货ETF最终招股书 #Bitget黑客转移8300万美元被盗XRP #SOL现货ETF周净流入1.88亿美元 #狗狗币ETF创上市来最大周流入
Hello everyone, I am Yuanzhuo Analysis. Looking back at yesterday’s market action, based on the overall market structure: yesterday, BTC fell from the 85,100 level, with the low dropping to the 84,100 range. The short-term decline totaled about 1,000 points. ETH faced pressure starting from 2,722 and pulled back to around 2,673, a short-term retracement of 39 points.
On the chart, overhead resistance is clearly suppressing price. The momentum of the bulls has somewhat slowed, and a round of short-term pullback has formed. The key focus now is the effectiveness of the support below. If support holds, the market may once again stabilize and repair through consolidation. If support is broken through effectively, the downside pullback space will open up further.
The market is still moving within an upward channel. Yesterday saw a high followed by a pullback; during the midnight phase, there was a round of downward probing. However, the bears did not form sustained downside momentum. After probing the lows, price closed with a strong bullish candlestick, and trading has reopened to the upside. This current pullback, in essence, is a test and confirmation of the validity of the low-level support below.
On the weekly structure, the market has completed a deep washout earlier. After probing the lows, a strongly consecutive bullish rebound pattern emerged. In recent weeks, the weekly candles show full bodies, and bullish momentum continues to release. Price has already moved out of the lower band range, has held above the weekly mid-band, and is now challenging the upper weekly band. This pattern reflects that the medium- to long-term bottom support is solid. Once a trend on the larger timeframe is established, it is unlikely to reverse easily in the short term, and it also provides macro support for the idea of going long on pullbacks. In terms of execution, avoid blindly chasing longs. First wait for the price to pull back to test support, and only after signs of stabilization appear, scale into long positions in batches. At the same time, manage risk strictly: if there is a high-volume breakdown of a key support level, the trend may weaken.
Short-term trading suggestions:
BTC: Go long around 83,400–83,000. Target: 85,500–86,000.
ETH: Go long around 2,640–2,620. Target: 2,710–2,730.
#Bitwise提交NEAR现货ETF最终招股书 #Bitget黑客转移8300万美元被盗XRP #SOL现货ETF周净流入1.88亿美元 #狗狗币ETF创上市来最大周流入
Hello everyone, I am Yuanzhuo Analysis. Looking back at yesterday’s market action, based on the overall market structure: yesterday, BTC fell from the 85,100 level, with the low dropping to the 84,100 range. The short-term decline totaled about 1,000 points. ETH faced pressure starting from 2,722 and pulled back to around 2,673, a short-term retracement of 39 points.
On the chart, overhead resistance is clearly suppressing price. The momentum of the bulls has somewhat slowed, and a round of short-term pullback has formed. The key focus now is the effectiveness of the support below. If support holds, the market may once again stabilize and repair through consolidation. If support is broken through effectively, the downside pullback space will open up further.
The market is still moving within an upward channel. Yesterday saw a high followed by a pullback; during the midnight phase, there was a round of downward probing. However, the bears did not form sustained downside momentum. After probing the lows, price closed with a strong bullish candlestick, and trading has reopened to the upside. This current pullback, in essence, is a test and confirmation of the validity of the low-level support below.
On the weekly structure, the market has completed a deep washout earlier. After probing the lows, a strongly consecutive bullish rebound pattern emerged. In recent weeks, the weekly candles show full bodies, and bullish momentum continues to release. Price has already moved out of the lower band range, has held above the weekly mid-band, and is now challenging the upper weekly band. This pattern reflects that the medium- to long-term bottom support is solid. Once a trend on the larger timeframe is established, it is unlikely to reverse easily in the short term, and it also provides macro support for the idea of going long on pullbacks. In terms of execution, avoid blindly chasing longs. First wait for the price to pull back to test support, and only after signs of stabilization appear, scale into long positions in batches. At the same time, manage risk strictly: if there is a high-volume breakdown of a key support level, the trend may weaken.
Short-term trading suggestions:
BTC: Go long around 83,400–83,000. Target: 85,500–86,000.
ETH: Go long around 2,640–2,620. Target: 2,710–2,730.
403
·
--
9.27 Morning Session Analysis
Bitcoin (BTC) rebounded from the 83,800 support zone, rallying up to 84,270—this round of the upswing reached 470 points. In the short term, the market is entering a phase of repair; bullish momentum has been temporarily released, and the price has warmed slightly. However, this rebound is only a range-bound correction within the broader channel—it has not broken through the key resistance zone above, and the higher-level structure still remains a consolidation pattern. The sustainability of the rebound still needs to be confirmed. If the upward momentum weakens later, there is still a possibility that the price will revisit and test support again.
Ethereum (ETH) started a mild rebound from the 2,680 area and moved up to 2,692, gaining 12 points this round. The market moved in tandem with BTC to repair as well, but the rebound strength is relatively weak—more like a short-term, small upward pulse, without showing an independent strong surge. The current market still maintains a narrow range consolidation, with limited bullish momentum. The resistance levels overhead still need to be tested. If incremental capital cannot keep flowing in, this mild rebound is unlikely to continue, and the price may be at risk of another pullback.
Trading Suggestions
BTC long from 83,800–83,500, target 85,000–85,500
ETH long from 2,670–2,680, target 2,720–2,740
#SEC称代币回购与网络升级不自动构成证券 #中美达成300亿美元关税削减共识 #Circle在Solana增发5亿枚USDC #贝莱德为Ondo开发代币化组合策略
9.27 Morning Session Analysis
Bitcoin (BTC) rebounded from the 83,800 support zone, rallying up to 84,270—this round of the upswing reached 470 points. In the short term, the market is entering a phase of repair; bullish momentum has been temporarily released, and the price has warmed slightly. However, this rebound is only a range-bound correction within the broader channel—it has not broken through the key resistance zone above, and the higher-level structure still remains a consolidation pattern. The sustainability of the rebound still needs to be confirmed. If the upward momentum weakens later, there is still a possibility that the price will revisit and test support again.
Ethereum (ETH) started a mild rebound from the 2,680 area and moved up to 2,692, gaining 12 points this round. The market moved in tandem with BTC to repair as well, but the rebound strength is relatively weak—more like a short-term, small upward pulse, without showing an independent strong surge. The current market still maintains a narrow range consolidation, with limited bullish momentum. The resistance levels overhead still need to be tested. If incremental capital cannot keep flowing in, this mild rebound is unlikely to continue, and the price may be at risk of another pullback.
Trading Suggestions
BTC long from 83,800–83,500, target 85,000–85,500
ETH long from 2,670–2,680, target 2,720–2,740
#SEC称代币回购与网络升级不自动构成证券 #中美达成300亿美元关税削减共识 #Circle在Solana增发5亿枚USDC #贝莱德为Ondo开发代币化组合策略
Bitcoin (BTC) rebounded from the 83,800 support zone, rallying up to 84,270—this round of the upswing reached 470 points. In the short term, the market is entering a phase of repair; bullish momentum has been temporarily released, and the price has warmed slightly. However, this rebound is only a range-bound correction within the broader channel—it has not broken through the key resistance zone above, and the higher-level structure still remains a consolidation pattern. The sustainability of the rebound still needs to be confirmed. If the upward momentum weakens later, there is still a possibility that the price will revisit and test support again.
Ethereum (ETH) started a mild rebound from the 2,680 area and moved up to 2,692, gaining 12 points this round. The market moved in tandem with BTC to repair as well, but the rebound strength is relatively weak—more like a short-term, small upward pulse, without showing an independent strong surge. The current market still maintains a narrow range consolidation, with limited bullish momentum. The resistance levels overhead still need to be tested. If incremental capital cannot keep flowing in, this mild rebound is unlikely to continue, and the price may be at risk of another pullback.
Trading Suggestions
BTC long from 83,800–83,500, target 85,000–85,500
ETH long from 2,670–2,680, target 2,720–2,740
#SEC称代币回购与网络升级不自动构成证券 #中美达成300亿美元关税削减共识 #Circle在Solana增发5亿枚USDC #贝莱德为Ondo开发代币化组合策略
167
·
--
9.24 morning session analysis
Bitcoin rebounded from 83,500 and moved up to 84,300; short-term buy pressure has driven a phase of recovery. The current market is only defined as a rebound, not the start of a new major uptrend. Do not blindly chase. Next, focus on the effectiveness of any breakout above the overhead resistance zone. If the upward push lacks strength, the market may pull back again.
At present, Ethereum is trading sideways around the 2,690 area. Short-term rebound momentum is limited, and the overall chart remains relatively weak. Price has temporarily stabilized around the MA5 and MA10 area, but it continues to be capped by the MA20. The MACD and the moving-average structure are aligned toward the bearish side; the bearish rhythm has not yet been reversed. If the rebound cannot hold, there is a possibility of another pullback and a move toward lower levels.
Short-term trading suggestions:
BTC (big coin) long: 83,500–84,000 targets: 85,500–86,000
ETH (small coin) long: 2,640–2,670 targets: 2,720–2,750
#AI股持续上涨还有哪些投资机会 #比特币现货ETF四日流入23.1亿美元 #比特币两度受阻87300美元 #BCH因CME期货上线涨约28% #华尔街盈利预期23周来首现看空
9.24 morning session analysis
Bitcoin rebounded from 83,500 and moved up to 84,300; short-term buy pressure has driven a phase of recovery. The current market is only defined as a rebound, not the start of a new major uptrend. Do not blindly chase. Next, focus on the effectiveness of any breakout above the overhead resistance zone. If the upward push lacks strength, the market may pull back again.
At present, Ethereum is trading sideways around the 2,690 area. Short-term rebound momentum is limited, and the overall chart remains relatively weak. Price has temporarily stabilized around the MA5 and MA10 area, but it continues to be capped by the MA20. The MACD and the moving-average structure are aligned toward the bearish side; the bearish rhythm has not yet been reversed. If the rebound cannot hold, there is a possibility of another pullback and a move toward lower levels.
Short-term trading suggestions:
BTC (big coin) long: 83,500–84,000 targets: 85,500–86,000
ETH (small coin) long: 2,640–2,670 targets: 2,720–2,750
#AI股持续上涨还有哪些投资机会 #比特币现货ETF四日流入23.1亿美元 #比特币两度受阻87300美元 #BCH因CME期货上线涨约28% #华尔街盈利预期23周来首现看空
Bitcoin rebounded from 83,500 and moved up to 84,300; short-term buy pressure has driven a phase of recovery. The current market is only defined as a rebound, not the start of a new major uptrend. Do not blindly chase. Next, focus on the effectiveness of any breakout above the overhead resistance zone. If the upward push lacks strength, the market may pull back again.
At present, Ethereum is trading sideways around the 2,690 area. Short-term rebound momentum is limited, and the overall chart remains relatively weak. Price has temporarily stabilized around the MA5 and MA10 area, but it continues to be capped by the MA20. The MACD and the moving-average structure are aligned toward the bearish side; the bearish rhythm has not yet been reversed. If the rebound cannot hold, there is a possibility of another pullback and a move toward lower levels.
Short-term trading suggestions:
BTC (big coin) long: 83,500–84,000 targets: 85,500–86,000
ETH (small coin) long: 2,640–2,670 targets: 2,720–2,750
#AI股持续上涨还有哪些投资机会 #比特币现货ETF四日流入23.1亿美元 #比特币两度受阻87300美元 #BCH因CME期货上线涨约28% #华尔街盈利预期23周来首现看空
128
·
--
Big pancake 86415 entered 85840 exited, took 575 points, profited $4000
Second pancake 2754 entered 2735 exited, took 19 points, profited $4200
Making money has never been about frequent trading—it’s about patiently holding the right positions. This short-term pullback played out as expected and the profits were taken. Catch the trend window, don’t open positions blindly, and wait for high-quality opportunities. Trading is all about selectivity and waiting.
#AI股持续上涨还有哪些投资机会 #华尔街盈利预期23周来首现看空 #比特币两度受阻87300美元 #美元指数时隔两月重上101 #BCH因CME期货上线涨约28%
Big pancake 86415 entered 85840 exited, took 575 points, profited $4000
Second pancake 2754 entered 2735 exited, took 19 points, profited $4200
Making money has never been about frequent trading—it’s about patiently holding the right positions. This short-term pullback played out as expected and the profits were taken. Catch the trend window, don’t open positions blindly, and wait for high-quality opportunities. Trading is all about selectivity and waiting.
#AI股持续上涨还有哪些投资机会 #华尔街盈利预期23周来首现看空 #比特币两度受阻87300美元 #美元指数时隔两月重上101 #BCH因CME期货上线涨约28%
Second pancake 2754 entered 2735 exited, took 19 points, profited $4200
Making money has never been about frequent trading—it’s about patiently holding the right positions. This short-term pullback played out as expected and the profits were taken. Catch the trend window, don’t open positions blindly, and wait for high-quality opportunities. Trading is all about selectivity and waiting.
#AI股持续上涨还有哪些投资机会 #华尔街盈利预期23周来首现看空 #比特币两度受阻87300美元 #美元指数时隔两月重上101 #BCH因CME期货上线涨约28%



53
·
--
Ethereum Analysis
On the daily timeframe, Ethereum’s EMA moving-average system remains in a bullish divergent formation, with a solid foundation for the medium- to long-term trend. The MACD indicates that the bullish momentum driving the short term has slowed somewhat; however, both indicator lines have continued running above the zero axis, suggesting that this pullback is a form of corrective repair within a strong trend rather than a signal of trend reversal.
From the Bollinger Bands perspective, price has retraced to the midline at 2727, which is the key boundary level for the current struggle between bulls and bears. If price stabilizes here, the market has the potential to retest the upper band again around 2800. If the bears gain strength and produce a valid breakdown, then the lower band at 2653 will become the next critical defensive support.
Overall assessment: the medium- to long-term upward structure has not been damaged, but it is still necessary to guard against the risk that the short-term pullback may extend further.
On the 4-hour timeframe, Ethereum has started a bottom-reversal and impulsive wave from the low point at 1503.60, with the larger-scale uptrend structure remaining intact. The current market is in the ABC consolidation/relay adjustment phase within an upward sequence, which represents accumulation and consolidation before the arrival of the next impulsive rise.
2630–2700 is the key short-term support zone. If this support band holds, this round of correction will most likely be completed, and the following step is likely to launch the 3rd wave impulsive up-move. Conversely, if price produces a valid breakdown below the daily box’s upper edge at 2560, the correction level would expand and additional downside room would be released.
“Erbing” (Binance/2-coin) Longs: 2700–2670 long. Targets: 2740–2760.
“Erbing” (Binance/2-coin) Shorts: 2740–2760 short. Targets: 2650–2630.
Ethereum Analysis
On the daily timeframe, Ethereum’s EMA moving-average system remains in a bullish divergent formation, with a solid foundation for the medium- to long-term trend. The MACD indicates that the bullish momentum driving the short term has slowed somewhat; however, both indicator lines have continued running above the zero axis, suggesting that this pullback is a form of corrective repair within a strong trend rather than a signal of trend reversal.
From the Bollinger Bands perspective, price has retraced to the midline at 2727, which is the key boundary level for the current struggle between bulls and bears. If price stabilizes here, the market has the potential to retest the upper band again around 2800. If the bears gain strength and produce a valid breakdown, then the lower band at 2653 will become the next critical defensive support.
Overall assessment: the medium- to long-term upward structure has not been damaged, but it is still necessary to guard against the risk that the short-term pullback may extend further.
On the 4-hour timeframe, Ethereum has started a bottom-reversal and impulsive wave from the low point at 1503.60, with the larger-scale uptrend structure remaining intact. The current market is in the ABC consolidation/relay adjustment phase within an upward sequence, which represents accumulation and consolidation before the arrival of the next impulsive rise.
2630–2700 is the key short-term support zone. If this support band holds, this round of correction will most likely be completed, and the following step is likely to launch the 3rd wave impulsive up-move. Conversely, if price produces a valid breakdown below the daily box’s upper edge at 2560, the correction level would expand and additional downside room would be released.
“Erbing” (Binance/2-coin) Longs: 2700–2670 long. Targets: 2740–2760.
“Erbing” (Binance/2-coin) Shorts: 2740–2760 short. Targets: 2650–2630.
On the daily timeframe, Ethereum’s EMA moving-average system remains in a bullish divergent formation, with a solid foundation for the medium- to long-term trend. The MACD indicates that the bullish momentum driving the short term has slowed somewhat; however, both indicator lines have continued running above the zero axis, suggesting that this pullback is a form of corrective repair within a strong trend rather than a signal of trend reversal.
From the Bollinger Bands perspective, price has retraced to the midline at 2727, which is the key boundary level for the current struggle between bulls and bears. If price stabilizes here, the market has the potential to retest the upper band again around 2800. If the bears gain strength and produce a valid breakdown, then the lower band at 2653 will become the next critical defensive support.
Overall assessment: the medium- to long-term upward structure has not been damaged, but it is still necessary to guard against the risk that the short-term pullback may extend further.
On the 4-hour timeframe, Ethereum has started a bottom-reversal and impulsive wave from the low point at 1503.60, with the larger-scale uptrend structure remaining intact. The current market is in the ABC consolidation/relay adjustment phase within an upward sequence, which represents accumulation and consolidation before the arrival of the next impulsive rise.
2630–2700 is the key short-term support zone. If this support band holds, this round of correction will most likely be completed, and the following step is likely to launch the 3rd wave impulsive up-move. Conversely, if price produces a valid breakdown below the daily box’s upper edge at 2560, the correction level would expand and additional downside room would be released.
“Erbing” (Binance/2-coin) Longs: 2700–2670 long. Targets: 2740–2760.
“Erbing” (Binance/2-coin) Shorts: 2740–2760 short. Targets: 2650–2630.



28
·
--
9.23 Bitcoin Analysis
The intermediate uptrend structure on the Bitcoin daily timeframe remains intact. The EMA moving-average system is fanning out, confirming that long-term bullish capital is in control. The trend’s underlying foundation is solid. This price pullback is defined as a chip-clearing process within an ongoing uptrend, aimed at replacing weak short-term floating positions. As long as the key support zone is not effectively broken, this round of upward trend will not experience a fundamental reversal.
Current price is trading between the Bollinger Bands’ middle band and upper band. The Bollinger middle band is the core defensive baseline for the intermediate trend. In terms of indicators, the MACD shows that the short-term push upward momentum has been slightly dulled. The chart suggests a technical pullback and repair is needed, but the larger intermediate bullish framework has not been broken.
4-hour timeframe
On the 4-hour cycle, after pushing to a high, price enters a period of sideways consolidation and tug-of-war. It has repeatedly tested the prior high resistance from below, yet has not managed to achieve a valid breakout. However, the larger-scale bullish structure remains sound, with no signals of trend weakening. The current candlestick is slightly bearish; short-term bulls’ pushing power is still gradually fading.
On the 4-hour MACD, a death cross has already formed. The bearish green bars continue to expand, indicating that short-term downward force is accumulating. For short-term support, focus on the BTC 83,000–84,000 area and ETH 2,650. If the support holds, the market will likely continue to maintain range-bound choppy trading.
Short-term trading suggestions
BTC long: 84,800–84,000 long; targets 87,000–88,000
BTC short: 87,0000–87,200 short; target 84,000–84,200
9.23 Bitcoin Analysis
The intermediate uptrend structure on the Bitcoin daily timeframe remains intact. The EMA moving-average system is fanning out, confirming that long-term bullish capital is in control. The trend’s underlying foundation is solid. This price pullback is defined as a chip-clearing process within an ongoing uptrend, aimed at replacing weak short-term floating positions. As long as the key support zone is not effectively broken, this round of upward trend will not experience a fundamental reversal.
Current price is trading between the Bollinger Bands’ middle band and upper band. The Bollinger middle band is the core defensive baseline for the intermediate trend. In terms of indicators, the MACD shows that the short-term push upward momentum has been slightly dulled. The chart suggests a technical pullback and repair is needed, but the larger intermediate bullish framework has not been broken.
4-hour timeframe
On the 4-hour cycle, after pushing to a high, price enters a period of sideways consolidation and tug-of-war. It has repeatedly tested the prior high resistance from below, yet has not managed to achieve a valid breakout. However, the larger-scale bullish structure remains sound, with no signals of trend weakening. The current candlestick is slightly bearish; short-term bulls’ pushing power is still gradually fading.
On the 4-hour MACD, a death cross has already formed. The bearish green bars continue to expand, indicating that short-term downward force is accumulating. For short-term support, focus on the BTC 83,000–84,000 area and ETH 2,650. If the support holds, the market will likely continue to maintain range-bound choppy trading.
Short-term trading suggestions
BTC long: 84,800–84,000 long; targets 87,000–88,000
BTC short: 87,0000–87,200 short; target 84,000–84,200
The intermediate uptrend structure on the Bitcoin daily timeframe remains intact. The EMA moving-average system is fanning out, confirming that long-term bullish capital is in control. The trend’s underlying foundation is solid. This price pullback is defined as a chip-clearing process within an ongoing uptrend, aimed at replacing weak short-term floating positions. As long as the key support zone is not effectively broken, this round of upward trend will not experience a fundamental reversal.
Current price is trading between the Bollinger Bands’ middle band and upper band. The Bollinger middle band is the core defensive baseline for the intermediate trend. In terms of indicators, the MACD shows that the short-term push upward momentum has been slightly dulled. The chart suggests a technical pullback and repair is needed, but the larger intermediate bullish framework has not been broken.
4-hour timeframe
On the 4-hour cycle, after pushing to a high, price enters a period of sideways consolidation and tug-of-war. It has repeatedly tested the prior high resistance from below, yet has not managed to achieve a valid breakout. However, the larger-scale bullish structure remains sound, with no signals of trend weakening. The current candlestick is slightly bearish; short-term bulls’ pushing power is still gradually fading.
On the 4-hour MACD, a death cross has already formed. The bearish green bars continue to expand, indicating that short-term downward force is accumulating. For short-term support, focus on the BTC 83,000–84,000 area and ETH 2,650. If the support holds, the market will likely continue to maintain range-bound choppy trading.
Short-term trading suggestions
BTC long: 84,800–84,000 long; targets 87,000–88,000
BTC short: 87,0000–87,200 short; target 84,000–84,200



38
·
--
In the current high-level Bitcoin market, volatility is extremely wild. Short-term upside lacks momentum, but placing short trades for gains has been doing reasonably well. In this kind of market, you must make sure to take solid defensive measures with your trading.
#AI股持续上涨还有哪些投资机会 #21Shares推出欧洲首只Zcash实物ETP #Cardano接入x402支付标准 #ZEC突破1600美元创新高 #BitwiseNEAR质押ETP资产突破1亿美元
In the current high-level Bitcoin market, volatility is extremely wild. Short-term upside lacks momentum, but placing short trades for gains has been doing reasonably well. In this kind of market, you must make sure to take solid defensive measures with your trading.
#AI股持续上涨还有哪些投资机会 #21Shares推出欧洲首只Zcash实物ETP #Cardano接入x402支付标准 #ZEC突破1600美元创新高 #BitwiseNEAR质押ETP资产突破1亿美元
#AI股持续上涨还有哪些投资机会 #21Shares推出欧洲首只Zcash实物ETP #Cardano接入x402支付标准 #ZEC突破1600美元创新高 #BitwiseNEAR质押ETP资产突破1亿美元



368
Log in to explore more content
Join global crypto users on Binance Square
⚡️ Get latest and useful information about crypto.
💬 Trusted by the world’s largest crypto exchange.
👍 Discover real insights from verified creators.
Email / Phone number
Trending Topics
BitcoinClears$85200
932 views
75 Discussing
We got the move, and $BTC is standing exactly where we were before the data. That’s what actual patience for a trade looks like.
The data came in mixed but with some important numbers. ADP Non-Farm Employment Change came at 90K vs 73K forecast, while Core PCE came in at 0.2% vs 0.3% expected. Final GDP was also stronger at 2.2% vs 1.5% forecast, while Personal Spending came in at 0.9% vs 0.8% expected. At the same time, Personal Income missed at 0.2% vs 0.5% forecast.
BTC initially surged to $85,600 and is now back where it needs to be. I’m still looking toward the lower ranges at $82,759 and the $80,000 liquidity, because the overhead liquidity is done and dusted.
We had a live session during the data, and during that session we saw the market at $83,800, then $85,600, and then back toward $83,000 and we still didn’t enter a trade.
That’s what patience is.
We can’t force an entry when the market has no clear direction. The same range is still in focus, and we’ll wait for the market to give us the setup.
Let me know, guys, how was the session? And should we have more regular sessions with our respected members so we can have proper discussions regarding the market?
#BitcoinClears$85200 #AltcoinSeasonIndexHoldsAbove60For5Days #USADPAdds90000JobsInSeptember #BitcoinSlipsBelow$84000 #SECToClarifyOnChainFundraisingRules
Crypto_LUX
·16 Likes
·3.9k views
AltcoinSeasonIndexHoldsAbove60For5Days
8,733 views
480 Discussing
USADPAdds90000JobsInSeptember
2,384 views
221 Discussing