
Only_Spot_
8 Posts

Only_Spot_
Report
Block User
3 Following
9 Followers
15 Liked
Posts
All
Quotes
·
--
Article
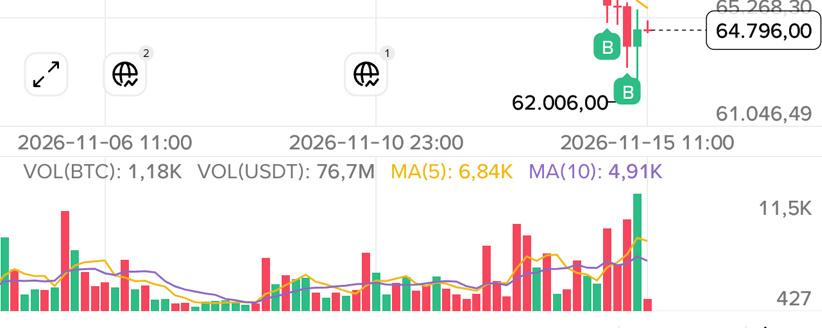
If not now, when?The 4H timeframe is seeing strong buying pressure absorbing supply; just keep accumulating gradually, guys.
#btc #VietnamBinanceSquare #spot
If not now, when?
The 4H timeframe is seeing strong buying pressure absorbing supply; just keep accumulating gradually, guys.
#btc #VietnamBinanceSquare #spot
#btc #VietnamBinanceSquare #spot
542
·
--
BTC Weekly AnalysisThe weekly (W) analysis of Bitcoin shows that the long-term trend remains bullish but is currently consolidating after a strong upward phase. The price is currently fluctuating around the 66k–70k range, creating a sideways structure in an uptrend. The important support zone is at 63k–65k; if this area holds, there is a possibility of continuing to move towards the 72k–75k range in the coming weeks. Conversely, if it breaks 63k, the price could adjust down to 58k–60k to re-accumulate. The weekly RSI is still above 50, indicating that long-term buying pressure has not diminished, but the upward momentum has slowed. The appropriate strategy is to prioritize buying at strong support areas and limit FOMO when the price touches resistance.
BTC Weekly Analysis
The weekly (W) analysis of Bitcoin shows that the long-term trend remains bullish but is currently consolidating after a strong upward phase. The price is currently fluctuating around the 66k–70k range, creating a sideways structure in an uptrend. The important support zone is at 63k–65k; if this area holds, there is a possibility of continuing to move towards the 72k–75k range in the coming weeks. Conversely, if it breaks 63k, the price could adjust down to 58k–60k to re-accumulate. The weekly RSI is still above 50, indicating that long-term buying pressure has not diminished, but the upward momentum has slowed. The appropriate strategy is to prioritize buying at strong support areas and limit FOMO when the price touches resistance.
78
·
--
#creatorpadvn $BNB BTC 4H chart is sideways, slightly bearish. Resistance 68k–69.5k, support 66.3k–65k. Priority to short at 68k → TP 66k/65k, SL 69.2k. Only long when breaking 68k strongly with high volume. Bitcoin
#creatorpadvn $BNB BTC 4H chart is sideways, slightly bearish. Resistance 68k–69.5k, support 66.3k–65k. Priority to short at 68k → TP 66k/65k, SL 69.2k. Only long when breaking 68k strongly with high volume. Bitcoin
59
·
--
#creatorpadvn $BNB Analysis of BTC today (4H frame)
Current price: about 67,000 – 68,000 USD on February 27, 2026. Bitcoin

• The recent price has fluctuated in the range of 66k – 70k and the market is moving sideways with a weak trend. 
• BTC was strongly rejected at the ~68k area, weakening the rebound momentum. 
• The short-term MA on the 4H frame is declining, indicating that short-term downward pressure still exists.
👉 In summary: 4H Trend = Sideway → slightly bearish
#creatorpadvn $BNB Analysis of BTC today (4H frame)
Current price: about 67,000 – 68,000 USD on February 27, 2026. Bitcoin

• The recent price has fluctuated in the range of 66k – 70k and the market is moving sideways with a weak trend. 
• BTC was strongly rejected at the ~68k area, weakening the rebound momentum. 
• The short-term MA on the 4H frame is declining, indicating that short-term downward pressure still exists.
👉 In summary: 4H Trend = Sideway → slightly bearish
Current price: about 67,000 – 68,000 USD on February 27, 2026. Bitcoin

• The recent price has fluctuated in the range of 66k – 70k and the market is moving sideways with a weak trend. 
• BTC was strongly rejected at the ~68k area, weakening the rebound momentum. 
• The short-term MA on the 4H frame is declining, indicating that short-term downward pressure still exists.
👉 In summary: 4H Trend = Sideway → slightly bearish
57
·
--
It is correct to liquidate if the volume is low, how much did you bet on the total capital
It is correct to liquidate if the volume is low, how much did you bet on the total capital
cờ bịp
·
--
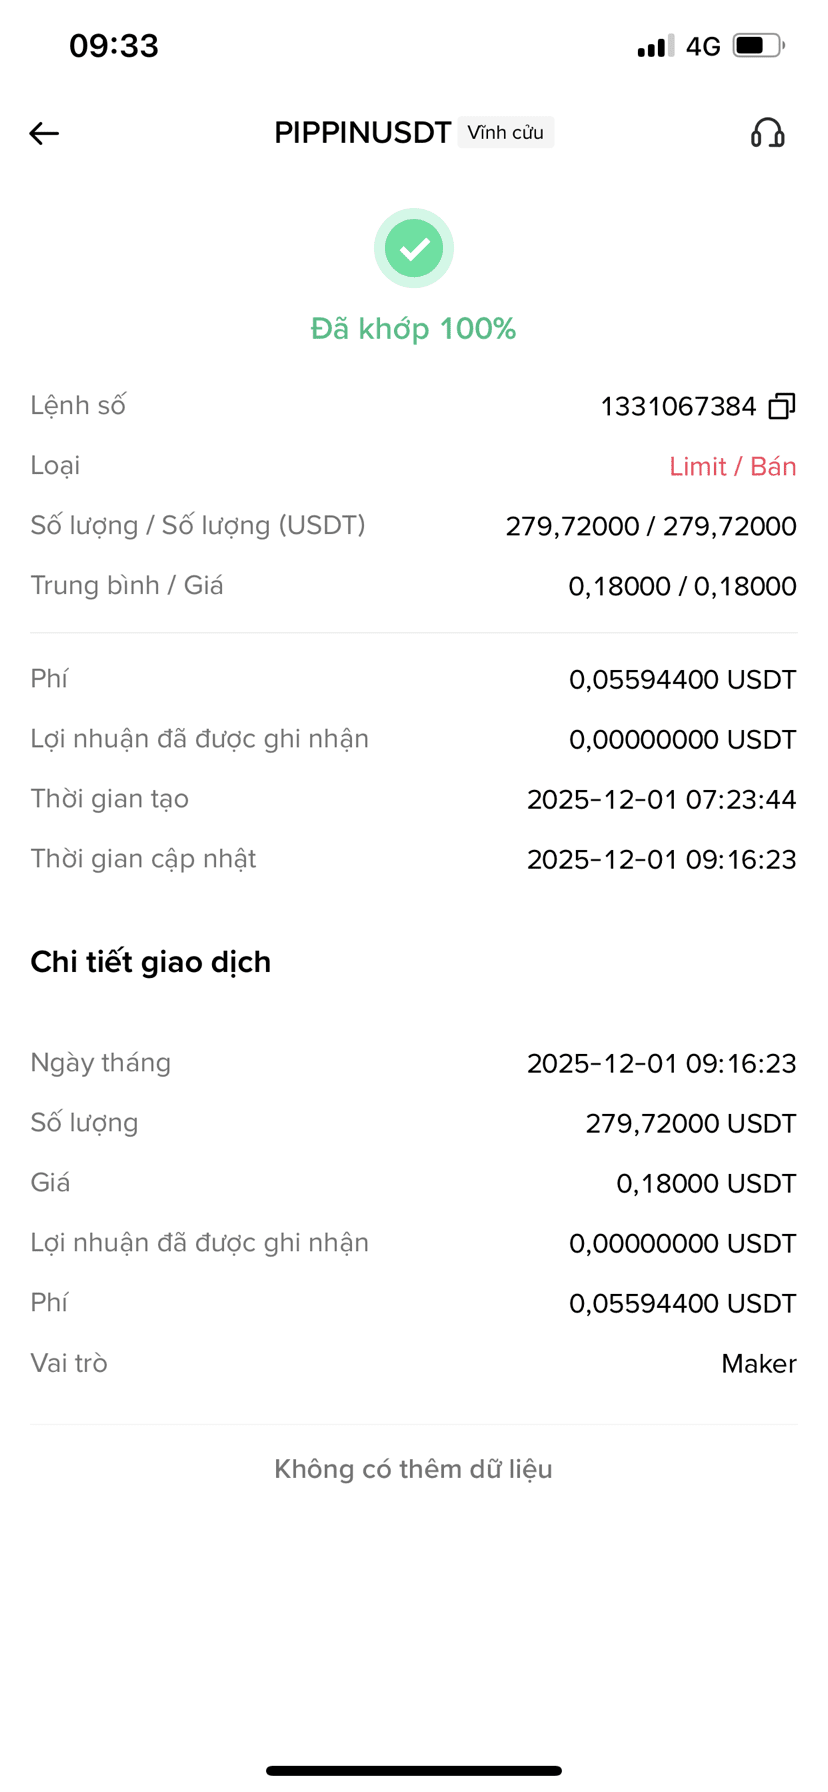
Place a short order of 0.18, but what does it mean when the new price reaches 0.196 for liquidation, leverage x10
9
9
·
--
Install STL on B, these guys are really pulling the whiskers hard
Install STL on B, these guys are really pulling the whiskers hard

holder1991
·
--
$BEAT is there any reversal phase?
6
6
·
--
Liquidation price of the fruit :))), going like this still burns long
Liquidation price of the fruit :))), going like this still burns long
Quoted content has been removed
57
Log in to explore more content
Join global crypto users on Binance Square
⚡️ Get latest and useful information about crypto.
💬 Trusted by the world’s largest crypto exchange.
👍 Discover real insights from verified creators.
Email / Phone number
Trending Topics
NvidiaBeatsEstimatesWith$130BQ4Outlook
14,894 views
182 Discussing
Nvidia Beats With $115.8 Billion in Revenue, Guides to $130 Billion and Adds $150 Billion Buyback
Binance News
·49 Likes
·42.1k views
AnthropicIPOPriceCouldExceed$80
19,656 views
159 Discussing
CanNvidia’sDataCenterGrowthContinue?
59,954 views
792 Discussing