
凌姐-观金市
3k Posts

凌姐-观金市
Report
Block User
微博🧣“芸姐-观金市” 知名财经博主!10多年交易经验,擅长波段,长线步菊,擅长解套,每天分享干货!实时更新!知行合一,有独特的交易思维!
162 Following
2.1K+ Followers
2.6K+ Liked
Posts
All
Quotes
Live
PINNED
·
--
#Contract Support #Crypto Boom for Fortune #Spot
I understand you, and I’ll send you some USDT
Chat: Binance official chat room👇 :zenggw59zc🤝
#Contract Support #Crypto Boom for Fortune #Spot
I understand you, and I’ll send you some USDT
Chat: Binance official chat room👇 :zenggw59zc🤝
I understand you, and I’ll send you some USDT
Chat: Binance official chat room👇 :zenggw59zc🤝

142
·
--
International developments keep fluctuating; a persistent risk-averse sentiment continues to affect the market’s pace. Everyone is waiting for remarks from overseas officials to gauge how the macro rhythm may change next.
Yesterday, U.S. Treasuries rose. Protective assets tested the 4430 area but failed to hold above the 4438 resistance level; upward momentum noticeably slowed in the short term. The U.S. dollar saw mild consolidation, with increasing divergence between bulls and bears. There were no major catalysts today, and overall price action was mainly driven by technical range trading.
On the larger time frame, the broader trend remains solid. This current pullback is merely a consolidation phase during an upswing, not a trend reversal. On the shorter time frame, price has been holding at elevated levels; indicators repeatedly repair themselves. Today’s session shows clear tug-of-war between gains and losses. Most likely, the market will remain choppy during the morning, and chasing trades blindly carries high risk.
Last night, 30-year U.S. Treasuries hit a new high, prompting price to touch 4430. However, the key resistance at 4438 was never effectively broken through. In addition, the escalation of regional conflicts continues, the likelihood of negotiations is declining, and oil prices are staying elevated. Whether officials’ remarks today will raise expectations of tightening is the main point to watch right now.
The first key support is 4404. If it breaks, the rebound momentum of this cycle will likely end. After that, levels to watch in order are 4392, 4384, 4377, and 4366.
If the Asia-Europe session selloff weakly breaks below 4377, pay attention to how strongly price rebounds at 4366. If it cannot quickly reclaim the level, further downside may extend to 4353, 4334, and 4315.
Key resistance overhead: 4426, 4438. Only by holding above 4438 can we continue to look for 4458 and 4476.
International developments keep fluctuating; a persistent risk-averse sentiment continues to affect the market’s pace. Everyone is waiting for remarks from overseas officials to gauge how the macro rhythm may change next.
Yesterday, U.S. Treasuries rose. Protective assets tested the 4430 area but failed to hold above the 4438 resistance level; upward momentum noticeably slowed in the short term. The U.S. dollar saw mild consolidation, with increasing divergence between bulls and bears. There were no major catalysts today, and overall price action was mainly driven by technical range trading.
On the larger time frame, the broader trend remains solid. This current pullback is merely a consolidation phase during an upswing, not a trend reversal. On the shorter time frame, price has been holding at elevated levels; indicators repeatedly repair themselves. Today’s session shows clear tug-of-war between gains and losses. Most likely, the market will remain choppy during the morning, and chasing trades blindly carries high risk.
Last night, 30-year U.S. Treasuries hit a new high, prompting price to touch 4430. However, the key resistance at 4438 was never effectively broken through. In addition, the escalation of regional conflicts continues, the likelihood of negotiations is declining, and oil prices are staying elevated. Whether officials’ remarks today will raise expectations of tightening is the main point to watch right now.
The first key support is 4404. If it breaks, the rebound momentum of this cycle will likely end. After that, levels to watch in order are 4392, 4384, 4377, and 4366.
If the Asia-Europe session selloff weakly breaks below 4377, pay attention to how strongly price rebounds at 4366. If it cannot quickly reclaim the level, further downside may extend to 4353, 4334, and 4315.
Key resistance overhead: 4426, 4438. Only by holding above 4438 can we continue to look for 4458 and 4476.
Yesterday, U.S. Treasuries rose. Protective assets tested the 4430 area but failed to hold above the 4438 resistance level; upward momentum noticeably slowed in the short term. The U.S. dollar saw mild consolidation, with increasing divergence between bulls and bears. There were no major catalysts today, and overall price action was mainly driven by technical range trading.
On the larger time frame, the broader trend remains solid. This current pullback is merely a consolidation phase during an upswing, not a trend reversal. On the shorter time frame, price has been holding at elevated levels; indicators repeatedly repair themselves. Today’s session shows clear tug-of-war between gains and losses. Most likely, the market will remain choppy during the morning, and chasing trades blindly carries high risk.
Last night, 30-year U.S. Treasuries hit a new high, prompting price to touch 4430. However, the key resistance at 4438 was never effectively broken through. In addition, the escalation of regional conflicts continues, the likelihood of negotiations is declining, and oil prices are staying elevated. Whether officials’ remarks today will raise expectations of tightening is the main point to watch right now.
The first key support is 4404. If it breaks, the rebound momentum of this cycle will likely end. After that, levels to watch in order are 4392, 4384, 4377, and 4366.
If the Asia-Europe session selloff weakly breaks below 4377, pay attention to how strongly price rebounds at 4366. If it cannot quickly reclaim the level, further downside may extend to 4353, 4334, and 4315.
Key resistance overhead: 4426, 4438. Only by holding above 4438 can we continue to look for 4458 and 4476.
1
476
·
--
A steady mindset is what lets you go farther
Only slowly do we come to understand that the world has never gone according to our wishes. Repeated fluctuations, sudden reversals, and unexpected variables are all perfectly normal.
Most of the time, people don’t fail because they can’t understand the situation—they lose because their emotions aren’t stable and their character isn’t firm.
When things are calm, they often fear missing opportunities, rush to follow the crowd, and can’t stay put. Once things go badly, they’re prone to wishful thinking, unwilling to accept even minor mistakes, and stubbornly refuse to turn back—until small problems grow into big regrets. After finally gaining a little, they may become greedy for more, unwilling to stop in time, and end up losing the hard-won gains just as easily.
In life and in work, the first thing to learn is to accept imperfection. Judgments are bound to be wrong; expectations are bound to fall short. There’s no need to swing between great joy and great sorrow over a single gain or loss. You don’t have to force every choice to be perfect. Real and lasting gains depend on long-term rhythm and trade-offs—not on momentary wins or losses.
Lock onto the big direction, hold your own bottom line and rhythm, and only take what you’re capable of. Learn to wait patiently, restrain unnecessary desires, and don’t let short-term ups and downs throw off your mindset.
The world is never short of opportunities—the one thing that’s always missing is a steady, self-disciplined heart. Keep your emotions steady, stay true to your core values, and follow your principles, and you’ll be able to walk steadily through life’s ups and downs and go even farther.
A steady mindset is what lets you go farther
Only slowly do we come to understand that the world has never gone according to our wishes. Repeated fluctuations, sudden reversals, and unexpected variables are all perfectly normal.
Most of the time, people don’t fail because they can’t understand the situation—they lose because their emotions aren’t stable and their character isn’t firm.
When things are calm, they often fear missing opportunities, rush to follow the crowd, and can’t stay put. Once things go badly, they’re prone to wishful thinking, unwilling to accept even minor mistakes, and stubbornly refuse to turn back—until small problems grow into big regrets. After finally gaining a little, they may become greedy for more, unwilling to stop in time, and end up losing the hard-won gains just as easily.
In life and in work, the first thing to learn is to accept imperfection. Judgments are bound to be wrong; expectations are bound to fall short. There’s no need to swing between great joy and great sorrow over a single gain or loss. You don’t have to force every choice to be perfect. Real and lasting gains depend on long-term rhythm and trade-offs—not on momentary wins or losses.
Lock onto the big direction, hold your own bottom line and rhythm, and only take what you’re capable of. Learn to wait patiently, restrain unnecessary desires, and don’t let short-term ups and downs throw off your mindset.
The world is never short of opportunities—the one thing that’s always missing is a steady, self-disciplined heart. Keep your emotions steady, stay true to your core values, and follow your principles, and you’ll be able to walk steadily through life’s ups and downs and go even farther.
Only slowly do we come to understand that the world has never gone according to our wishes. Repeated fluctuations, sudden reversals, and unexpected variables are all perfectly normal.
Most of the time, people don’t fail because they can’t understand the situation—they lose because their emotions aren’t stable and their character isn’t firm.
When things are calm, they often fear missing opportunities, rush to follow the crowd, and can’t stay put. Once things go badly, they’re prone to wishful thinking, unwilling to accept even minor mistakes, and stubbornly refuse to turn back—until small problems grow into big regrets. After finally gaining a little, they may become greedy for more, unwilling to stop in time, and end up losing the hard-won gains just as easily.
In life and in work, the first thing to learn is to accept imperfection. Judgments are bound to be wrong; expectations are bound to fall short. There’s no need to swing between great joy and great sorrow over a single gain or loss. You don’t have to force every choice to be perfect. Real and lasting gains depend on long-term rhythm and trade-offs—not on momentary wins or losses.
Lock onto the big direction, hold your own bottom line and rhythm, and only take what you’re capable of. Learn to wait patiently, restrain unnecessary desires, and don’t let short-term ups and downs throw off your mindset.
The world is never short of opportunities—the one thing that’s always missing is a steady, self-disciplined heart. Keep your emotions steady, stay true to your core values, and follow your principles, and you’ll be able to walk steadily through life’s ups and downs and go even farther.
171
·
--
Gold prices continue to rise, briefly rising above $4,400 per ounce; they have now pulled back slightly. The market is weighing two opposing forces: weaker U.S. economic data reduces pressure for the Federal Reserve to raise rates, but rising risks in the energy market have once again strengthened worries about inflation. Last Friday, gold’s daily chart formed a down-shadow candle, the price held above short-term moving average support, the weekly chart logged a second consecutive gain, and the long-side trend structure remains intact. In today’s Asia session, after the open the market continued a slightly bullish trend; during the day it pushed up to around 4,416, then faced pressure and pulled back slightly. This short-term pullback is a technical correction within the ongoing uptrend, and the overall bullish trading pattern has not changed.
On the 4-hour timeframe, gold is still in a rebound structure in the short term. The price has moved back close to $4,446, indicating that buyers are attempting to repair the prior rapid pullback. Momentum on the short cycle is currently biased to the upside, but since the price is already nearing a previously dense trading zone, any further push higher would likely require the U.S. dollar and U.S. Treasury yields to move in sync.
If the 4-hour level can hold steadily above $4,400 and further break through $4,420, the short-term trend could shift from a rebound to a new round of upward advance;
If, after a push higher, the price falls back below $4,382, it is more likely to develop into high-range consolidation and seek new support around $4,365.
Key levels: Resistance: 4,450 and 4,535. Support: 4,383 and 4,365
Gold: 4,363–4,375 long. Targets: 4,415–4,450–4,480$XAUT
Gold prices continue to rise, briefly rising above $4,400 per ounce; they have now pulled back slightly. The market is weighing two opposing forces: weaker U.S. economic data reduces pressure for the Federal Reserve to raise rates, but rising risks in the energy market have once again strengthened worries about inflation. Last Friday, gold’s daily chart formed a down-shadow candle, the price held above short-term moving average support, the weekly chart logged a second consecutive gain, and the long-side trend structure remains intact. In today’s Asia session, after the open the market continued a slightly bullish trend; during the day it pushed up to around 4,416, then faced pressure and pulled back slightly. This short-term pullback is a technical correction within the ongoing uptrend, and the overall bullish trading pattern has not changed.
On the 4-hour timeframe, gold is still in a rebound structure in the short term. The price has moved back close to $4,446, indicating that buyers are attempting to repair the prior rapid pullback. Momentum on the short cycle is currently biased to the upside, but since the price is already nearing a previously dense trading zone, any further push higher would likely require the U.S. dollar and U.S. Treasury yields to move in sync.
If the 4-hour level can hold steadily above $4,400 and further break through $4,420, the short-term trend could shift from a rebound to a new round of upward advance;
If, after a push higher, the price falls back below $4,382, it is more likely to develop into high-range consolidation and seek new support around $4,365.
Key levels: Resistance: 4,450 and 4,535. Support: 4,383 and 4,365
Gold: 4,363–4,375 long. Targets: 4,415–4,450–4,480$XAUT
On the 4-hour timeframe, gold is still in a rebound structure in the short term. The price has moved back close to $4,446, indicating that buyers are attempting to repair the prior rapid pullback. Momentum on the short cycle is currently biased to the upside, but since the price is already nearing a previously dense trading zone, any further push higher would likely require the U.S. dollar and U.S. Treasury yields to move in sync.
If the 4-hour level can hold steadily above $4,400 and further break through $4,420, the short-term trend could shift from a rebound to a new round of upward advance;
If, after a push higher, the price falls back below $4,382, it is more likely to develop into high-range consolidation and seek new support around $4,365.
Key levels: Resistance: 4,450 and 4,535. Support: 4,383 and 4,365
Gold: 4,363–4,375 long. Targets: 4,415–4,450–4,480$XAUT
161
·
--
WTI crude oil is caught in a tug-of-war between a geopolitical risk premium and expectations of weak demand. A stalemate in the Strait of Hormuz, an escalation in the Lebanon conflict, and attacks on Russian refineries provide short-term support for oil prices. However, both the IEA and OPEC have cut their demand forecasts, and increased supply from non-OPEC+ acts as a mid-term headwind to the fundamentals. If tensions in the Middle East further escalate, oil prices may break out of the current range and move higher to challenge the $86–90 area. If there are signs of easing geopolitical risks or demand concerns continue to intensify, oil prices could retrace toward deeper support at $81.60 and even $73.10. Traders are closely watching Tuesday’s API crude oil inventory report to look for further clues on the demand side. Going forward, key areas to monitor include developments in US-Iran negotiations, the status of navigation through the straits, domestic refinery run rates, and changes in inventories. Due to geopolitical risk disruptions, it is expected that domestic crude oil futures may maintain a choppy-to-firm trend this week.
Key levels: Resistance: 84.6, 86.0 Support: 80.7, 79.5
WTI crude oil is caught in a tug-of-war between a geopolitical risk premium and expectations of weak demand. A stalemate in the Strait of Hormuz, an escalation in the Lebanon conflict, and attacks on Russian refineries provide short-term support for oil prices. However, both the IEA and OPEC have cut their demand forecasts, and increased supply from non-OPEC+ acts as a mid-term headwind to the fundamentals. If tensions in the Middle East further escalate, oil prices may break out of the current range and move higher to challenge the $86–90 area. If there are signs of easing geopolitical risks or demand concerns continue to intensify, oil prices could retrace toward deeper support at $81.60 and even $73.10. Traders are closely watching Tuesday’s API crude oil inventory report to look for further clues on the demand side. Going forward, key areas to monitor include developments in US-Iran negotiations, the status of navigation through the straits, domestic refinery run rates, and changes in inventories. Due to geopolitical risk disruptions, it is expected that domestic crude oil futures may maintain a choppy-to-firm trend this week.
Key levels: Resistance: 84.6, 86.0 Support: 80.7, 79.5
Key levels: Resistance: 84.6, 86.0 Support: 80.7, 79.5
2
297
·
--
How to Understand the Gold Market:
London spot gold over-the-counter trading = engine bay
COMEX futures gold on the New York Mercantile Exchange = accelerator
Commodity trading advisors/hedge funds = accelerator
Options market makers on the Chicago Exchange = stabilizer/amplifier
Changes in gold reserves by central banks around the world = long-term fuel
This analogy of the gold price as a car is very vivid, and it’s very useful for retail traders to understand the gold market.
US Dollar Index + 10-year Treasury actual yield + changes in COMEX gold futures positioning + the CFTC gold positioning report = four key indicators for short- to medium-term gold trading
How to Understand the Gold Market:
London spot gold over-the-counter trading = engine bay
COMEX futures gold on the New York Mercantile Exchange = accelerator
Commodity trading advisors/hedge funds = accelerator
Options market makers on the Chicago Exchange = stabilizer/amplifier
Changes in gold reserves by central banks around the world = long-term fuel
This analogy of the gold price as a car is very vivid, and it’s very useful for retail traders to understand the gold market.
US Dollar Index + 10-year Treasury actual yield + changes in COMEX gold futures positioning + the CFTC gold positioning report = four key indicators for short- to medium-term gold trading
London spot gold over-the-counter trading = engine bay
COMEX futures gold on the New York Mercantile Exchange = accelerator
Commodity trading advisors/hedge funds = accelerator
Options market makers on the Chicago Exchange = stabilizer/amplifier
Changes in gold reserves by central banks around the world = long-term fuel
This analogy of the gold price as a car is very vivid, and it’s very useful for retail traders to understand the gold market.
US Dollar Index + 10-year Treasury actual yield + changes in COMEX gold futures positioning + the CFTC gold positioning report = four key indicators for short- to medium-term gold trading
218
·
--
The international crude oil market has been oscillating and rising amid fierce tug-of-war between geopolitics and fundamentals. The standoff between the US and Iran over control of the Strait of Hormuz has continued to escalate, with frequent attacks on tankers. The US has threatened it may maintain a maritime blockade of Iran indefinitely, while the peace process has made no substantive progress. Concerns about a supply disruption have once again intensified. Meanwhile, bearish factors such as a significant increase in US crude inventories and international institutions cutting demand expectations temporarily weighed on oil prices, but ultimately geopolitical risk prevailed. After a midweek pullback, oil prices rebounded strongly before the weekend, indicating that Middle East tensions are the dominant driver of market sentiment. From a technical perspective, at the daily level, after bottoming out the oil price closed with a bullish candle; the price retraced to the short-term moving averages. RSI has fallen from its high level, and bullish momentum has weakened somewhat. The medium-term uptrend has not been completely broken; this can be considered a consolidation phase at high levels after a rally. On the four-hour chart, the MACD has formed a dead cross, and the upper band of the Bollinger Bands has turned downward. The market has switched to a mildly weak, range-bound pattern, and the prior area around 84.5 has turned into strong resistance. On the hourly chart, price is in an upward channel, with the rebound strength on the higher side. For the short term, the preferred approach is to pull back and go long, waiting to observe reversal signals around key resistance. It is not advisable to chase the rally blindly.
Key levels: Resistance levels: 84.6, 86.0. Support levels: 80.7, 79.5
The international crude oil market has been oscillating and rising amid fierce tug-of-war between geopolitics and fundamentals. The standoff between the US and Iran over control of the Strait of Hormuz has continued to escalate, with frequent attacks on tankers. The US has threatened it may maintain a maritime blockade of Iran indefinitely, while the peace process has made no substantive progress. Concerns about a supply disruption have once again intensified. Meanwhile, bearish factors such as a significant increase in US crude inventories and international institutions cutting demand expectations temporarily weighed on oil prices, but ultimately geopolitical risk prevailed. After a midweek pullback, oil prices rebounded strongly before the weekend, indicating that Middle East tensions are the dominant driver of market sentiment. From a technical perspective, at the daily level, after bottoming out the oil price closed with a bullish candle; the price retraced to the short-term moving averages. RSI has fallen from its high level, and bullish momentum has weakened somewhat. The medium-term uptrend has not been completely broken; this can be considered a consolidation phase at high levels after a rally. On the four-hour chart, the MACD has formed a dead cross, and the upper band of the Bollinger Bands has turned downward. The market has switched to a mildly weak, range-bound pattern, and the prior area around 84.5 has turned into strong resistance. On the hourly chart, price is in an upward channel, with the rebound strength on the higher side. For the short term, the preferred approach is to pull back and go long, waiting to observe reversal signals around key resistance. It is not advisable to chase the rally blindly.
Key levels: Resistance levels: 84.6, 86.0. Support levels: 80.7, 79.5
Key levels: Resistance levels: 84.6, 86.0. Support levels: 80.7, 79.5
183
·
--
Gold Latest Price Trend Analysis
Last Friday, spot gold overall showed a high-range consolidation pattern of “pullback and accumulation in the Asian/European session, followed by a rally in the U.S. session, and convergence near the close at high levels.” It ultimately closed at $4,375.29 per ounce, up 0.57% on the day. On the weekly chart, it rose 0.77%, marking the second consecutive week of a bullish candle. However, throughout the week it remained locked below the $4,400 level and failed to break through the two-month high near $4,449 from the prior day. The next moves will depend on further catalysts next week, including U.S. housing data, ADP employment, and the initial PMI readings, as well as remarks at the Jackson Hole central bank conference at the end of August.
On the daily timeframe, gold probed lower and then rebounded, closing with a bullish candle with a real body. The price is oscillating and consolidating around the 100-day moving average. The larger uptrend structure for the bulls has not been broken, but repeated attempts to push above the $4,400 threshold have repeatedly failed, and sell pressure above continues to show up. The RSI indicator remains in a bullish range, but upside momentum has weakened; there is no strong acceleration signal, and the short-term picture shows clear characteristics of consolidation and repair.
Key Levels: Resistance: 4400, 4435. Support: 4315, 4305.
Driven by weaker U.S. inflation and employment data, the market has cut back expectations for a September rate hike by the Federal Reserve. The U.S. Dollar Index and U.S. Treasury yields have fallen in tandem, providing a tailwind to gold this week. Geopolitical tensions in the Middle East have repeatedly flared and cooled, keeping oil prices elevated, which has rekindled concerns about inflation and, in turn, has constrained the upside room for gold. As bulls and bears continue to grapple, gold has been trading in overall high-level consolidation.
Technicals: On the daily timeframe, the market formed a long lower shadow K-line signaling a bottoming-and-rebound. Swing highs and lows have gradually moved higher, and the medium-term bullish trend structure remains intact. However, upper wicks have appeared frequently, indicating noticeable overhead pressure and profit-taking. After the rally, the market is entering a consolidation/rest period. On the 4-hour timeframe, multiple small-bodied K-lines are moving sideways and wrestling horizontally, which is consistent with a “bullish continuation” consolidation-and-reset signal. In the short term, support is around 4300, with resistance at 4400. On Monday, the trading priority is to place long orders on pullbacks, with a focus on a prudent approach.
Gold: Around 4310-4315, then look up to 4400-4435
$XAUT
{future}(XAUTUSDT)
Gold Latest Price Trend Analysis
Last Friday, spot gold overall showed a high-range consolidation pattern of “pullback and accumulation in the Asian/European session, followed by a rally in the U.S. session, and convergence near the close at high levels.” It ultimately closed at $4,375.29 per ounce, up 0.57% on the day. On the weekly chart, it rose 0.77%, marking the second consecutive week of a bullish candle. However, throughout the week it remained locked below the $4,400 level and failed to break through the two-month high near $4,449 from the prior day. The next moves will depend on further catalysts next week, including U.S. housing data, ADP employment, and the initial PMI readings, as well as remarks at the Jackson Hole central bank conference at the end of August.
On the daily timeframe, gold probed lower and then rebounded, closing with a bullish candle with a real body. The price is oscillating and consolidating around the 100-day moving average. The larger uptrend structure for the bulls has not been broken, but repeated attempts to push above the $4,400 threshold have repeatedly failed, and sell pressure above continues to show up. The RSI indicator remains in a bullish range, but upside momentum has weakened; there is no strong acceleration signal, and the short-term picture shows clear characteristics of consolidation and repair.
Key Levels: Resistance: 4400, 4435. Support: 4315, 4305.
Driven by weaker U.S. inflation and employment data, the market has cut back expectations for a September rate hike by the Federal Reserve. The U.S. Dollar Index and U.S. Treasury yields have fallen in tandem, providing a tailwind to gold this week. Geopolitical tensions in the Middle East have repeatedly flared and cooled, keeping oil prices elevated, which has rekindled concerns about inflation and, in turn, has constrained the upside room for gold. As bulls and bears continue to grapple, gold has been trading in overall high-level consolidation.
Technicals: On the daily timeframe, the market formed a long lower shadow K-line signaling a bottoming-and-rebound. Swing highs and lows have gradually moved higher, and the medium-term bullish trend structure remains intact. However, upper wicks have appeared frequently, indicating noticeable overhead pressure and profit-taking. After the rally, the market is entering a consolidation/rest period. On the 4-hour timeframe, multiple small-bodied K-lines are moving sideways and wrestling horizontally, which is consistent with a “bullish continuation” consolidation-and-reset signal. In the short term, support is around 4300, with resistance at 4400. On Monday, the trading priority is to place long orders on pullbacks, with a focus on a prudent approach.
Gold: Around 4310-4315, then look up to 4400-4435
$XAUT
Last Friday, spot gold overall showed a high-range consolidation pattern of “pullback and accumulation in the Asian/European session, followed by a rally in the U.S. session, and convergence near the close at high levels.” It ultimately closed at $4,375.29 per ounce, up 0.57% on the day. On the weekly chart, it rose 0.77%, marking the second consecutive week of a bullish candle. However, throughout the week it remained locked below the $4,400 level and failed to break through the two-month high near $4,449 from the prior day. The next moves will depend on further catalysts next week, including U.S. housing data, ADP employment, and the initial PMI readings, as well as remarks at the Jackson Hole central bank conference at the end of August.
On the daily timeframe, gold probed lower and then rebounded, closing with a bullish candle with a real body. The price is oscillating and consolidating around the 100-day moving average. The larger uptrend structure for the bulls has not been broken, but repeated attempts to push above the $4,400 threshold have repeatedly failed, and sell pressure above continues to show up. The RSI indicator remains in a bullish range, but upside momentum has weakened; there is no strong acceleration signal, and the short-term picture shows clear characteristics of consolidation and repair.
Key Levels: Resistance: 4400, 4435. Support: 4315, 4305.
Driven by weaker U.S. inflation and employment data, the market has cut back expectations for a September rate hike by the Federal Reserve. The U.S. Dollar Index and U.S. Treasury yields have fallen in tandem, providing a tailwind to gold this week. Geopolitical tensions in the Middle East have repeatedly flared and cooled, keeping oil prices elevated, which has rekindled concerns about inflation and, in turn, has constrained the upside room for gold. As bulls and bears continue to grapple, gold has been trading in overall high-level consolidation.
Technicals: On the daily timeframe, the market formed a long lower shadow K-line signaling a bottoming-and-rebound. Swing highs and lows have gradually moved higher, and the medium-term bullish trend structure remains intact. However, upper wicks have appeared frequently, indicating noticeable overhead pressure and profit-taking. After the rally, the market is entering a consolidation/rest period. On the 4-hour timeframe, multiple small-bodied K-lines are moving sideways and wrestling horizontally, which is consistent with a “bullish continuation” consolidation-and-reset signal. In the short term, support is around 4300, with resistance at 4400. On Monday, the trading priority is to place long orders on pullbacks, with a focus on a prudent approach.
Gold: Around 4310-4315, then look up to 4400-4435
$XAUT
233
·
--
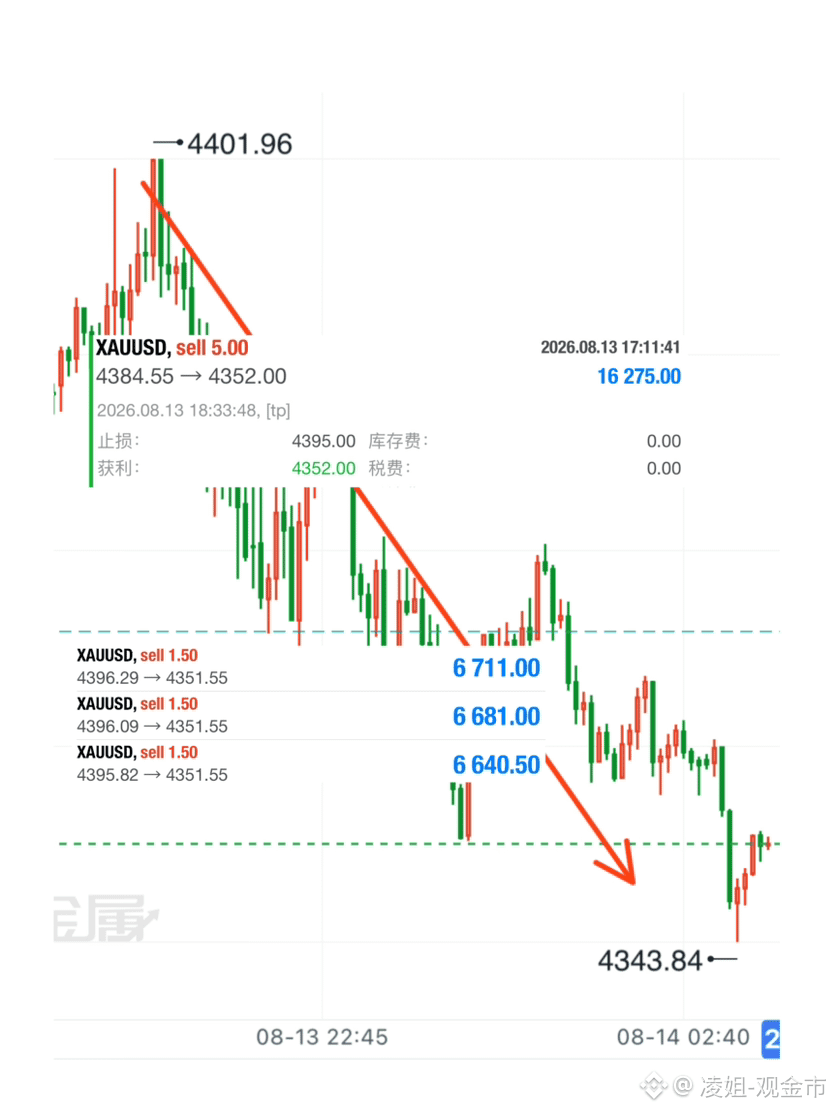
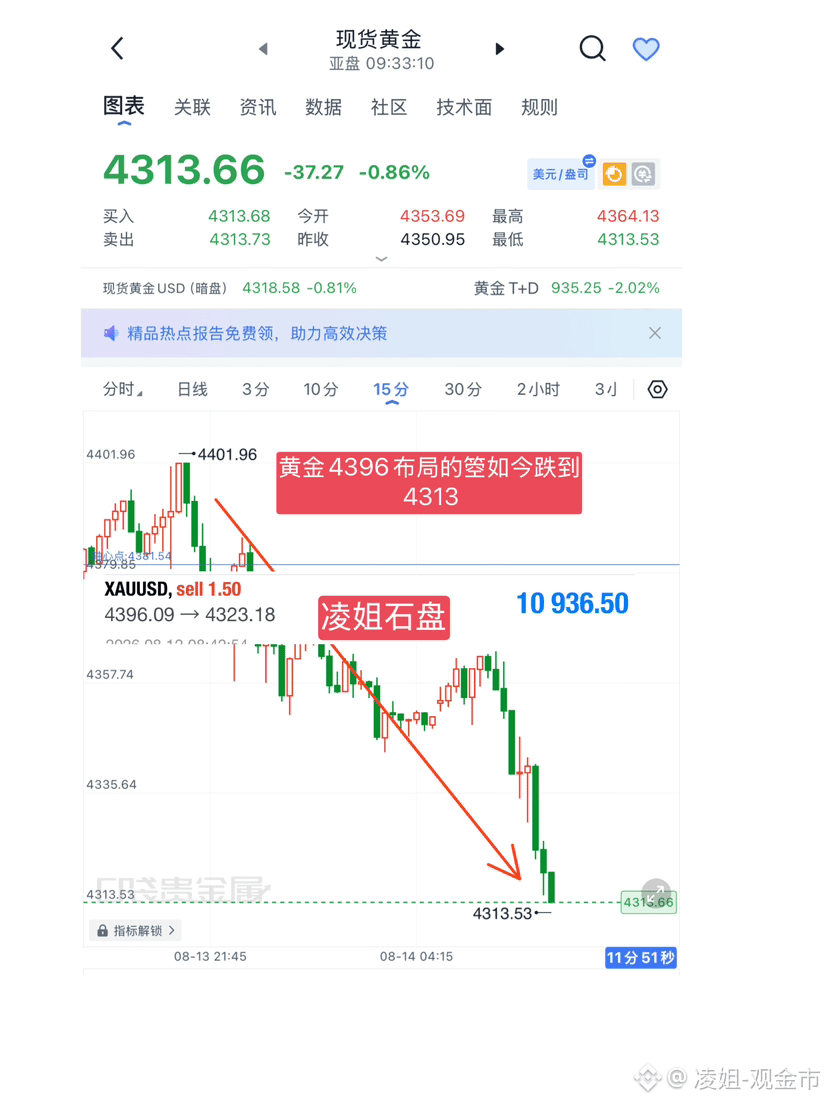
After the gold price pulled back from the previous high around 4450, it tested as low as 4311, then rebounded to 4397 where it met resistance and dropped again. Overall, it is in a high-range consolidation and repair phase following a major surge. The broader uptrend framework for long-to-medium term bulls has not been broken for now, but the earlier sustained rally has piled up a large amount of profit-taking. The tug-of-war between buyers and sellers has become clearly more intense in the short term, and the one-way upward move has effectively come to an end. Upcoming U.S. economic data will further amplify the magnitude of market fluctuations.
The Federal Reserve’s policy expectations remain the core storyline for the market. Investors have been weighing U.S. inflation and economic data performance. If inflation cools and rate-cut expectations rise, that will provide support for gold. If economic data comes in stronger and inflation rebounds, rate-cut expectations get pushed back; with the dollar and U.S. Treasury yields moving higher, the gold price will face downward pressure. Geopolitical events can mostly trigger short-lived impulse moves—risk-off buying arrives quickly and also fades quickly—making it difficult to change the current consolidation structure. Often, after a spike higher, gold quickly falls back. Ongoing global central bank purchases of gold mainly provide support to the longer-term base, helping stabilize the bigger cycle, but they are unlikely to directly alter the short-term consolidation rhythm. Going forward, focus on U.S. inflation and retail sales data, because before-and-after the releases, gold price volatility is likely to increase significantly.
In the short term, the primary resistance zone is 4395–4410. Only if it can effectively hold above 4410 can the rebound continue, creating an opportunity to once again challenge the prior high near 4450. If price repeatedly hits this range and cannot get through, gold may fall back again. Strong short-term support lies at 4310–4315. If 4350–4360 can be held, the high-range consolidation pattern can continue. Once there is an effective breakdown below 4310–4305, the room for a pullback will open up, and the next target range to watch would be 4250–4280.
After the recent run-up and pullback, the market’s overbought conditions in indicators have already been partially digested. At present, there is no clear one-way direction; this is a consolidation-and-stalemate phase. Don’t make subjective bets on a single direction—wait for confirmation from signals of breaks in key support and resistance levels. Going forward, keep a close eye on three things: (1) the direction of the U.S. dollar and real Treasury yields, (2) major U.S. economic data, and (3) whether the support zone 4315–4335 and the resistance zone 4395–4410 can hold or be breached. The bull structure for the larger cycle is still intact. At this stage, the market is mainly characterized by consolidation that digests profits; choppy back-and-forth trading will be the norm. The market direction still needs price breakthroughs to be confirmed along with supporting data.$XAU
After the gold price pulled back from the previous high around 4450, it tested as low as 4311, then rebounded to 4397 where it met resistance and dropped again. Overall, it is in a high-range consolidation and repair phase following a major surge. The broader uptrend framework for long-to-medium term bulls has not been broken for now, but the earlier sustained rally has piled up a large amount of profit-taking. The tug-of-war between buyers and sellers has become clearly more intense in the short term, and the one-way upward move has effectively come to an end. Upcoming U.S. economic data will further amplify the magnitude of market fluctuations.
The Federal Reserve’s policy expectations remain the core storyline for the market. Investors have been weighing U.S. inflation and economic data performance. If inflation cools and rate-cut expectations rise, that will provide support for gold. If economic data comes in stronger and inflation rebounds, rate-cut expectations get pushed back; with the dollar and U.S. Treasury yields moving higher, the gold price will face downward pressure. Geopolitical events can mostly trigger short-lived impulse moves—risk-off buying arrives quickly and also fades quickly—making it difficult to change the current consolidation structure. Often, after a spike higher, gold quickly falls back. Ongoing global central bank purchases of gold mainly provide support to the longer-term base, helping stabilize the bigger cycle, but they are unlikely to directly alter the short-term consolidation rhythm. Going forward, focus on U.S. inflation and retail sales data, because before-and-after the releases, gold price volatility is likely to increase significantly.
In the short term, the primary resistance zone is 4395–4410. Only if it can effectively hold above 4410 can the rebound continue, creating an opportunity to once again challenge the prior high near 4450. If price repeatedly hits this range and cannot get through, gold may fall back again. Strong short-term support lies at 4310–4315. If 4350–4360 can be held, the high-range consolidation pattern can continue. Once there is an effective breakdown below 4310–4305, the room for a pullback will open up, and the next target range to watch would be 4250–4280.
After the recent run-up and pullback, the market’s overbought conditions in indicators have already been partially digested. At present, there is no clear one-way direction; this is a consolidation-and-stalemate phase. Don’t make subjective bets on a single direction—wait for confirmation from signals of breaks in key support and resistance levels. Going forward, keep a close eye on three things: (1) the direction of the U.S. dollar and real Treasury yields, (2) major U.S. economic data, and (3) whether the support zone 4315–4335 and the resistance zone 4395–4410 can hold or be breached. The bull structure for the larger cycle is still intact. At this stage, the market is mainly characterized by consolidation that digests profits; choppy back-and-forth trading will be the norm. The market direction still needs price breakthroughs to be confirmed along with supporting data.$XAU
The Federal Reserve’s policy expectations remain the core storyline for the market. Investors have been weighing U.S. inflation and economic data performance. If inflation cools and rate-cut expectations rise, that will provide support for gold. If economic data comes in stronger and inflation rebounds, rate-cut expectations get pushed back; with the dollar and U.S. Treasury yields moving higher, the gold price will face downward pressure. Geopolitical events can mostly trigger short-lived impulse moves—risk-off buying arrives quickly and also fades quickly—making it difficult to change the current consolidation structure. Often, after a spike higher, gold quickly falls back. Ongoing global central bank purchases of gold mainly provide support to the longer-term base, helping stabilize the bigger cycle, but they are unlikely to directly alter the short-term consolidation rhythm. Going forward, focus on U.S. inflation and retail sales data, because before-and-after the releases, gold price volatility is likely to increase significantly.
In the short term, the primary resistance zone is 4395–4410. Only if it can effectively hold above 4410 can the rebound continue, creating an opportunity to once again challenge the prior high near 4450. If price repeatedly hits this range and cannot get through, gold may fall back again. Strong short-term support lies at 4310–4315. If 4350–4360 can be held, the high-range consolidation pattern can continue. Once there is an effective breakdown below 4310–4305, the room for a pullback will open up, and the next target range to watch would be 4250–4280.
After the recent run-up and pullback, the market’s overbought conditions in indicators have already been partially digested. At present, there is no clear one-way direction; this is a consolidation-and-stalemate phase. Don’t make subjective bets on a single direction—wait for confirmation from signals of breaks in key support and resistance levels. Going forward, keep a close eye on three things: (1) the direction of the U.S. dollar and real Treasury yields, (2) major U.S. economic data, and (3) whether the support zone 4315–4335 and the resistance zone 4395–4410 can hold or be breached. The bull structure for the larger cycle is still intact. At this stage, the market is mainly characterized by consolidation that digests profits; choppy back-and-forth trading will be the norm. The market direction still needs price breakthroughs to be confirmed along with supporting data.$XAU
1
2
395
·
--
Analysis of the latest gold market trends
Gold intraday moved through a standard shakeout-and-rebound pattern. In the afternoon, it dragged downward in a tiring, slow grind that made many retail traders panic and cut losses. In the evening, a single one-hour long bullish candle surged straight up, strongly regaining lost ground and helping the price hold above the area around 4356—switching the order flow instantly from weak to strong.
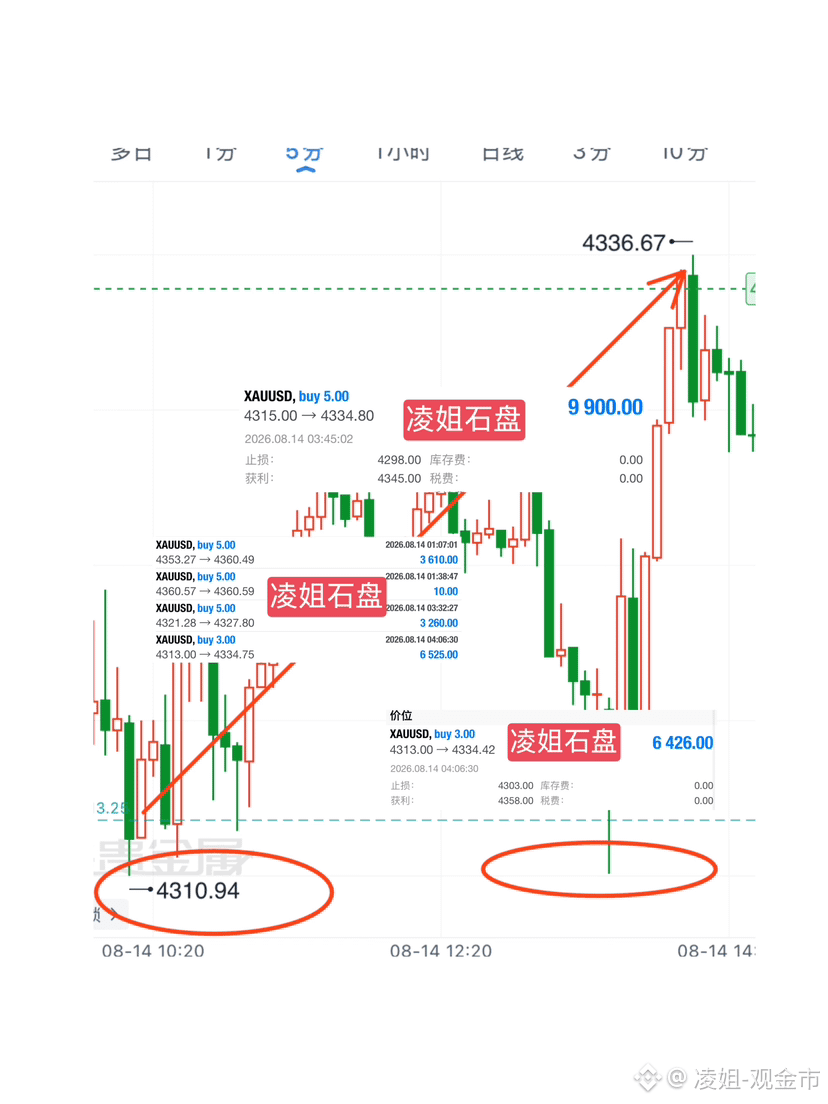
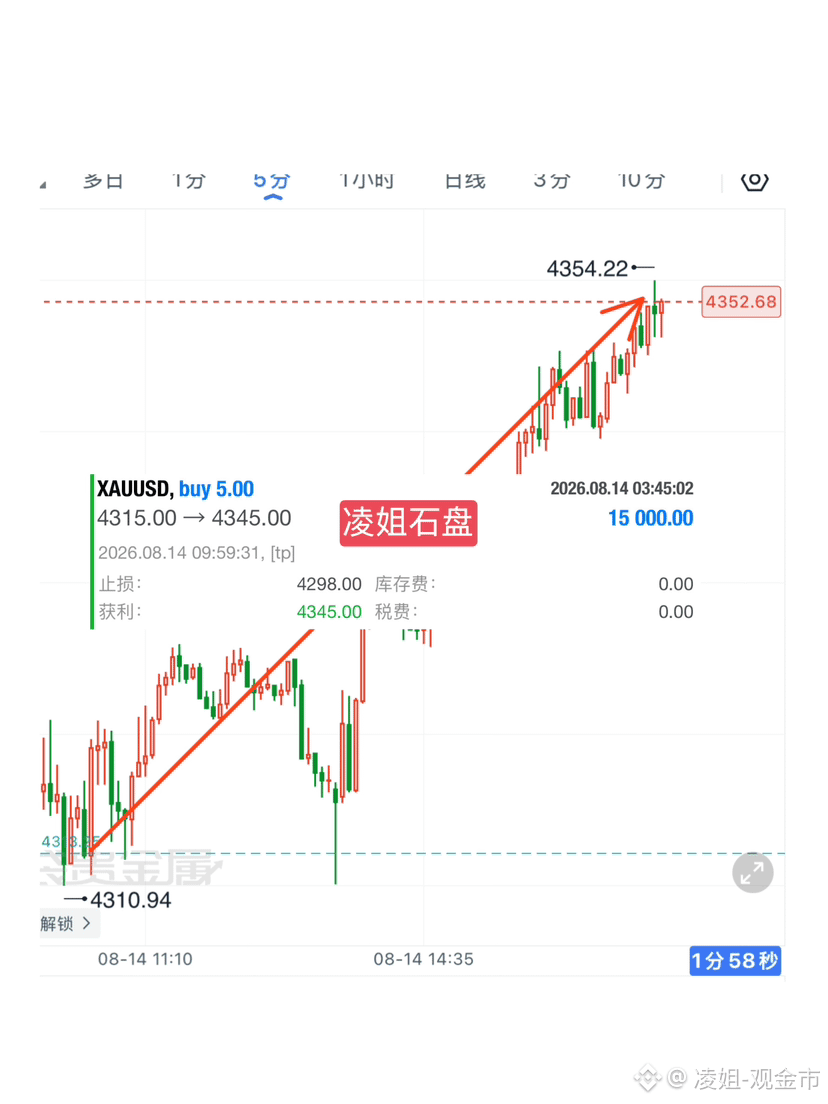
From the four-hour timeframe, this pullback is entirely a healthy consolidation, not a trend reversal. The price tested the 4310 key support twice, and both times it held firmly. This is the core defensive zone for the four-hour bullish wave. What’s clearly happening is the main players accumulating at low levels—washing out the uncertain floating positions. The long setup based on 4315 was executed perfectly earlier: price oscillated upward, broke strongly, and then held above the 4345 resistance level. This fully demonstrates that buying power below is very solid.
The four-hour technical structure has been repaired and turned favorable again. Short-term bearish downside momentum has been completely exhausted, and the bullish trend continues. The current market has returned to a healthy upward rhythm, so there’s no need to look for downside pressure in the short term. In terms of execution, focus mainly on the key support zone of 4310–4320. As long as subsequent pullbacks do not break that area decisively, the long-side structure remains intact. For the next phase, expectations are for continued choppy strength higher. Avoid letting brief intraday dips disrupt your rhythm.
Gold: scale in buys at 4315-4325-4335, targeting 4385-4395 $XAUT
{future}(XAUTUSDT)
Analysis of the latest gold market trends
Gold intraday moved through a standard shakeout-and-rebound pattern. In the afternoon, it dragged downward in a tiring, slow grind that made many retail traders panic and cut losses. In the evening, a single one-hour long bullish candle surged straight up, strongly regaining lost ground and helping the price hold above the area around 4356—switching the order flow instantly from weak to strong.
From the four-hour timeframe, this pullback is entirely a healthy consolidation, not a trend reversal. The price tested the 4310 key support twice, and both times it held firmly. This is the core defensive zone for the four-hour bullish wave. What’s clearly happening is the main players accumulating at low levels—washing out the uncertain floating positions. The long setup based on 4315 was executed perfectly earlier: price oscillated upward, broke strongly, and then held above the 4345 resistance level. This fully demonstrates that buying power below is very solid.
The four-hour technical structure has been repaired and turned favorable again. Short-term bearish downside momentum has been completely exhausted, and the bullish trend continues. The current market has returned to a healthy upward rhythm, so there’s no need to look for downside pressure in the short term. In terms of execution, focus mainly on the key support zone of 4310–4320. As long as subsequent pullbacks do not break that area decisively, the long-side structure remains intact. For the next phase, expectations are for continued choppy strength higher. Avoid letting brief intraday dips disrupt your rhythm.
Gold: scale in buys at 4315-4325-4335, targeting 4385-4395 $XAUT
Gold intraday moved through a standard shakeout-and-rebound pattern. In the afternoon, it dragged downward in a tiring, slow grind that made many retail traders panic and cut losses. In the evening, a single one-hour long bullish candle surged straight up, strongly regaining lost ground and helping the price hold above the area around 4356—switching the order flow instantly from weak to strong.
From the four-hour timeframe, this pullback is entirely a healthy consolidation, not a trend reversal. The price tested the 4310 key support twice, and both times it held firmly. This is the core defensive zone for the four-hour bullish wave. What’s clearly happening is the main players accumulating at low levels—washing out the uncertain floating positions. The long setup based on 4315 was executed perfectly earlier: price oscillated upward, broke strongly, and then held above the 4345 resistance level. This fully demonstrates that buying power below is very solid.
The four-hour technical structure has been repaired and turned favorable again. Short-term bearish downside momentum has been completely exhausted, and the bullish trend continues. The current market has returned to a healthy upward rhythm, so there’s no need to look for downside pressure in the short term. In terms of execution, focus mainly on the key support zone of 4310–4320. As long as subsequent pullbacks do not break that area decisively, the long-side structure remains intact. For the next phase, expectations are for continued choppy strength higher. Avoid letting brief intraday dips disrupt your rhythm.
Gold: scale in buys at 4315-4325-4335, targeting 4385-4395 $XAUT
203
·
--
Gold Latest Market Analysis
In the short term, gold has entered a high-level pullback and correction phase overall, and the price action is no longer a one-way rally. The 4-hour chart clearly shows that after gold surged to the 4450 peak, it then dropped sharply. Profit-taking by the long side was concentrated and released quickly. In the short term, the moving averages have turned downward, and indicators have weakened—this has completely ended the previous strong upward momentum. From here, the market is mainly characterized by range-bound and slightly bearish movement.
Yesterday’s U.S. PPI data was generally mild, but core inflation remains fairly sticky. Combined with hawkish remarks from Fed officials, market enthusiasm for chasing longs was dampened. Although rate-hike expectations for the Fed have cooled and global central banks continue to buy gold—providing long-term support and limiting the scope for a major plunge—the short-term positive factors have already been fully priced in, with no new upside momentum.
In the short term, focus on key ranges: the main resistance is around 4383–4395. If price rebounds but fails to break above this level, it is likely to continue oscillating and moving lower. The key support on the downside is at 4330, which is the short-term lifeline for the bulls. If this level holds, gold is simply undergoing a high-level consolidation. But if it breaks, the pullback could deepen further. Overall, today’s gold is likely to trade in a range with corrective consolidation. In the short term it is slightly bearish, while the broader trend remains bullish. Do not blindly chase or sell off impulsively.
Gold Latest Market Analysis
In the short term, gold has entered a high-level pullback and correction phase overall, and the price action is no longer a one-way rally. The 4-hour chart clearly shows that after gold surged to the 4450 peak, it then dropped sharply. Profit-taking by the long side was concentrated and released quickly. In the short term, the moving averages have turned downward, and indicators have weakened—this has completely ended the previous strong upward momentum. From here, the market is mainly characterized by range-bound and slightly bearish movement.
Yesterday’s U.S. PPI data was generally mild, but core inflation remains fairly sticky. Combined with hawkish remarks from Fed officials, market enthusiasm for chasing longs was dampened. Although rate-hike expectations for the Fed have cooled and global central banks continue to buy gold—providing long-term support and limiting the scope for a major plunge—the short-term positive factors have already been fully priced in, with no new upside momentum.
In the short term, focus on key ranges: the main resistance is around 4383–4395. If price rebounds but fails to break above this level, it is likely to continue oscillating and moving lower. The key support on the downside is at 4330, which is the short-term lifeline for the bulls. If this level holds, gold is simply undergoing a high-level consolidation. But if it breaks, the pullback could deepen further. Overall, today’s gold is likely to trade in a range with corrective consolidation. In the short term it is slightly bearish, while the broader trend remains bullish. Do not blindly chase or sell off impulsively.
In the short term, gold has entered a high-level pullback and correction phase overall, and the price action is no longer a one-way rally. The 4-hour chart clearly shows that after gold surged to the 4450 peak, it then dropped sharply. Profit-taking by the long side was concentrated and released quickly. In the short term, the moving averages have turned downward, and indicators have weakened—this has completely ended the previous strong upward momentum. From here, the market is mainly characterized by range-bound and slightly bearish movement.
Yesterday’s U.S. PPI data was generally mild, but core inflation remains fairly sticky. Combined with hawkish remarks from Fed officials, market enthusiasm for chasing longs was dampened. Although rate-hike expectations for the Fed have cooled and global central banks continue to buy gold—providing long-term support and limiting the scope for a major plunge—the short-term positive factors have already been fully priced in, with no new upside momentum.
In the short term, focus on key ranges: the main resistance is around 4383–4395. If price rebounds but fails to break above this level, it is likely to continue oscillating and moving lower. The key support on the downside is at 4330, which is the short-term lifeline for the bulls. If this level holds, gold is simply undergoing a high-level consolidation. But if it breaks, the pullback could deepen further. Overall, today’s gold is likely to trade in a range with corrective consolidation. In the short term it is slightly bearish, while the broader trend remains bullish. Do not blindly chase or sell off impulsively.
1
254
·
--
Verified
Gold Latest Market Update Analysis
Last Friday’s Non-Farm Payrolls data came in unexpectedly weak, laying the foundation for this round of strong gains. The market widely expects the Fed to pause rate hikes, with further cuts coming later. The dollar and US Treasury yields have been operating weakly, while global central banks continue to increase their gold holdings. Combined with geopolitical risk aversion providing a backstop, the medium-to-long-term upward logic remains solid. During the day, gold surged to a high at 4435 in the early session, then faced pressure as profit-taking concentrated. In the afternoon it pulled back deeply to the 4356 low. In the evening, it rebounded and stabilized around 4360, trading in a narrow range. With geopolitical news easing in the short term, the ability of short-term longs to surge has been temporarily weakened, and bulls and bears have entered a balanced tug-of-war.
With consecutive large bullish daily candles, the overall moving averages are aligned in a bullish configuration, and the upward structure has not been broken. The long upper shadow candle only reflects technical correction after being overbought; it does not indicate a trend reversal. Key support on the 4-hour timeframe is 4330-4352-4341-4407. Near-term resistance above lies at 4400-4437-4475-4500. Only if price can build volume and hold above 4400 can it reopen upward room, and an attempt at the 4458 breakout could potentially target 4500. At present, short-term bullish momentum is fading, and the market shows clear sideways characteristics, so it is not suitable to chase positions aggressively.
After gold surged in the early session yesterday, it then fell sharply. Following an overnight rebound, it continued to trade sideways and then fell again, ultimately closing down on the daily chart. Looking at gold’s current price action, there are signs of another potential pullback in the short term, but overall the trend still leans bullish; the strategy remains to look for buying opportunities on dips.
Gold: around 4335-4345, with upside targets at 4398-4435-4458
#Gold# #SpotGold# #LondonGold# #GoldPrice# #金价升破4400美元创两月高位 #美国7月CPI与PPI数据本周出炉
Gold Latest Market Update Analysis
Last Friday’s Non-Farm Payrolls data came in unexpectedly weak, laying the foundation for this round of strong gains. The market widely expects the Fed to pause rate hikes, with further cuts coming later. The dollar and US Treasury yields have been operating weakly, while global central banks continue to increase their gold holdings. Combined with geopolitical risk aversion providing a backstop, the medium-to-long-term upward logic remains solid. During the day, gold surged to a high at 4435 in the early session, then faced pressure as profit-taking concentrated. In the afternoon it pulled back deeply to the 4356 low. In the evening, it rebounded and stabilized around 4360, trading in a narrow range. With geopolitical news easing in the short term, the ability of short-term longs to surge has been temporarily weakened, and bulls and bears have entered a balanced tug-of-war.
With consecutive large bullish daily candles, the overall moving averages are aligned in a bullish configuration, and the upward structure has not been broken. The long upper shadow candle only reflects technical correction after being overbought; it does not indicate a trend reversal. Key support on the 4-hour timeframe is 4330-4352-4341-4407. Near-term resistance above lies at 4400-4437-4475-4500. Only if price can build volume and hold above 4400 can it reopen upward room, and an attempt at the 4458 breakout could potentially target 4500. At present, short-term bullish momentum is fading, and the market shows clear sideways characteristics, so it is not suitable to chase positions aggressively.
After gold surged in the early session yesterday, it then fell sharply. Following an overnight rebound, it continued to trade sideways and then fell again, ultimately closing down on the daily chart. Looking at gold’s current price action, there are signs of another potential pullback in the short term, but overall the trend still leans bullish; the strategy remains to look for buying opportunities on dips.
Gold: around 4335-4345, with upside targets at 4398-4435-4458
#Gold# #SpotGold# #LondonGold# #GoldPrice# #金价升破4400美元创两月高位 #美国7月CPI与PPI数据本周出炉
Last Friday’s Non-Farm Payrolls data came in unexpectedly weak, laying the foundation for this round of strong gains. The market widely expects the Fed to pause rate hikes, with further cuts coming later. The dollar and US Treasury yields have been operating weakly, while global central banks continue to increase their gold holdings. Combined with geopolitical risk aversion providing a backstop, the medium-to-long-term upward logic remains solid. During the day, gold surged to a high at 4435 in the early session, then faced pressure as profit-taking concentrated. In the afternoon it pulled back deeply to the 4356 low. In the evening, it rebounded and stabilized around 4360, trading in a narrow range. With geopolitical news easing in the short term, the ability of short-term longs to surge has been temporarily weakened, and bulls and bears have entered a balanced tug-of-war.
With consecutive large bullish daily candles, the overall moving averages are aligned in a bullish configuration, and the upward structure has not been broken. The long upper shadow candle only reflects technical correction after being overbought; it does not indicate a trend reversal. Key support on the 4-hour timeframe is 4330-4352-4341-4407. Near-term resistance above lies at 4400-4437-4475-4500. Only if price can build volume and hold above 4400 can it reopen upward room, and an attempt at the 4458 breakout could potentially target 4500. At present, short-term bullish momentum is fading, and the market shows clear sideways characteristics, so it is not suitable to chase positions aggressively.
After gold surged in the early session yesterday, it then fell sharply. Following an overnight rebound, it continued to trade sideways and then fell again, ultimately closing down on the daily chart. Looking at gold’s current price action, there are signs of another potential pullback in the short term, but overall the trend still leans bullish; the strategy remains to look for buying opportunities on dips.
Gold: around 4335-4345, with upside targets at 4398-4435-4458
#Gold# #SpotGold# #LondonGold# #GoldPrice# #金价升破4400美元创两月高位 #美国7月CPI与PPI数据本周出炉
2
3.3k
·
--
Black Friday and Non-Farm Payrolls make a major debut. On Thursday, initial U.S. jobless claims data performed strongly: for the week, initial claims came in at 199,000, the third consecutive week below 200,000, and the four-week average hit the lowest level since September 2022. This highlights that the U.S. labor market remains highly resilient, while continuing claims also met market expectations. Economists expect that Friday’s July non-farm employment data may maintain healthy growth. Consumption continues to support the economy, and non-farm payrolls will become the key driver for the Gold market’s direction in the coming period.
Gold’s daily chart closed with a bullish long candle. The Bollinger Bands opened significantly, with the KDJ forming a golden cross and the MACD red histogram bars expanding. On the higher time frame, the broader uptrend still has the upper hand, though there is a risk of a temporary pullback in the medium term. On the 4-hour chart, the KDJ shows a death cross, and the red histogram bars gradually shrink. On the hourly chart, indicators show a death cross turning downward, with green bars increasing in volume—suggesting a short-term pullback and rebound/repair may be needed.
Short-term support: 4225‑4207‑4180‑4142;
Resistance above: 4275‑4304‑4335‑4358.
In London silver, the big range remains volatile with wide fluctuations. The medium-term outlook leans toward a period of pullback downward, and after the rebound, traders should also watch for short-term retracement. Resistance levels are 62.7 and 66.1, while supports are 59.4 and 57.
The overall long-term trend remains bullish, but short-term technical signals indicate a pullback. Focus on waiting for non-farm guidance. Data-driven market volatility is intense—don’t chase trades blindly; manage position sizing and use stop-loss risk controls.
Black Friday and Non-Farm Payrolls make a major debut. On Thursday, initial U.S. jobless claims data performed strongly: for the week, initial claims came in at 199,000, the third consecutive week below 200,000, and the four-week average hit the lowest level since September 2022. This highlights that the U.S. labor market remains highly resilient, while continuing claims also met market expectations. Economists expect that Friday’s July non-farm employment data may maintain healthy growth. Consumption continues to support the economy, and non-farm payrolls will become the key driver for the Gold market’s direction in the coming period.
Gold’s daily chart closed with a bullish long candle. The Bollinger Bands opened significantly, with the KDJ forming a golden cross and the MACD red histogram bars expanding. On the higher time frame, the broader uptrend still has the upper hand, though there is a risk of a temporary pullback in the medium term. On the 4-hour chart, the KDJ shows a death cross, and the red histogram bars gradually shrink. On the hourly chart, indicators show a death cross turning downward, with green bars increasing in volume—suggesting a short-term pullback and rebound/repair may be needed.
Short-term support: 4225‑4207‑4180‑4142;
Resistance above: 4275‑4304‑4335‑4358.
In London silver, the big range remains volatile with wide fluctuations. The medium-term outlook leans toward a period of pullback downward, and after the rebound, traders should also watch for short-term retracement. Resistance levels are 62.7 and 66.1, while supports are 59.4 and 57.
The overall long-term trend remains bullish, but short-term technical signals indicate a pullback. Focus on waiting for non-farm guidance. Data-driven market volatility is intense—don’t chase trades blindly; manage position sizing and use stop-loss risk controls.
Gold’s daily chart closed with a bullish long candle. The Bollinger Bands opened significantly, with the KDJ forming a golden cross and the MACD red histogram bars expanding. On the higher time frame, the broader uptrend still has the upper hand, though there is a risk of a temporary pullback in the medium term. On the 4-hour chart, the KDJ shows a death cross, and the red histogram bars gradually shrink. On the hourly chart, indicators show a death cross turning downward, with green bars increasing in volume—suggesting a short-term pullback and rebound/repair may be needed.
Short-term support: 4225‑4207‑4180‑4142;
Resistance above: 4275‑4304‑4335‑4358.
In London silver, the big range remains volatile with wide fluctuations. The medium-term outlook leans toward a period of pullback downward, and after the rebound, traders should also watch for short-term retracement. Resistance levels are 62.7 and 66.1, while supports are 59.4 and 57.
The overall long-term trend remains bullish, but short-term technical signals indicate a pullback. Focus on waiting for non-farm guidance. Data-driven market volatility is intense—don’t chase trades blindly; manage position sizing and use stop-loss risk controls.
256
·
--
I. Short-term catalysts: weak employment data sparks rate-cut expectations
ADP data far below expectations: In July, ADP added only 44,000 jobs, well below the forecast of 700,000?—showing the US labor market is accelerating into a cooling phase.
Rate-hike expectations abruptly fade: CME FedWatch indicates the probability of keeping rates unchanged in September rises to 45%, the highest in more than a month; meanwhile, 10-year US Treasury yields fall in tandem, significantly reducing the opportunity cost of holding non-yielding gold.
A weaker dollar provides support: The US Dollar Index drops, making dollar-denominated gold more attractive to overseas buyers, as capital concentrates into the precious metals market.
II. Key turning point: negotiations around the Strait of Hormuz rewrite the inflation narrative
Progress in US–Iran talks: The US, Iran, and Oman are working to push forward a temporary arrangement regarding the reopening of the Strait of Hormuz, and international oil prices plunge more than 6% on the news.
Relieved inflation pressure: A pullback in energy prices breaks the prior logic chain in which high oil prices pushed inflation up and forced the Fed to maintain high rates—removing the biggest negative factor weighing on gold.
Switch in pricing logic: The market’s main trading line flips from “geopolitical conflict → oil price rise → inflation stays high → rate hikes suppress gold” to “conditions ease → oil prices fall → inflation cools → rate-cut space opens up → gold benefits.”
III. Long-term foundation: global central banks continue large-scale gold buying
A record in Q2 purchases: Global central banks’ net gold purchases reached 289 tons in Q2, up 62% year over year. The restart of gold buying by the Bank of Korea after 13 years is especially noteworthy.
De-dollarization trend deepens: To hedge against US dollar credit risk, more countries continue to swap foreign-exchange reserves from US Treasuries into physical gold, forming long-term, stable, rigid demand and helping to firmly support a floor under gold prices.
I. Short-term catalysts: weak employment data sparks rate-cut expectations
ADP data far below expectations: In July, ADP added only 44,000 jobs, well below the forecast of 700,000?—showing the US labor market is accelerating into a cooling phase.
Rate-hike expectations abruptly fade: CME FedWatch indicates the probability of keeping rates unchanged in September rises to 45%, the highest in more than a month; meanwhile, 10-year US Treasury yields fall in tandem, significantly reducing the opportunity cost of holding non-yielding gold.
A weaker dollar provides support: The US Dollar Index drops, making dollar-denominated gold more attractive to overseas buyers, as capital concentrates into the precious metals market.
II. Key turning point: negotiations around the Strait of Hormuz rewrite the inflation narrative
Progress in US–Iran talks: The US, Iran, and Oman are working to push forward a temporary arrangement regarding the reopening of the Strait of Hormuz, and international oil prices plunge more than 6% on the news.
Relieved inflation pressure: A pullback in energy prices breaks the prior logic chain in which high oil prices pushed inflation up and forced the Fed to maintain high rates—removing the biggest negative factor weighing on gold.
Switch in pricing logic: The market’s main trading line flips from “geopolitical conflict → oil price rise → inflation stays high → rate hikes suppress gold” to “conditions ease → oil prices fall → inflation cools → rate-cut space opens up → gold benefits.”
III. Long-term foundation: global central banks continue large-scale gold buying
A record in Q2 purchases: Global central banks’ net gold purchases reached 289 tons in Q2, up 62% year over year. The restart of gold buying by the Bank of Korea after 13 years is especially noteworthy.
De-dollarization trend deepens: To hedge against US dollar credit risk, more countries continue to swap foreign-exchange reserves from US Treasuries into physical gold, forming long-term, stable, rigid demand and helping to firmly support a floor under gold prices.
ADP data far below expectations: In July, ADP added only 44,000 jobs, well below the forecast of 700,000?—showing the US labor market is accelerating into a cooling phase.
Rate-hike expectations abruptly fade: CME FedWatch indicates the probability of keeping rates unchanged in September rises to 45%, the highest in more than a month; meanwhile, 10-year US Treasury yields fall in tandem, significantly reducing the opportunity cost of holding non-yielding gold.
A weaker dollar provides support: The US Dollar Index drops, making dollar-denominated gold more attractive to overseas buyers, as capital concentrates into the precious metals market.
II. Key turning point: negotiations around the Strait of Hormuz rewrite the inflation narrative
Progress in US–Iran talks: The US, Iran, and Oman are working to push forward a temporary arrangement regarding the reopening of the Strait of Hormuz, and international oil prices plunge more than 6% on the news.
Relieved inflation pressure: A pullback in energy prices breaks the prior logic chain in which high oil prices pushed inflation up and forced the Fed to maintain high rates—removing the biggest negative factor weighing on gold.
Switch in pricing logic: The market’s main trading line flips from “geopolitical conflict → oil price rise → inflation stays high → rate hikes suppress gold” to “conditions ease → oil prices fall → inflation cools → rate-cut space opens up → gold benefits.”
III. Long-term foundation: global central banks continue large-scale gold buying
A record in Q2 purchases: Global central banks’ net gold purchases reached 289 tons in Q2, up 62% year over year. The restart of gold buying by the Bank of Korea after 13 years is especially noteworthy.
De-dollarization trend deepens: To hedge against US dollar credit risk, more countries continue to swap foreign-exchange reserves from US Treasuries into physical gold, forming long-term, stable, rigid demand and helping to firmly support a floor under gold prices.
297
·
--
Gold price makes a strong breakout, sharing the support and resistance levels!
Last month saw wide-range consolidation. In my previous post I mentioned that we should wait for the market to choose a direction, and my personal view has been mostly bullish. So I’ve kept my position at the bottom throughout; during the choppy washout, I was not shaken out. Yesterday the price surged to the upside—my bottom holdings have been fully closed, but in the end it was a sale that went through the roof, haha! However, some friends also followed the plan and exited around 4300, Ziying—really good. It’s not in vain that I kept reminding everyone about the bullish bias along the way. The key direction levels were given in advance every day!
Back to the chart: yesterday’s price strongly broke above some key prior resistance levels, but it didn’t offer an ideal pullback opportunity. Still, don’t chase blindly. For the short term, watch the support area below at 4235–4253, and next 4210–4220; on the upside, 4315–4330, and next the major-level strong prior resistance at 4370–4385. It’s more suitable to stay on the sidelines and wait until price reaches the key levels before reassessing market opportunities.
Risk warning: The content is only for technical-exchange purposes based on chart analysis and does not constitute any investment advice. Manage risk well.
Gold price makes a strong breakout, sharing the support and resistance levels!
Last month saw wide-range consolidation. In my previous post I mentioned that we should wait for the market to choose a direction, and my personal view has been mostly bullish. So I’ve kept my position at the bottom throughout; during the choppy washout, I was not shaken out. Yesterday the price surged to the upside—my bottom holdings have been fully closed, but in the end it was a sale that went through the roof, haha! However, some friends also followed the plan and exited around 4300, Ziying—really good. It’s not in vain that I kept reminding everyone about the bullish bias along the way. The key direction levels were given in advance every day!
Back to the chart: yesterday’s price strongly broke above some key prior resistance levels, but it didn’t offer an ideal pullback opportunity. Still, don’t chase blindly. For the short term, watch the support area below at 4235–4253, and next 4210–4220; on the upside, 4315–4330, and next the major-level strong prior resistance at 4370–4385. It’s more suitable to stay on the sidelines and wait until price reaches the key levels before reassessing market opportunities.
Risk warning: The content is only for technical-exchange purposes based on chart analysis and does not constitute any investment advice. Manage risk well.
Last month saw wide-range consolidation. In my previous post I mentioned that we should wait for the market to choose a direction, and my personal view has been mostly bullish. So I’ve kept my position at the bottom throughout; during the choppy washout, I was not shaken out. Yesterday the price surged to the upside—my bottom holdings have been fully closed, but in the end it was a sale that went through the roof, haha! However, some friends also followed the plan and exited around 4300, Ziying—really good. It’s not in vain that I kept reminding everyone about the bullish bias along the way. The key direction levels were given in advance every day!
Back to the chart: yesterday’s price strongly broke above some key prior resistance levels, but it didn’t offer an ideal pullback opportunity. Still, don’t chase blindly. For the short term, watch the support area below at 4235–4253, and next 4210–4220; on the upside, 4315–4330, and next the major-level strong prior resistance at 4370–4385. It’s more suitable to stay on the sidelines and wait until price reaches the key levels before reassessing market opportunities.
Risk warning: The content is only for technical-exchange purposes based on chart analysis and does not constitute any investment advice. Manage risk well.
288
·
--
ISM manufacturing PMI hits 55.6, a four-year high; all sub-indices for new orders, production, and employment strengthen across the board. Under traditional macro logic, an overheating economy should push up U.S. Treasury yields. But the market tape shows a clear divergence: after the data was released, Treasury prices rose while yields fell. This expectation gap is worth every trader’s attention.
Why do strong data fail to lift yields?
1、Oil prices falling offsets inflation worries about manufacturing overheating.
Although manufacturing demand is booming, recent Middle East tensions have eased and oil prices have dropped sharply. The market now believes inflation pressure from the energy side has been temporarily relieved, offsetting the inflation concerns brought by manufacturing’s improved conditions, and Treasury buyers have stepped in.
2、The market has already priced in the strong-growth expectations in advance.
Earlier, long-term Treasury yields kept climbing, already reflecting the reality of U.S. economic resilience and the delay in rate cuts. ISM is merely validating an existing view—it did not deliver any inflation upside surprise. “Buy the facts” flows moved in.
3、Hidden risks within the sub-indices.
While the prices component remains at a high level, it has started to ease at the margin. The market believes the manufacturing recovery is a moderate repair rather than an overheating-style explosion, so it is insufficient to force the Federal Reserve to restart rate hikes.
1、Short term: A sentiment repair window for risk assets
As Treasury yields fall, valuation pressure on duration assets like BTC and ETH is reduced. U.S. stock cycle sectors benefit from manufacturing strength, lifting risk appetite and indirectly driving a rebound in crypto.
2、In the medium to long term, don’t be misled by short-term price action.
ISM staying above the 50 boom-bust line indicates the U.S. economy remains highly resilient, and rate cuts will still be pushed back. This round of yield declines is a phase of adjustment and repair—it does not mean the upward trend in interest rates has fully reversed. Once inflation data re-accelerates, yields will likely rebound quickly.
My independent view
This is a classic “expectations already fully priced in, and the data release turns into a realization” type of market.
Do not interpret this yield decline as a signal that liquidity is turning.
A strong economy plus falling oil prices is only a phase-specific combination benefit. Whether that “dividend” can persist depends mainly on whether oil prices can stay at low levels and whether PCE inflation data continues to cool.
You can take short-term trades on sentiment repair, but beware of chasing gains.
The broader macro backdrop is still one of higher rates maintained for longer—keep a close watch. The key is whether PCE inflation and the 30-year U.S. Treasury yield can effectively break down through critical levels.
ISM manufacturing PMI hits 55.6, a four-year high; all sub-indices for new orders, production, and employment strengthen across the board. Under traditional macro logic, an overheating economy should push up U.S. Treasury yields. But the market tape shows a clear divergence: after the data was released, Treasury prices rose while yields fell. This expectation gap is worth every trader’s attention.
Why do strong data fail to lift yields?
1、Oil prices falling offsets inflation worries about manufacturing overheating.
Although manufacturing demand is booming, recent Middle East tensions have eased and oil prices have dropped sharply. The market now believes inflation pressure from the energy side has been temporarily relieved, offsetting the inflation concerns brought by manufacturing’s improved conditions, and Treasury buyers have stepped in.
2、The market has already priced in the strong-growth expectations in advance.
Earlier, long-term Treasury yields kept climbing, already reflecting the reality of U.S. economic resilience and the delay in rate cuts. ISM is merely validating an existing view—it did not deliver any inflation upside surprise. “Buy the facts” flows moved in.
3、Hidden risks within the sub-indices.
While the prices component remains at a high level, it has started to ease at the margin. The market believes the manufacturing recovery is a moderate repair rather than an overheating-style explosion, so it is insufficient to force the Federal Reserve to restart rate hikes.
1、Short term: A sentiment repair window for risk assets
As Treasury yields fall, valuation pressure on duration assets like BTC and ETH is reduced. U.S. stock cycle sectors benefit from manufacturing strength, lifting risk appetite and indirectly driving a rebound in crypto.
2、In the medium to long term, don’t be misled by short-term price action.
ISM staying above the 50 boom-bust line indicates the U.S. economy remains highly resilient, and rate cuts will still be pushed back. This round of yield declines is a phase of adjustment and repair—it does not mean the upward trend in interest rates has fully reversed. Once inflation data re-accelerates, yields will likely rebound quickly.
My independent view
This is a classic “expectations already fully priced in, and the data release turns into a realization” type of market.
Do not interpret this yield decline as a signal that liquidity is turning.
A strong economy plus falling oil prices is only a phase-specific combination benefit. Whether that “dividend” can persist depends mainly on whether oil prices can stay at low levels and whether PCE inflation data continues to cool.
You can take short-term trades on sentiment repair, but beware of chasing gains.
The broader macro backdrop is still one of higher rates maintained for longer—keep a close watch. The key is whether PCE inflation and the 30-year U.S. Treasury yield can effectively break down through critical levels.
Why do strong data fail to lift yields?
1、Oil prices falling offsets inflation worries about manufacturing overheating.
Although manufacturing demand is booming, recent Middle East tensions have eased and oil prices have dropped sharply. The market now believes inflation pressure from the energy side has been temporarily relieved, offsetting the inflation concerns brought by manufacturing’s improved conditions, and Treasury buyers have stepped in.
2、The market has already priced in the strong-growth expectations in advance.
Earlier, long-term Treasury yields kept climbing, already reflecting the reality of U.S. economic resilience and the delay in rate cuts. ISM is merely validating an existing view—it did not deliver any inflation upside surprise. “Buy the facts” flows moved in.
3、Hidden risks within the sub-indices.
While the prices component remains at a high level, it has started to ease at the margin. The market believes the manufacturing recovery is a moderate repair rather than an overheating-style explosion, so it is insufficient to force the Federal Reserve to restart rate hikes.
1、Short term: A sentiment repair window for risk assets
As Treasury yields fall, valuation pressure on duration assets like BTC and ETH is reduced. U.S. stock cycle sectors benefit from manufacturing strength, lifting risk appetite and indirectly driving a rebound in crypto.
2、In the medium to long term, don’t be misled by short-term price action.
ISM staying above the 50 boom-bust line indicates the U.S. economy remains highly resilient, and rate cuts will still be pushed back. This round of yield declines is a phase of adjustment and repair—it does not mean the upward trend in interest rates has fully reversed. Once inflation data re-accelerates, yields will likely rebound quickly.
My independent view
This is a classic “expectations already fully priced in, and the data release turns into a realization” type of market.
Do not interpret this yield decline as a signal that liquidity is turning.
A strong economy plus falling oil prices is only a phase-specific combination benefit. Whether that “dividend” can persist depends mainly on whether oil prices can stay at low levels and whether PCE inflation data continues to cool.
You can take short-term trades on sentiment repair, but beware of chasing gains.
The broader macro backdrop is still one of higher rates maintained for longer—keep a close watch. The key is whether PCE inflation and the 30-year U.S. Treasury yield can effectively break down through critical levels.
121
·
--
Gold Latest Market Analysis
At present, the overall trend for gold is bullish. In the short term, it is consolidating at higher levels with a slight positive bias, and there is no sell-off signal. Simply put, here are the key reasons: First, US inflation has continued to ease. The market broadly expects the Federal Reserve to cut rates soon. With the US dollar and US Treasury yields weakening, this directly supports higher gold prices—this is the core driver behind gold’s sustained strength.
Central banks around the world have also been continuously and heavily buying gold, providing long-term support for the price and significantly compressing the room for a decline. A major drop is basically unlikely to occur. At the same time, global geopolitical conditions have remained unstable. The market can have risk-aversion demand at any moment, adding a risk-premium support to gold, helping it stay supported over time.
As long as gold holds above the key support level, the overall uptrend remains intact. What we see now is only a minor pullback after a rise, not a top. In the short term, there is still room for further upside, so there’s no need to blindly turn bearish.
Finally, a reminder: although the bigger trend is bullish, gold is currently trading at a high level—do not chase the price higher. The best approach is to buy on a pullback toward support. If, going forward, price breaks below the key support level, then adjust your strategy in a timely manner.
Gold: around 4045–4055, hold, with targets to 4110–4120
Gold Latest Market Analysis
At present, the overall trend for gold is bullish. In the short term, it is consolidating at higher levels with a slight positive bias, and there is no sell-off signal. Simply put, here are the key reasons: First, US inflation has continued to ease. The market broadly expects the Federal Reserve to cut rates soon. With the US dollar and US Treasury yields weakening, this directly supports higher gold prices—this is the core driver behind gold’s sustained strength.
Central banks around the world have also been continuously and heavily buying gold, providing long-term support for the price and significantly compressing the room for a decline. A major drop is basically unlikely to occur. At the same time, global geopolitical conditions have remained unstable. The market can have risk-aversion demand at any moment, adding a risk-premium support to gold, helping it stay supported over time.
As long as gold holds above the key support level, the overall uptrend remains intact. What we see now is only a minor pullback after a rise, not a top. In the short term, there is still room for further upside, so there’s no need to blindly turn bearish.
Finally, a reminder: although the bigger trend is bullish, gold is currently trading at a high level—do not chase the price higher. The best approach is to buy on a pullback toward support. If, going forward, price breaks below the key support level, then adjust your strategy in a timely manner.
Gold: around 4045–4055, hold, with targets to 4110–4120
At present, the overall trend for gold is bullish. In the short term, it is consolidating at higher levels with a slight positive bias, and there is no sell-off signal. Simply put, here are the key reasons: First, US inflation has continued to ease. The market broadly expects the Federal Reserve to cut rates soon. With the US dollar and US Treasury yields weakening, this directly supports higher gold prices—this is the core driver behind gold’s sustained strength.
Central banks around the world have also been continuously and heavily buying gold, providing long-term support for the price and significantly compressing the room for a decline. A major drop is basically unlikely to occur. At the same time, global geopolitical conditions have remained unstable. The market can have risk-aversion demand at any moment, adding a risk-premium support to gold, helping it stay supported over time.
As long as gold holds above the key support level, the overall uptrend remains intact. What we see now is only a minor pullback after a rise, not a top. In the short term, there is still room for further upside, so there’s no need to blindly turn bearish.
Finally, a reminder: although the bigger trend is bullish, gold is currently trading at a high level—do not chase the price higher. The best approach is to buy on a pullback toward support. If, going forward, price breaks below the key support level, then adjust your strategy in a timely manner.
Gold: around 4045–4055, hold, with targets to 4110–4120
214
·
--
The daily gold chart is currently in a low-range consolidation and repair phase after the drop has finished. Price action is pulling up and down in a fairly even manner, without a clear one-direction trend of a strong rally or a sharp selloff. This is a typical range-bound consolidation market.
On the four-hour short-term chart, the most critical range is very clear: 4080 on the upper side is a strong/weak turning point (a top), and 4020 on the lower side is the support bottom. When price rises toward the top, it tends to pull back; when it falls to the low area, there is demand stepping in to take over. The main play is frequent back-and-forth washing.
External interest-rate expectations have been weighing on gold prices and preventing a big upside breakout. However, central banks around the world continue to buy gold to provide a floor, so the market cannot fall easily. Therefore, recently the overall picture has been range-bound trading.
Resistance is at 4074–4082. If price pushes into this zone, it will most likely pull back. Stronger resistance lies above 4105—if it doesn’t break through, there is no bullish trend.
Support is at 4022–4030. If price drops to this level, it is likely to bounce. Once there is a valid breakdown below 4020, the market turns completely weak and heads straight toward the 4000 level.
Don’t chase rallies or catch falling prices—trade only the range. If 4025–4030 holds and stabilizes, look for a rebound. If price rallies into 4075–4080 and meets pressure, look for a pullback.
As long as 4020 isn’t broken, you can go long on lows whenever. Don’t chase the rally unless price stands above 4080. All intermediate positions should be kept under observation. The strategy is mainly to sell high and buy low. $XAUT
{future}(XAUTUSDT)
The daily gold chart is currently in a low-range consolidation and repair phase after the drop has finished. Price action is pulling up and down in a fairly even manner, without a clear one-direction trend of a strong rally or a sharp selloff. This is a typical range-bound consolidation market.
On the four-hour short-term chart, the most critical range is very clear: 4080 on the upper side is a strong/weak turning point (a top), and 4020 on the lower side is the support bottom. When price rises toward the top, it tends to pull back; when it falls to the low area, there is demand stepping in to take over. The main play is frequent back-and-forth washing.
External interest-rate expectations have been weighing on gold prices and preventing a big upside breakout. However, central banks around the world continue to buy gold to provide a floor, so the market cannot fall easily. Therefore, recently the overall picture has been range-bound trading.
Resistance is at 4074–4082. If price pushes into this zone, it will most likely pull back. Stronger resistance lies above 4105—if it doesn’t break through, there is no bullish trend.
Support is at 4022–4030. If price drops to this level, it is likely to bounce. Once there is a valid breakdown below 4020, the market turns completely weak and heads straight toward the 4000 level.
Don’t chase rallies or catch falling prices—trade only the range. If 4025–4030 holds and stabilizes, look for a rebound. If price rallies into 4075–4080 and meets pressure, look for a pullback.
As long as 4020 isn’t broken, you can go long on lows whenever. Don’t chase the rally unless price stands above 4080. All intermediate positions should be kept under observation. The strategy is mainly to sell high and buy low. $XAUT
On the four-hour short-term chart, the most critical range is very clear: 4080 on the upper side is a strong/weak turning point (a top), and 4020 on the lower side is the support bottom. When price rises toward the top, it tends to pull back; when it falls to the low area, there is demand stepping in to take over. The main play is frequent back-and-forth washing.
External interest-rate expectations have been weighing on gold prices and preventing a big upside breakout. However, central banks around the world continue to buy gold to provide a floor, so the market cannot fall easily. Therefore, recently the overall picture has been range-bound trading.
Resistance is at 4074–4082. If price pushes into this zone, it will most likely pull back. Stronger resistance lies above 4105—if it doesn’t break through, there is no bullish trend.
Support is at 4022–4030. If price drops to this level, it is likely to bounce. Once there is a valid breakdown below 4020, the market turns completely weak and heads straight toward the 4000 level.
Don’t chase rallies or catch falling prices—trade only the range. If 4025–4030 holds and stabilizes, look for a rebound. If price rallies into 4075–4080 and meets pressure, look for a pullback.
As long as 4020 isn’t broken, you can go long on lows whenever. Don’t chase the rally unless price stands above 4080. All intermediate positions should be kept under observation. The strategy is mainly to sell high and buy low. $XAUT
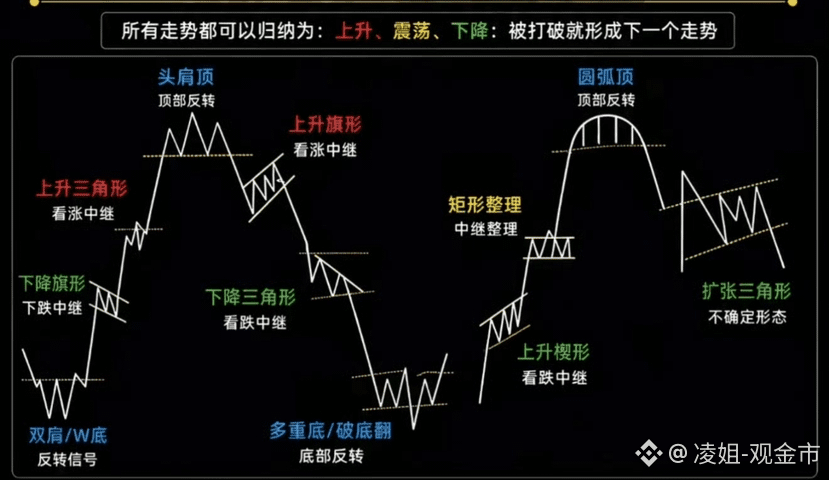
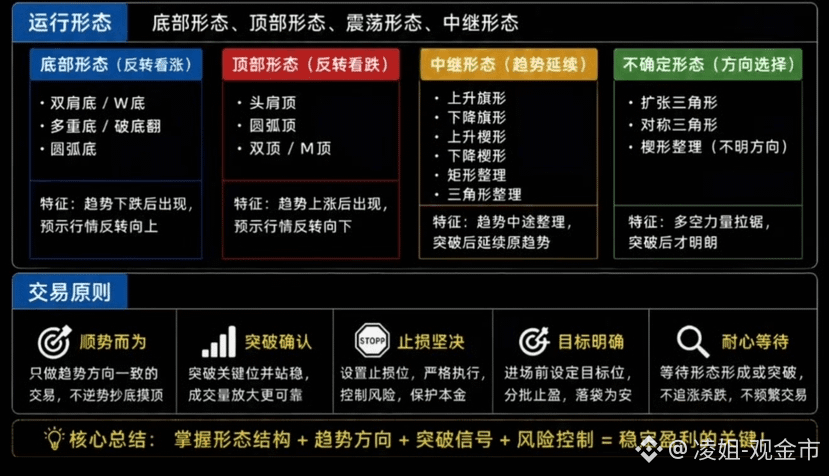
2
368
·
--
Golden Quick-Read Trading Cheat Sheet and Practical Application Tips
Gold market volatility is influenced by multiple factors, including policy signals, economic data, geopolitical sentiment, and capital flows. To interpret the market accurately, rely on a set of quick-read trading rhymes combined with a resonance logic framework to judge price trends and avoid most common trading mistakes. It’s important to note that these rhymes are only a summary of patterns; they cannot be used alone. You must combine them with the U.S. dollar trend, U.S. Treasury yields, and technical indicator resonance analysis.
Policy and public opinion are the core factors affecting gold prices. When policymakers release a dovish (easing) signal, market expectations for easing rise, the U.S. dollar and bond yields weaken, and gold is likely to receive support. Conversely, more hawkish (tightening-leaning) statements extend high interest-rate expectations and suppress the gold market.
Economic data directly drives market expectations. Weak employment data and cooling economic momentum are favorable for gold. If inflation data rebounds and the economy shows strong resilience, the market’s tightening expectations rise, putting pressure on gold prices.
Geopolitical developments mainly trigger short-term impulse moves and do not produce long-term trends. Escalating regional conflicts can boost risk-off sentiment and push gold higher in the short term, but the move’s durability is extremely poor. Once the situation eases and safe-haven capital retreats, the price action typically drops quickly—avoid blindly chasing rallies or selling in panic.
For medium- to long-term trends, focus on capital and reserve logic. Central banks in multiple countries continue to accumulate gold, which helps solidify the support at the base of gold prices. Meanwhile, continued outflows from gold ETFs can create a mid-term pressure pattern.
In practice, there are two major core risk-avoidance rules. First, when long and short views in the news are essentially hedged against each other, the market often turns into a narrow-range consolidation and washout; the best choice is to stand by and wait for direction to become clear. Second, when the market prices in expectations early, and after the data is released the “good news/good news” or “bad news/bad news” is quickly realized, prices often retrace—do not follow the crowd with momentum trades.
The entire trading core process can be summarized as follows: use the rhymes to define whether the news outlook is bullish or bearish, then verify the true strength with correlated instruments, and finally use technical indicators to filter the timing for entry. Always adhere to the principles of resonance trading, avoiding extremes, strictly controlling position sizing, and not forcing trades—these are key to consistently capturing the rhythm of the gold market.
Golden Quick-Read Trading Cheat Sheet and Practical Application Tips
Gold market volatility is influenced by multiple factors, including policy signals, economic data, geopolitical sentiment, and capital flows. To interpret the market accurately, rely on a set of quick-read trading rhymes combined with a resonance logic framework to judge price trends and avoid most common trading mistakes. It’s important to note that these rhymes are only a summary of patterns; they cannot be used alone. You must combine them with the U.S. dollar trend, U.S. Treasury yields, and technical indicator resonance analysis.
Policy and public opinion are the core factors affecting gold prices. When policymakers release a dovish (easing) signal, market expectations for easing rise, the U.S. dollar and bond yields weaken, and gold is likely to receive support. Conversely, more hawkish (tightening-leaning) statements extend high interest-rate expectations and suppress the gold market.
Economic data directly drives market expectations. Weak employment data and cooling economic momentum are favorable for gold. If inflation data rebounds and the economy shows strong resilience, the market’s tightening expectations rise, putting pressure on gold prices.
Geopolitical developments mainly trigger short-term impulse moves and do not produce long-term trends. Escalating regional conflicts can boost risk-off sentiment and push gold higher in the short term, but the move’s durability is extremely poor. Once the situation eases and safe-haven capital retreats, the price action typically drops quickly—avoid blindly chasing rallies or selling in panic.
For medium- to long-term trends, focus on capital and reserve logic. Central banks in multiple countries continue to accumulate gold, which helps solidify the support at the base of gold prices. Meanwhile, continued outflows from gold ETFs can create a mid-term pressure pattern.
In practice, there are two major core risk-avoidance rules. First, when long and short views in the news are essentially hedged against each other, the market often turns into a narrow-range consolidation and washout; the best choice is to stand by and wait for direction to become clear. Second, when the market prices in expectations early, and after the data is released the “good news/good news” or “bad news/bad news” is quickly realized, prices often retrace—do not follow the crowd with momentum trades.
The entire trading core process can be summarized as follows: use the rhymes to define whether the news outlook is bullish or bearish, then verify the true strength with correlated instruments, and finally use technical indicators to filter the timing for entry. Always adhere to the principles of resonance trading, avoiding extremes, strictly controlling position sizing, and not forcing trades—these are key to consistently capturing the rhythm of the gold market.
Gold market volatility is influenced by multiple factors, including policy signals, economic data, geopolitical sentiment, and capital flows. To interpret the market accurately, rely on a set of quick-read trading rhymes combined with a resonance logic framework to judge price trends and avoid most common trading mistakes. It’s important to note that these rhymes are only a summary of patterns; they cannot be used alone. You must combine them with the U.S. dollar trend, U.S. Treasury yields, and technical indicator resonance analysis.
Policy and public opinion are the core factors affecting gold prices. When policymakers release a dovish (easing) signal, market expectations for easing rise, the U.S. dollar and bond yields weaken, and gold is likely to receive support. Conversely, more hawkish (tightening-leaning) statements extend high interest-rate expectations and suppress the gold market.
Economic data directly drives market expectations. Weak employment data and cooling economic momentum are favorable for gold. If inflation data rebounds and the economy shows strong resilience, the market’s tightening expectations rise, putting pressure on gold prices.
Geopolitical developments mainly trigger short-term impulse moves and do not produce long-term trends. Escalating regional conflicts can boost risk-off sentiment and push gold higher in the short term, but the move’s durability is extremely poor. Once the situation eases and safe-haven capital retreats, the price action typically drops quickly—avoid blindly chasing rallies or selling in panic.
For medium- to long-term trends, focus on capital and reserve logic. Central banks in multiple countries continue to accumulate gold, which helps solidify the support at the base of gold prices. Meanwhile, continued outflows from gold ETFs can create a mid-term pressure pattern.
In practice, there are two major core risk-avoidance rules. First, when long and short views in the news are essentially hedged against each other, the market often turns into a narrow-range consolidation and washout; the best choice is to stand by and wait for direction to become clear. Second, when the market prices in expectations early, and after the data is released the “good news/good news” or “bad news/bad news” is quickly realized, prices often retrace—do not follow the crowd with momentum trades.
The entire trading core process can be summarized as follows: use the rhymes to define whether the news outlook is bullish or bearish, then verify the true strength with correlated instruments, and finally use technical indicators to filter the timing for entry. Always adhere to the principles of resonance trading, avoiding extremes, strictly controlling position sizing, and not forcing trades—these are key to consistently capturing the rhythm of the gold market.
317
·
--
Bullish
I’ve been consistently presenting a low-risk long idea lately, always saying that any pullback is a chance to get on the long side. The big cake and small cake arrived as scheduled, and the script was fulfilled—reaching the target position!
I’ve been consistently presenting a low-risk long idea lately, always saying that any pullback is a chance to get on the long side. The big cake and small cake arrived as scheduled, and the script was fulfilled—reaching the target position!
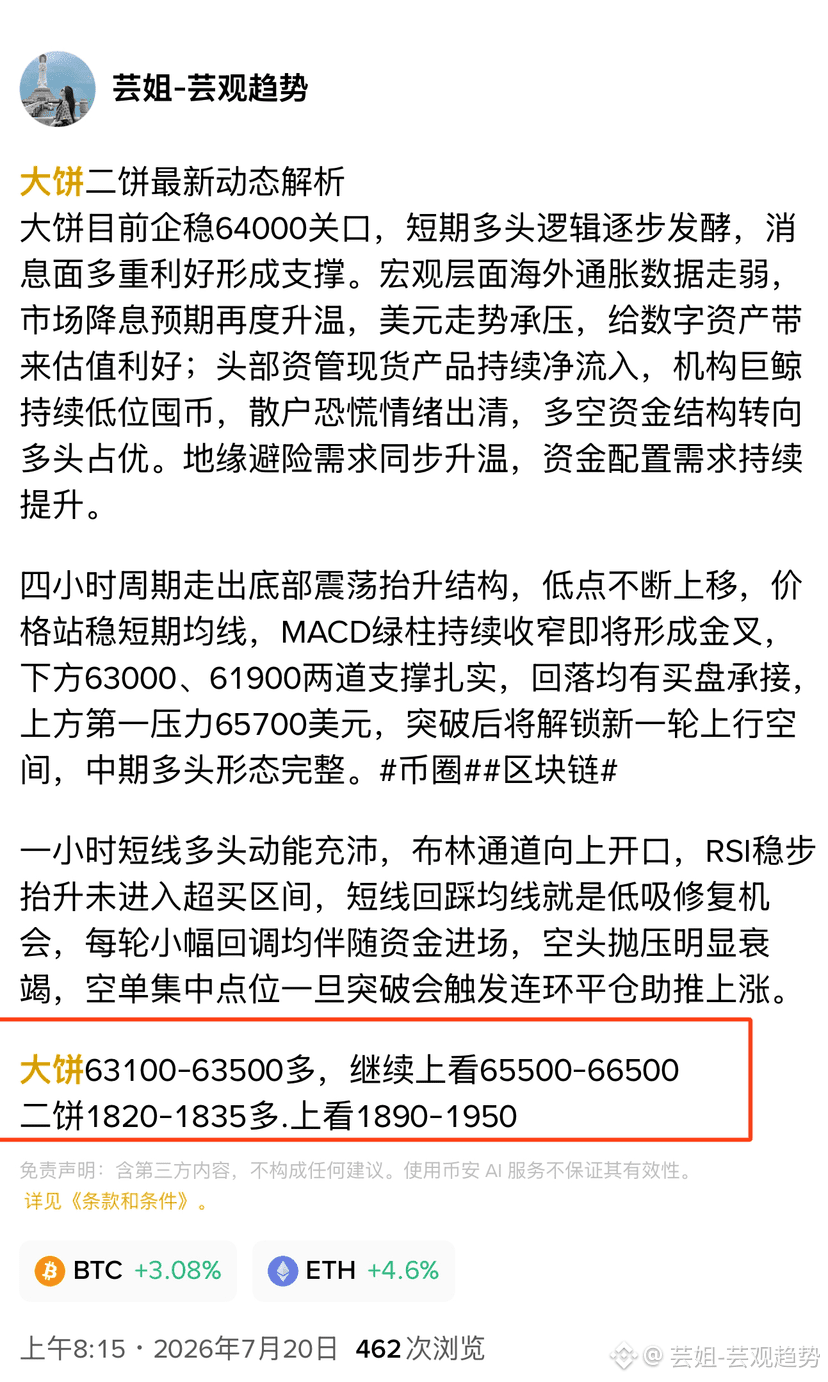
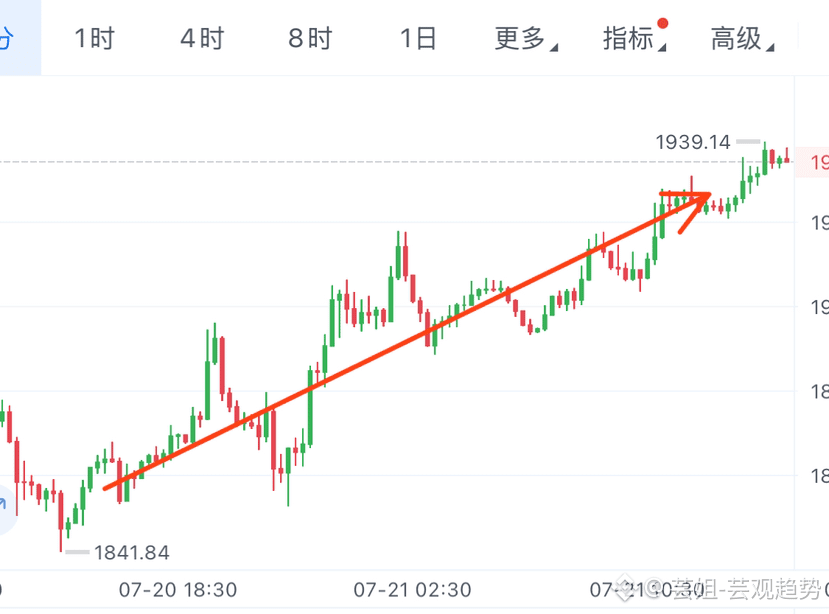
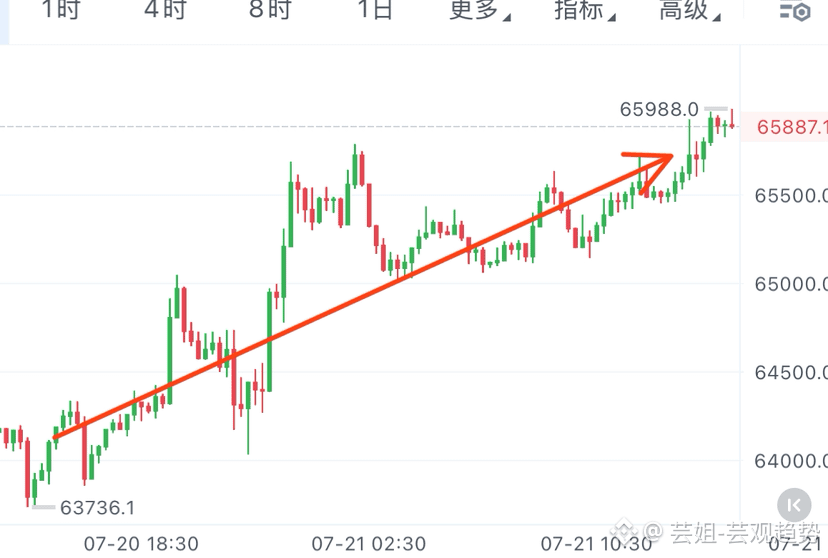
凌姐-观金市
·
--
Latest Developments Analysis for Big Pie and Second Pie
Big Pie is currently stabilizing around the 64,000 level. In the short term, the bullish logic is gradually gaining traction, and multiple favorable news items have created support. On the macro front, overseas inflation data is weakening, market rate-cut expectations are heating up again, the USD is under pressure, and this provides valuation tailwinds for digital assets. Top-tier asset-management spot products continue to see net inflows, large “whale” investors keep accumulating coins at low levels, retail panic is being cleared out, and the positioning of long vs. short capital is shifting in favor of longs. At the same time, geopolitical hedging demand is rising, and allocation/placement demand for capital continues to increase.
On the four-hour chart, a bottoming consolidation has evolved into an ascending structure: the lows keep moving higher, price has held above short-term moving averages, and the MACD green histogram continues to narrow, about to form a golden cross. The two supports below—63,000 and 61,900—are solid. On pullbacks, buy orders provide support. The first resistance above is at $65,700; once it breaks, it will open up a new round of upside room. The medium-term bullish pattern is intact. #CryptoCircle##Blockchain#
On the one-hour timeframe, short-term bullish momentum is strong. The Bollinger Bands are opening upward, and the RSI is steadily rising without entering the overbought zone. Short-term pullbacks to the moving averages are opportunities to buy the dip for recovery. Each modest pullback is accompanied by capital flowing in, and sell-side pressure from shorts is clearly weakening. If a concentrated short position level is breached, it will trigger a chain liquidation effect that further boosts the rally.
Big Pie: go long at 63,100–63,500; continue targeting 65,500–66,500.
Second Pie: go long at 1,820–1,835; target 1,890–1,950.
Big Pie is currently stabilizing around the 64,000 level. In the short term, the bullish logic is gradually gaining traction, and multiple favorable news items have created support. On the macro front, overseas inflation data is weakening, market rate-cut expectations are heating up again, the USD is under pressure, and this provides valuation tailwinds for digital assets. Top-tier asset-management spot products continue to see net inflows, large “whale” investors keep accumulating coins at low levels, retail panic is being cleared out, and the positioning of long vs. short capital is shifting in favor of longs. At the same time, geopolitical hedging demand is rising, and allocation/placement demand for capital continues to increase.
On the four-hour chart, a bottoming consolidation has evolved into an ascending structure: the lows keep moving higher, price has held above short-term moving averages, and the MACD green histogram continues to narrow, about to form a golden cross. The two supports below—63,000 and 61,900—are solid. On pullbacks, buy orders provide support. The first resistance above is at $65,700; once it breaks, it will open up a new round of upside room. The medium-term bullish pattern is intact. #CryptoCircle##Blockchain#
On the one-hour timeframe, short-term bullish momentum is strong. The Bollinger Bands are opening upward, and the RSI is steadily rising without entering the overbought zone. Short-term pullbacks to the moving averages are opportunities to buy the dip for recovery. Each modest pullback is accompanied by capital flowing in, and sell-side pressure from shorts is clearly weakening. If a concentrated short position level is breached, it will trigger a chain liquidation effect that further boosts the rally.
Big Pie: go long at 63,100–63,500; continue targeting 65,500–66,500.
Second Pie: go long at 1,820–1,835; target 1,890–1,950.
1
259
Log in to explore more content
Join global crypto users on Binance Square
⚡️ Get latest and useful information about crypto.
💬 Trusted by the world’s largest crypto exchange.
👍 Discover real insights from verified creators.
Email / Phone number
Trending Topics
USAugustPPIRisesLessThanExpected
50,510 views
813 Discussing
🚨 US AUG PPI: Rises LESS Than Expected! Bullish for Crypto? 🚀
PPI +0.4% MoM as expected, but CORE PPI only +0.2% vs +0.3% expected - cooling!
What it means:
• Wholesale inflation softer than feared
• Fed rate hike chance now 62% - but dovish signals coming
• Core PCE revisions expected downward - bullish
• BTC usually pumps on softer PPI
Fed meeting Sep 15-16 - Market now expects pause, not hike?
Is this the green light for Q4 rally?
#Bitcoin #PPI #Fed #CryptoNews #BTC#usaugustppiriseslessthanexpected
True News
·1 Likes
·1.4k views
SECApprovesNasdaqTexasCommodityTrustRule
27,718 views
593 Discussing
ECBRaisesRatesSecondTimeTo2.5%
25,370 views
427 Discussing