

Meshi bhatti
64 Posts

Meshi bhatti
Report
Block User
0 Following
31 Followers
36 Liked
Posts
·
--
$TUT is the Tutorial token on BNB Chain, originally created around blockchain education and later becoming a meme-oriented crypto project.
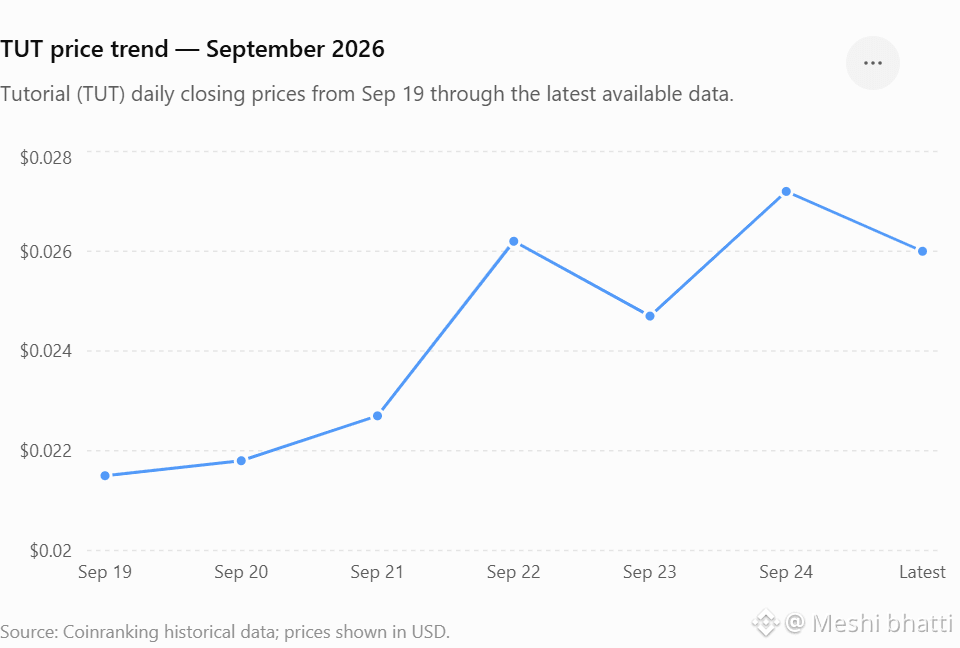
Current price: around $0.026–$0.027 Market cap: about $22M 24h volume: about $29M 7-day performance: roughly +31% 7-day range: about $0.020–$0.030 Recent data shows strong volatility, with $TUT moving from roughly $0.0215 on Sep 19 to $0.026 today.
Technical view: $TUT has shown short-term bullish momentum, but it is a small-cap, highly volatile token. The $0.030 area is an important recent resistance zone, while $0.020–$0.021 is a notable recent support area based on the September price history.
#CFTCUpdatesGuidanceOnTokenizedAssets
#BinanceWillListHyperliquid(HYPE)
{spot}(TUTUSDT)
$TUT is the Tutorial token on BNB Chain, originally created around blockchain education and later becoming a meme-oriented crypto project.
Current price: around $0.026–$0.027 Market cap: about $22M 24h volume: about $29M 7-day performance: roughly +31% 7-day range: about $0.020–$0.030 Recent data shows strong volatility, with $TUT moving from roughly $0.0215 on Sep 19 to $0.026 today.
Technical view: $TUT has shown short-term bullish momentum, but it is a small-cap, highly volatile token. The $0.030 area is an important recent resistance zone, while $0.020–$0.021 is a notable recent support area based on the September price history.
#CFTCUpdatesGuidanceOnTokenizedAssets
#BinanceWillListHyperliquid(HYPE)
Current price: around $0.026–$0.027 Market cap: about $22M 24h volume: about $29M 7-day performance: roughly +31% 7-day range: about $0.020–$0.030 Recent data shows strong volatility, with $TUT moving from roughly $0.0215 on Sep 19 to $0.026 today.
Technical view: $TUT has shown short-term bullish momentum, but it is a small-cap, highly volatile token. The $0.030 area is an important recent resistance zone, while $0.020–$0.021 is a notable recent support area based on the September price history.
#CFTCUpdatesGuidanceOnTokenizedAssets
#BinanceWillListHyperliquid(HYPE)
1
456
·
--
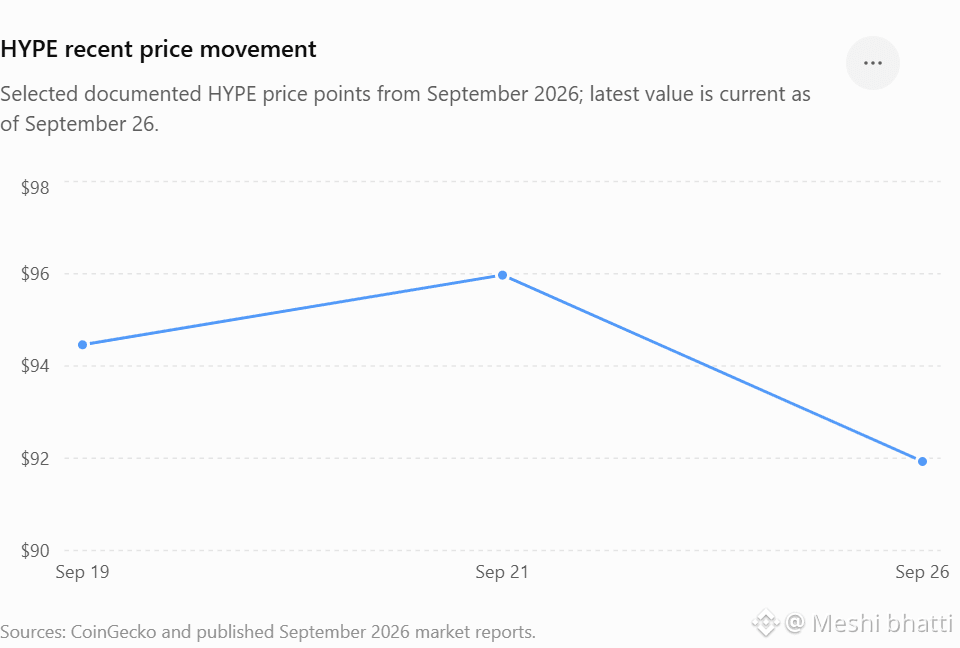
$HYPE is the native token of Hyperliquid, a Layer-1 blockchain focused on on-chain trading and derivatives. As of September 26, 2026, HYPE is around $91.93, with a market cap of about $20.45B and 24-hour volume around $1.28B.
Current price: ~$91.93 7-day performance: +5.6% 7-day range: ~$87.44–$97.96 All-time high: ~$97.96 Market cap: ~$20.45B Recent momentum has been strong, with $HYPE reaching several new highs during September. A key risk is future supply dilution: CoinGecko reports about 222M circulating HYPE versus a maximum supply of 1B.
Technical view: $HYPE is trading close to its recent high, so the $97–$98 area is an important resistance zone. The $87–$90 area is a nearby support zone based on the recent 7-day range. A move above the recent high would need confirmation from volume and sustained price action.
#CFTCUpdatesGuidanceOnTokenizedAssets
#BitgetBreachForgedRequestsNotStolenKeys
#CFTCUpdatesGuidanceOnTokenizedAssets
{spot}(HYPEUSDT)
$HYPE is the native token of Hyperliquid, a Layer-1 blockchain focused on on-chain trading and derivatives. As of September 26, 2026, HYPE is around $91.93, with a market cap of about $20.45B and 24-hour volume around $1.28B.
Current price: ~$91.93 7-day performance: +5.6% 7-day range: ~$87.44–$97.96 All-time high: ~$97.96 Market cap: ~$20.45B Recent momentum has been strong, with $HYPE reaching several new highs during September. A key risk is future supply dilution: CoinGecko reports about 222M circulating HYPE versus a maximum supply of 1B.
Technical view: $HYPE is trading close to its recent high, so the $97–$98 area is an important resistance zone. The $87–$90 area is a nearby support zone based on the recent 7-day range. A move above the recent high would need confirmation from volume and sustained price action.
#CFTCUpdatesGuidanceOnTokenizedAssets
#BitgetBreachForgedRequestsNotStolenKeys
#CFTCUpdatesGuidanceOnTokenizedAssets
Current price: ~$91.93 7-day performance: +5.6% 7-day range: ~$87.44–$97.96 All-time high: ~$97.96 Market cap: ~$20.45B Recent momentum has been strong, with $HYPE reaching several new highs during September. A key risk is future supply dilution: CoinGecko reports about 222M circulating HYPE versus a maximum supply of 1B.
Technical view: $HYPE is trading close to its recent high, so the $97–$98 area is an important resistance zone. The $87–$90 area is a nearby support zone based on the recent 7-day range. A move above the recent high would need confirmation from volume and sustained price action.
#CFTCUpdatesGuidanceOnTokenizedAssets
#BitgetBreachForgedRequestsNotStolenKeys
#CFTCUpdatesGuidanceOnTokenizedAssets
97
·
--
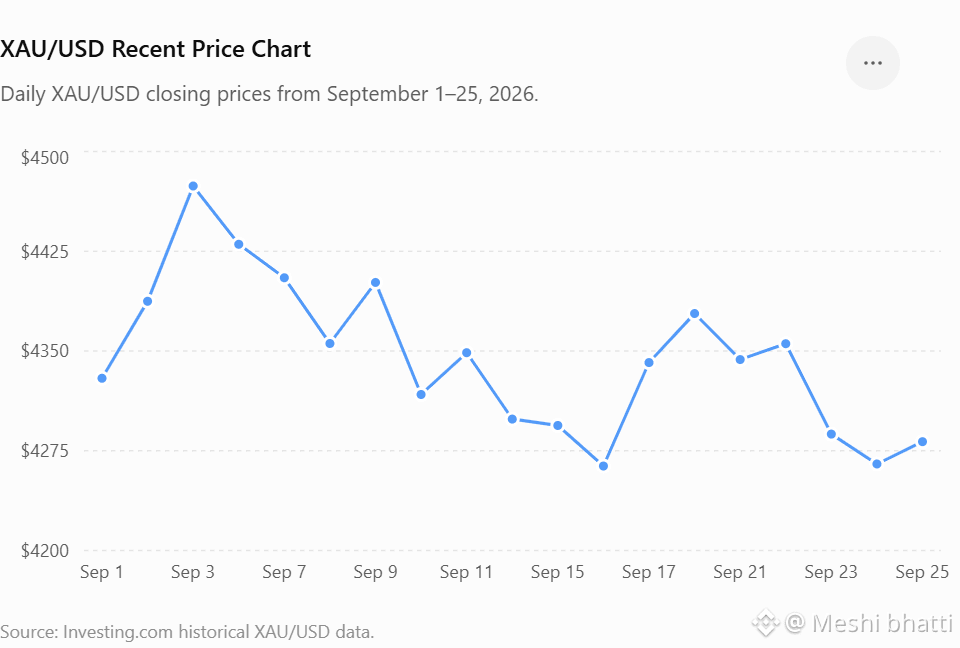
$XAU not the separate XAUT token. Current $XAU is around $4,280–$4,290 per troy ounce.
📊 $XAU Short Analysis
Current area: ~$4,280–$4,290 Recent trend: Price has pulled back from the ~$4,470 area seen in early September. Support: ~$4,235–$4,265 Resistance: ~$4,300–$4,380 Momentum: Short-term price action is volatile and has recently been under pressure from higher U.S. rates/yields. Key point: A sustained move above the $4,380 area could indicate renewed upside momentum, while a break below ~$4,235 would weaken the near-term structure.
#BinanceWillListHyperliquid(HYPE)
#QNTRises39%
{future}(XAUUSDT)
$XAU not the separate XAUT token. Current $XAU is around $4,280–$4,290 per troy ounce.
📊 $XAU Short Analysis
Current area: ~$4,280–$4,290 Recent trend: Price has pulled back from the ~$4,470 area seen in early September. Support: ~$4,235–$4,265 Resistance: ~$4,300–$4,380 Momentum: Short-term price action is volatile and has recently been under pressure from higher U.S. rates/yields. Key point: A sustained move above the $4,380 area could indicate renewed upside momentum, while a break below ~$4,235 would weaken the near-term structure.
#BinanceWillListHyperliquid(HYPE)
#QNTRises39%
📊 $XAU Short Analysis
Current area: ~$4,280–$4,290 Recent trend: Price has pulled back from the ~$4,470 area seen in early September. Support: ~$4,235–$4,265 Resistance: ~$4,300–$4,380 Momentum: Short-term price action is volatile and has recently been under pressure from higher U.S. rates/yields. Key point: A sustained move above the $4,380 area could indicate renewed upside momentum, while a break below ~$4,235 would weaken the near-term structure.
#BinanceWillListHyperliquid(HYPE)
#QNTRises39%
108
·
--
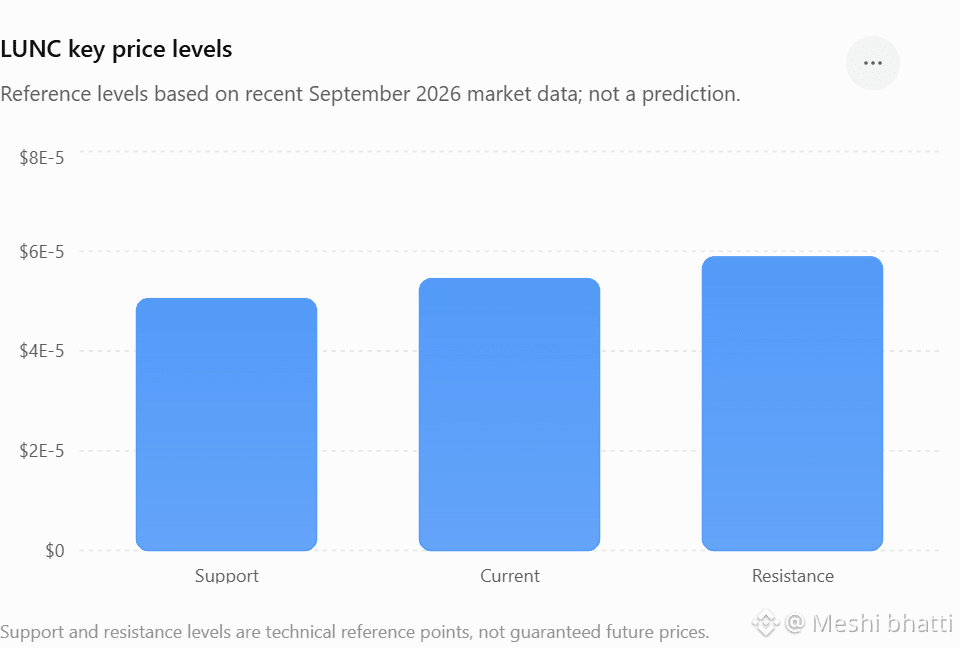
$LUNC is trading around $0.0000545 based on the latest available market data, with recent 7-day performance around +10.7%.
Support: ~$0.0000505 Current area: ~$0.0000545 Resistance: ~$0.0000589 Momentum: Recent price activity has improved, but volatility remains high. Supply: $LUNC has about 6.45T total supply and burns are continuing; however, recent burn data shows supply reduction is gradual rather than rapid. A sustained move above the ~$0.0000589 area would be a notable technical development; losing ~$0.0000505 would weaken the short-term setup.
#CFTCUpdatesGuidanceOnTokenizedAssets
#QNTRises39%
#LUNC
{spot}(LUNCUSDT)
$LUNC is trading around $0.0000545 based on the latest available market data, with recent 7-day performance around +10.7%.
Support: ~$0.0000505 Current area: ~$0.0000545 Resistance: ~$0.0000589 Momentum: Recent price activity has improved, but volatility remains high. Supply: $LUNC has about 6.45T total supply and burns are continuing; however, recent burn data shows supply reduction is gradual rather than rapid. A sustained move above the ~$0.0000589 area would be a notable technical development; losing ~$0.0000505 would weaken the short-term setup.
#CFTCUpdatesGuidanceOnTokenizedAssets
#QNTRises39%
#LUNC
Support: ~$0.0000505 Current area: ~$0.0000545 Resistance: ~$0.0000589 Momentum: Recent price activity has improved, but volatility remains high. Supply: $LUNC has about 6.45T total supply and burns are continuing; however, recent burn data shows supply reduction is gradual rather than rapid. A sustained move above the ~$0.0000589 area would be a notable technical development; losing ~$0.0000505 would weaken the short-term setup.
#CFTCUpdatesGuidanceOnTokenizedAssets
#QNTRises39%
#LUNC
1
274
·
--
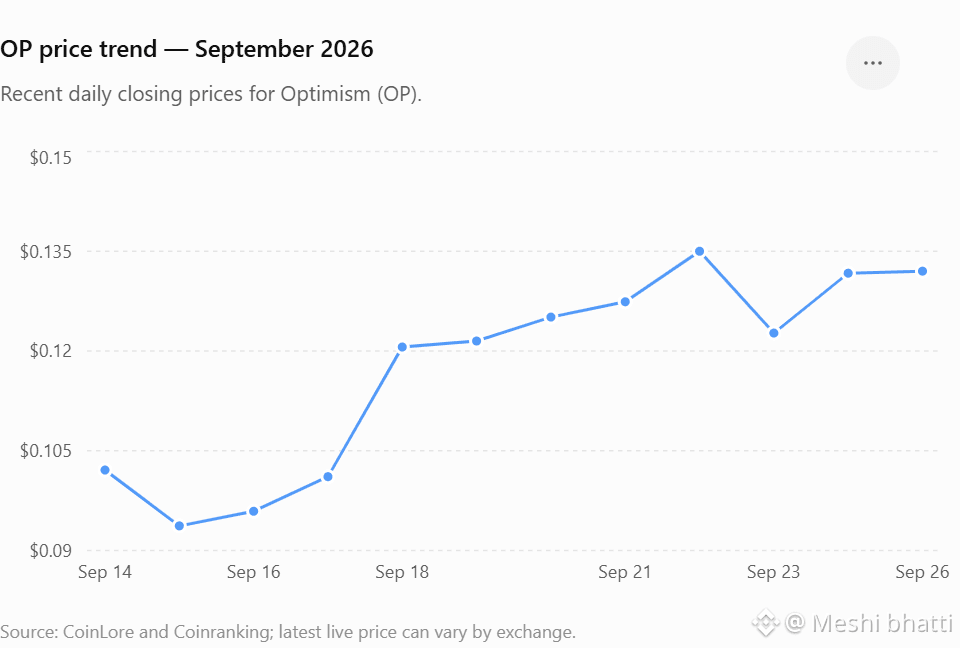
$OP is trading around $0.13 currently. Recent momentum has improved: OP moved from about $0.094 on Sep 15 to around $0.132–$0.133, showing a strong short-term recovery.
Short-term trend: Bullish recovery Current area: ~$0.13 Support: ~$0.12 Resistance: ~$0.14 Break above $0.14: could indicate further upside momentum Drop below $0.12: could weaken the recent recovery
$OP remains highly volatile, so these levels are reference points rather than guaranteed targets.
#BinanceWillListHyperliquid(HYPE)
#CFTCUpdatesGuidanceOnTokenizedAssets
{spot}(OPUSDT)
$OP is trading around $0.13 currently. Recent momentum has improved: OP moved from about $0.094 on Sep 15 to around $0.132–$0.133, showing a strong short-term recovery.
Short-term trend: Bullish recovery Current area: ~$0.13 Support: ~$0.12 Resistance: ~$0.14 Break above $0.14: could indicate further upside momentum Drop below $0.12: could weaken the recent recovery
$OP remains highly volatile, so these levels are reference points rather than guaranteed targets.
#BinanceWillListHyperliquid(HYPE)
#CFTCUpdatesGuidanceOnTokenizedAssets
Short-term trend: Bullish recovery Current area: ~$0.13 Support: ~$0.12 Resistance: ~$0.14 Break above $0.14: could indicate further upside momentum Drop below $0.12: could weaken the recent recovery
$OP remains highly volatile, so these levels are reference points rather than guaranteed targets.
#BinanceWillListHyperliquid(HYPE)
#CFTCUpdatesGuidanceOnTokenizedAssets
382
·
--
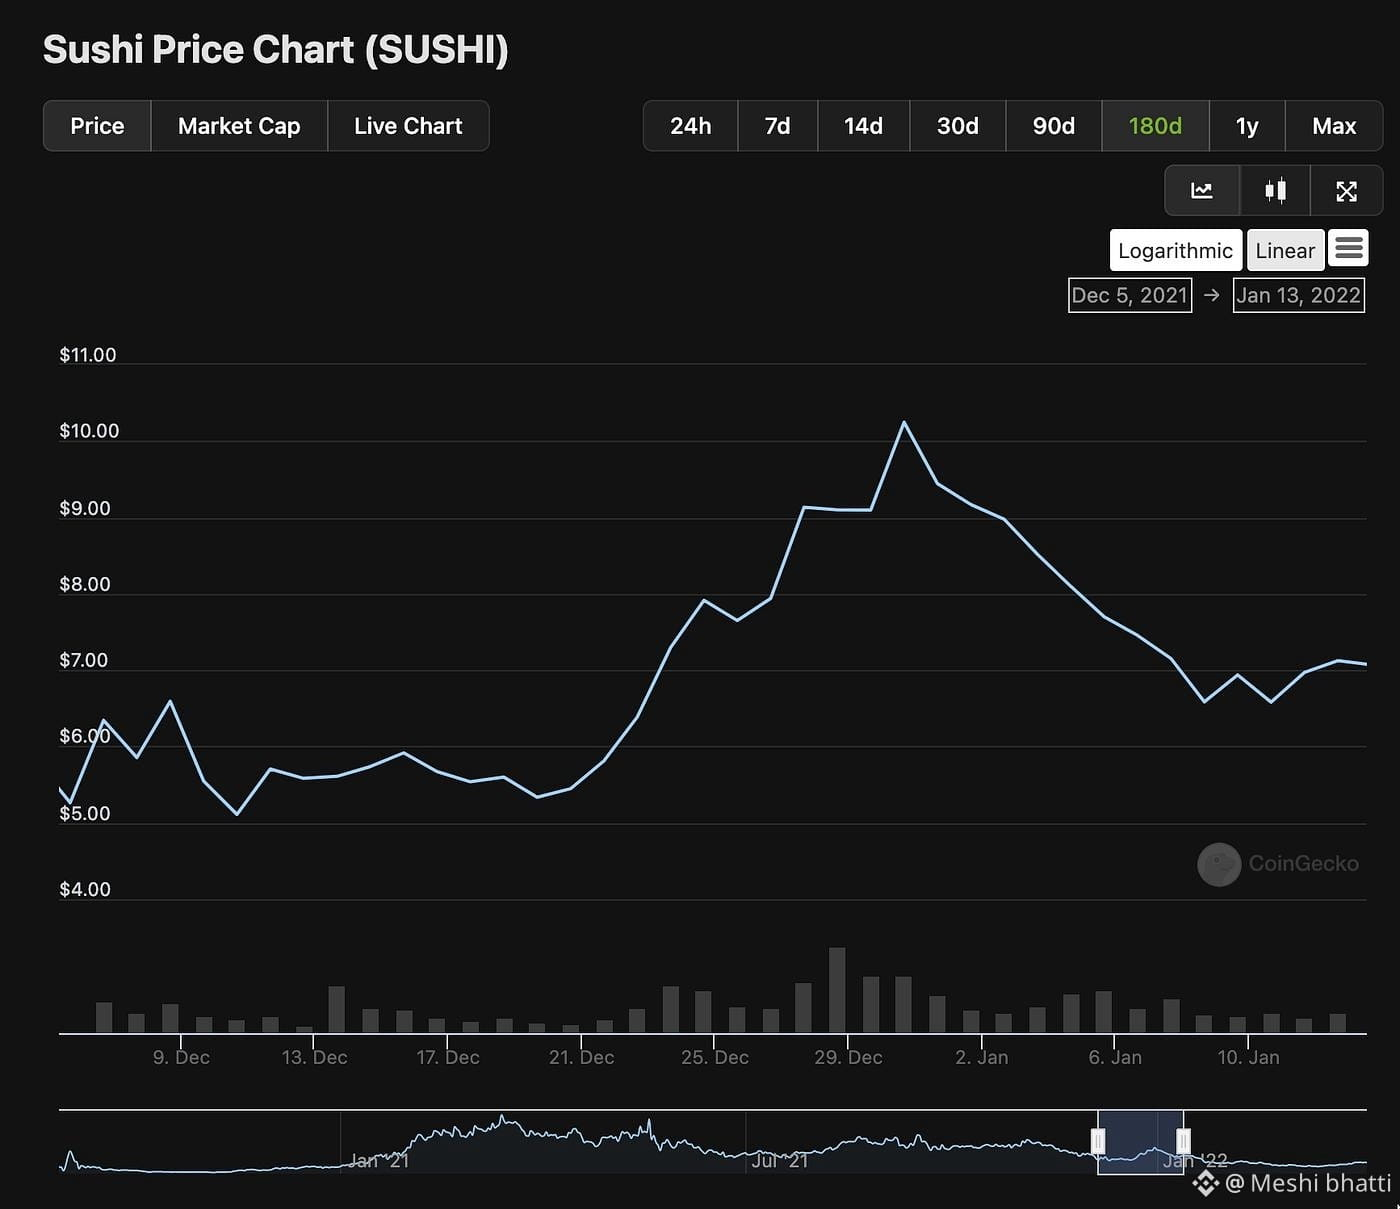
$SUSHI is the governance token of Sushi, a multi-chain decentralized exchange (DEX). As of September 25–26, 2026, SUSHI is trading around $0.25–$0.26, with a market cap around $73M.
Recent trend: $SUSHI moved from about $0.19 on Sep 5 to about $0.257 on Sep 25, showing a notable recovery over the month. Key support area: roughly $0.24–$0.25 based on the recent trading range. Resistance area: roughly $0.27–$0.28, where recent highs have appeared. Momentum: Recent data shows positive short-term momentum, but SUSHI remains highly volatile and is still about 99% below its $23.38 all-time high. Catalyst: $SUSHI has recently been conducting SUSHI buybacks, which may be relevant to market sentiment.
Technical view: A sustained move above $0.28 would be an important price-level development to watch, while a break below $0.24 could indicate renewed weakness. These are observation levels, not guaranteed targets.
#BinanceWillListHyperliquid(HYPE)
#CFTCUpdatesGuidanceOnTokenizedAssets
{spot}(SUSHIUSDT)
$SUSHI is the governance token of Sushi, a multi-chain decentralized exchange (DEX). As of September 25–26, 2026, SUSHI is trading around $0.25–$0.26, with a market cap around $73M.
Recent trend: $SUSHI moved from about $0.19 on Sep 5 to about $0.257 on Sep 25, showing a notable recovery over the month. Key support area: roughly $0.24–$0.25 based on the recent trading range. Resistance area: roughly $0.27–$0.28, where recent highs have appeared. Momentum: Recent data shows positive short-term momentum, but SUSHI remains highly volatile and is still about 99% below its $23.38 all-time high. Catalyst: $SUSHI has recently been conducting SUSHI buybacks, which may be relevant to market sentiment.
Technical view: A sustained move above $0.28 would be an important price-level development to watch, while a break below $0.24 could indicate renewed weakness. These are observation levels, not guaranteed targets.
#BinanceWillListHyperliquid(HYPE)
#CFTCUpdatesGuidanceOnTokenizedAssets
Recent trend: $SUSHI moved from about $0.19 on Sep 5 to about $0.257 on Sep 25, showing a notable recovery over the month. Key support area: roughly $0.24–$0.25 based on the recent trading range. Resistance area: roughly $0.27–$0.28, where recent highs have appeared. Momentum: Recent data shows positive short-term momentum, but SUSHI remains highly volatile and is still about 99% below its $23.38 all-time high. Catalyst: $SUSHI has recently been conducting SUSHI buybacks, which may be relevant to market sentiment.
Technical view: A sustained move above $0.28 would be an important price-level development to watch, while a break below $0.24 could indicate renewed weakness. These are observation levels, not guaranteed targets.
#BinanceWillListHyperliquid(HYPE)
#CFTCUpdatesGuidanceOnTokenizedAssets
165
·
--
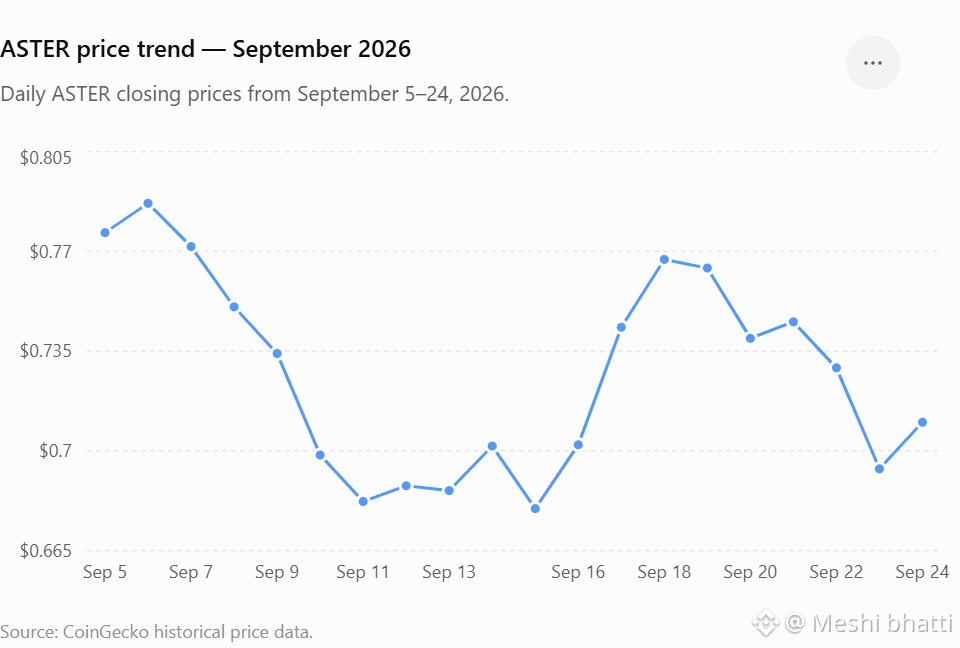
$ASTER is trading around $0.71, with a market cap near $1.9B and 24-hour volume around $100M+.
Recent trend: $ASTER pulled back from about $0.79 on Sept. 19 to around $0.70, before recovering toward $0.71. Support: around $0.68–$0.70 Resistance: around $0.75–$0.79 A move above $0.79 could put the previous higher levels back into focus, while losing $0.68 would indicate additional downside risk. Recent buyback/burn activity has been a notable tokenomics development, while recent weakness has also followed broader crypto-market conditions.
Technical view: $ASTER is currently in a volatile consolidation/recovery zone. Watch the $0.68 support and $0.75–$0.79 resistance area closely.
#US10YTreasuryYieldHits19YearHigh
#USWeighsPromotingDollarStablecoinsAbroad
#BinanceWillListHyperliquid(HYPE)
{spot}(ASTERUSDT)
$ASTER is trading around $0.71, with a market cap near $1.9B and 24-hour volume around $100M+.
Recent trend: $ASTER pulled back from about $0.79 on Sept. 19 to around $0.70, before recovering toward $0.71. Support: around $0.68–$0.70 Resistance: around $0.75–$0.79 A move above $0.79 could put the previous higher levels back into focus, while losing $0.68 would indicate additional downside risk. Recent buyback/burn activity has been a notable tokenomics development, while recent weakness has also followed broader crypto-market conditions.
Technical view: $ASTER is currently in a volatile consolidation/recovery zone. Watch the $0.68 support and $0.75–$0.79 resistance area closely.
#US10YTreasuryYieldHits19YearHigh
#USWeighsPromotingDollarStablecoinsAbroad
#BinanceWillListHyperliquid(HYPE)
Recent trend: $ASTER pulled back from about $0.79 on Sept. 19 to around $0.70, before recovering toward $0.71. Support: around $0.68–$0.70 Resistance: around $0.75–$0.79 A move above $0.79 could put the previous higher levels back into focus, while losing $0.68 would indicate additional downside risk. Recent buyback/burn activity has been a notable tokenomics development, while recent weakness has also followed broader crypto-market conditions.
Technical view: $ASTER is currently in a volatile consolidation/recovery zone. Watch the $0.68 support and $0.75–$0.79 resistance area closely.
#US10YTreasuryYieldHits19YearHigh
#USWeighsPromotingDollarStablecoinsAbroad
#BinanceWillListHyperliquid(HYPE)
1
350
·
--
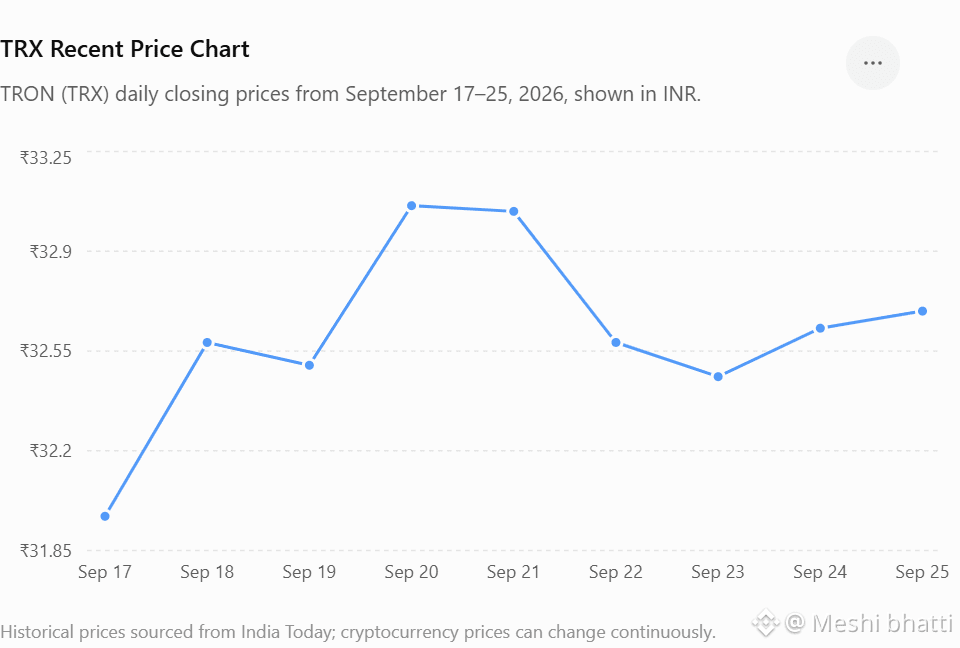
$TRX is currently trading around $0.341, with a market cap of about $32.4B and 24-hour volume around $523M.
Current price: ~$0.341 24h range: ~$0.339–$0.344 Recent support: ~$0.335–$0.338 Resistance: ~$0.350–$0.355 TRON recently crossed $30T in cumulative transaction volume, while network activity remains high. Technically, a sustained move above $0.350–$0.355 would be an important level to watch; a drop below the $0.335 area would weaken the recent structure.
#USWeighsPromotingDollarStablecoinsAbroad
#BinanceWillListHyperliquid(HYPE)
{spot}(TRXUSDT)
$TRX is currently trading around $0.341, with a market cap of about $32.4B and 24-hour volume around $523M.
Current price: ~$0.341 24h range: ~$0.339–$0.344 Recent support: ~$0.335–$0.338 Resistance: ~$0.350–$0.355 TRON recently crossed $30T in cumulative transaction volume, while network activity remains high. Technically, a sustained move above $0.350–$0.355 would be an important level to watch; a drop below the $0.335 area would weaken the recent structure.
#USWeighsPromotingDollarStablecoinsAbroad
#BinanceWillListHyperliquid(HYPE)
Current price: ~$0.341 24h range: ~$0.339–$0.344 Recent support: ~$0.335–$0.338 Resistance: ~$0.350–$0.355 TRON recently crossed $30T in cumulative transaction volume, while network activity remains high. Technically, a sustained move above $0.350–$0.355 would be an important level to watch; a drop below the $0.335 area would weaken the recent structure.
#USWeighsPromotingDollarStablecoinsAbroad
#BinanceWillListHyperliquid(HYPE)
13
·
--
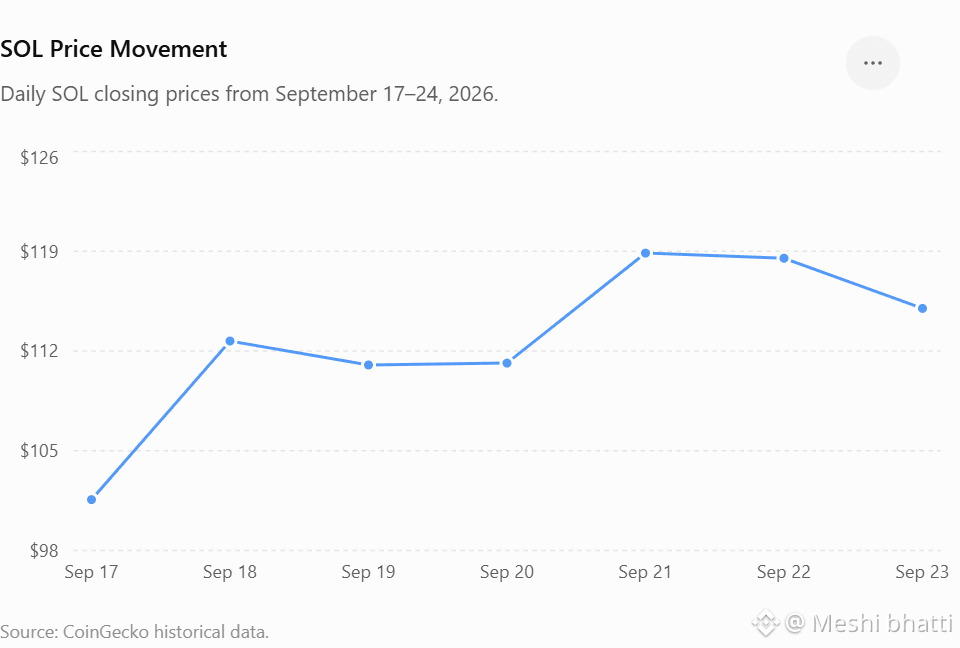
$SOL is trading around $114–$115. Recent price action shows a strong rebound from the $96–$102 area, with $SOL reaching around $119 before pulling back.
Support: $110, then $100–102 Resistance: $119–120, then $125 Trend: Short-term recovery/bullish momentum, but volatility remains high. A break above $120 could strengthen bullish momentum, while losing $110 could bring renewed selling pressure. $SOL also has upcoming network-development activity, including the planned Alpenglow activation around September 28, which traders may watch.
#BinanceWillListHyperliquid(HYPE)
#USWeighsPromotingDollarStablecoinsAbroad
{spot}(USDCUSDT)
$SOL is trading around $114–$115. Recent price action shows a strong rebound from the $96–$102 area, with $SOL reaching around $119 before pulling back.
Support: $110, then $100–102 Resistance: $119–120, then $125 Trend: Short-term recovery/bullish momentum, but volatility remains high. A break above $120 could strengthen bullish momentum, while losing $110 could bring renewed selling pressure. $SOL also has upcoming network-development activity, including the planned Alpenglow activation around September 28, which traders may watch.
#BinanceWillListHyperliquid(HYPE)
#USWeighsPromotingDollarStablecoinsAbroad
Support: $110, then $100–102 Resistance: $119–120, then $125 Trend: Short-term recovery/bullish momentum, but volatility remains high. A break above $120 could strengthen bullish momentum, while losing $110 could bring renewed selling pressure. $SOL also has upcoming network-development activity, including the planned Alpenglow activation around September 28, which traders may watch.
#BinanceWillListHyperliquid(HYPE)
#USWeighsPromotingDollarStablecoinsAbroad
20
·
--
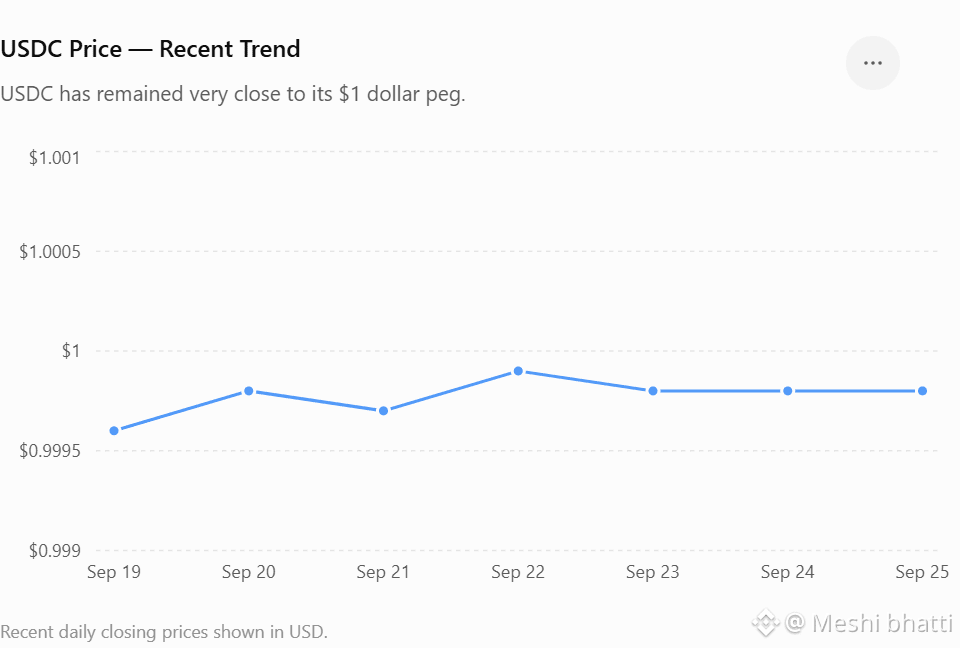
$USDC is a dollar-pegged stablecoin designed to stay close to $1.00. As of September 25, 2026, USDC is around $0.9998, with a market cap of about $75.2B and 24-hour volume near $17.7B.
Circle states that USDC is backed 1:1 by highly liquid cash and cash-equivalent assets and is redeemable 1:1 for USD.
Technical view: $USDC is not designed for major price appreciation like BTC or ETH. The key level is $1.00; sustained movement away from $1 would indicate a potential loss of its dollar peg.
#BinanceWillListHyperliquid(HYPE)
#US10YTreasuryYieldHits19YearHigh
{spot}(USDCUSDT)
$USDC is a dollar-pegged stablecoin designed to stay close to $1 .00. As of September 25, 2026, USDC is around $0.9998, with a market cap of about $75.2B and 24-hour volume near $17.7B.
Circle states that USDC is backed 1:1 by highly liquid cash and cash-equivalent assets and is redeemable 1:1 for USD.
Technical view: $USDC is not designed for major price appreciation like BTC or ETH. The key level is $1 .00; sustained movement away from $1 would indicate a potential loss of its dollar peg.
#BinanceWillListHyperliquid(HYPE)
#US10YTreasuryYieldHits19YearHigh
Circle states that USDC is backed 1:1 by highly liquid cash and cash-equivalent assets and is redeemable 1:1 for USD.
Technical view: $USDC is not designed for major price appreciation like BTC or ETH. The key level is $1 .00; sustained movement away from $1 would indicate a potential loss of its dollar peg.
#BinanceWillListHyperliquid(HYPE)
#US10YTreasuryYieldHits19YearHigh
28
·
--
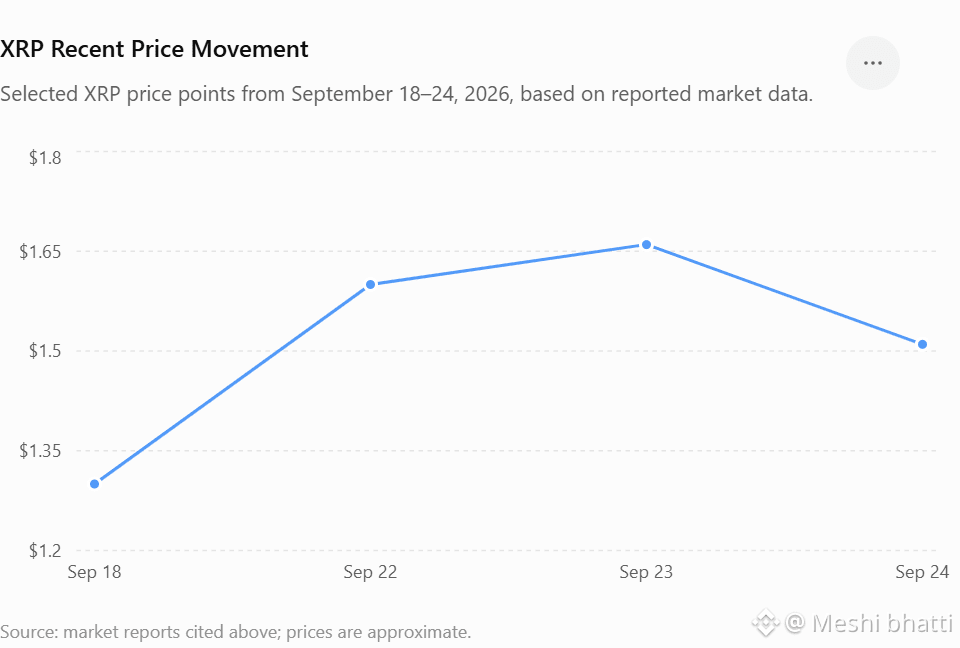
$XRP recently showed strong momentum, rising from around $1.30 to $1.66, but then faced heavy profit-taking and dropped back toward $1.50–$1.52.
Current area: ~$1.50–$1.52 Resistance: ~$1.60–$1.66 Support: ~$1.48, then ~$1.30 Trend: Short-term volatile; the weekly move remains positive, but sellers have appeared near $1.60–$1.66. Key point: A sustained move above $1.66 would be an important technical development; losing $1.48 would indicate additional short-term weakness.
#BinanceWillListHyperliquid(HYPE)
#FedOctoberRateHikeOddsRiseTo69.7%
{spot}(XRPUSDT)
$XRP recently showed strong momentum, rising from around $1.30 to $1.66, but then faced heavy profit-taking and dropped back toward $1.50–$1.52.
Current area: ~$1.50–$1.52 Resistance: ~$1.60–$1.66 Support: ~$1.48, then ~$1.30 Trend: Short-term volatile; the weekly move remains positive, but sellers have appeared near $1.60–$1.66. Key point: A sustained move above $1.66 would be an important technical development; losing $1.48 would indicate additional short-term weakness.
#BinanceWillListHyperliquid(HYPE)
#FedOctoberRateHikeOddsRiseTo69.7%
Current area: ~$1.50–$1.52 Resistance: ~$1.60–$1.66 Support: ~$1.48, then ~$1.30 Trend: Short-term volatile; the weekly move remains positive, but sellers have appeared near $1.60–$1.66. Key point: A sustained move above $1.66 would be an important technical development; losing $1.48 would indicate additional short-term weakness.
#BinanceWillListHyperliquid(HYPE)
#FedOctoberRateHikeOddsRiseTo69.7%
43
·
--
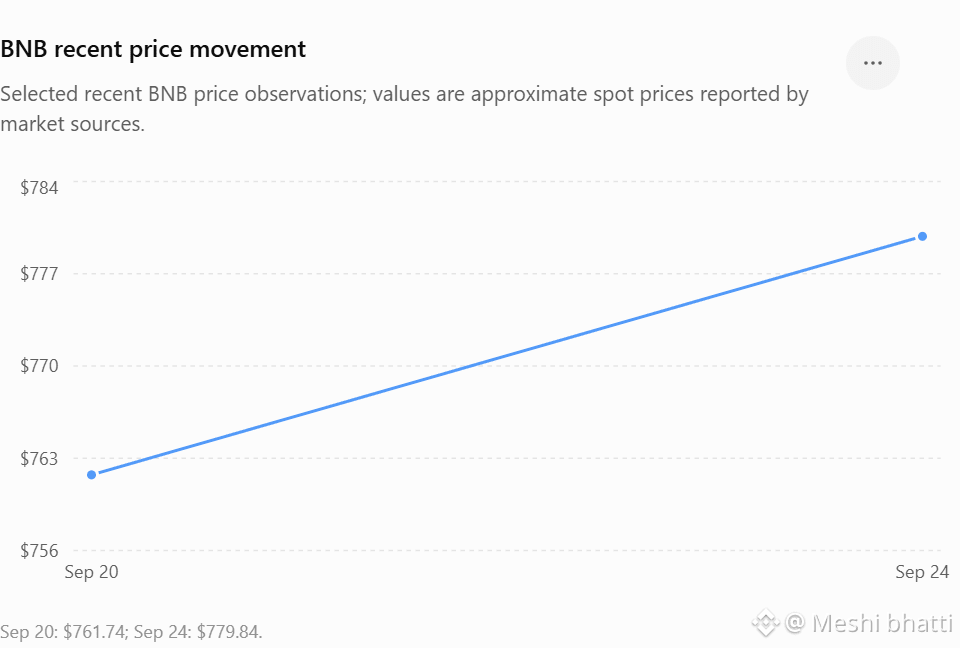
$BNB is trading around $777–$780 currently. Binance’s market page shows about $776.91, while Coinlib reports $779.84 on Sept. 24, 2026.
Short-term trend: Positive momentum, with Coinlib showing about +7.19% over 7 days and +11.40% over 30 days. Key area: The recent move above the $750 region is important for short-term price structure. A sustained move higher could keep bullish momentum active, while a drop back below recent support could increase selling pressure. Fundamentals: $BNB is used for BNB Chain transaction fees, staking, governance, and Binance-related utilities. Its supply is also reduced through the Auto-Burn mechanism. Risk: $BNB remains sensitive to overall crypto-market conditions and developments affecting the Binance ecosystem.
#BinanceWillListHyperliquid(HYPE)
#US10YTreasuryYieldHits19YearHigh
#bnb
{spot}(BNBUSDT)
$BNB is trading around $777–$780 currently. Binance’s market page shows about $776.91, while Coinlib reports $779.84 on Sept. 24, 2026.
Short-term trend: Positive momentum, with Coinlib showing about +7.19% over 7 days and +11.40% over 30 days. Key area: The recent move above the $750 region is important for short-term price structure. A sustained move higher could keep bullish momentum active, while a drop back below recent support could increase selling pressure. Fundamentals: $BNB is used for BNB Chain transaction fees, staking, governance, and Binance-related utilities. Its supply is also reduced through the Auto-Burn mechanism. Risk: $BNB remains sensitive to overall crypto-market conditions and developments affecting the Binance ecosystem.
#BinanceWillListHyperliquid(HYPE)
#US10YTreasuryYieldHits19YearHigh
#bnb
Short-term trend: Positive momentum, with Coinlib showing about +7.19% over 7 days and +11.40% over 30 days. Key area: The recent move above the $750 region is important for short-term price structure. A sustained move higher could keep bullish momentum active, while a drop back below recent support could increase selling pressure. Fundamentals: $BNB is used for BNB Chain transaction fees, staking, governance, and Binance-related utilities. Its supply is also reduced through the Auto-Burn mechanism. Risk: $BNB remains sensitive to overall crypto-market conditions and developments affecting the Binance ecosystem.
#BinanceWillListHyperliquid(HYPE)
#US10YTreasuryYieldHits19YearHigh
#bnb
102
·
--
Verified
$USDT is a USD-pegged stablecoin, designed to trade close to $1.00 rather than behave like a typical volatile cryptocurrency.
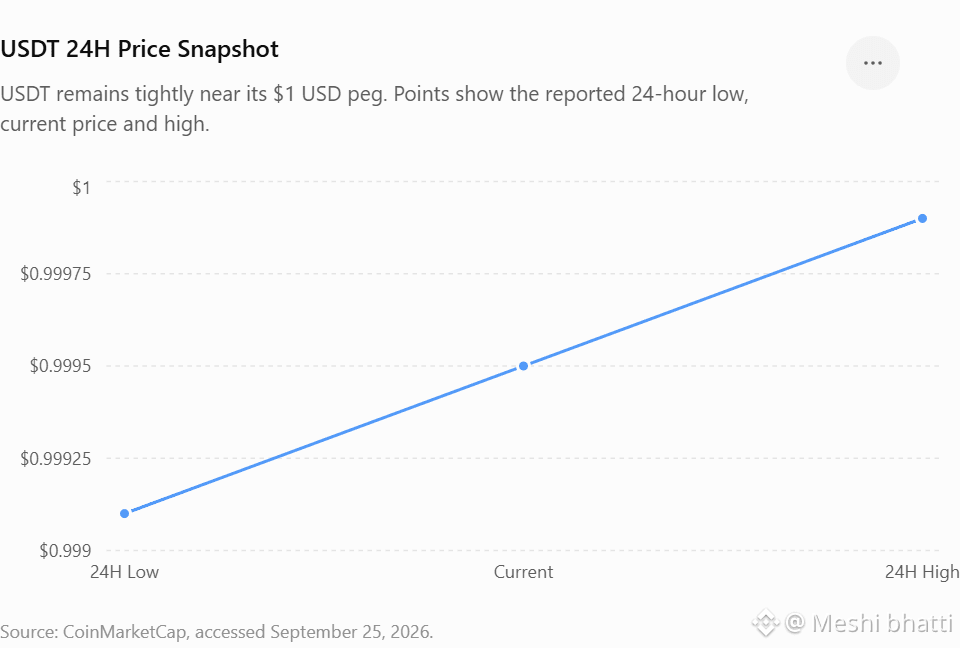
Current price: ~$0.9995 24h range: ~$0.9991–$0.9999 Market cap: ~$183.47B 24h volume: ~$81.95B Circulating supply: ~183.54B $USDT Tether reported that its Q2 2026 reserves remained focused on short-duration, liquid assets, with more than 146 tonnes of gold reported in its holdings.
Trading view: USDT normally has very limited price movement because its target is $1.00. The main thing to watch is whether it maintains its peg rather than looking for large bullish/bearish price moves. A sustained move materially below $1 could indicate temporary market or liquidity stress.
#BinanceWillListHyperliquid(HYPE)
#USWeighsPromotingDollarStablecoinsAbroad
$USDT is a USD-pegged stablecoin, designed to trade close to $1 .00 rather than behave like a typical volatile cryptocurrency.
Current price: ~$0.9995 24h range: ~$0.9991–$0.9999 Market cap: ~$183.47B 24h volume: ~$81.95B Circulating supply: ~183.54B $USDT Tether reported that its Q2 2026 reserves remained focused on short-duration, liquid assets, with more than 146 tonnes of gold reported in its holdings.
Trading view: USDT normally has very limited price movement because its target is $1 .00. The main thing to watch is whether it maintains its peg rather than looking for large bullish/bearish price moves. A sustained move materially below $1 could indicate temporary market or liquidity stress.
#BinanceWillListHyperliquid(HYPE)
#USWeighsPromotingDollarStablecoinsAbroad
Current price: ~$0.9995 24h range: ~$0.9991–$0.9999 Market cap: ~$183.47B 24h volume: ~$81.95B Circulating supply: ~183.54B $USDT Tether reported that its Q2 2026 reserves remained focused on short-duration, liquid assets, with more than 146 tonnes of gold reported in its holdings.
Trading view: USDT normally has very limited price movement because its target is $1 .00. The main thing to watch is whether it maintains its peg rather than looking for large bullish/bearish price moves. A sustained move materially below $1 could indicate temporary market or liquidity stress.
#BinanceWillListHyperliquid(HYPE)
#USWeighsPromotingDollarStablecoinsAbroad
2
589
·
--
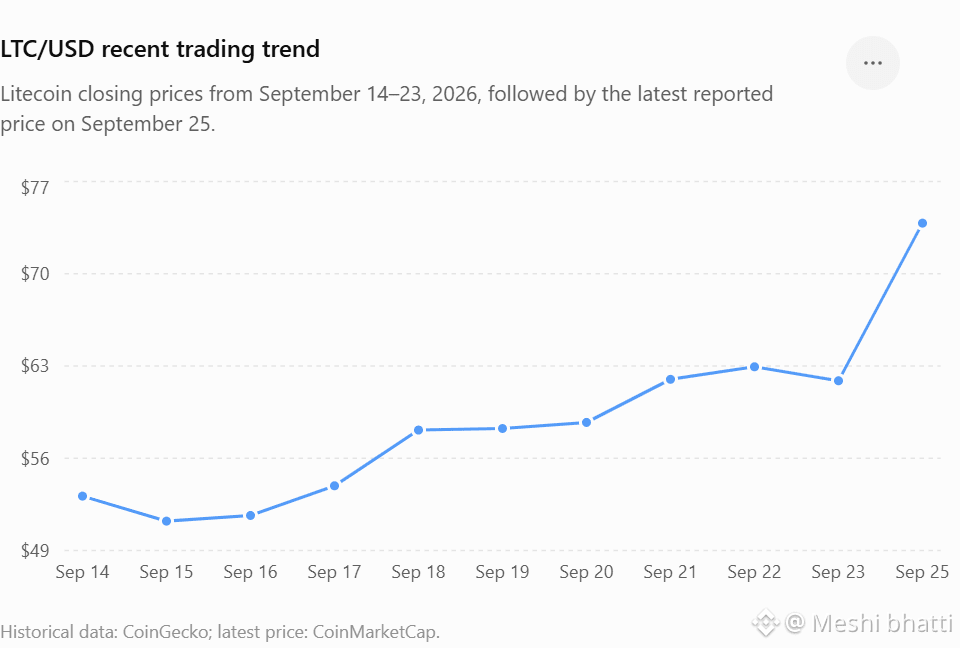
$LTC of 25 September 2026, $LTC is trading around $72–$74, after a strong recent move. CoinMarketCap reports about $73.84, up roughly 22.7% in 24 hours, while the recent 7-day data show a sharp rise from the high-$50s/low-$60s area.
Key levels:
🟢 Support: $62–$60 🟢 Stronger support: $58 🔴 Resistance: $74–$75 🔴 Next resistance: around $80 Trend: Short-term bullish, but the rapid rise means a pullback is possible.
A sustained move above $75 with strong volume would be worth watching for continuation; rejection around $74–$75 could bring $LTC back toward the $62–$60 support area. This is a market observation, not a guaranteed prediction. Recent reporting also noted LTC's sharp 24-hour jump without identifying a clear single catalyst.
#BinanceWillListHyperliquid(HYPE)
#US10YTreasuryYieldHits19YearHigh
{spot}(LTCUSDT)
$LTC of 25 September 2026, $LTC is trading around $72–$74, after a strong recent move. CoinMarketCap reports about $73.84, up roughly 22.7% in 24 hours, while the recent 7-day data show a sharp rise from the high-$50s/low-$60s area.
Key levels:
🟢 Support: $62–$60 🟢 Stronger support: $58 🔴 Resistance: $74–$75 🔴 Next resistance: around $80 Trend: Short-term bullish, but the rapid rise means a pullback is possible.
A sustained move above $75 with strong volume would be worth watching for continuation; rejection around $74–$75 could bring $LTC back toward the $62–$60 support area. This is a market observation, not a guaranteed prediction. Recent reporting also noted LTC's sharp 24-hour jump without identifying a clear single catalyst.
#BinanceWillListHyperliquid(HYPE)
#US10YTreasuryYieldHits19YearHigh
Key levels:
🟢 Support: $62–$60 🟢 Stronger support: $58 🔴 Resistance: $74–$75 🔴 Next resistance: around $80 Trend: Short-term bullish, but the rapid rise means a pullback is possible.
A sustained move above $75 with strong volume would be worth watching for continuation; rejection around $74–$75 could bring $LTC back toward the $62–$60 support area. This is a market observation, not a guaranteed prediction. Recent reporting also noted LTC's sharp 24-hour jump without identifying a clear single catalyst.
#BinanceWillListHyperliquid(HYPE)
#US10YTreasuryYieldHits19YearHigh
153
·
--
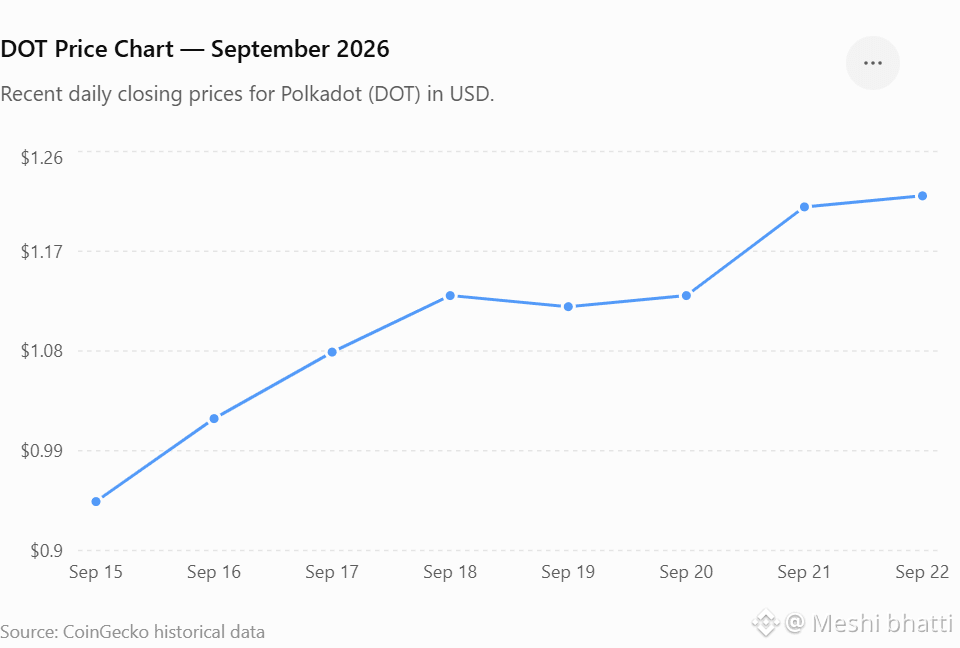
DOT has shown a strong recovery in September 2026, moving from around $0.90 on Sept. 4 to about $1.22 on Sept. 22. Recent data shows increasing trading activity and a recovery above the $1 level.
Current area: ~$1.20–$1.22 Resistance: ~$1.25 Support: ~$1.10, then ~$1.00 Trend: Short-term bullish/recovery, but volatility remains high. A sustained break above $1.25 could strengthen the upward momentum, while losing $1.10 could bring the price back toward $1.00.
#BitwiseNEARStakingETPAssetsTop$100M
#AIStocksWhatNext
#dot
{spot}(DOTUSDT)
DOT has shown a strong recovery in September 2026, moving from around $0.90 on Sept. 4 to about $1 .22 on Sept. 22. Recent data shows increasing trading activity and a recovery above the $1 level.
Current area: ~$1 .20–$1 .22 Resistance: ~$1 .25 Support: ~$1 .10, then ~$1 .00 Trend: Short-term bullish/recovery, but volatility remains high. A sustained break above $1 .25 could strengthen the upward momentum, while losing $1 .10 could bring the price back toward $1 .00.
#BitwiseNEARStakingETPAssetsTop$100M
#AIStocksWhatNext
#dot
Current area: ~$1 .20–$1 .22 Resistance: ~$1 .25 Support: ~$1 .10, then ~$1 .00 Trend: Short-term bullish/recovery, but volatility remains high. A sustained break above $1 .25 could strengthen the upward momentum, while losing $1 .10 could bring the price back toward $1 .00.
#BitwiseNEARStakingETPAssetsTop$100M
#AIStocksWhatNext
#dot
118
·
--
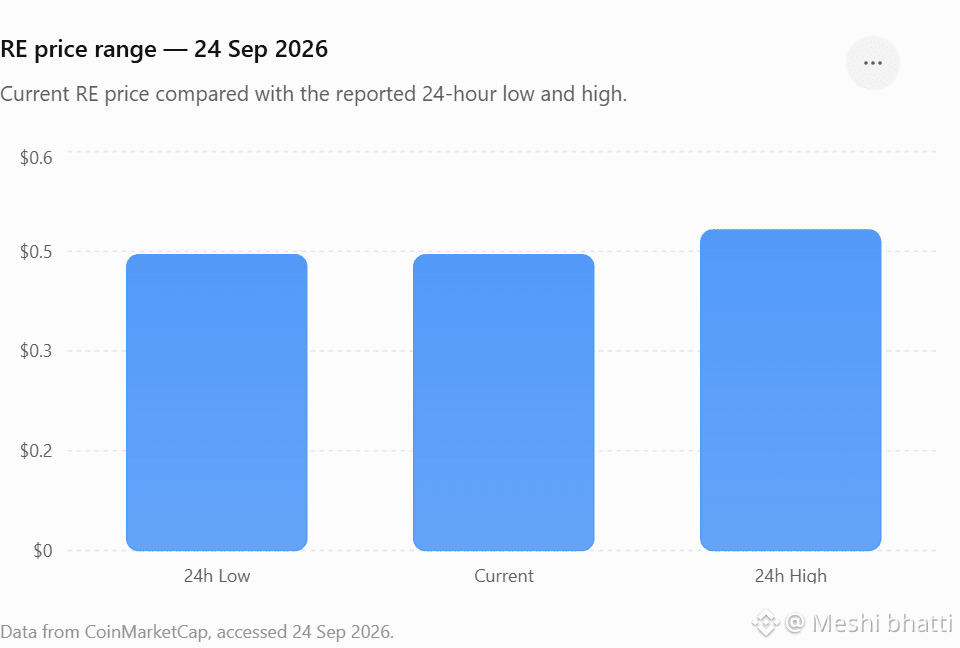
$RE is the governance token of Re Protocol, an RWA project connecting blockchain capital with the traditional reinsurance market. As of 24 September 2026, RE is trading around $0.44, with a market cap near $71M and about 159.6M RE circulating.
Current price: ~$0.44 24h range: ~$0.445–$0.482 24h move: about -3% ATH: ~$1.09 on June 21, 2026 Key concern: RE has a relatively short trading history, and future token unlocks could increase supply pressure. Technical view: Short-term momentum is currently weak; holding the ~$0.44 area is important, while a move back above ~$0.48 would show stronger short-term momentum.
#BitwiseNEARStakingETPAssetsTop$100M
#AIStocksWhatNext
{spot}(REUSDT)
$RE is the governance token of Re Protocol, an RWA project connecting blockchain capital with the traditional reinsurance market. As of 24 September 2026, RE is trading around $0.44, with a market cap near $71M and about 159.6M RE circulating.
Current price: ~$0.44 24h range: ~$0.445–$0.482 24h move: about -3% ATH: ~$1.09 on June 21, 2026 Key concern: RE has a relatively short trading history, and future token unlocks could increase supply pressure. Technical view: Short-term momentum is currently weak; holding the ~$0.44 area is important, while a move back above ~$0.48 would show stronger short-term momentum.
#BitwiseNEARStakingETPAssetsTop$100M
#AIStocksWhatNext
Current price: ~$0.44 24h range: ~$0.445–$0.482 24h move: about -3% ATH: ~$1.09 on June 21, 2026 Key concern: RE has a relatively short trading history, and future token unlocks could increase supply pressure. Technical view: Short-term momentum is currently weak; holding the ~$0.44 area is important, while a move back above ~$0.48 would show stronger short-term momentum.
#BitwiseNEARStakingETPAssetsTop$100M
#AIStocksWhatNext
197
·
--
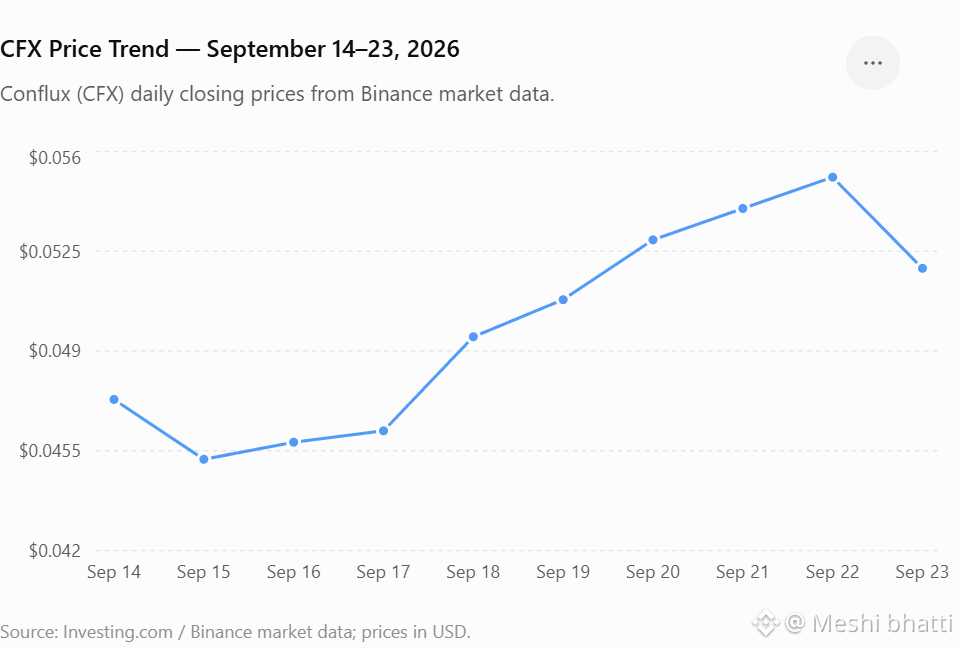
$CFX has recently pulled back after reaching about $0.055–$0.056, with the Sep. 23 close near $0.052.
Short-term trend: Volatile, with recent upward movement followed by a pullback. Support: around $0.048–$0.050 Resistance: around $0.055–$0.056 A sustained move above $0.056 could indicate stronger momentum, while losing $0.048 would weaken the short-term structure. $CFX is a Layer-1 blockchain token; its network uses a Tree-Graph consensus design and supports EVM-compatible smart contracts.
#AIStocksWhatNext
#BCHJumps28%OnCMEFuturesListing
#CFX
{spot}(CFXUSDT)
$CFX has recently pulled back after reaching about $0.055–$0.056, with the Sep. 23 close near $0.052.
Short-term trend: Volatile, with recent upward movement followed by a pullback. Support: around $0.048–$0.050 Resistance: around $0.055–$0.056 A sustained move above $0.056 could indicate stronger momentum, while losing $0.048 would weaken the short-term structure. $CFX is a Layer-1 blockchain token; its network uses a Tree-Graph consensus design and supports EVM-compatible smart contracts.
#AIStocksWhatNext
#BCHJumps28%OnCMEFuturesListing
#CFX
Short-term trend: Volatile, with recent upward movement followed by a pullback. Support: around $0.048–$0.050 Resistance: around $0.055–$0.056 A sustained move above $0.056 could indicate stronger momentum, while losing $0.048 would weaken the short-term structure. $CFX is a Layer-1 blockchain token; its network uses a Tree-Graph consensus design and supports EVM-compatible smart contracts.
#AIStocksWhatNext
#BCHJumps28%OnCMEFuturesListing
#CFX
345
·
--
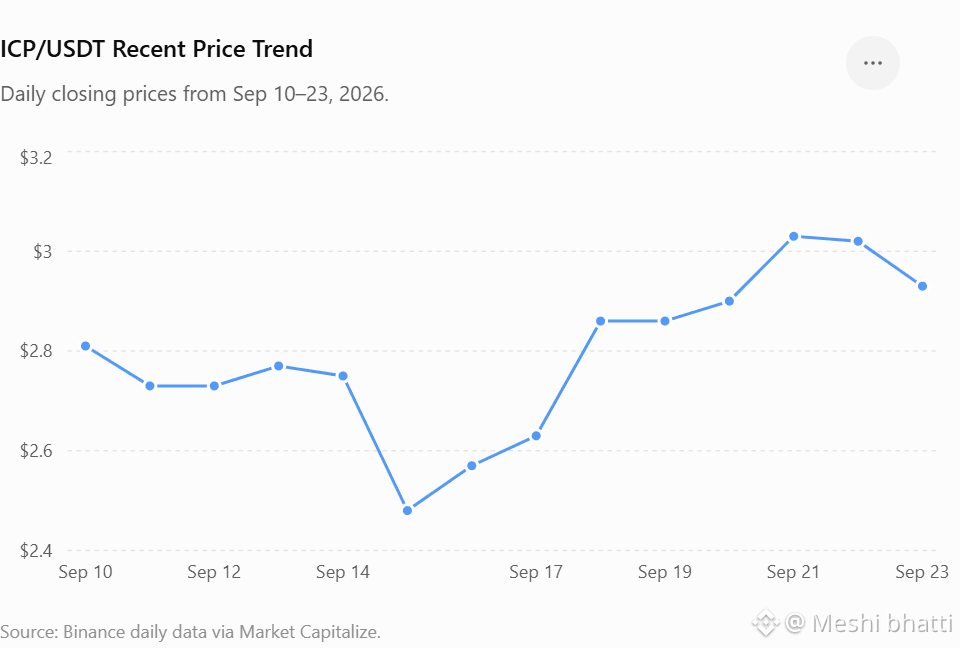
$ICP is trading around $2.91 currently, with a 24-hour range of roughly $2.86–$3.16.
Short-term trend: After rising from about $2.48 on Sep 15 to $3.03 on Sep 21, ICP pulled back to around $2.93 on Sep 23. Support: Around $2.80–$2.85 Resistance: Around $3.05–$3.20 Bullish signal: A sustained move above $3.20 could indicate stronger momentum. Risk: Losing the $2.80 area could put more pressure on the price. ICP's network focuses on decentralized on-chain computing, and the ICP token is used for network governance and paying for computation.
#AIStocksWhatNext
#BCHJumps28%OnCMEFuturesListing
{spot}(ICPUSDT)
$ICP is trading around $2.91 currently, with a 24-hour range of roughly $2.86–$3.16.
Short-term trend: After rising from about $2.48 on Sep 15 to $3.03 on Sep 21, ICP pulled back to around $2.93 on Sep 23. Support: Around $2.80–$2.85 Resistance: Around $3.05–$3.20 Bullish signal: A sustained move above $3.20 could indicate stronger momentum. Risk: Losing the $2.80 area could put more pressure on the price. ICP's network focuses on decentralized on-chain computing, and the ICP token is used for network governance and paying for computation.
#AIStocksWhatNext
#BCHJumps28%OnCMEFuturesListing
Short-term trend: After rising from about $2.48 on Sep 15 to $3.03 on Sep 21, ICP pulled back to around $2.93 on Sep 23. Support: Around $2.80–$2.85 Resistance: Around $3.05–$3.20 Bullish signal: A sustained move above $3.20 could indicate stronger momentum. Risk: Losing the $2.80 area could put more pressure on the price. ICP's network focuses on decentralized on-chain computing, and the ICP token is used for network governance and paying for computation.
#AIStocksWhatNext
#BCHJumps28%OnCMEFuturesListing
191
·
--
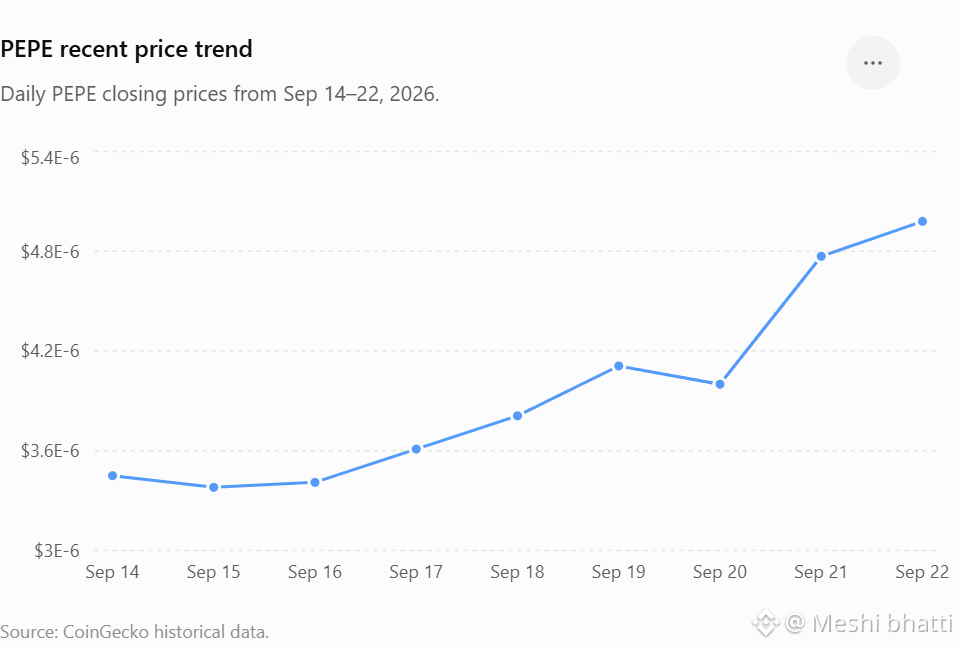
$PEPE is currently around $0.00000437, with a market cap near $1.84B and 24-hour volume around $595M.
Short-term trend: Strong recent recovery, but today PEPE is pulling back about 10.9%. Recent momentum: PEPE rose from about $0.00000341 on Sep 16 to $0.00000498 on Sep 22, showing strong buying momentum. Key area: Around $0.0000050–$0.0000051 is an important recent resistance zone; a sustained move above it would need to be supported by volume. Risk: $PEPE is a meme coin, so price can move sharply with market sentiment and speculation.
Overall: $PEPE has shown strong short-term momentum, but the current pullback means traders should watch whether it holds the recent support area rather than chasing a sudden move.
#AIStocksWhatNext
#21SharesLaunchesEuropesFirstZcashETP
#PEPE
{spot}(PEPEUSDT)
$PEPE is currently around $0.00000437, with a market cap near $1.84B and 24-hour volume around $595M.
Short-term trend: Strong recent recovery, but today PEPE is pulling back about 10.9%. Recent momentum: PEPE rose from about $0.00000341 on Sep 16 to $0.00000498 on Sep 22, showing strong buying momentum. Key area: Around $0.0000050–$0.0000051 is an important recent resistance zone; a sustained move above it would need to be supported by volume. Risk: $PEPE is a meme coin, so price can move sharply with market sentiment and speculation.
Overall: $PEPE has shown strong short-term momentum, but the current pullback means traders should watch whether it holds the recent support area rather than chasing a sudden move.
#AIStocksWhatNext
#21SharesLaunchesEuropesFirstZcashETP
#PEPE
Short-term trend: Strong recent recovery, but today PEPE is pulling back about 10.9%. Recent momentum: PEPE rose from about $0.00000341 on Sep 16 to $0.00000498 on Sep 22, showing strong buying momentum. Key area: Around $0.0000050–$0.0000051 is an important recent resistance zone; a sustained move above it would need to be supported by volume. Risk: $PEPE is a meme coin, so price can move sharply with market sentiment and speculation.
Overall: $PEPE has shown strong short-term momentum, but the current pullback means traders should watch whether it holds the recent support area rather than chasing a sudden move.
#AIStocksWhatNext
#21SharesLaunchesEuropesFirstZcashETP
#PEPE
4
1.4k
·
--
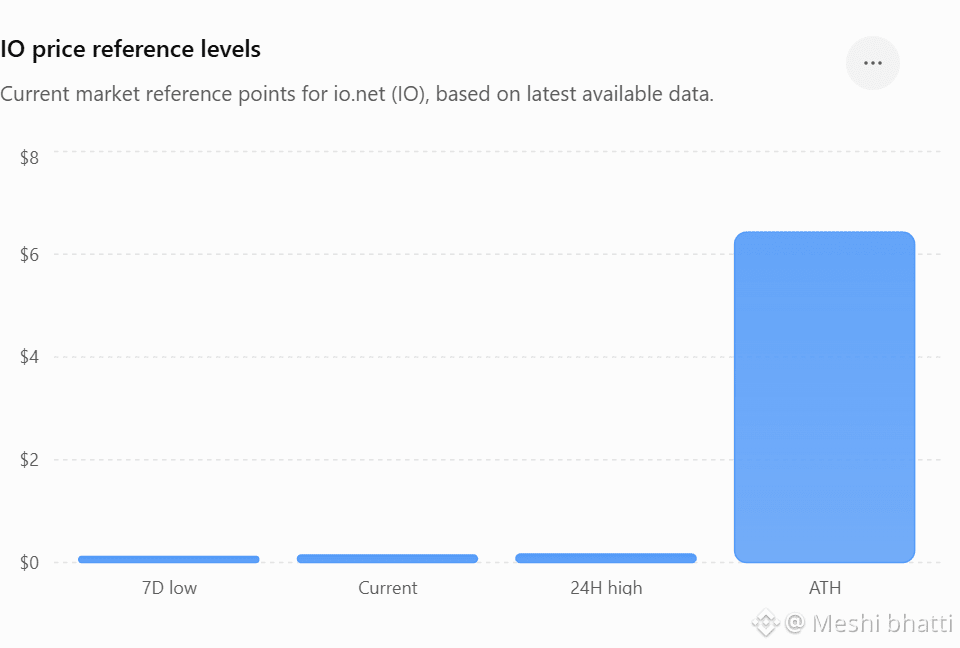
$IO is the native token of io.net, a decentralized GPU/compute network. As of Sept. 22, 2026, $IO closed around $0.1595, after rising from about $0.122 on Sept. 16.
Technical view:
📈 Short-term momentum: improving after the mid-September low. Support: around $0.145–$0.150 Resistance: around $0.160–$0.165 A sustained move above the resistance zone could indicate stronger momentum, while losing $0.145 could bring renewed selling pressure. $IO remains highly volatile, so this is a market analysis rather than a guarantee of future price movement.
#AIStocksWhatNext
#BitwiseNEARStakingETPAssetsTop$100M
{spot}(IOUSDT)
$IO is the native token of io.net, a decentralized GPU/compute network. As of Sept. 22, 2026, $IO closed around $0.1595, after rising from about $0.122 on Sept. 16.
Technical view:
📈 Short-term momentum: improving after the mid-September low. Support: around $0.145–$0.150 Resistance: around $0.160–$0.165 A sustained move above the resistance zone could indicate stronger momentum, while losing $0.145 could bring renewed selling pressure. $IO remains highly volatile, so this is a market analysis rather than a guarantee of future price movement.
#AIStocksWhatNext
#BitwiseNEARStakingETPAssetsTop$100M
Technical view:
📈 Short-term momentum: improving after the mid-September low. Support: around $0.145–$0.150 Resistance: around $0.160–$0.165 A sustained move above the resistance zone could indicate stronger momentum, while losing $0.145 could bring renewed selling pressure. $IO remains highly volatile, so this is a market analysis rather than a guarantee of future price movement.
#AIStocksWhatNext
#BitwiseNEARStakingETPAssetsTop$100M
254
Log in to explore more content
Join global crypto users on Binance Square
⚡️ Get latest and useful information about crypto.
💬 Trusted by the world’s largest crypto exchange.
👍 Discover real insights from verified creators.
Email / Phone number
Trending Topics
CircleMints500MUSDCOnSolana
494 views
68 Discussing
$SOL — CIRCLE JUST PRINTED ANOTHER $500M USDC ON SOLANA. 🚨
Circle ($CRCL ) minted 500 million USDC on Solana in two $250M batches, adding another major liquidity injection to the network. On-chain reporting confirms the mints, although the tokens initially remained in Circle-controlled treasury inventory rather than immediately entering circulation.
And this isn’t an isolated move.
Solana’s total stablecoin supply just hit a fresh $17.3B all-time high, while Circle reportedly minted roughly $11B of USDC on Solana during August alone.
Why does this matter for $SOL ?
More stablecoin liquidity can mean more fuel for DEX trading, DeFi, payments and onchain activity.
Money isn’t leaving Solana.
More dollars keep getting minted onto it. 👀
#circlemints500musdconsolana #PolymarketBankFailureBetsDrawFDICConcern #BlackRockBuildsTokenizedPortfoliosForOndo #BitwiseFilesToListNEARETFOnNYSEArca #SECCommissionerPeirceToLeaveOct2
KimHotbae
·0 Likes
·47 views
PolymarketBankFailureBetsDrawFDICConcern
10,012 views
358 Discussing
BlackRockBuildsTokenizedPortfoliosForOndo
7,182 views
242 Discussing