
A李乘峰-
1k Posts

A李乘峰-
Report
Block User
微博:李乘峰:btc4679稳中求胜,专注于合约指导短綫,波段,中長綫,布局。
Frequent Trader
2 Years
5 Following
1.2K+ Followers
300 Liked
Posts
All
Quotes
Videos
Live
PINNED
·
--
Keep your sights higher than your surroundings, and let your actions speak for themselves.
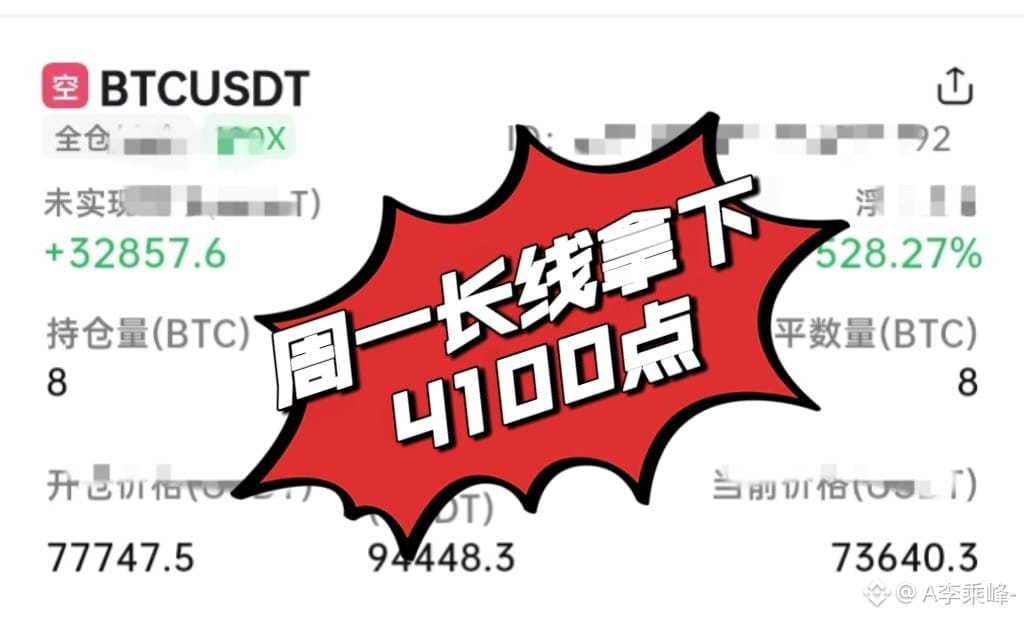
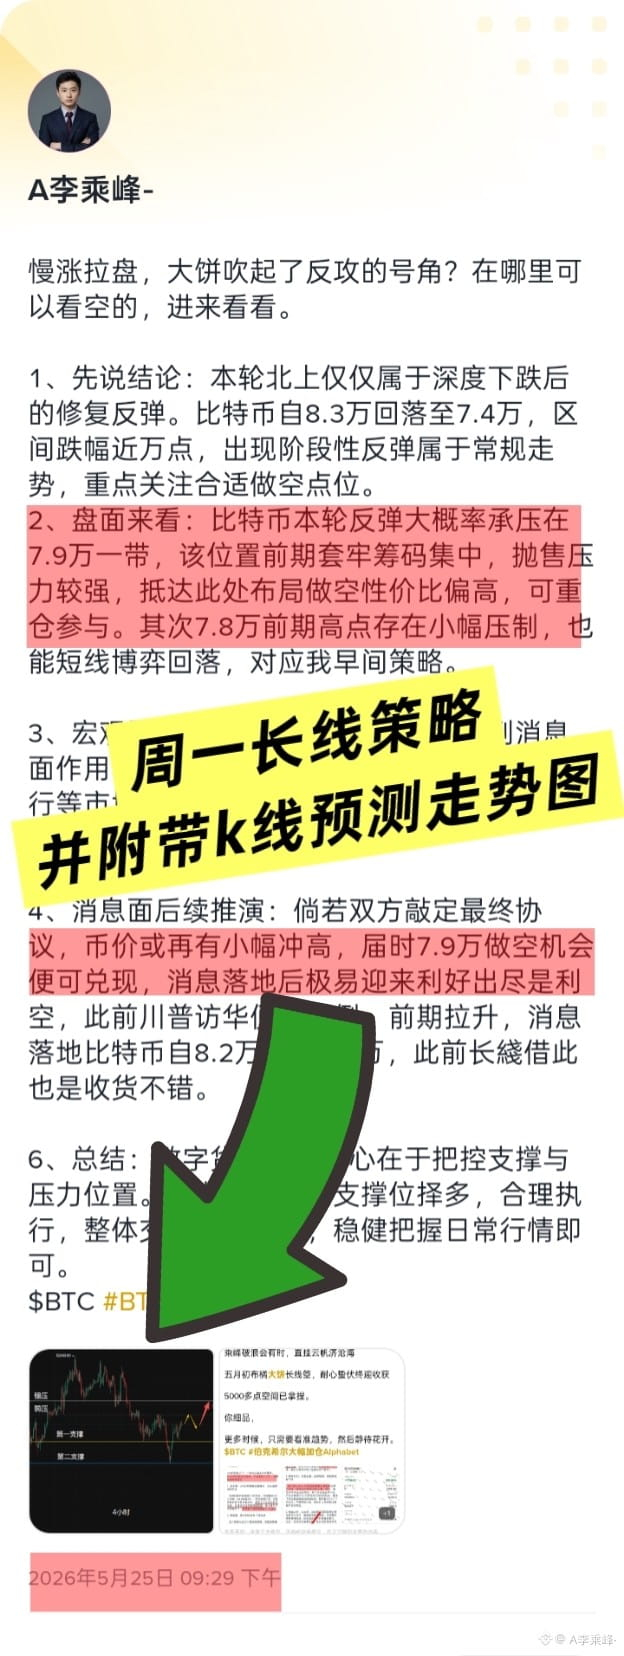
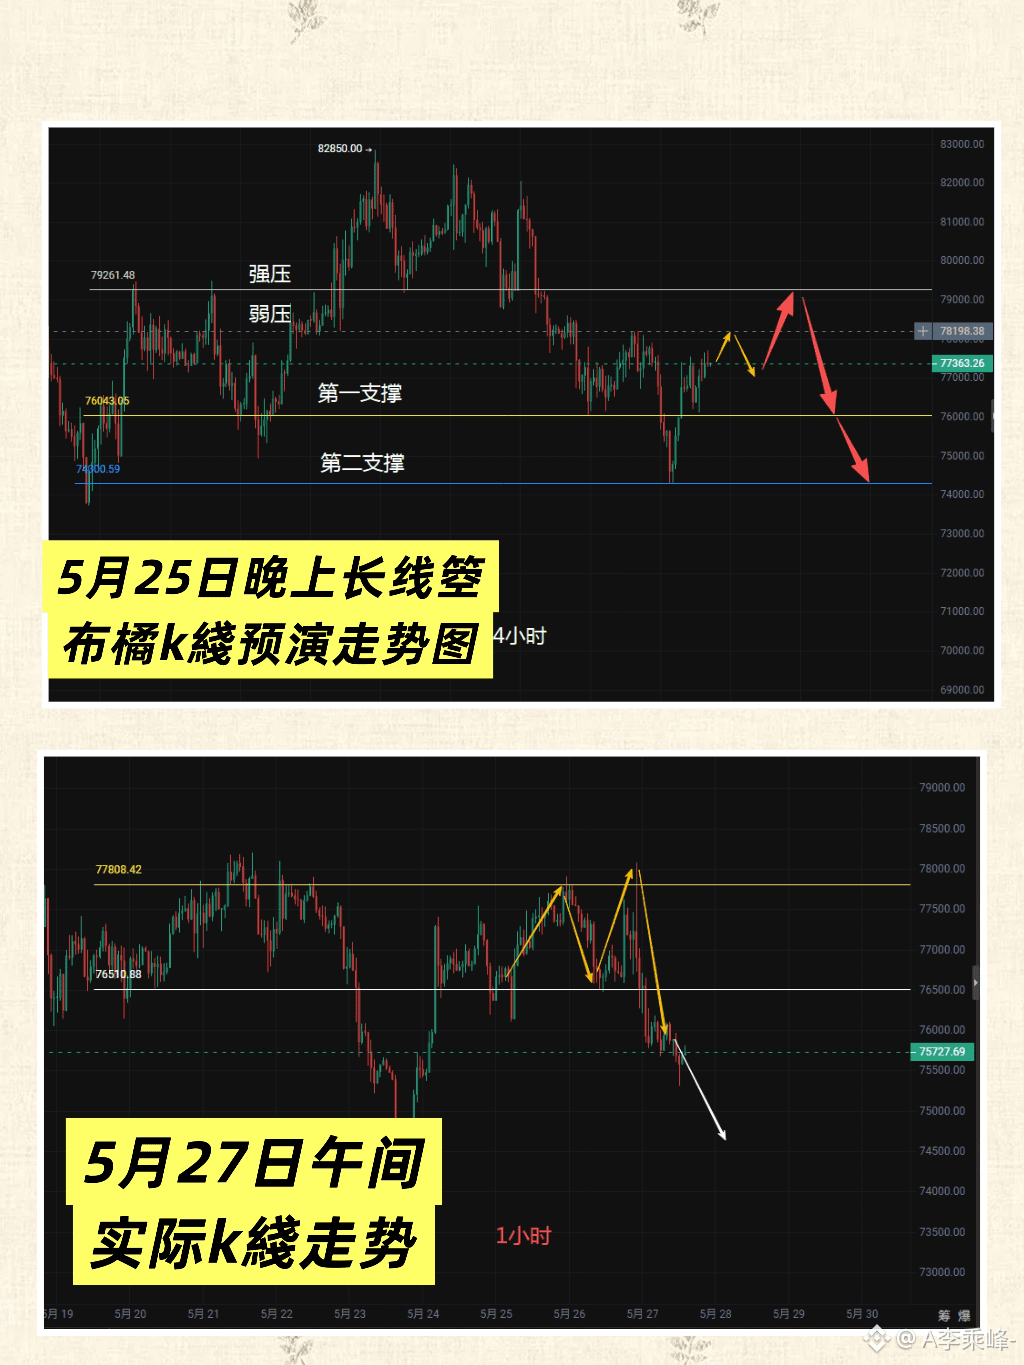
Yes, you’re not mistaken following me, Li Chengfeng. This Monday, I publicly took a long position on KND, hitting 4100 points again.
Strong traders don’t need to say much; the candlestick charts will tell you the story! $BTC #稳定币占比上升BTC主导地位下滑
Keep your sights higher than your surroundings, and let your actions speak for themselves.
Yes, you’re not mistaken following me, Li Chengfeng. This Monday, I publicly took a long position on KND, hitting 4100 points again.
Strong traders don’t need to say much; the candlestick charts will tell you the story! $BTC #稳定币占比上升BTC主导地位下滑
Yes, you’re not mistaken following me, Li Chengfeng. This Monday, I publicly took a long position on KND, hitting 4100 points again.
Strong traders don’t need to say much; the candlestick charts will tell you the story! $BTC #稳定币占比上升BTC主导地位下滑
3
2
174
·
--
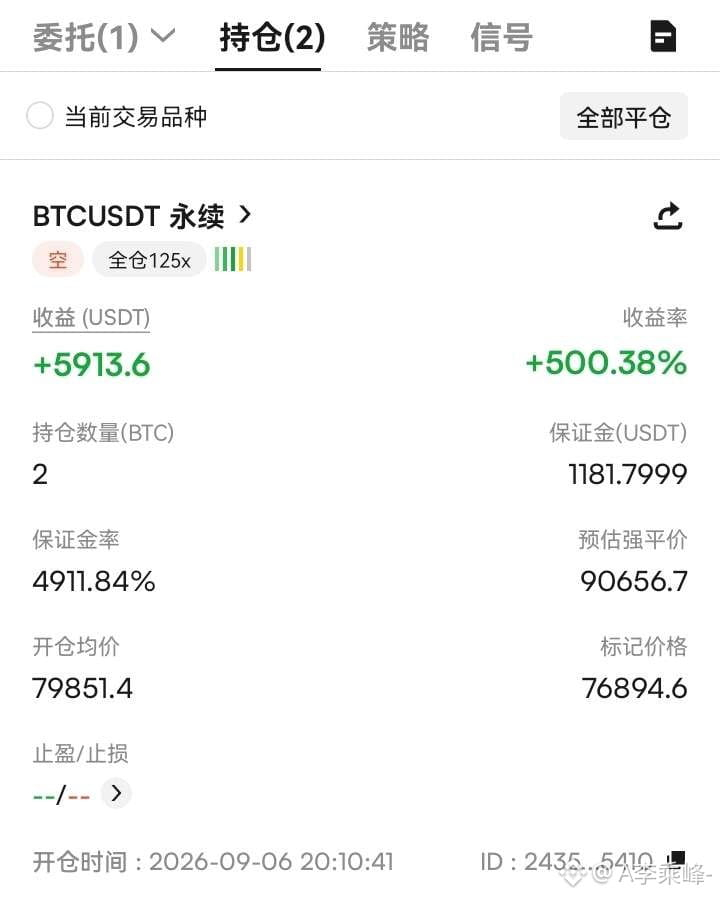
September 11, Friday ➕ CPI = black swan?
Last night’s live order at the market price got “trolled” again, didn’t it!
There isn’t much to talk about today—PPI came in above expectations. The market is repricing the odds that the Federal Reserve will keep tightening. Treasury yields are moving higher, which suppresses the overall performance of risk assets.
Although macro sentiment is somewhat cautious, on-chain exchange inventories continue to decline. The giant whales are waiting to accumulate from low levels, and long-term chips are settling well. That’s why, in the live stream, they’re saying this: this week’s 798 range trade—going short—will most likely be fully closed today. The market focus continues to be on speeches from Fed officials and the upcoming inflation data. This will directly determine the breakout direction of Bitcoin’s consolidation range.
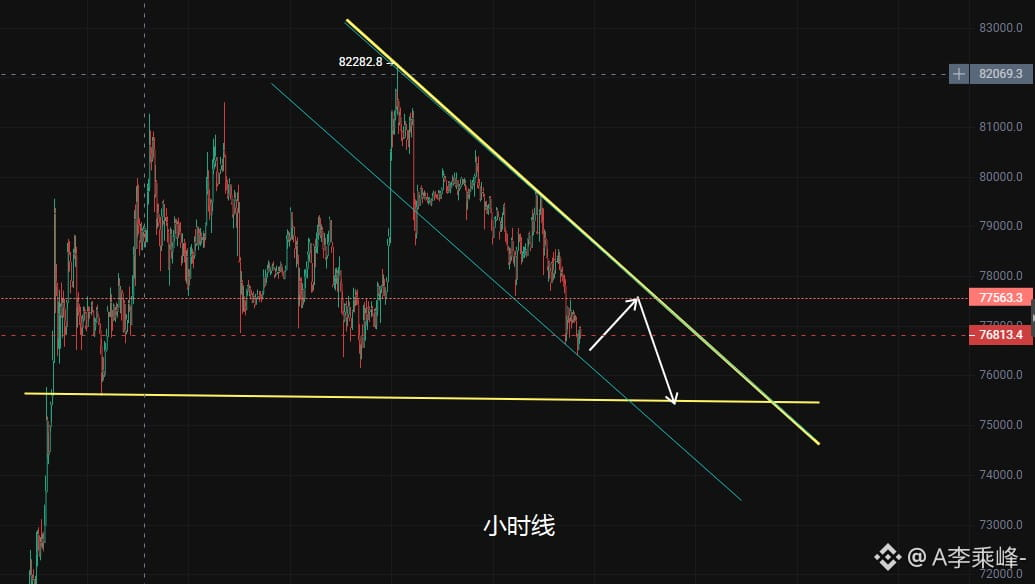
On the technical side, the hourly chart shows a clearly downward channel. The Bollinger Bands’ three lines are opening downward, and the RSI is around 40—it's not in oversold territory yet. Tonight’s CPI is the “guard”—there likely won’t be major changes during the daytime session. A weak bounce and repair is expected, and then we look to keep shorting from the higher levels.
In summary, for intraday short-term trading: on a rebound, consider shorting at 775–778, with targets at 761 and 755.
$BTC #美国8月PPI涨幅低于预期
September 11, Friday ➕ CPI = black swan?
Last night’s live order at the market price got “trolled” again, didn’t it!
There isn’t much to talk about today—PPI came in above expectations. The market is repricing the odds that the Federal Reserve will keep tightening. Treasury yields are moving higher, which suppresses the overall performance of risk assets.
Although macro sentiment is somewhat cautious, on-chain exchange inventories continue to decline. The giant whales are waiting to accumulate from low levels, and long-term chips are settling well. That’s why, in the live stream, they’re saying this: this week’s 798 range trade—going short—will most likely be fully closed today. The market focus continues to be on speeches from Fed officials and the upcoming inflation data. This will directly determine the breakout direction of Bitcoin’s consolidation range.
On the technical side, the hourly chart shows a clearly downward channel. The Bollinger Bands’ three lines are opening downward, and the RSI is around 40—it's not in oversold territory yet. Tonight’s CPI is the “guard”—there likely won’t be major changes during the daytime session. A weak bounce and repair is expected, and then we look to keep shorting from the higher levels.
In summary, for intraday short-term trading: on a rebound, consider shorting at 775–778, with targets at 761 and 755.
$BTC #美国8月PPI涨幅低于预期
Last night’s live order at the market price got “trolled” again, didn’t it!
There isn’t much to talk about today—PPI came in above expectations. The market is repricing the odds that the Federal Reserve will keep tightening. Treasury yields are moving higher, which suppresses the overall performance of risk assets.
Although macro sentiment is somewhat cautious, on-chain exchange inventories continue to decline. The giant whales are waiting to accumulate from low levels, and long-term chips are settling well. That’s why, in the live stream, they’re saying this: this week’s 798 range trade—going short—will most likely be fully closed today. The market focus continues to be on speeches from Fed officials and the upcoming inflation data. This will directly determine the breakout direction of Bitcoin’s consolidation range.
On the technical side, the hourly chart shows a clearly downward channel. The Bollinger Bands’ three lines are opening downward, and the RSI is around 40—it's not in oversold territory yet. Tonight’s CPI is the “guard”—there likely won’t be major changes during the daytime session. A weak bounce and repair is expected, and then we look to keep shorting from the higher levels.
In summary, for intraday short-term trading: on a rebound, consider shorting at 775–778, with targets at 761 and 755.
$BTC #美国8月PPI涨幅低于预期
122
·
--
Thursday, September 10 — last night we livestreamed the current-price order with a 1600-point range. Did we feel great, brothers?
Yesterday’s dust has settled. Today, mountains and seas set off on a new journey. Stay close to the pace of Riding the Peak—your next stop to financial freedom is you!
Enough small talk—let’s get into today’s outlook. After the recent rally, the big BTC has surged and then entered a consolidation phase to digest gains. The bulls’ advantage relying on the favorable news from U.S. Treasury buybacks has already been partially realized, and market funds have become cautious. Frequent flipping between long and short has increased the likelihood of a washout/trading-range market— and I. For this week’s swing-trading approach, I gave everyone the plan as early as Monday. Over the past few days, we’ve also taken a lot of profits from 1,000-point short orders!
As for U.S. Treasuries: the earlier buyback concluded, which briefly pressured long-end U.S. Treasury yields and sparked the “dollar depreciation trade.” But recently, the market has digested the effect of the buybacks. Coupled with the Fed officials’ continued hawkish statements, inflation data has remained resilient. The market has once again adjusted upward its rate-hike expectations, pushing the 10-year U.S. Treasury yield higher again. This has once more put pressure on Bitcoin—an asset that yields nothing.
From a technical perspective, the long-cycle moving averages are still pointing upward. The mid-term uptrend structure hasn’t been directly broken, but after the recent run-up, the upward momentum has clearly weakened. The MACD red histogram keeps shrinking, and the fast/slow lines remain flat at high levels—suggesting possible top-divergence conditions. With each rebound, the trading volume can’t keep up; when volume and price diverge, it shows that the bulls’ push has been losing strength.
In summary: this week’s outlook remains bearish at the high end. For intraday short-term trading, suggestions are to short on rebounds in the 786–790 range, add shorts above 792. Targets are 776 and 768.$BTC #比特币突破79000美元
Thursday, September 10 — last night we livestreamed the current-price order with a 1600-point range. Did we feel great, brothers?
Yesterday’s dust has settled. Today, mountains and seas set off on a new journey. Stay close to the pace of Riding the Peak—your next stop to financial freedom is you!
Enough small talk—let’s get into today’s outlook. After the recent rally, the big BTC has surged and then entered a consolidation phase to digest gains. The bulls’ advantage relying on the favorable news from U.S. Treasury buybacks has already been partially realized, and market funds have become cautious. Frequent flipping between long and short has increased the likelihood of a washout/trading-range market— and I. For this week’s swing-trading approach, I gave everyone the plan as early as Monday. Over the past few days, we’ve also taken a lot of profits from 1,000-point short orders!
As for U.S. Treasuries: the earlier buyback concluded, which briefly pressured long-end U.S. Treasury yields and sparked the “dollar depreciation trade.” But recently, the market has digested the effect of the buybacks. Coupled with the Fed officials’ continued hawkish statements, inflation data has remained resilient. The market has once again adjusted upward its rate-hike expectations, pushing the 10-year U.S. Treasury yield higher again. This has once more put pressure on Bitcoin—an asset that yields nothing.
From a technical perspective, the long-cycle moving averages are still pointing upward. The mid-term uptrend structure hasn’t been directly broken, but after the recent run-up, the upward momentum has clearly weakened. The MACD red histogram keeps shrinking, and the fast/slow lines remain flat at high levels—suggesting possible top-divergence conditions. With each rebound, the trading volume can’t keep up; when volume and price diverge, it shows that the bulls’ push has been losing strength.
In summary: this week’s outlook remains bearish at the high end. For intraday short-term trading, suggestions are to short on rebounds in the 786–790 range, add shorts above 792. Targets are 776 and 768.$BTC #比特币突破79000美元
Yesterday’s dust has settled. Today, mountains and seas set off on a new journey. Stay close to the pace of Riding the Peak—your next stop to financial freedom is you!
Enough small talk—let’s get into today’s outlook. After the recent rally, the big BTC has surged and then entered a consolidation phase to digest gains. The bulls’ advantage relying on the favorable news from U.S. Treasury buybacks has already been partially realized, and market funds have become cautious. Frequent flipping between long and short has increased the likelihood of a washout/trading-range market— and I. For this week’s swing-trading approach, I gave everyone the plan as early as Monday. Over the past few days, we’ve also taken a lot of profits from 1,000-point short orders!
As for U.S. Treasuries: the earlier buyback concluded, which briefly pressured long-end U.S. Treasury yields and sparked the “dollar depreciation trade.” But recently, the market has digested the effect of the buybacks. Coupled with the Fed officials’ continued hawkish statements, inflation data has remained resilient. The market has once again adjusted upward its rate-hike expectations, pushing the 10-year U.S. Treasury yield higher again. This has once more put pressure on Bitcoin—an asset that yields nothing.
From a technical perspective, the long-cycle moving averages are still pointing upward. The mid-term uptrend structure hasn’t been directly broken, but after the recent run-up, the upward momentum has clearly weakened. The MACD red histogram keeps shrinking, and the fast/slow lines remain flat at high levels—suggesting possible top-divergence conditions. With each rebound, the trading volume can’t keep up; when volume and price diverge, it shows that the bulls’ push has been losing strength.
In summary: this week’s outlook remains bearish at the high end. For intraday short-term trading, suggestions are to short on rebounds in the 786–790 range, add shorts above 792. Targets are 776 and 768.$BTC #比特币突破79000美元


132
·
--
When institutions reduce holdings meet pre-market semiconductors, the storage sector generally rises, and judging from the market, it indeed brings a boost in sentiment. In the short term, it may be supported by a rebound, but the upside is limited. If short positions are considered, you can watch the 798–800 area. If it fails to break through effectively, then it’s a rhythm of baiting the bulls—keep your hands on the guardrail and don’t rush in to catch a falling knife!$BTC #美加关税战升级
When institutions reduce holdings meet pre-market semiconductors, the storage sector generally rises, and judging from the market, it indeed brings a boost in sentiment. In the short term, it may be supported by a rebound, but the upside is limited. If short positions are considered, you can watch the 798–800 area. If it fails to break through effectively, then it’s a rhythm of baiting the bulls—keep your hands on the guardrail and don’t rush in to catch a falling knife!$BTC #美加关税战升级


100
·
--
792 pressure level, morning strategy also mentioned that you can go short (sell) at this level, catch up in reverse and pick up people—then just short it in, keep your defense tight, and wait for my instructions afterward!$BTC #美加关税战升级
792 pressure level, morning strategy also mentioned that you can go short (sell) at this level, catch up in reverse and pick up people—then just short it in, keep your defense tight, and wait for my instructions afterward!$BTC #美加关税战升级

80
·
--
September 9th, Wednesday. The autumn wind was chilly, and I could feel a bit of coolness when I got up early, yet it couldn’t outmatch the recent heat in market sentiment! Last night during the livestream, I was still sharing that there were no losing trades this week—turns out the current price tempted my greed and I ended up going short.
So looking at today: after the Non-Farm Payrolls data, market expectations for Federal Reserve policy are in a tug-of-war. The probability of a September rate hike is trapped in a range. Treasury yields are fluctuating at high levels, and the strength or weakness of the US dollar directly constrains crypto assets. ETF inflows occur intermittently, but the sustainability is insufficient. Combined with geopolitical risks throwing in disruptions, the overall market environment is more of a sideways-to-range type, and no clear one-way trend has opened up yet. A new round of bond repurchase operations by the Ministry of Finance has taken effect, which brings a liquidity variable to the market in the short term. The key is to wait for the subsequent inflation data and the CPI data to be released on Friday for guidance.
From a technical perspective, the hourly chart has formed a downward channel, consistent with the static chart attached on Monday for the outlook before this coming Friday. The MACD histogram has shrunk on reduced volume, indicating insufficient upward momentum. Although the RSI is nearing the overbought region, it is being suppressed by the moving averages and has started to turn—so in a range-bound environment, the outlook is to favor shorts.
In summary, for intraday short-term trading: on any rebound around 792, consider opening shorts, targeting 781 and 772.$BTC #美伊互袭油轮冲突升级
September 9th, Wednesday. The autumn wind was chilly, and I could feel a bit of coolness when I got up early, yet it couldn’t outmatch the recent heat in market sentiment! Last night during the livestream, I was still sharing that there were no losing trades this week—turns out the current price tempted my greed and I ended up going short.
So looking at today: after the Non-Farm Payrolls data, market expectations for Federal Reserve policy are in a tug-of-war. The probability of a September rate hike is trapped in a range. Treasury yields are fluctuating at high levels, and the strength or weakness of the US dollar directly constrains crypto assets. ETF inflows occur intermittently, but the sustainability is insufficient. Combined with geopolitical risks throwing in disruptions, the overall market environment is more of a sideways-to-range type, and no clear one-way trend has opened up yet. A new round of bond repurchase operations by the Ministry of Finance has taken effect, which brings a liquidity variable to the market in the short term. The key is to wait for the subsequent inflation data and the CPI data to be released on Friday for guidance.
From a technical perspective, the hourly chart has formed a downward channel, consistent with the static chart attached on Monday for the outlook before this coming Friday. The MACD histogram has shrunk on reduced volume, indicating insufficient upward momentum. Although the RSI is nearing the overbought region, it is being suppressed by the moving averages and has started to turn—so in a range-bound environment, the outlook is to favor shorts.
In summary, for intraday short-term trading: on any rebound around 792, consider opening shorts, targeting 781 and 772.$BTC #美伊互袭油轮冲突升级
So looking at today: after the Non-Farm Payrolls data, market expectations for Federal Reserve policy are in a tug-of-war. The probability of a September rate hike is trapped in a range. Treasury yields are fluctuating at high levels, and the strength or weakness of the US dollar directly constrains crypto assets. ETF inflows occur intermittently, but the sustainability is insufficient. Combined with geopolitical risks throwing in disruptions, the overall market environment is more of a sideways-to-range type, and no clear one-way trend has opened up yet. A new round of bond repurchase operations by the Ministry of Finance has taken effect, which brings a liquidity variable to the market in the short term. The key is to wait for the subsequent inflation data and the CPI data to be released on Friday for guidance.
From a technical perspective, the hourly chart has formed a downward channel, consistent with the static chart attached on Monday for the outlook before this coming Friday. The MACD histogram has shrunk on reduced volume, indicating insufficient upward momentum. Although the RSI is nearing the overbought region, it is being suppressed by the moving averages and has started to turn—so in a range-bound environment, the outlook is to favor shorts.
In summary, for intraday short-term trading: on any rebound around 792, consider opening shorts, targeting 781 and 772.$BTC #美伊互袭油轮冲突升级

80
·
--
Monday waveband drop ➕ early morning strategy current price short, everything is proceeding exactly according to my predetermined direction!
Everything is getting better, just wait patiently for the bullets to fly a little longer.
The waveband short positions are synchronized—if you can’t hold them, still give it everything you’ve got to hold! Wait for my signal!$BTC #美伊互袭油轮冲突升级
Monday waveband drop ➕ early morning strategy current price short, everything is proceeding exactly according to my predetermined direction!
Everything is getting better, just wait patiently for the bullets to fly a little longer.
The waveband short positions are synchronized—if you can’t hold them, still give it everything you’ve got to hold! Wait for my signal!$BTC #美伊互袭油轮冲突升级
Everything is getting better, just wait patiently for the bullets to fly a little longer.
The waveband short positions are synchronized—if you can’t hold them, still give it everything you’ve got to hold! Wait for my signal!$BTC #美伊互袭油轮冲突升级


27
·
--
Surely many people have been thrown off emotionally by the recent frenzy of copycat coins surging. As zec expected, it has risen to 1260. Many thought the market would keep making new highs—but in fact, the signals from the real main order book have quietly turned bearish. What’s going on? Take a look now!
The biggest bearish signal in this round of trading:
Mainstream coins have been consolidating sideways with stalled gains, while copycats have been疯狂 draining liquidity.
$ARB $ZEC and other copycat coins rotate upward explosively. Funds have been escaping in large volumes from big BTC-like assets. Trading volume on the overall market has continued to shrink. BTC has completely lost its momentum to push higher.
This is not a bullish signal. It’s the standard pattern of late-stage market action: money huddles into small caps to reduce risk, while the broader market prepares for a pullback.
The key window is this Friday’s CPI plus the result of the 15th-figure bill/decision.
Right now the market is in a state of: bullish expectations are priced in early, and once the news lands, it’s immediately realized.
You might ask: “If the bill landing is good news for the crypto market, why still look bearish against the trend?”
The detailed reasons were discussed many times in yesterday’s live stream, so I won’t go over them again here. Basically, the Non-Farm Payrolls data came in far above expectations, causing inflation concerns to heat up. In recent days, the crypto market’s recovery has flipped—from betting that the Fed might cut rates or keep rates unchanged in September—to a higher probability of rate hikes.
So the current high-level range-bound chop is essentially a bear-accumulating, bull-slowly-cutting-losses “bull trap” type of consolidation.
On the technical side: the big BTC-like coin repeatedly attempted to break up into the 800–830 range, but all failed. The highs have kept getting lower, volume has contracted during the sideways movement, and the CPI on Friday is suppressing the bulls and giving the bears an advantage. Technically, the daily chart has shown signs of “high-level dulling,” divergence between price and volume, and an exhaustion pattern. This week we should prioritize moving into a pullback and repair.
The band-short orders placed at the Monday 80k high level remain unchanged. Before this coming Friday, the overall sentiment will likely chop and drift downward slowly. We’ll wait for the CPI data to land.
For intraday short-term trades: if there’s a rebound around 795, consider entering shorts. Targets: 781, then 768.
$BTC #美伊互袭油轮冲突升级
Surely many people have been thrown off emotionally by the recent frenzy of copycat coins surging. As zec expected, it has risen to 1260. Many thought the market would keep making new highs—but in fact, the signals from the real main order book have quietly turned bearish. What’s going on? Take a look now!
The biggest bearish signal in this round of trading:
Mainstream coins have been consolidating sideways with stalled gains, while copycats have been疯狂 draining liquidity.
$ARB $ZEC and other copycat coins rotate upward explosively. Funds have been escaping in large volumes from big BTC-like assets. Trading volume on the overall market has continued to shrink. BTC has completely lost its momentum to push higher.
This is not a bullish signal. It’s the standard pattern of late-stage market action: money huddles into small caps to reduce risk, while the broader market prepares for a pullback.
The key window is this Friday’s CPI plus the result of the 15th-figure bill/decision.
Right now the market is in a state of: bullish expectations are priced in early, and once the news lands, it’s immediately realized.
You might ask: “If the bill landing is good news for the crypto market, why still look bearish against the trend?”
The detailed reasons were discussed many times in yesterday’s live stream, so I won’t go over them again here. Basically, the Non-Farm Payrolls data came in far above expectations, causing inflation concerns to heat up. In recent days, the crypto market’s recovery has flipped—from betting that the Fed might cut rates or keep rates unchanged in September—to a higher probability of rate hikes.
So the current high-level range-bound chop is essentially a bear-accumulating, bull-slowly-cutting-losses “bull trap” type of consolidation.
On the technical side: the big BTC-like coin repeatedly attempted to break up into the 800–830 range, but all failed. The highs have kept getting lower, volume has contracted during the sideways movement, and the CPI on Friday is suppressing the bulls and giving the bears an advantage. Technically, the daily chart has shown signs of “high-level dulling,” divergence between price and volume, and an exhaustion pattern. This week we should prioritize moving into a pullback and repair.
The band-short orders placed at the Monday 80k high level remain unchanged. Before this coming Friday, the overall sentiment will likely chop and drift downward slowly. We’ll wait for the CPI data to land.
For intraday short-term trades: if there’s a rebound around 795, consider entering shorts. Targets: 781, then 768.
$BTC #美伊互袭油轮冲突升级
The biggest bearish signal in this round of trading:
Mainstream coins have been consolidating sideways with stalled gains, while copycats have been疯狂 draining liquidity.
$ARB $ZEC and other copycat coins rotate upward explosively. Funds have been escaping in large volumes from big BTC-like assets. Trading volume on the overall market has continued to shrink. BTC has completely lost its momentum to push higher.
This is not a bullish signal. It’s the standard pattern of late-stage market action: money huddles into small caps to reduce risk, while the broader market prepares for a pullback.
The key window is this Friday’s CPI plus the result of the 15th-figure bill/decision.
Right now the market is in a state of: bullish expectations are priced in early, and once the news lands, it’s immediately realized.
You might ask: “If the bill landing is good news for the crypto market, why still look bearish against the trend?”
The detailed reasons were discussed many times in yesterday’s live stream, so I won’t go over them again here. Basically, the Non-Farm Payrolls data came in far above expectations, causing inflation concerns to heat up. In recent days, the crypto market’s recovery has flipped—from betting that the Fed might cut rates or keep rates unchanged in September—to a higher probability of rate hikes.
So the current high-level range-bound chop is essentially a bear-accumulating, bull-slowly-cutting-losses “bull trap” type of consolidation.
On the technical side: the big BTC-like coin repeatedly attempted to break up into the 800–830 range, but all failed. The highs have kept getting lower, volume has contracted during the sideways movement, and the CPI on Friday is suppressing the bulls and giving the bears an advantage. Technically, the daily chart has shown signs of “high-level dulling,” divergence between price and volume, and an exhaustion pattern. This week we should prioritize moving into a pullback and repair.
The band-short orders placed at the Monday 80k high level remain unchanged. Before this coming Friday, the overall sentiment will likely chop and drift downward slowly. We’ll wait for the CPI data to land.
For intraday short-term trades: if there’s a rebound around 795, consider entering shorts. Targets: 781, then 768.
$BTC #美伊互袭油轮冲突升级

1
386
·
--
Afraid of wolves after being scared by tigers, watching others drive a Land Rover?
Before the U.S. stock market opened on Friday, the livestream clearly reminded everyone that $ZEC would pull back and then rebound. Brothers who missed the low point, this will be your last chance to get on board. On Friday, we look at 1063; I had too little vision. Yesterday afternoon, the livestream told long-position brothers to hold firmly and look at 1260. This morning it reached 1257. In three days, there was a 300-point range. Follow me going long and things will flourish. The market will tell you what it means to ride the trend lightly and effortlessly, while fighting the trend is chaotic and messy!#ZEC市值超越DOGE
Afraid of wolves after being scared by tigers, watching others drive a Land Rover?
Before the U.S. stock market opened on Friday, the livestream clearly reminded everyone that $ZEC would pull back and then rebound. Brothers who missed the low point, this will be your last chance to get on board. On Friday, we look at 1063; I had too little vision. Yesterday afternoon, the livestream told long-position brothers to hold firmly and look at 1260. This morning it reached 1257. In three days, there was a 300-point range. Follow me going long and things will flourish. The market will tell you what it means to ride the trend lightly and effortlessly, while fighting the trend is chaotic and messy!#ZEC市值超越DOGE
Before the U.S. stock market opened on Friday, the livestream clearly reminded everyone that $ZEC would pull back and then rebound. Brothers who missed the low point, this will be your last chance to get on board. On Friday, we look at 1063; I had too little vision. Yesterday afternoon, the livestream told long-position brothers to hold firmly and look at 1260. This morning it reached 1257. In three days, there was a 300-point range. Follow me going long and things will flourish. The market will tell you what it means to ride the trend lightly and effortlessly, while fighting the trend is chaotic and messy!#ZEC市值超越DOGE
1
165
·
--
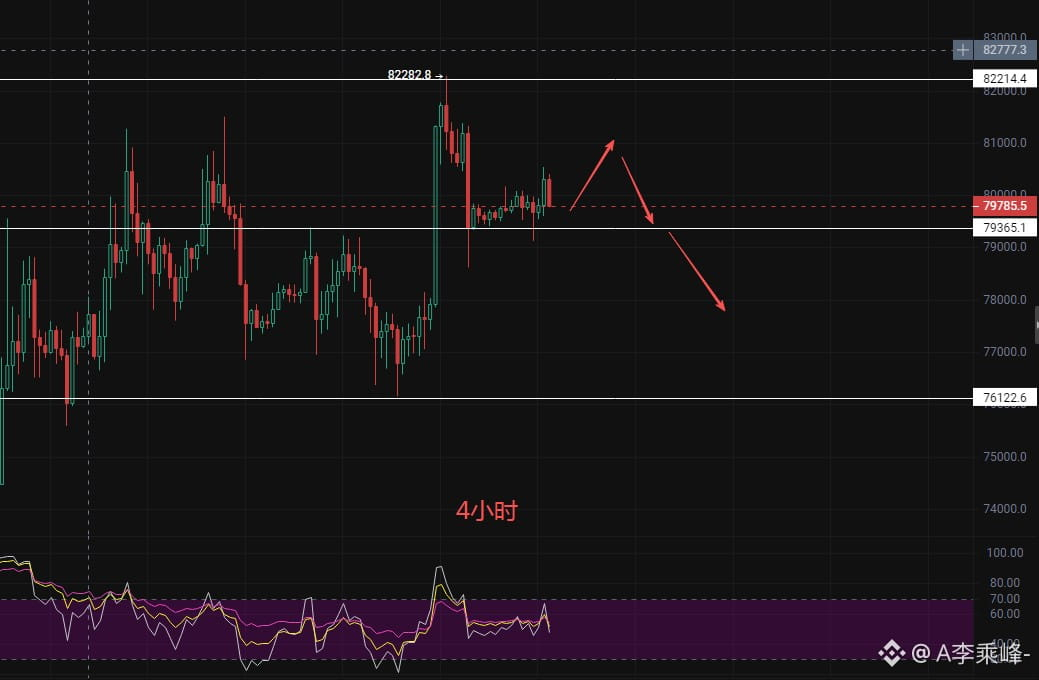
On Monday, September 7, the second natural week of the month, the nonfarm payroll data far exceeded the previous figure, pouring cold water on market expectations for a September rate cut. After the sell-off on Friday, prices rebounded to the 80,000 level and remained in high-level consolidation, with longs and shorts diverging as the market turns to this Friday’s CPI.
Looking at the macro side first, the market as a whole is in a high-level consolidation pattern. The altcoin sector surged collectively, showing a clear spillover effect, with a large amount of capital flowing from BTC into smaller coins such as ARB and ZEC, diluting Bitcoin’s upward momentum. The market’s core focus is locked on the September 15 Clarity Act decision, which is the biggest short-term catalyst. Funds are generally cautious before the decision is finalized, while closely tracking speeches by Federal Reserve officials and changes in U.S. Treasury yields. ETF inflows remain at a moderate level, with no significant net inflows or outflows.
On the technical side, bullish momentum still remains in the indicators, but repeated attempts to break higher have lacked volume. RSI has moved into a relatively overbought range, suggesting a need for a short-term pullback to build momentum. Overall, this is a high-level consolidation after a rise, with no clear one-way direction.
In summary, for intraday short-term trading, consider shorting on rebounds in the 806-812 range, targeting 792, and if broken, look to 781. $BTC #ZEC续刷历史新高
On Monday, September 7, the second natural week of the month, the nonfarm payroll data far exceeded the previous figure, pouring cold water on market expectations for a September rate cut. After the sell-off on Friday, prices rebounded to the 80,000 level and remained in high-level consolidation, with longs and shorts diverging as the market turns to this Friday’s CPI.
Looking at the macro side first, the market as a whole is in a high-level consolidation pattern. The altcoin sector surged collectively, showing a clear spillover effect, with a large amount of capital flowing from BTC into smaller coins such as ARB and ZEC, diluting Bitcoin’s upward momentum. The market’s core focus is locked on the September 15 Clarity Act decision, which is the biggest short-term catalyst. Funds are generally cautious before the decision is finalized, while closely tracking speeches by Federal Reserve officials and changes in U.S. Treasury yields. ETF inflows remain at a moderate level, with no significant net inflows or outflows.
On the technical side, bullish momentum still remains in the indicators, but repeated attempts to break higher have lacked volume. RSI has moved into a relatively overbought range, suggesting a need for a short-term pullback to build momentum. Overall, this is a high-level consolidation after a rise, with no clear one-way direction.
In summary, for intraday short-term trading, consider shorting on rebounds in the 806-812 range, targeting 792, and if broken, look to 781. $BTC #ZEC续刷历史新高
Looking at the macro side first, the market as a whole is in a high-level consolidation pattern. The altcoin sector surged collectively, showing a clear spillover effect, with a large amount of capital flowing from BTC into smaller coins such as ARB and ZEC, diluting Bitcoin’s upward momentum. The market’s core focus is locked on the September 15 Clarity Act decision, which is the biggest short-term catalyst. Funds are generally cautious before the decision is finalized, while closely tracking speeches by Federal Reserve officials and changes in U.S. Treasury yields. ETF inflows remain at a moderate level, with no significant net inflows or outflows.
On the technical side, bullish momentum still remains in the indicators, but repeated attempts to break higher have lacked volume. RSI has moved into a relatively overbought range, suggesting a need for a short-term pullback to build momentum. Overall, this is a high-level consolidation after a rise, with no clear one-way direction.
In summary, for intraday short-term trading, consider shorting on rebounds in the 806-812 range, targeting 792, and if broken, look to 781. $BTC #ZEC续刷历史新高
219
·
--
Altcoins got doped? $ARB , $ZEC are shooting straight up, and many people are asking now: what’s the logic exactly? Can you still go short now?
The essence of this round of altcoin frenzy is the spillover effect of capital. The rhythm of a complete market cycle is basically: Bitcoin $BTC and mainstream coins like Ethereum rise first, and after the momentum of the mainstream rally fades, hot money in the market flows into lower-valued altcoins, kicking off an altcoin frenzy cycle. But be cautious: a full-blown breakout in altcoins often also means this rally has already entered the mid-to-late stage.
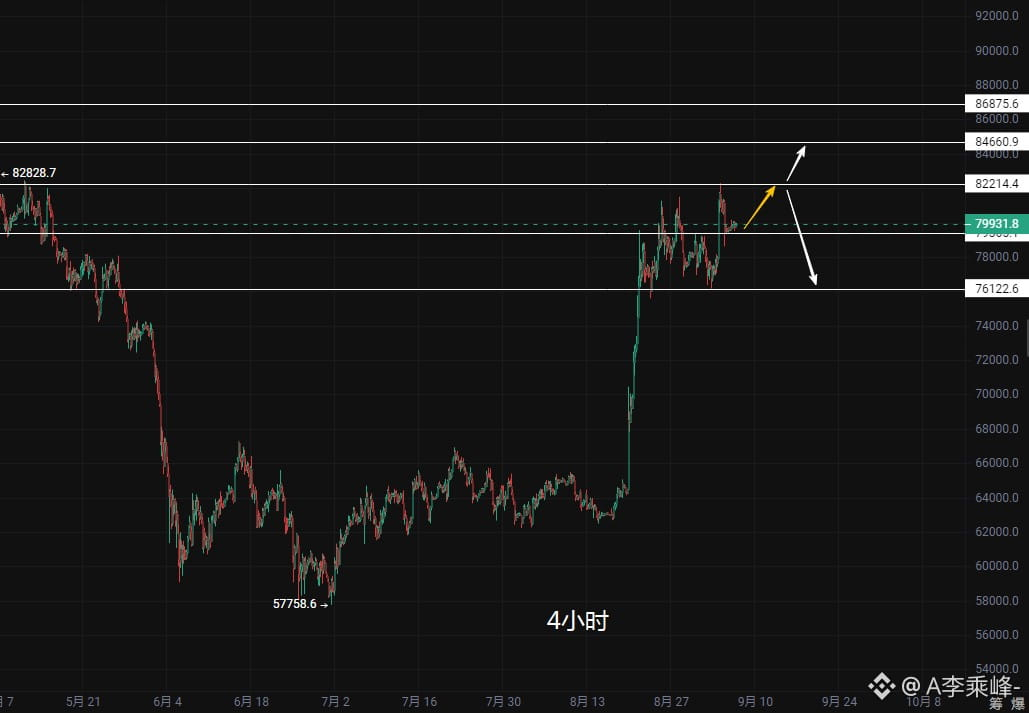
When altcoins collectively suck up liquidity, they divert funds from mainstream coins, and afterward it is very easy for the overall market to trigger a pullback and enter a phase of consolidation. Focus on the September 15 Clarity Act vote. I judge that the market is highly likely to reach a turning point shortly before the decision is finalized. Be sure to take profits at higher levels; I plan to look for an opportunity to open short positions around the 15th.
Of course, there is still one week left until the decision, and Bitcoin still has the possibility of challenging the 830 resistance level. If it breaks through successfully, the market could move up another level, such as 846 or 868. Long-term contracts can be taken off the table for safety, while I will continue holding spot positions and wait a few days to observe whether the breakout succeeds. If the breakout fails, I will take profits in batches as the 15th approaches, and then wait for a pullback before entering again.
For those who have not entered yet, do not blindly chase the high. You can patiently wait until late September. After major positive news is fully priced in, the market usually has a pullback window of about two weeks. That is the better time to get in from a value standpoint, so don’t miss the opportunity again. #ZEC市值超越DOGE
Altcoins got doped? $ARB , $ZEC are shooting straight up, and many people are asking now: what’s the logic exactly? Can you still go short now?
The essence of this round of altcoin frenzy is the spillover effect of capital. The rhythm of a complete market cycle is basically: Bitcoin $BTC and mainstream coins like Ethereum rise first, and after the momentum of the mainstream rally fades, hot money in the market flows into lower-valued altcoins, kicking off an altcoin frenzy cycle. But be cautious: a full-blown breakout in altcoins often also means this rally has already entered the mid-to-late stage.
When altcoins collectively suck up liquidity, they divert funds from mainstream coins, and afterward it is very easy for the overall market to trigger a pullback and enter a phase of consolidation. Focus on the September 15 Clarity Act vote. I judge that the market is highly likely to reach a turning point shortly before the decision is finalized. Be sure to take profits at higher levels; I plan to look for an opportunity to open short positions around the 15th.
Of course, there is still one week left until the decision, and Bitcoin still has the possibility of challenging the 830 resistance level. If it breaks through successfully, the market could move up another level, such as 846 or 868. Long-term contracts can be taken off the table for safety, while I will continue holding spot positions and wait a few days to observe whether the breakout succeeds. If the breakout fails, I will take profits in batches as the 15th approaches, and then wait for a pullback before entering again.
For those who have not entered yet, do not blindly chase the high. You can patiently wait until late September. After major positive news is fully priced in, the market usually has a pullback window of about two weeks. That is the better time to get in from a value standpoint, so don’t miss the opportunity again. #ZEC市值超越DOGE
The essence of this round of altcoin frenzy is the spillover effect of capital. The rhythm of a complete market cycle is basically: Bitcoin $BTC and mainstream coins like Ethereum rise first, and after the momentum of the mainstream rally fades, hot money in the market flows into lower-valued altcoins, kicking off an altcoin frenzy cycle. But be cautious: a full-blown breakout in altcoins often also means this rally has already entered the mid-to-late stage.
When altcoins collectively suck up liquidity, they divert funds from mainstream coins, and afterward it is very easy for the overall market to trigger a pullback and enter a phase of consolidation. Focus on the September 15 Clarity Act vote. I judge that the market is highly likely to reach a turning point shortly before the decision is finalized. Be sure to take profits at higher levels; I plan to look for an opportunity to open short positions around the 15th.
Of course, there is still one week left until the decision, and Bitcoin still has the possibility of challenging the 830 resistance level. If it breaks through successfully, the market could move up another level, such as 846 or 868. Long-term contracts can be taken off the table for safety, while I will continue holding spot positions and wait a few days to observe whether the breakout succeeds. If the breakout fails, I will take profits in batches as the 15th approaches, and then wait for a pullback before entering again.
For those who have not entered yet, do not blindly chase the high. You can patiently wait until late September. After major positive news is fully priced in, the market usually has a pullback window of about two weeks. That is the better time to get in from a value standpoint, so don’t miss the opportunity again. #ZEC市值超越DOGE
2
582
·
--
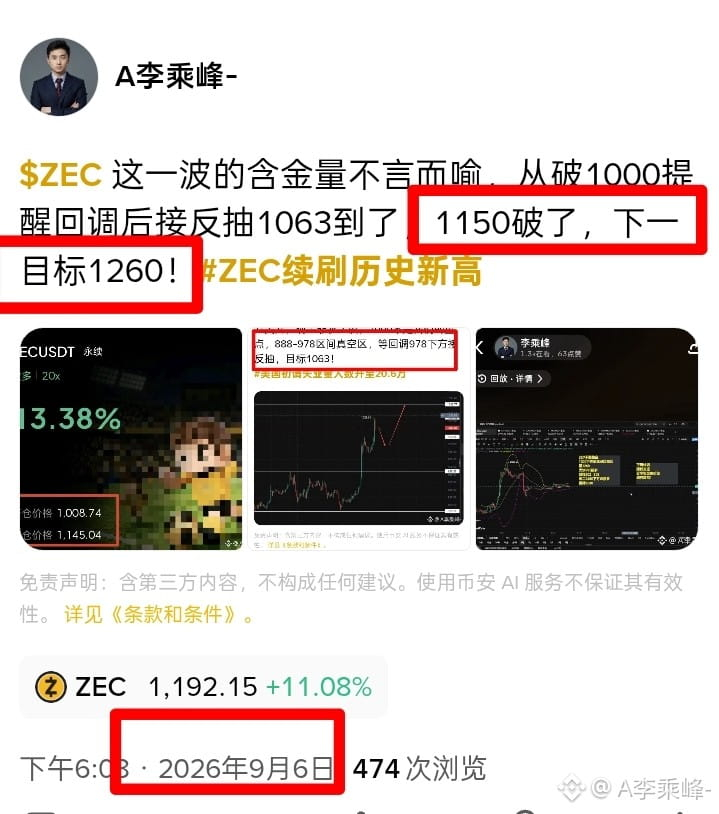
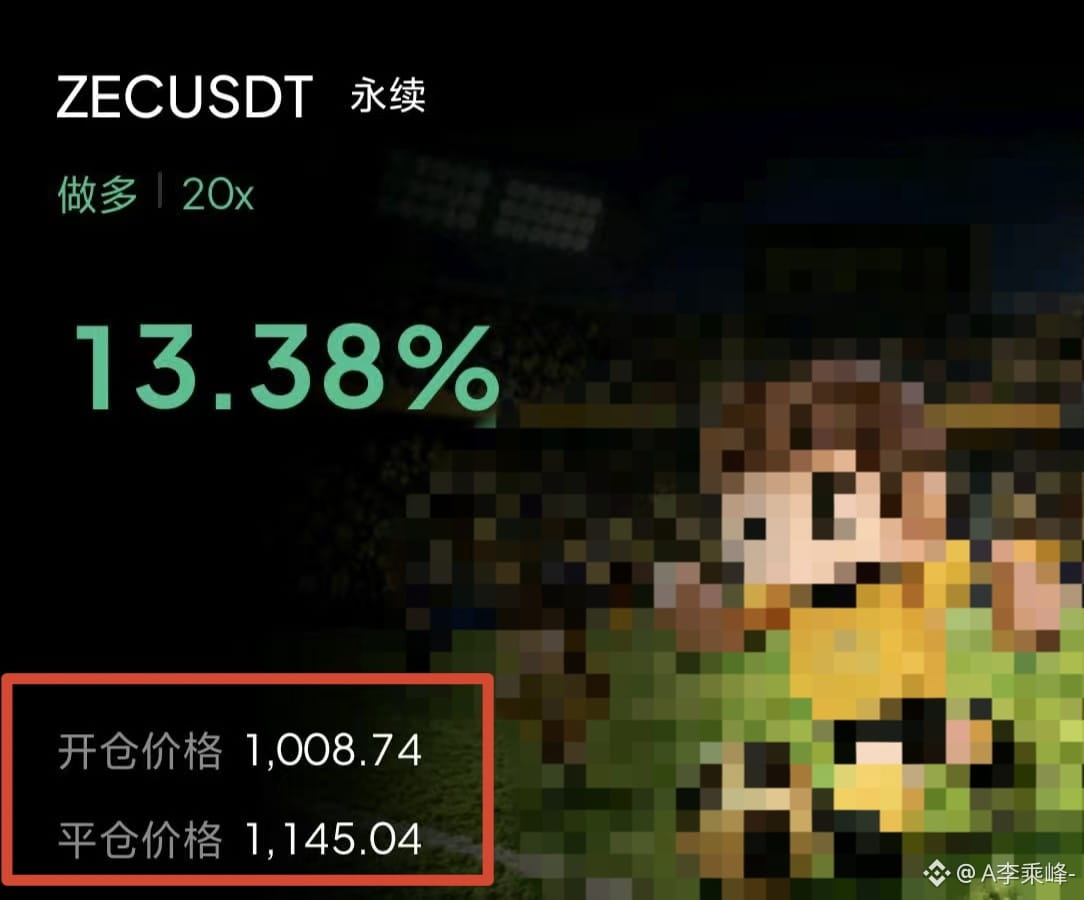
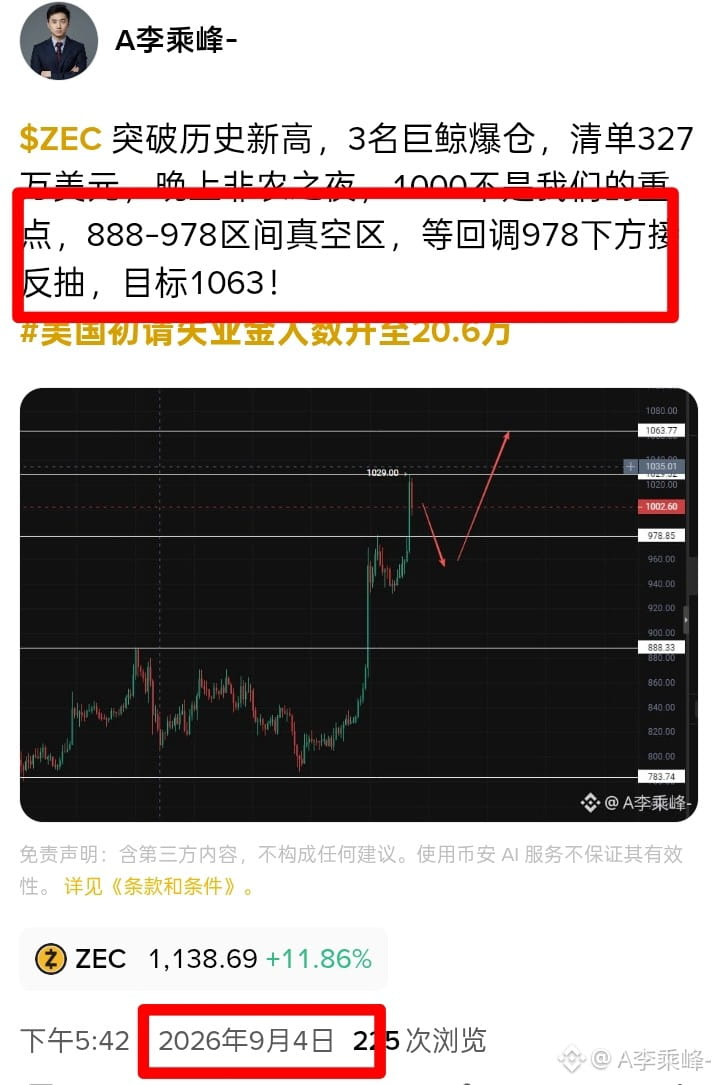
$ZEC The value of this wave is self-evident. After the pullback warning after breaking 1000, it rebounded to 1063, then 1150 was broken. The next target is 1260! #ZEC续刷历史新高
$ZEC The value of this wave is self-evident. After the pullback warning after breaking 1000, it rebounded to 1063, then 1150 was broken. The next target is 1260! #ZEC续刷历史新高
1
474
·
--
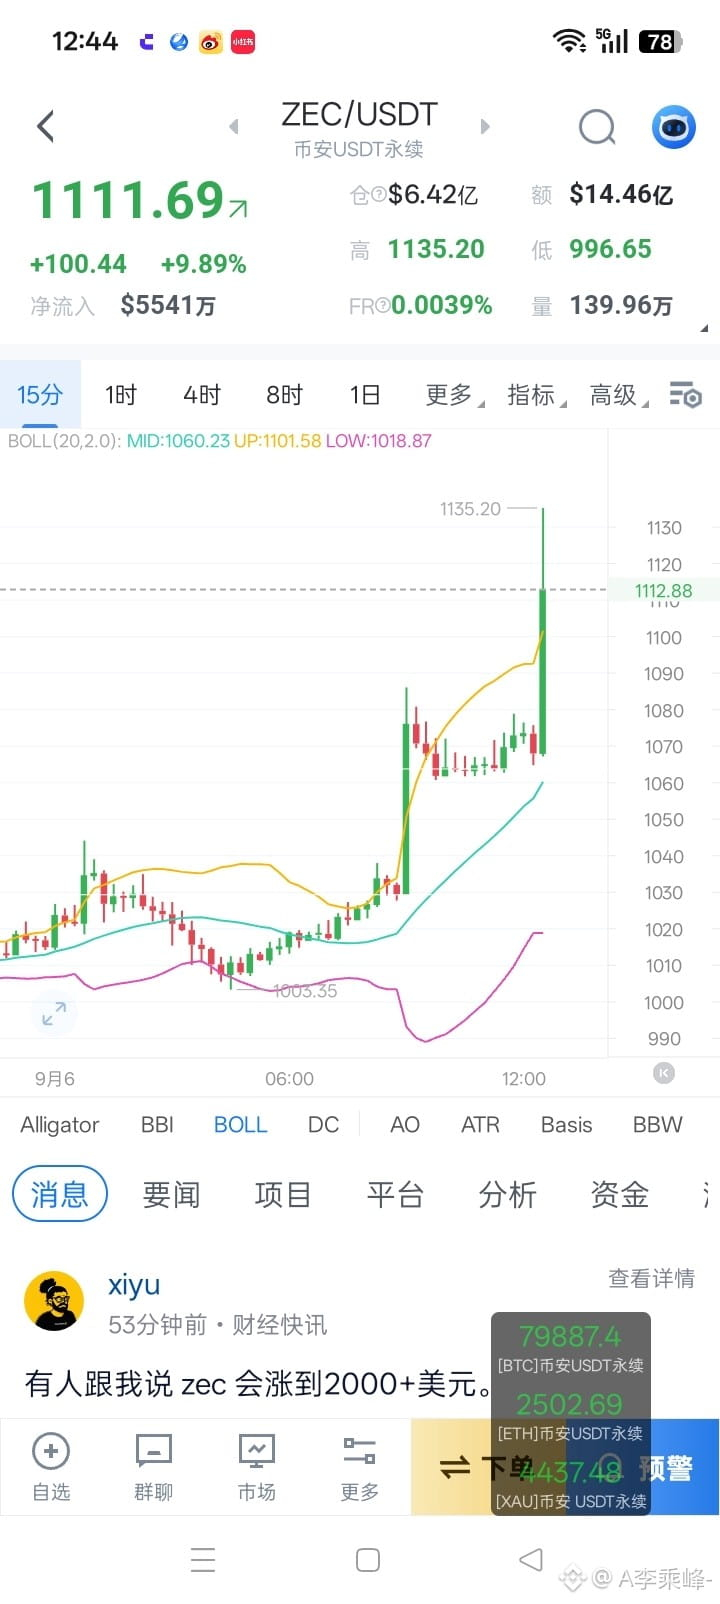
$ZEC Pulling onions from dry land, it was emphasized as early as Friday that the non-farm rebound was coming. If you didn’t get on board, hurry up. Looks like my perspective was still too narrow, 1063 wasn’t enough, and after another new high, above 1100 is the real destination! #ZEC续刷历史新高
$ZEC Pulling onions from dry land, it was emphasized as early as Friday that the non-farm rebound was coming. If you didn’t get on board, hurry up. Looks like my perspective was still too narrow, 1063 wasn’t enough, and after another new high, above 1100 is the real destination! #ZEC续刷历史新高
613
·
--
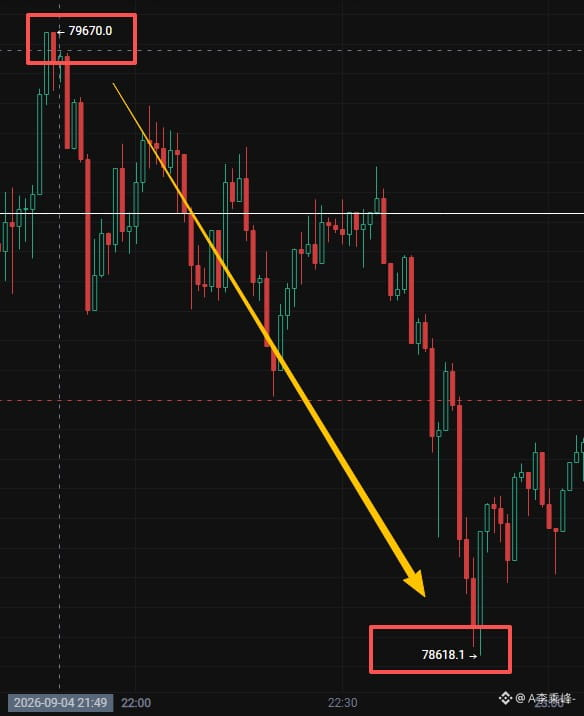
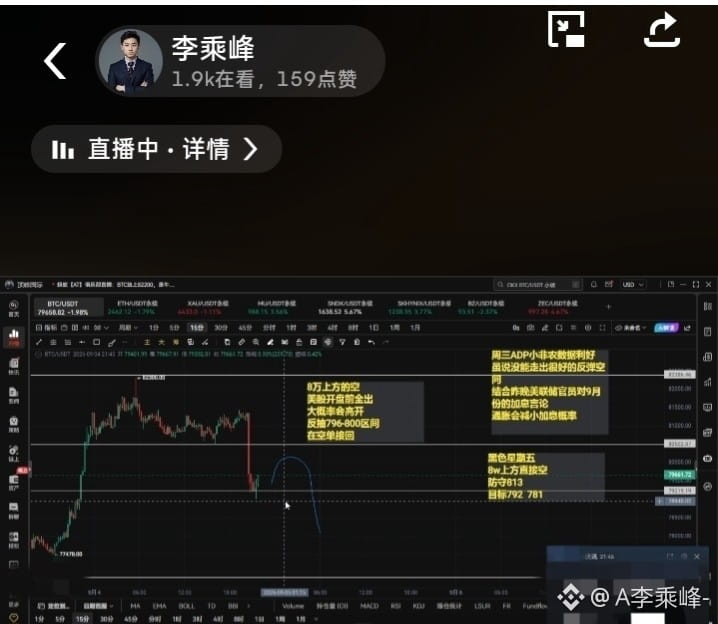
What is called textbook-style positioning? Watch the livestream, brothers. Isn’t this wave of positioning awesome? Short at the non-farm high, let all exits happen at the 792 support, then wait for U.S. stocks to rebound above 796 before taking the short back. Isn’t the market moving according to my expectations? Those without a ticket should hurry up! Open on weekends, and as long as the market is here, I’m here! $BTC #美国初请失业金人数升至20.6万
What is called textbook-style positioning? Watch the livestream, brothers. Isn’t this wave of positioning awesome? Short at the non-farm high, let all exits happen at the 792 support, then wait for U.S. stocks to rebound above 796 before taking the short back. Isn’t the market moving according to my expectations? Those without a ticket should hurry up! Open on weekends, and as long as the market is here, I’m here! $BTC #美国初请失业金人数升至20.6万
183
·
--
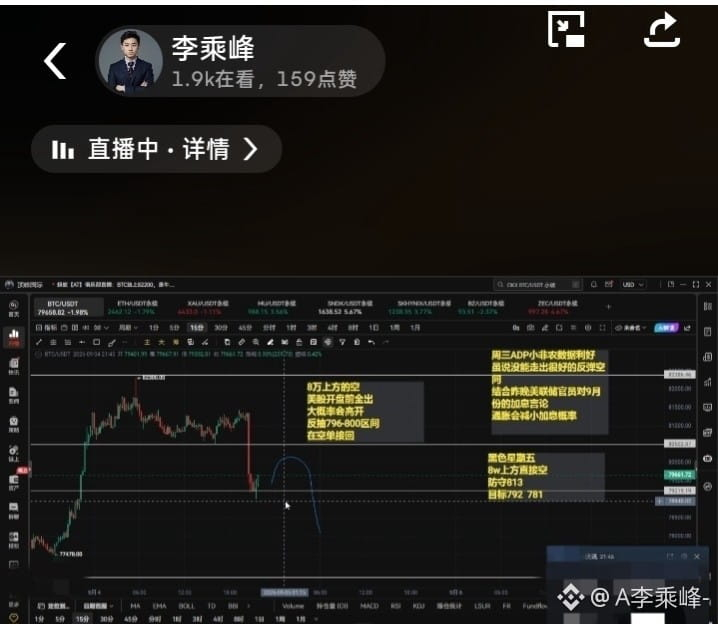
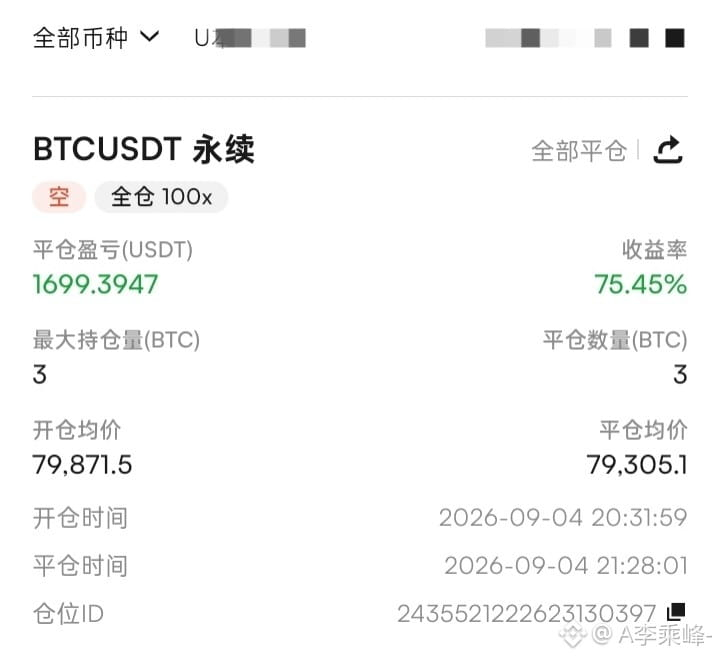
The non-farm payroll release caused a crash so quickly. I chased a short during the livestream, but the entry was not great. I took a small bite. Before the U.S. stock market opened, I analyzed the subsequent market trend. I didn’t expect the divergence, and the rebound height was within expectations. The support at 792 is very strong, but the non-farm data far exceeding expectations will only increase market sentiment panic as well as the probability of an interest rate hike. Lightly shorting at the rebound high seems like a better choice to me!$BTC #美国初请失业金人数升至20.6万
The non-farm payroll release caused a crash so quickly. I chased a short during the livestream, but the entry was not great. I took a small bite. Before the U.S. stock market opened, I analyzed the subsequent market trend. I didn’t expect the divergence, and the rebound height was within expectations. The support at 792 is very strong, but the non-farm data far exceeding expectations will only increase market sentiment panic as well as the probability of an interest rate hike. Lightly shorting at the rebound high seems like a better choice to me!$BTC #美国初请失业金人数升至20.6万
226
·
--
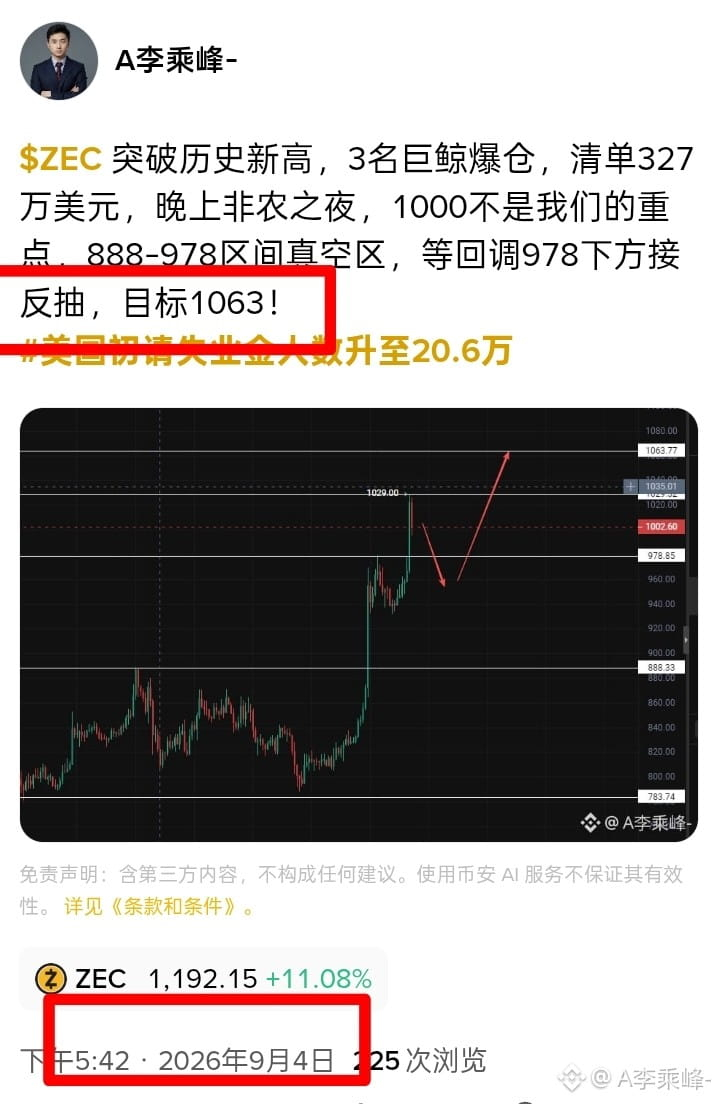
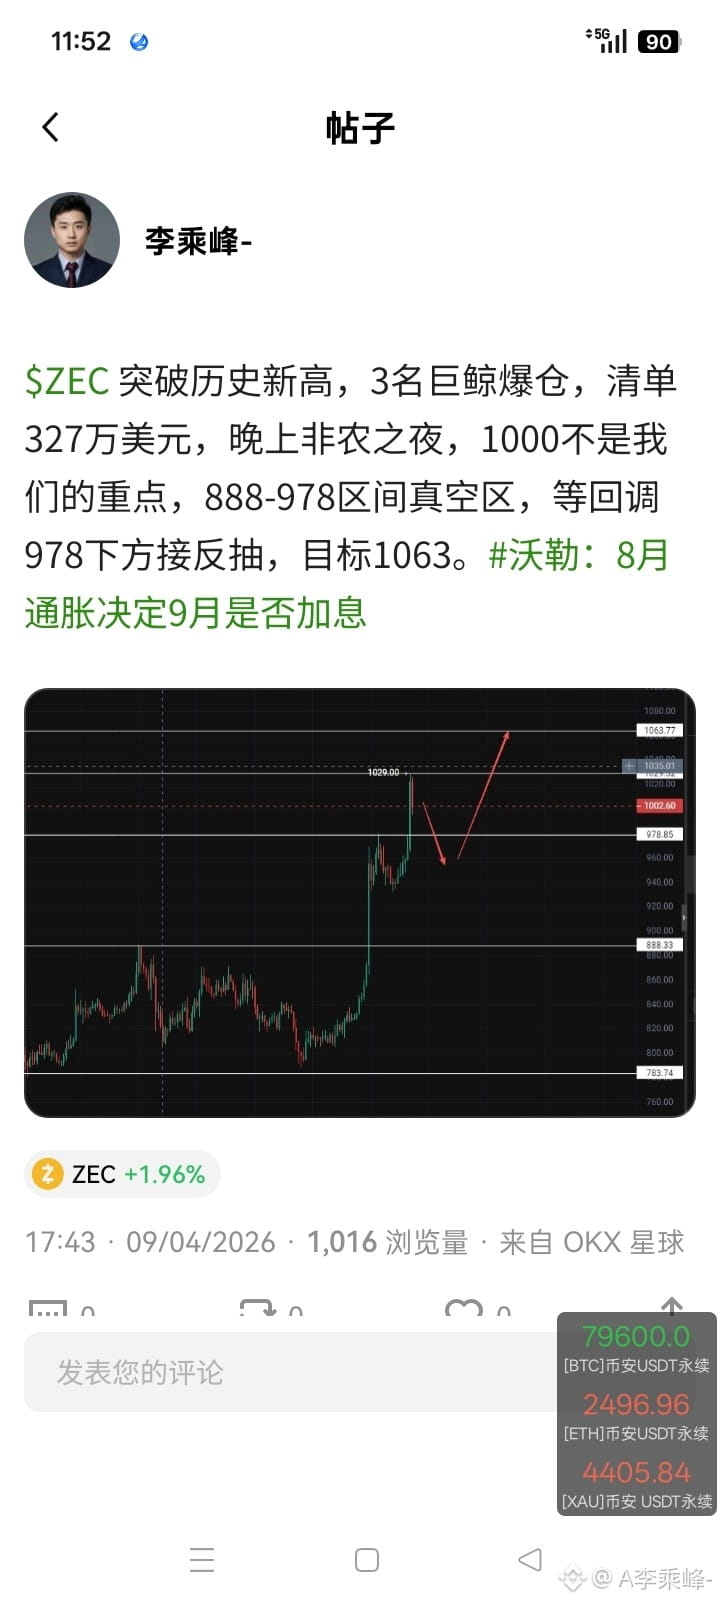
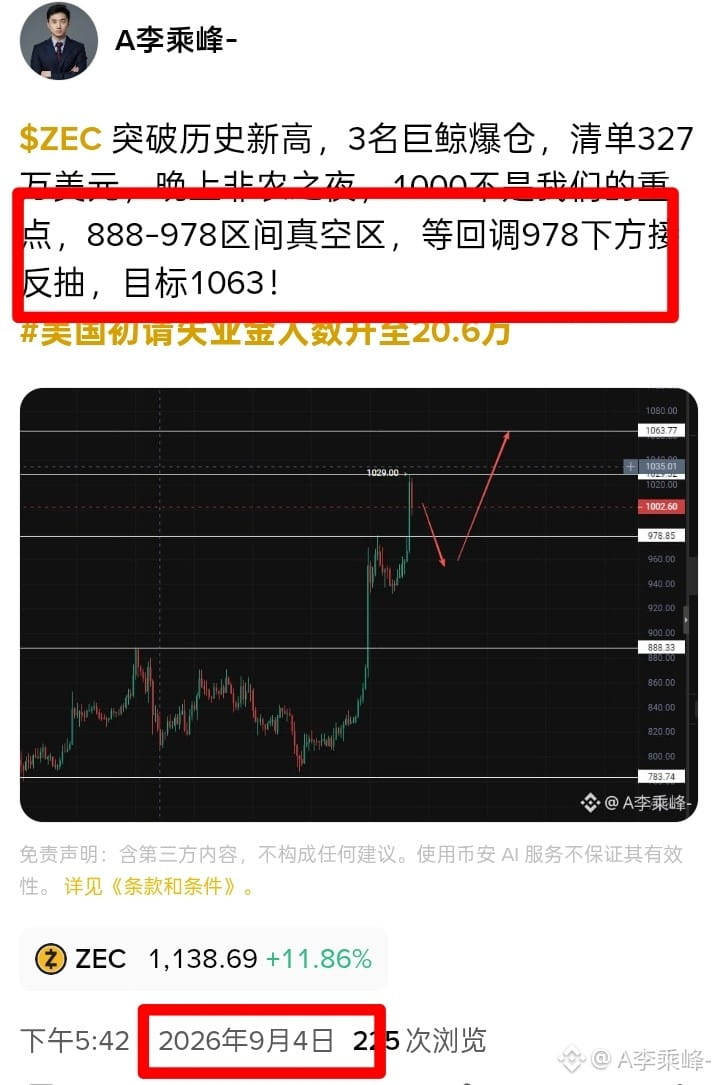
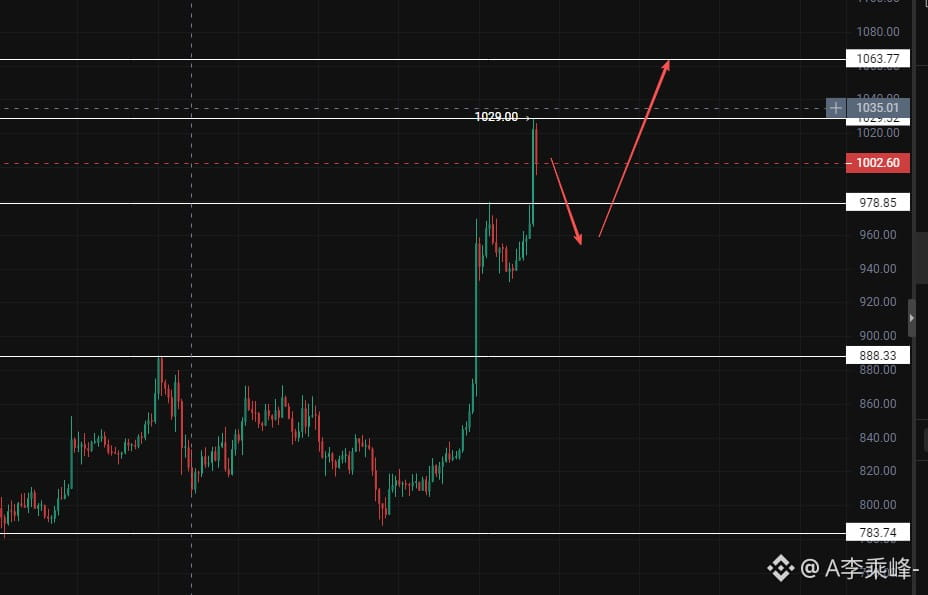
$ZEC breaks historical high, 3 whale liquidations, a list totaling $3.27 million. It's Non-Farm Payrolls night. 1000 isn't our focus. The 888-978 range is a void zone—wait for the pullback below 978 and then catch the rebound upward. Target 1063! #美国初请失业金人数升至20.6万
$ZEC breaks historical high, 3 whale liquidations, a list totaling $3.27 million. It's Non-Farm Payrolls night. 1000 isn't our focus. The 888-978 range is a void zone—wait for the pullback below 978 and then catch the rebound upward. Target 1063! #美国初请失业金人数升至20.6万
237
·
--
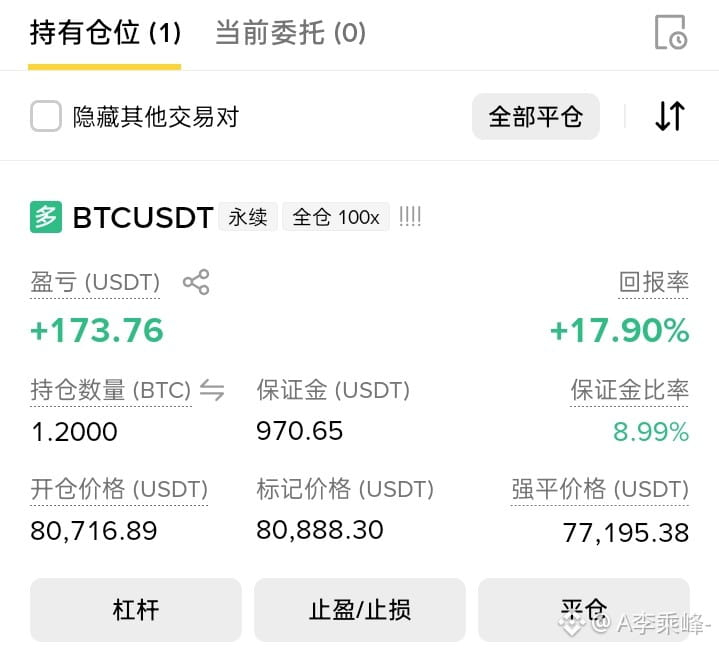
Bitcoin broke through the previous high in the early hours of the morning, and the pullback was limited. The market is still very much eyeing tonight's non-farm payroll data. Intraday trading is still likely to remain range-bound, and the hourly middle band has been hard to break through. For the short term, go ahead and take a small long position!$BTC #美国初请失业金人数升至20.6万
Bitcoin broke through the previous high in the early hours of the morning, and the pullback was limited. The market is still very much eyeing tonight's non-farm payroll data. Intraday trading is still likely to remain range-bound, and the hourly middle band has been hard to break through. For the short term, go ahead and take a small long position!$BTC #美国初请失业金人数升至20.6万
97
·
--
The wind rises from the tips of green duckweed; the waves form between small ripples. Hey, good brothers—last night, was it a laugh-and-go-up-to-the-second-floor kind of win, or two packs of cigarettes keeping you up all night!
Good to see it—I'm also one of the victims. I cut my losses in time and didn’t let the floating losses worsen!
Last night, Fed officials released slightly dovish remarks, and the market’s concern about a September rate hike quickly cooled. The US dollar and US Treasury yields fell back, and risk assets rallied across the board. Big Coin surged by 5% and reclaimed the 810 level. In the short term, a large-scale liquidation of shorts triggered yet more momentum for the uptrend.
This evening, the heavyweight Non-Farm Employment data is set to take the stage—this is the key directional signal that will determine whether this leg of the rebound can continue. Market sentiment rapidly shifted toward greed, and ETF funds flowed back in. But be careful: after a big rally in the short term, data often triggers a reversal “good news is taken as profit and the rally peaks then falls.”
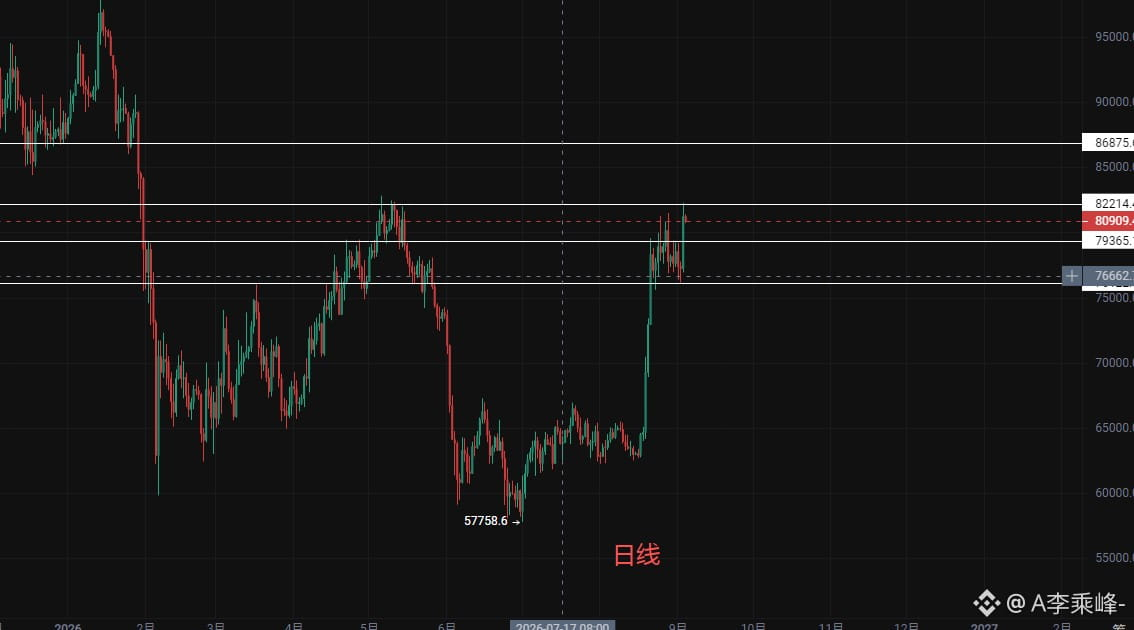
Looking at the technicals: at the daily level, it has decisively broken through the prior consolidation range. The medium- and long-term moving averages are all trending upward again, reopening the bull trend. However, the RSI indicator has already entered the overbought zone, so in the short term there may be a pullback and need for correction. Don’t chase prices blindly.
In summary, for intraday short-term trading, the suggestion is to go long on a pullback in the 797–802 range, with a target of 822. If it breaks through, watch 831; and if it holds steady again, it’s that line—above 868 again!
$BTC #美国初请失业金人数升至20.6万
The wind rises from the tips of green duckweed; the waves form between small ripples. Hey, good brothers—last night, was it a laugh-and-go-up-to-the-second-floor kind of win, or two packs of cigarettes keeping you up all night!
Good to see it—I'm also one of the victims. I cut my losses in time and didn’t let the floating losses worsen!
Last night, Fed officials released slightly dovish remarks, and the market’s concern about a September rate hike quickly cooled. The US dollar and US Treasury yields fell back, and risk assets rallied across the board. Big Coin surged by 5% and reclaimed the 810 level. In the short term, a large-scale liquidation of shorts triggered yet more momentum for the uptrend.
This evening, the heavyweight Non-Farm Employment data is set to take the stage—this is the key directional signal that will determine whether this leg of the rebound can continue. Market sentiment rapidly shifted toward greed, and ETF funds flowed back in. But be careful: after a big rally in the short term, data often triggers a reversal “good news is taken as profit and the rally peaks then falls.”
Looking at the technicals: at the daily level, it has decisively broken through the prior consolidation range. The medium- and long-term moving averages are all trending upward again, reopening the bull trend. However, the RSI indicator has already entered the overbought zone, so in the short term there may be a pullback and need for correction. Don’t chase prices blindly.
In summary, for intraday short-term trading, the suggestion is to go long on a pullback in the 797–802 range, with a target of 822. If it breaks through, watch 831; and if it holds steady again, it’s that line—above 868 again!
$BTC #美国初请失业金人数升至20.6万
Good to see it—I'm also one of the victims. I cut my losses in time and didn’t let the floating losses worsen!
Last night, Fed officials released slightly dovish remarks, and the market’s concern about a September rate hike quickly cooled. The US dollar and US Treasury yields fell back, and risk assets rallied across the board. Big Coin surged by 5% and reclaimed the 810 level. In the short term, a large-scale liquidation of shorts triggered yet more momentum for the uptrend.
This evening, the heavyweight Non-Farm Employment data is set to take the stage—this is the key directional signal that will determine whether this leg of the rebound can continue. Market sentiment rapidly shifted toward greed, and ETF funds flowed back in. But be careful: after a big rally in the short term, data often triggers a reversal “good news is taken as profit and the rally peaks then falls.”
Looking at the technicals: at the daily level, it has decisively broken through the prior consolidation range. The medium- and long-term moving averages are all trending upward again, reopening the bull trend. However, the RSI indicator has already entered the overbought zone, so in the short term there may be a pullback and need for correction. Don’t chase prices blindly.
In summary, for intraday short-term trading, the suggestion is to go long on a pullback in the 797–802 range, with a target of 822. If it breaks through, watch 831; and if it holds steady again, it’s that line—above 868 again!
$BTC #美国初请失业金人数升至20.6万
120
·
--
Arrive at the end of the water, and sit to watch the clouds rise.
Good morning on Thursday of the third week of September. Yesterday, the small ADP non-farm payroll data came out on Wednesday; the seemingly positive news on the surface didn’t break out of the rebound space I expected. So where does the key lie? It’s Friday’s non-farm payrolls!
This is an important reference for whether September will raise rates. The spot Bitcoin ETF has shifted from the earlier continuous net inflows to a slight net outflow, and institutional capital is beginning to be cautious.
Overall leverage in the futures market has already clearly fallen, open positions are at a relatively low level, there’s no condition for extreme overheating, and the market lacks the scenario for a large one-way liquidation event. We’re now in a range-bound “grinding” phase before a directional choice.
The Fed’s expectations for a rate hike in September remain high. The dollar and U.S. Treasury yields stay strong, suppressing overall sentiment toward risk assets.
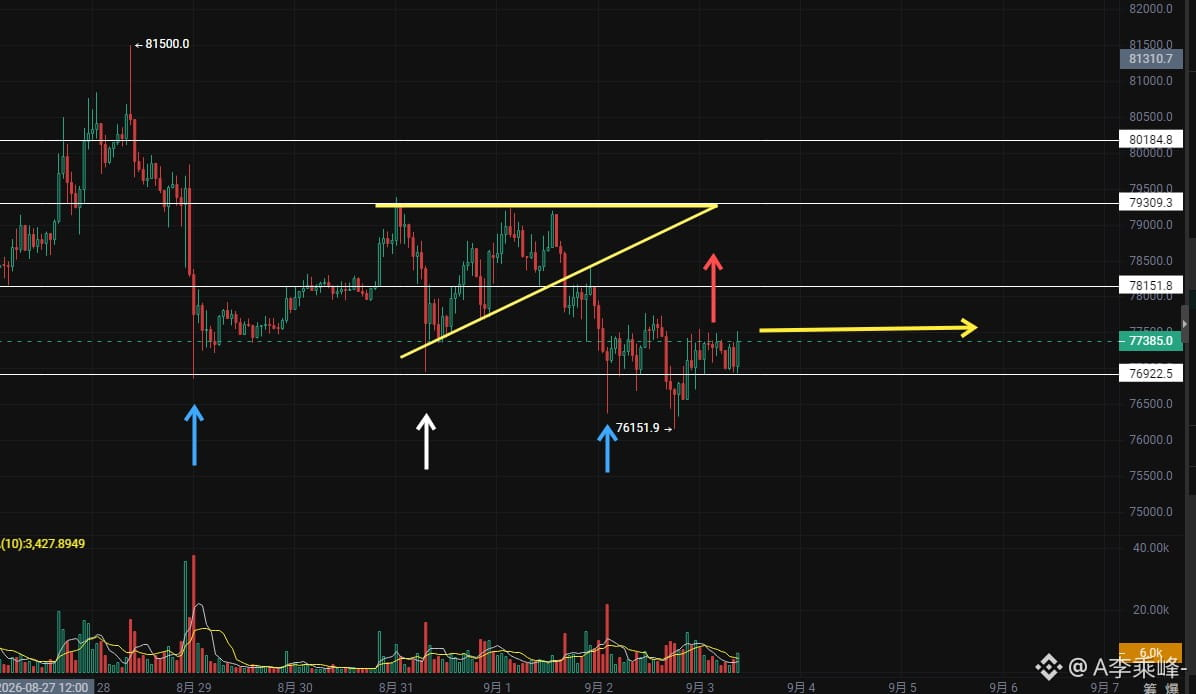
Looking at the technicals again: On the daily chart, the medium- to long-term moving averages are still pointing upward, and the larger-scale bullish trend structure hasn’t been broken. However, the MACD red histogram continues to shrink, and upward momentum for the bulls has clearly weakened. After pushing to higher levels, price falls back into a high-range consolidation. Multiple attempts to break through the strong resistance band of 800–815 failed. This area has accumulated a large amount of historical trapped positions and profit-taking sell pressure, making it difficult for the market to break through that supply wall easily in the near term.
On the four-hour chart, the Bollinger Bands are tightening, volatility is narrowing, and both sides keep sweeping stops back and forth.
In summary, before Friday’s non-farm data, keep trading within the 765–788 range for high sells and low buys. The key support at the 765 level hasn’t been effectively broken—so be cautious and let the “duo-tou” (bulls) lead! $BTC #美国8月ADP就业创1月来最小增幅
Arrive at the end of the water, and sit to watch the clouds rise.
Good morning on Thursday of the third week of September. Yesterday, the small ADP non-farm payroll data came out on Wednesday; the seemingly positive news on the surface didn’t break out of the rebound space I expected. So where does the key lie? It’s Friday’s non-farm payrolls!
This is an important reference for whether September will raise rates. The spot Bitcoin ETF has shifted from the earlier continuous net inflows to a slight net outflow, and institutional capital is beginning to be cautious.
Overall leverage in the futures market has already clearly fallen, open positions are at a relatively low level, there’s no condition for extreme overheating, and the market lacks the scenario for a large one-way liquidation event. We’re now in a range-bound “grinding” phase before a directional choice.
The Fed’s expectations for a rate hike in September remain high. The dollar and U.S. Treasury yields stay strong, suppressing overall sentiment toward risk assets.
Looking at the technicals again: On the daily chart, the medium- to long-term moving averages are still pointing upward, and the larger-scale bullish trend structure hasn’t been broken. However, the MACD red histogram continues to shrink, and upward momentum for the bulls has clearly weakened. After pushing to higher levels, price falls back into a high-range consolidation. Multiple attempts to break through the strong resistance band of 800–815 failed. This area has accumulated a large amount of historical trapped positions and profit-taking sell pressure, making it difficult for the market to break through that supply wall easily in the near term.
On the four-hour chart, the Bollinger Bands are tightening, volatility is narrowing, and both sides keep sweeping stops back and forth.
In summary, before Friday’s non-farm data, keep trading within the 765–788 range for high sells and low buys. The key support at the 765 level hasn’t been effectively broken—so be cautious and let the “duo-tou” (bulls) lead! $BTC #美国8月ADP就业创1月来最小增幅
Good morning on Thursday of the third week of September. Yesterday, the small ADP non-farm payroll data came out on Wednesday; the seemingly positive news on the surface didn’t break out of the rebound space I expected. So where does the key lie? It’s Friday’s non-farm payrolls!
This is an important reference for whether September will raise rates. The spot Bitcoin ETF has shifted from the earlier continuous net inflows to a slight net outflow, and institutional capital is beginning to be cautious.
Overall leverage in the futures market has already clearly fallen, open positions are at a relatively low level, there’s no condition for extreme overheating, and the market lacks the scenario for a large one-way liquidation event. We’re now in a range-bound “grinding” phase before a directional choice.
The Fed’s expectations for a rate hike in September remain high. The dollar and U.S. Treasury yields stay strong, suppressing overall sentiment toward risk assets.
Looking at the technicals again: On the daily chart, the medium- to long-term moving averages are still pointing upward, and the larger-scale bullish trend structure hasn’t been broken. However, the MACD red histogram continues to shrink, and upward momentum for the bulls has clearly weakened. After pushing to higher levels, price falls back into a high-range consolidation. Multiple attempts to break through the strong resistance band of 800–815 failed. This area has accumulated a large amount of historical trapped positions and profit-taking sell pressure, making it difficult for the market to break through that supply wall easily in the near term.
On the four-hour chart, the Bollinger Bands are tightening, volatility is narrowing, and both sides keep sweeping stops back and forth.
In summary, before Friday’s non-farm data, keep trading within the 765–788 range for high sells and low buys. The key support at the 765 level hasn’t been effectively broken—so be cautious and let the “duo-tou” (bulls) lead! $BTC #美国8月ADP就业创1月来最小增幅
161
·
--
On Tuesday, September 1st, the summer sentiment has not yet fully faded, and in the blink of an eye, it is already autumn! The season of harvest has arrived—and crypto should be the same!
Throughout August, Bitcoin surged in a strong uptrend, with the monthly gain approaching 25%. The main driver was the sustained inflow of funds into the U.S. spot ETFs, which boosted spot buying and pushed this rally forward. However, at the Jackson Hole meeting, the Fed Chair delivered hawkish remarks, and the market raised expectations for September rate hikes—becoming an important overhead pressure.
This week, the market focus shifts to the U.S. Non-Farm Employment data. The figures will directly change expectations for Federal Reserve interest rates, bringing significant volatility to the crypto market.
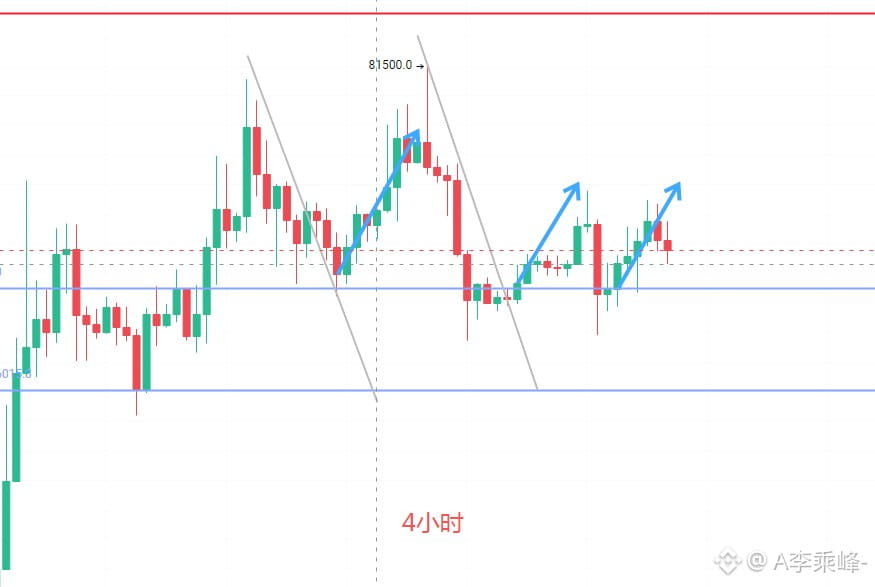
Technically, after the price pushed up and met resistance above 810, it fell back. The coin has been trading at high levels within the 775–793 range. Bulls and bears have entered a phase of competition. The daily chart uptrend has not changed. Considering that the key messages this week have not yet fully played out, there is unlikely to be a one-direction move in the short term.
In summary, for intraday short-term trading, the suggestion is to sell near the top of the amplitude range and buy near the bottom—just that! $BTC #比特币8月上涨23%跑赢黄金股市
On Tuesday, September 1st, the summer sentiment has not yet fully faded, and in the blink of an eye, it is already autumn! The season of harvest has arrived—and crypto should be the same!
Throughout August, Bitcoin surged in a strong uptrend, with the monthly gain approaching 25%. The main driver was the sustained inflow of funds into the U.S. spot ETFs, which boosted spot buying and pushed this rally forward. However, at the Jackson Hole meeting, the Fed Chair delivered hawkish remarks, and the market raised expectations for September rate hikes—becoming an important overhead pressure.
This week, the market focus shifts to the U.S. Non-Farm Employment data. The figures will directly change expectations for Federal Reserve interest rates, bringing significant volatility to the crypto market.
Technically, after the price pushed up and met resistance above 810, it fell back. The coin has been trading at high levels within the 775–793 range. Bulls and bears have entered a phase of competition. The daily chart uptrend has not changed. Considering that the key messages this week have not yet fully played out, there is unlikely to be a one-direction move in the short term.
In summary, for intraday short-term trading, the suggestion is to sell near the top of the amplitude range and buy near the bottom—just that! $BTC #比特币8月上涨23%跑赢黄金股市
Throughout August, Bitcoin surged in a strong uptrend, with the monthly gain approaching 25%. The main driver was the sustained inflow of funds into the U.S. spot ETFs, which boosted spot buying and pushed this rally forward. However, at the Jackson Hole meeting, the Fed Chair delivered hawkish remarks, and the market raised expectations for September rate hikes—becoming an important overhead pressure.
This week, the market focus shifts to the U.S. Non-Farm Employment data. The figures will directly change expectations for Federal Reserve interest rates, bringing significant volatility to the crypto market.
Technically, after the price pushed up and met resistance above 810, it fell back. The coin has been trading at high levels within the 775–793 range. Bulls and bears have entered a phase of competition. The daily chart uptrend has not changed. Considering that the key messages this week have not yet fully played out, there is unlikely to be a one-direction move in the short term.
In summary, for intraday short-term trading, the suggestion is to sell near the top of the amplitude range and buy near the bottom—just that! $BTC #比特币8月上涨23%跑赢黄金股市
2.5k
Log in to explore more content
Join global crypto users on Binance Square
⚡️ Get latest and useful information about crypto.
💬 Trusted by the world’s largest crypto exchange.
👍 Discover real insights from verified creators.
Email / Phone number
Trending Topics
CPIWatch
87.2M views
503,606 Discussing
Share & Win Traffic Reward in our Trending Hashtag Campaign
✨Topic: Will CPI Trigger Rate Hike?
👉How to Join:
Publish a short post or article with hashtag #CPIWatch
Create content based on the below two angles:
- Nonfarm payrolls beat expectations and CPI is around the corner, do you think the Fed will hike or hold the rate?
- Bullish or bearish? Share your take and showcase your stocks or gold trade/holdings with our trade sharing widget.
🚀Campaign Period:
- 2026-09-11 3:00 - 2026-09-12 9:00 UTC
🎁Reward:
- Qualified posts that comply with the above guidelines and contain more than 100 words will be reviewed and may receive a random traffic boost of 500 to 3,000 views. You will receive a notification from your feed secretary if your post is selected.
- Get a chance to have your article featured on Binance Square Official
Need ideas for your post? Visit the topic page #CPIWatch or the Square Guide on How to Post for Better Reach.
Binance Square Official
·592 Likes
·1.6M views
EtherRalliesAsBearishBetsLiquidate
7,940 views
246 Discussing
EthereumHits$2600FirstTimeInSevenMonths
1,481 views
30 Discussing