
币圈-邵艾伦
85.1k Posts

币圈-邵艾伦
Report
Block User
币圈实时流动性追踪者,所有内容仅供参考,投资有风险!关注我的人都能暴富!做一个理性沉着的交易者!
202 Following
1.7K+ Followers
6.9K+ Liked
Posts
All
Quotes
Videos
·
--
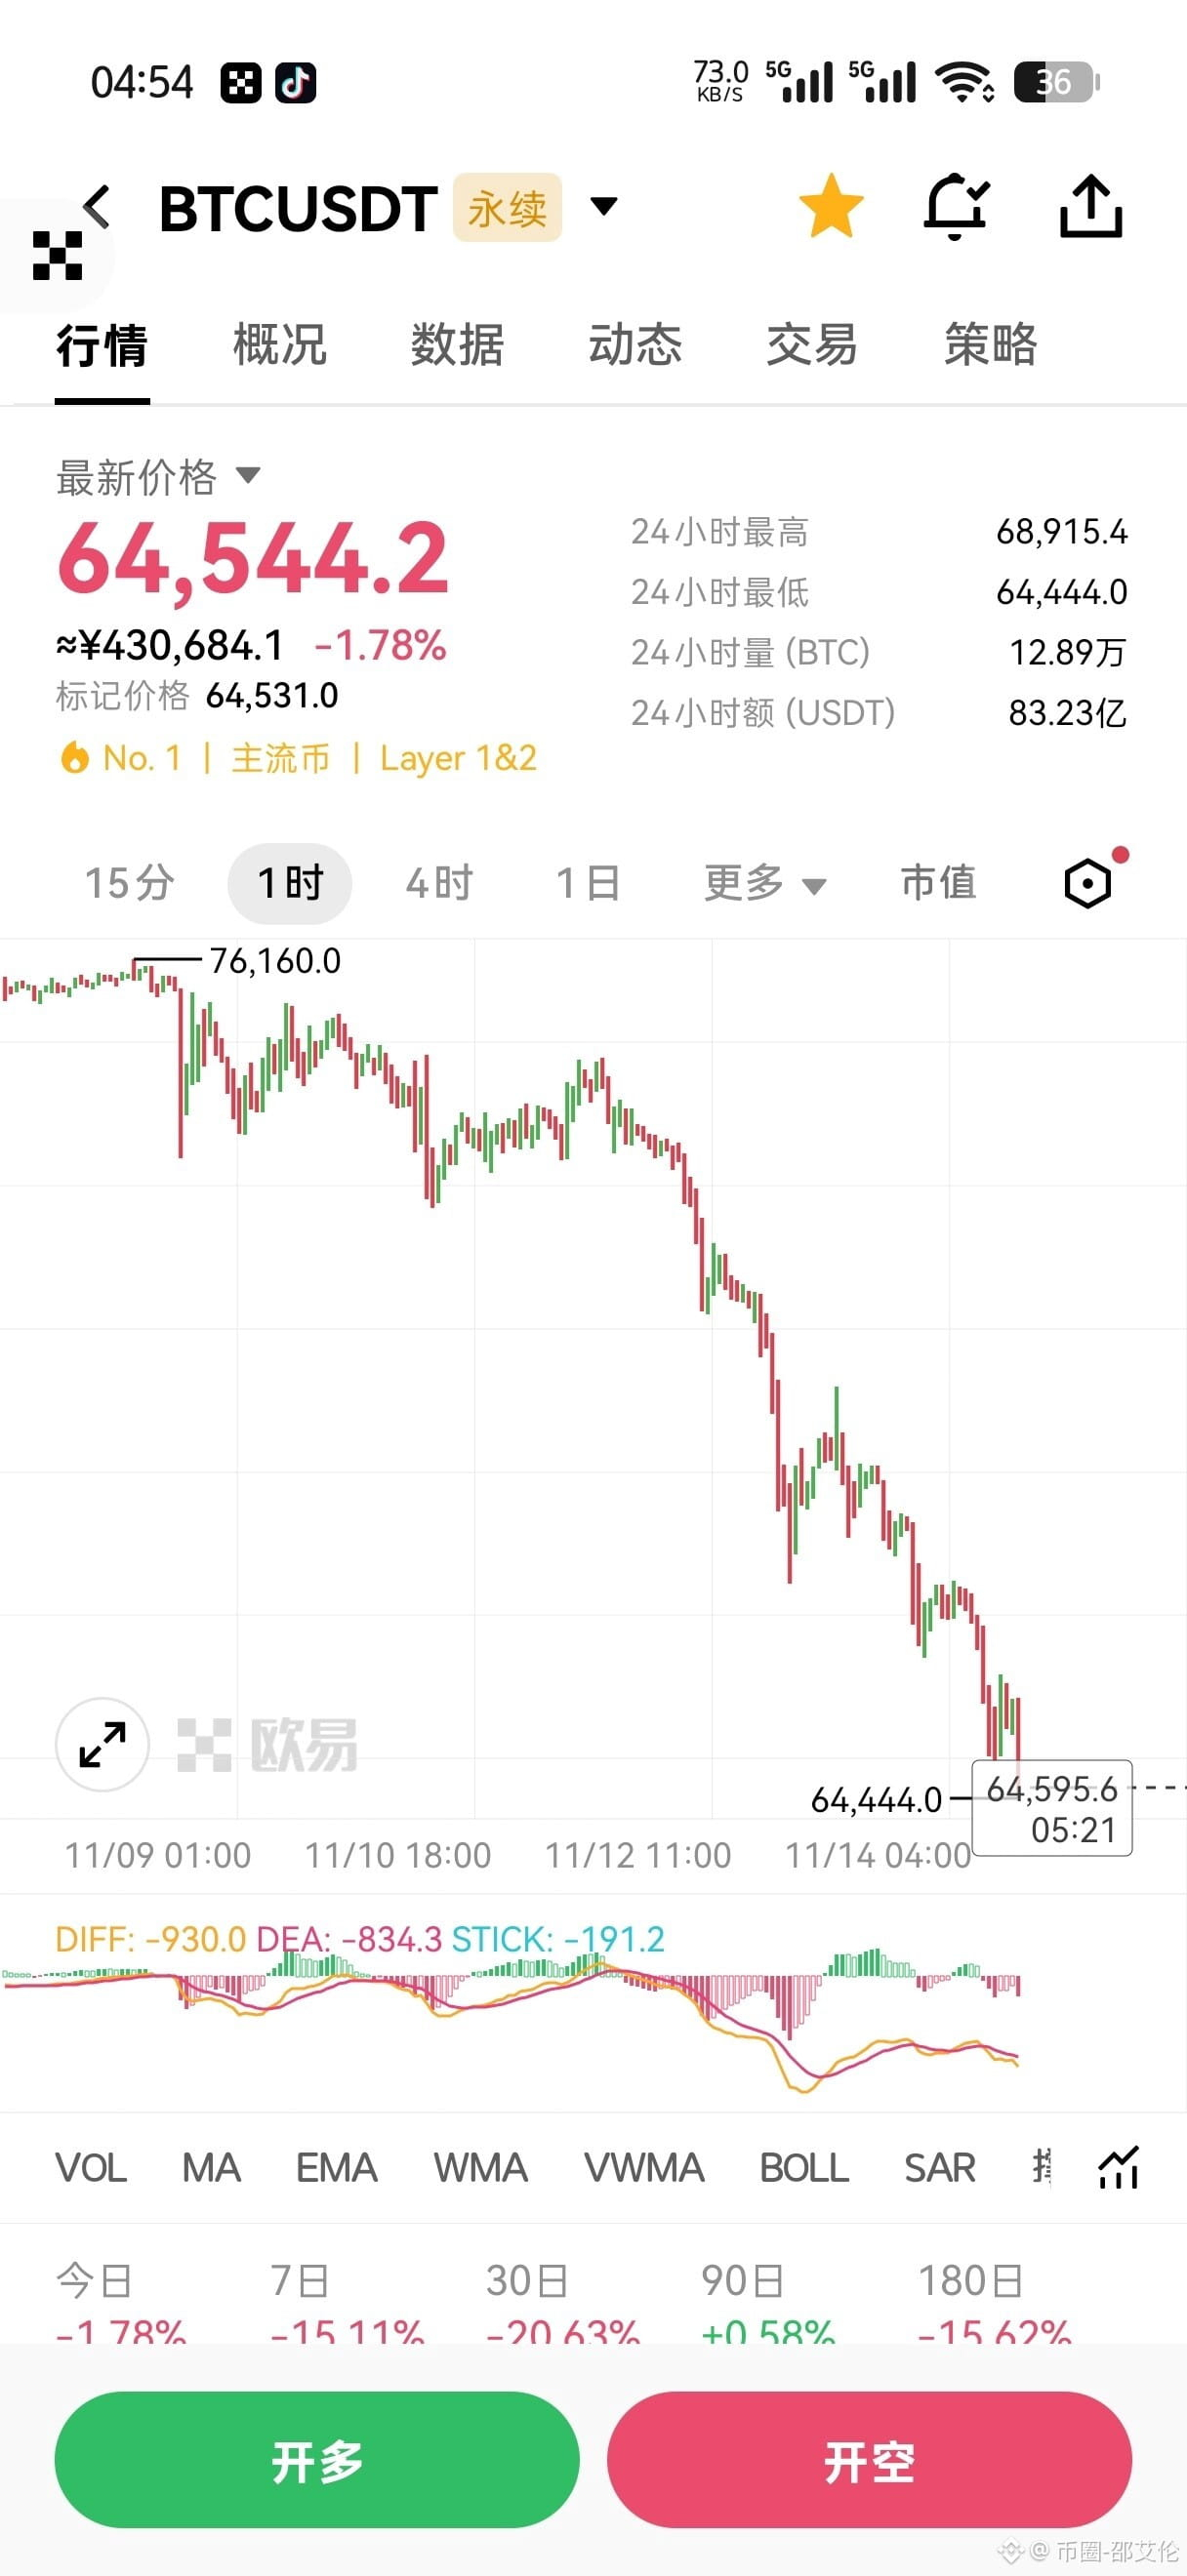
Bitcoin at 37,000, Ethereum at 750! At first, people thought it was just a joke.
Long positions opened in the morning, accounts got liquidated at night!
Brothers, back in August, an opinion was going around,
and everyone thought it was a joke at the time. It was:
Bitcoin $BTC at 37,000, Ethereum $ETH at 750, SOL $SOL at 20.
At first, people thought it was just a joke.
But with this drop happening now, could that day really be coming?
The plunge started on Saturday and Sunday,
which is extremely rare!
Usually, there’s more volatility on trading days, especially when the U.S. stock market opens.
On Saturdays and Sundays, the market usually moves sideways, with fluctuations never exceeding 1%.
This time, everything is different.
I have good reason to suspect that big money got wind of some news in advance,
so they rushed to get out over the weekend!
The drop has been so smooth, with no rebound and no support whatsoever.
I honestly have no idea how far it will fall. Maybe Bitcoin really will hit the 30,000s.
Where do you guys think it’ll stop falling? Check out my pinned post and let’s discuss: $BTC
{future}(BTCUSDT)
Bitcoin at 37,000, Ethereum at 750! At first, people thought it was just a joke.
Long positions opened in the morning, accounts got liquidated at night!
Brothers, back in August, an opinion was going around,
and everyone thought it was a joke at the time. It was:
Bitcoin $BTC at 37,000, Ethereum $ETH at 750, SOL $SOL at 20.
At first, people thought it was just a joke.
But with this drop happening now, could that day really be coming?
The plunge started on Saturday and Sunday,
which is extremely rare!
Usually, there’s more volatility on trading days, especially when the U.S. stock market opens.
On Saturdays and Sundays, the market usually moves sideways, with fluctuations never exceeding 1%.
This time, everything is different.
I have good reason to suspect that big money got wind of some news in advance,
so they rushed to get out over the weekend!
The drop has been so smooth, with no rebound and no support whatsoever.
I honestly have no idea how far it will fall. Maybe Bitcoin really will hit the 30,000s.
Where do you guys think it’ll stop falling? Check out my pinned post and let’s discuss: $BTC
Long positions opened in the morning, accounts got liquidated at night!
Brothers, back in August, an opinion was going around,
and everyone thought it was a joke at the time. It was:
Bitcoin $BTC at 37,000, Ethereum $ETH at 750, SOL $SOL at 20.
At first, people thought it was just a joke.
But with this drop happening now, could that day really be coming?
The plunge started on Saturday and Sunday,
which is extremely rare!
Usually, there’s more volatility on trading days, especially when the U.S. stock market opens.
On Saturdays and Sundays, the market usually moves sideways, with fluctuations never exceeding 1%.
This time, everything is different.
I have good reason to suspect that big money got wind of some news in advance,
so they rushed to get out over the weekend!
The drop has been so smooth, with no rebound and no support whatsoever.
I honestly have no idea how far it will fall. Maybe Bitcoin really will hit the 30,000s.
Where do you guys think it’ll stop falling? Check out my pinned post and let’s discuss: $BTC
40
·
--
$BTC
Even the whales can’t take it anymore
The crypto market suddenly took a nosedive
This time, even the rich got carried out
Damn
Guys
The crypto world is putting on another spectacular show of wealth vanishing
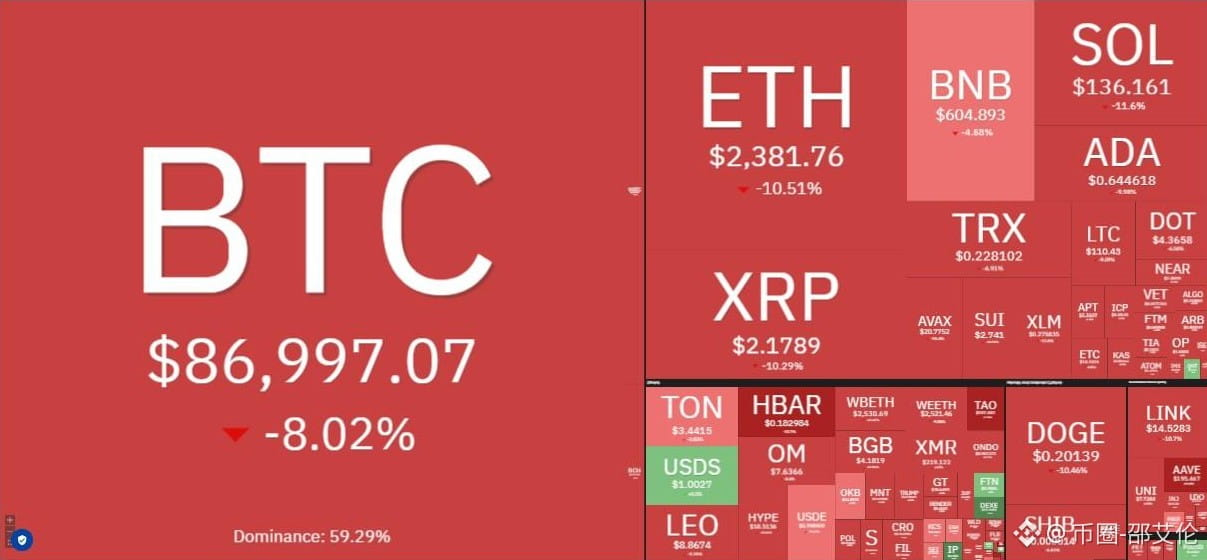
The crypto market has seen a clear pullback recently
BTC, ETH, and a bunch of altcoins are all under pressure
The futures market has been especially wild
According to the latest liquidation data
Over the past 24 hours, liquidations in the crypto derivatives market topped $800 million at one point
More than 140,000 positions were forcibly liquidated
Long positions made up the vast majority
Which means the ones hit hardest by this downturn
Were precisely those still betting on a rebound
Even more fucking wild
The whales couldn’t escape either
Positions worth millions or tens of millions of dollars
Can look pretty intimidating
But as soon as the market turns against you
If you don’t have enough margin
You’re getting liquidated, plain and simple
That’s the brutal reality of leveraged markets
$BTC
{future}(BTCUSDT)
$BTC
Even the whales can’t take it anymore
The crypto market suddenly took a nosedive
This time, even the rich got carried out
Damn
Guys
The crypto world is putting on another spectacular show of wealth vanishing
The crypto market has seen a clear pullback recently
BTC, ETH, and a bunch of altcoins are all under pressure
The futures market has been especially wild
According to the latest liquidation data
Over the past 24 hours, liquidations in the crypto derivatives market topped $800 million at one point
More than 140,000 positions were forcibly liquidated
Long positions made up the vast majority
Which means the ones hit hardest by this downturn
Were precisely those still betting on a rebound
Even more fucking wild
The whales couldn’t escape either
Positions worth millions or tens of millions of dollars
Can look pretty intimidating
But as soon as the market turns against you
If you don’t have enough margin
You’re getting liquidated, plain and simple
That’s the brutal reality of leveraged markets
$BTC
Even the whales can’t take it anymore
The crypto market suddenly took a nosedive
This time, even the rich got carried out
Damn
Guys
The crypto world is putting on another spectacular show of wealth vanishing
The crypto market has seen a clear pullback recently
BTC, ETH, and a bunch of altcoins are all under pressure
The futures market has been especially wild
According to the latest liquidation data
Over the past 24 hours, liquidations in the crypto derivatives market topped $800 million at one point
More than 140,000 positions were forcibly liquidated
Long positions made up the vast majority
Which means the ones hit hardest by this downturn
Were precisely those still betting on a rebound
Even more fucking wild
The whales couldn’t escape either
Positions worth millions or tens of millions of dollars
Can look pretty intimidating
But as soon as the market turns against you
If you don’t have enough margin
You’re getting liquidated, plain and simple
That’s the brutal reality of leveraged markets
$BTC
30
·
--
📉11.15 Midday Market Outlook📉
$BTC View:
The weekend was wild! I originally thought we'd see a recovery after the weekend decline, but I didn't expect the market to fall this hard over the weekend. In this kind of market, even the world's top traders would see their capital shrink, let alone us small retail traders.
This market has fallen so much that I don't even know what to say anymore. The bulls are desperate. After $BTC broke below 67400, it tried to rebound and reclaim 67400, but failed. Then it dropped straight to 65000. It barely paused at 65000 before continuing to fall.
When I got up this morning, I saw Bitcoin had broken below the 65000 and 62615 support levels, dropping straight to a low of 61957. For the past few days, I've woken up to a new low each time. Who can take this? Bitcoin is now trading in the 65032-62615 range. Has it stopped falling yet?
Bitcoin needs to reclaim 65000 to stop falling and start rebounding, with 65984-67400 as the upside targets. If it can't get back above 65000, it may retest the previous low. At the point marked by the red arrow below, a very nice bullish engulfing pattern formed.
This indicates a need for a rebound on the hourly timeframe, but the rebound must break through the 65000 resistance. If it can't, the rebound won't continue.
Why did such a big rebound happen after the price reached around 62000? Because reaching 62000 activated buying interest around that level. Institutional bulls felt 62000 was worth buying, which is why the price reacted so strongly. Next, we'll see whether 65000 can be broken. If it breaks through, the rebound will continue upward; if not, wait for a second retest!
If Bitcoin can hold at 62000 on a second retest, this decline will basically have run its course. If it can't hold 62000, a new low of 60216 will appear right in front of you. If you're looking to go long now, it's best to wait for a bottoming signal near 62000 on a pullback before entering. Chasing the price directly carries a bit too much risk.
If Bitcoin breaks above 65032 with strong volume, aggressive traders can go long on the right side. If it breaks below 64430 with strong volume and the rebound fails to reclaim it, go short on the right side. Use stop losses.
On the hourly timeframe, if Bitcoin breaks above and holds 65032, look upward toward 65912-67400. There's no point if it can't get past 65032.
On the 4-hour timeframe, if it breaks below 64430, look downward toward 63371-62576.
Resistance above: 65032-65912-67400
Support below: 64430-63371-62576
$BTC
{future}(BTCUSDT)
📉11.15 Midday Market Outlook📉
$BTC View:
The weekend was wild! I originally thought we'd see a recovery after the weekend decline, but I didn't expect the market to fall this hard over the weekend. In this kind of market, even the world's top traders would see their capital shrink, let alone us small retail traders.
This market has fallen so much that I don't even know what to say anymore. The bulls are desperate. After $BTC broke below 67400, it tried to rebound and reclaim 67400, but failed. Then it dropped straight to 65000. It barely paused at 65000 before continuing to fall.
When I got up this morning, I saw Bitcoin had broken below the 65000 and 62615 support levels, dropping straight to a low of 61957. For the past few days, I've woken up to a new low each time. Who can take this? Bitcoin is now trading in the 65032-62615 range. Has it stopped falling yet?
Bitcoin needs to reclaim 65000 to stop falling and start rebounding, with 65984-67400 as the upside targets. If it can't get back above 65000, it may retest the previous low. At the point marked by the red arrow below, a very nice bullish engulfing pattern formed.
This indicates a need for a rebound on the hourly timeframe, but the rebound must break through the 65000 resistance. If it can't, the rebound won't continue.
Why did such a big rebound happen after the price reached around 62000? Because reaching 62000 activated buying interest around that level. Institutional bulls felt 62000 was worth buying, which is why the price reacted so strongly. Next, we'll see whether 65000 can be broken. If it breaks through, the rebound will continue upward; if not, wait for a second retest!
If Bitcoin can hold at 62000 on a second retest, this decline will basically have run its course. If it can't hold 62000, a new low of 60216 will appear right in front of you. If you're looking to go long now, it's best to wait for a bottoming signal near 62000 on a pullback before entering. Chasing the price directly carries a bit too much risk.
If Bitcoin breaks above 65032 with strong volume, aggressive traders can go long on the right side. If it breaks below 64430 with strong volume and the rebound fails to reclaim it, go short on the right side. Use stop losses.
On the hourly timeframe, if Bitcoin breaks above and holds 65032, look upward toward 65912-67400. There's no point if it can't get past 65032.
On the 4-hour timeframe, if it breaks below 64430, look downward toward 63371-62576.
Resistance above: 65032-65912-67400
Support below: 64430-63371-62576
$BTC
$BTC View:
The weekend was wild! I originally thought we'd see a recovery after the weekend decline, but I didn't expect the market to fall this hard over the weekend. In this kind of market, even the world's top traders would see their capital shrink, let alone us small retail traders.
This market has fallen so much that I don't even know what to say anymore. The bulls are desperate. After $BTC broke below 67400, it tried to rebound and reclaim 67400, but failed. Then it dropped straight to 65000. It barely paused at 65000 before continuing to fall.
When I got up this morning, I saw Bitcoin had broken below the 65000 and 62615 support levels, dropping straight to a low of 61957. For the past few days, I've woken up to a new low each time. Who can take this? Bitcoin is now trading in the 65032-62615 range. Has it stopped falling yet?
Bitcoin needs to reclaim 65000 to stop falling and start rebounding, with 65984-67400 as the upside targets. If it can't get back above 65000, it may retest the previous low. At the point marked by the red arrow below, a very nice bullish engulfing pattern formed.
This indicates a need for a rebound on the hourly timeframe, but the rebound must break through the 65000 resistance. If it can't, the rebound won't continue.
Why did such a big rebound happen after the price reached around 62000? Because reaching 62000 activated buying interest around that level. Institutional bulls felt 62000 was worth buying, which is why the price reacted so strongly. Next, we'll see whether 65000 can be broken. If it breaks through, the rebound will continue upward; if not, wait for a second retest!
If Bitcoin can hold at 62000 on a second retest, this decline will basically have run its course. If it can't hold 62000, a new low of 60216 will appear right in front of you. If you're looking to go long now, it's best to wait for a bottoming signal near 62000 on a pullback before entering. Chasing the price directly carries a bit too much risk.
If Bitcoin breaks above 65032 with strong volume, aggressive traders can go long on the right side. If it breaks below 64430 with strong volume and the rebound fails to reclaim it, go short on the right side. Use stop losses.
On the hourly timeframe, if Bitcoin breaks above and holds 65032, look upward toward 65912-67400. There's no point if it can't get past 65032.
On the 4-hour timeframe, if it breaks below 64430, look downward toward 63371-62576.
Resistance above: 65032-65912-67400
Support below: 64430-63371-62576
$BTC
58
·
--
📈11.15 Midday Market Outlook📈
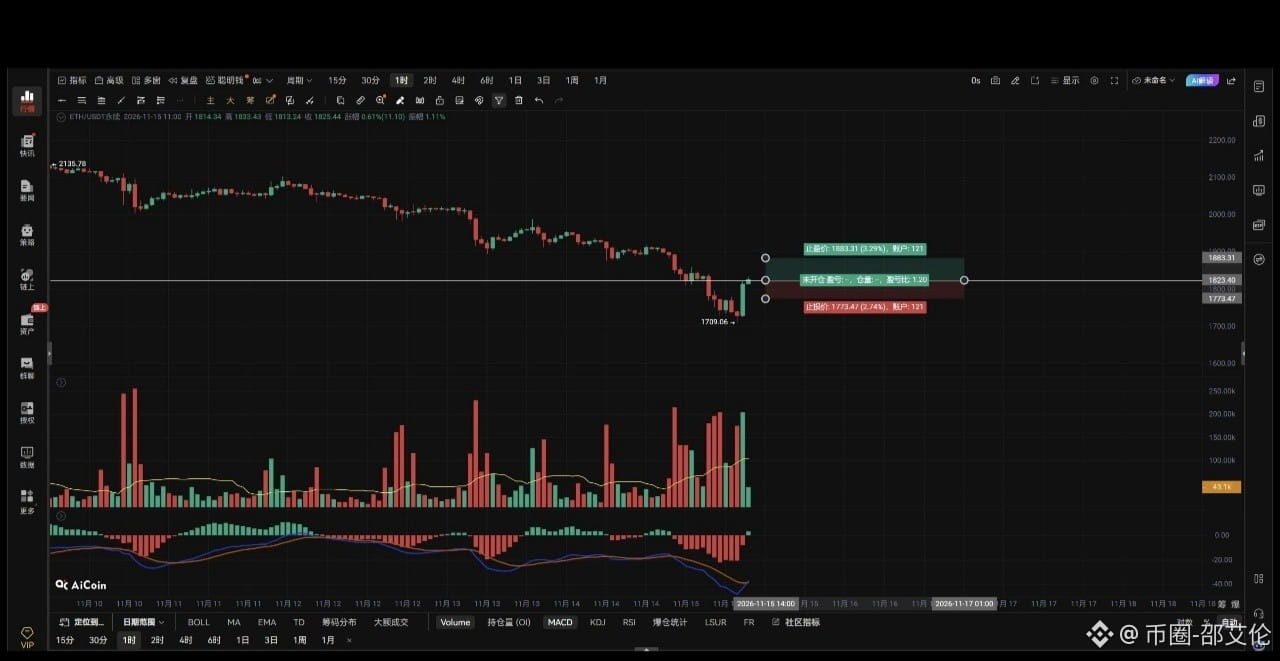
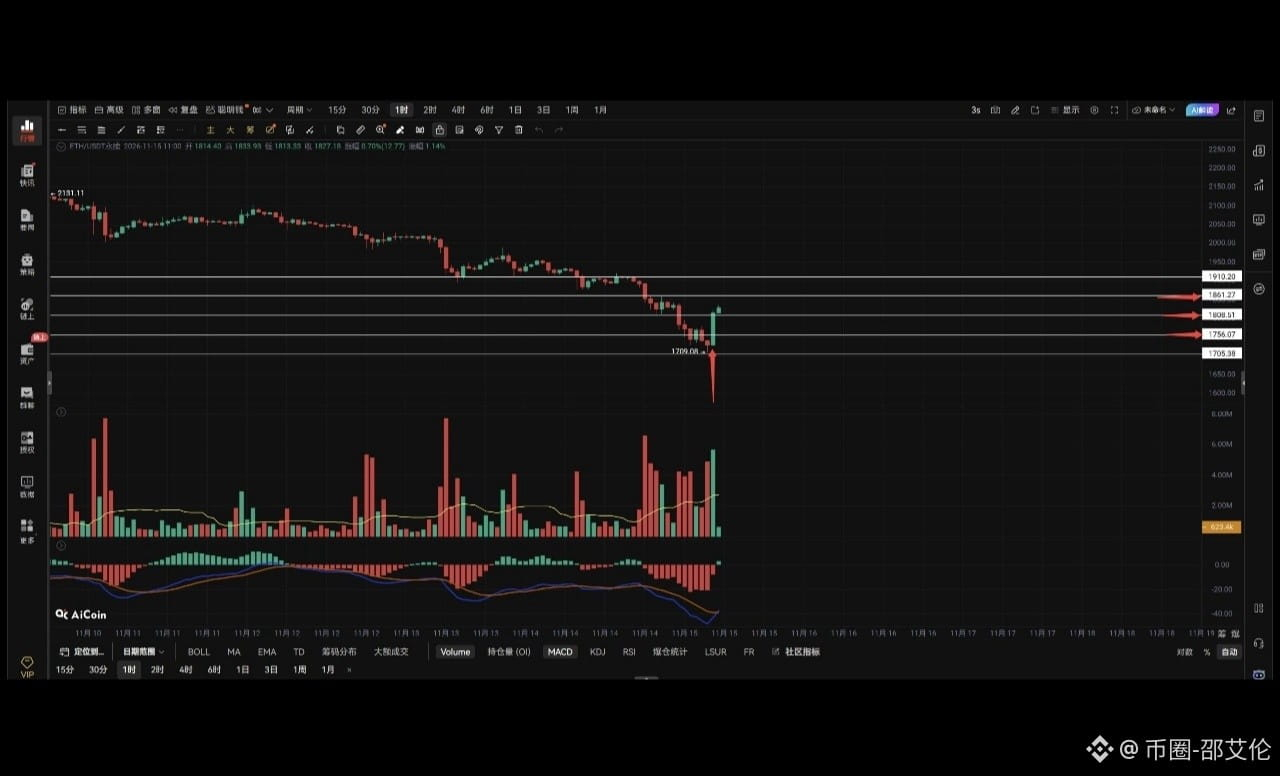
$ETH Strategy:
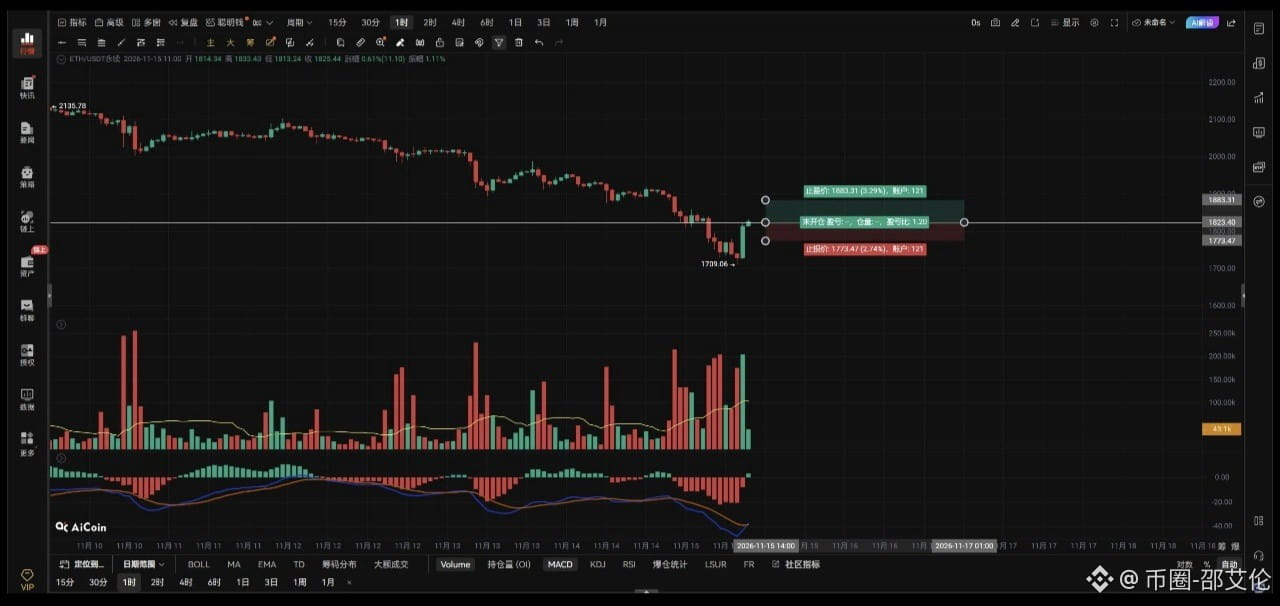
If ETH breaks above 1821 with volume, chase the long on the right side and set a stop-loss.
If it breaks below 1784 with volume, chase the short on the right side and be sure to set a stop-loss.
If it retests 1740 and confirms support, add one lot to the long; stop out if it falls below 1709.
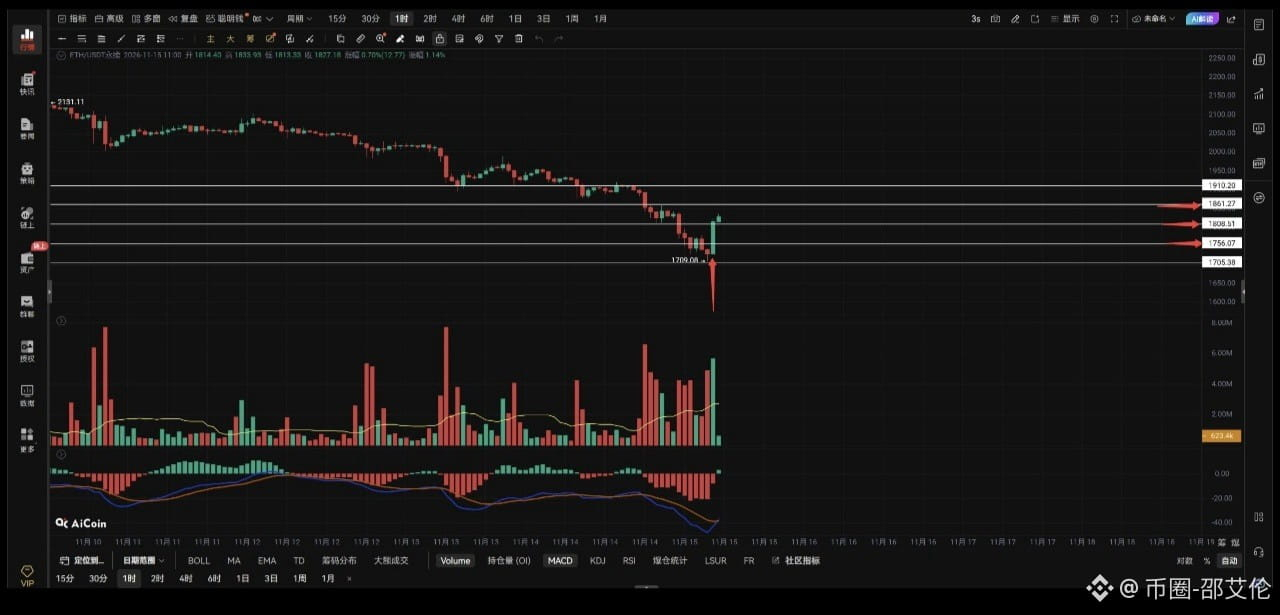
If ETH holds above 1821 on the hourly chart, look for 1861–1910.
Watch for ETH to reach 1861 above; open a one-lot short there, with a stop-loss above 1910.
Left-side wick order: long at 1680; stop out if it falls below 1648.
Resistance above: 1821–1861–1910
Support below: 1784–1740–1709
If the 4-hour chart breaks below 1784, look for 1740–1709.
The candle indicated by the red arrow below ETH is a bullish candle that has pushed through several bearish candles, which shows that ETH is currently very strong.
However, for ETH to continue rebounding, it must hold above 1800 to keep moving up toward 1861. If it can't stay above 1800, it should at least retest 1756 and move within the 1756–1800 consolidation range before choosing a direction. If you want to go long on ETH, it's best to wait for a retest—don't rush to chase. That's all for now. $ETH
{future}(ETHUSDT)
📈11.15 Midday Market Outlook📈
$ETH Strategy:
If ETH breaks above 1821 with volume, chase the long on the right side and set a stop-loss.
If it breaks below 1784 with volume, chase the short on the right side and be sure to set a stop-loss.
If it retests 1740 and confirms support, add one lot to the long; stop out if it falls below 1709.
If ETH holds above 1821 on the hourly chart, look for 1861–1910.
Watch for ETH to reach 1861 above; open a one-lot short there, with a stop-loss above 1910.
Left-side wick order: long at 1680; stop out if it falls below 1648.
Resistance above: 1821–1861–1910
Support below: 1784–1740–1709
If the 4-hour chart breaks below 1784, look for 1740–1709.
The candle indicated by the red arrow below ETH is a bullish candle that has pushed through several bearish candles, which shows that ETH is currently very strong.
However, for ETH to continue rebounding, it must hold above 1800 to keep moving up toward 1861. If it can't stay above 1800, it should at least retest 1756 and move within the 1756–1800 consolidation range before choosing a direction. If you want to go long on ETH, it's best to wait for a retest—don't rush to chase. That's all for now. $ETH
$ETH Strategy:
If ETH breaks above 1821 with volume, chase the long on the right side and set a stop-loss.
If it breaks below 1784 with volume, chase the short on the right side and be sure to set a stop-loss.
If it retests 1740 and confirms support, add one lot to the long; stop out if it falls below 1709.
If ETH holds above 1821 on the hourly chart, look for 1861–1910.
Watch for ETH to reach 1861 above; open a one-lot short there, with a stop-loss above 1910.
Left-side wick order: long at 1680; stop out if it falls below 1648.
Resistance above: 1821–1861–1910
Support below: 1784–1740–1709
If the 4-hour chart breaks below 1784, look for 1740–1709.
The candle indicated by the red arrow below ETH is a bullish candle that has pushed through several bearish candles, which shows that ETH is currently very strong.
However, for ETH to continue rebounding, it must hold above 1800 to keep moving up toward 1861. If it can't stay above 1800, it should at least retest 1756 and move within the 1756–1800 consolidation range before choosing a direction. If you want to go long on ETH, it's best to wait for a retest—don't rush to chase. That's all for now. $ETH
119
·
--
The 62,000 level was the first line of support this morning, and by noon the price was right at its doorstep.
From 9 a.m. to 11:30 a.m., BTC hovered around 62,900, down 8% on the day, with a 24-hour range of 62,800 to 68,375 (CoinGlass, updated at 09:06). It dipped as low as 63,311 intraday, its lowest since August 17. ETH was at 1,735, down 10%, a new low since July 9.
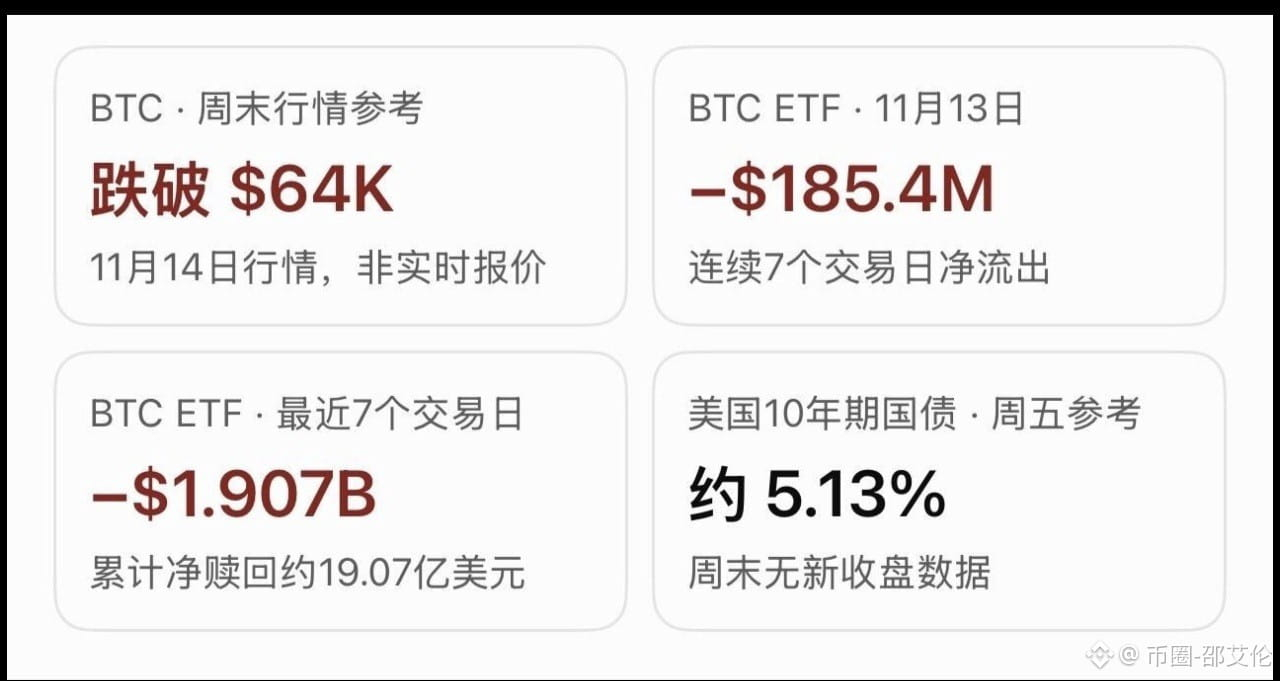
Across the market, 337,000 traders were liquidated in 24 hours, totaling $2.1 billion, with more than 90% of the liquidations being long positions (CoinGlass figures; different media outlets put the total between $1.9 billion and $2.1 billion).
This sell-off isn’t just about sentiment. From October 30 to November 13, U.S. spot Bitcoin ETFs saw nearly $3 billion in net outflows; the more than $6 billion withdrawn from Binance hasn’t fully flowed back. Money really is moving out.
Below 62,000 is the year’s low of 57,700. Wait until the weekly candle actually closes at 8 tomorrow morning before making a move.
Do you think 62,000 will hold tonight? $BTC
{future}(BTCUSDT)
The 62,000 level was the first line of support this morning, and by noon the price was right at its doorstep.
From 9 a.m. to 11:30 a.m., BTC hovered around 62,900, down 8% on the day, with a 24-hour range of 62,800 to 68,375 (CoinGlass, updated at 09:06). It dipped as low as 63,311 intraday, its lowest since August 17. ETH was at 1,735, down 10%, a new low since July 9.
Across the market, 337,000 traders were liquidated in 24 hours, totaling $2.1 billion, with more than 90% of the liquidations being long positions (CoinGlass figures; different media outlets put the total between $1.9 billion and $2.1 billion).
This sell-off isn’t just about sentiment. From October 30 to November 13, U.S. spot Bitcoin ETFs saw nearly $3 billion in net outflows; the more than $6 billion withdrawn from Binance hasn’t fully flowed back. Money really is moving out.
Below 62,000 is the year’s low of 57,700. Wait until the weekly candle actually closes at 8 tomorrow morning before making a move.
Do you think 62,000 will hold tonight? $BTC
From 9 a.m. to 11:30 a.m., BTC hovered around 62,900, down 8% on the day, with a 24-hour range of 62,800 to 68,375 (CoinGlass, updated at 09:06). It dipped as low as 63,311 intraday, its lowest since August 17. ETH was at 1,735, down 10%, a new low since July 9.
Across the market, 337,000 traders were liquidated in 24 hours, totaling $2.1 billion, with more than 90% of the liquidations being long positions (CoinGlass figures; different media outlets put the total between $1.9 billion and $2.1 billion).
This sell-off isn’t just about sentiment. From October 30 to November 13, U.S. spot Bitcoin ETFs saw nearly $3 billion in net outflows; the more than $6 billion withdrawn from Binance hasn’t fully flowed back. Money really is moving out.
Below 62,000 is the year’s low of 57,700. Wait until the weekly candle actually closes at 8 tomorrow morning before making a move.
Do you think 62,000 will hold tonight? $BTC
49
·
--
🚨 BTC has fallen below a key psychological support level! $65,000 is back in reach, and bulls and bears are locked in a fierce battle! The latest market data shows Bitcoin has climbed back above $65,000 and is currently trading at $65,099.98, though it is still down 3.81% over the past 24 hours. This makes things interesting: although the price has regained the $65,000 level, overall losses remain, suggesting short-term selling pressure hasn’t completely faded. $65,000 is now like a city gate that bulls and bears are fighting to control. The bulls want to defend it to prove the market still has the strength to rebound; the bears want to push the price back down and let fear continue to spread. Keep an eye on two signals next: first, whether BTC can hold above $65,000 consistently rather than briefly breaking through before falling back; second, whether trading volume picks up during the rebound. If the price rises without significant buying support, be cautious—it may just be a technical bounce during a downturn. 📉 For the broader crypto market, BTC remains a key barometer of sentiment. If it can’t hold steady, ETH and other altcoins are often more likely to come under pressure. However, a single dip below or move back above $65,000 isn’t enough to conclude that the trend has reversed. The market’s favorite trick is to spark a rebound when everyone is panicking, then suddenly turn around when everyone gets excited. Right now, managing your position is more important than rushing to call the bottom. This is especially true for highly leveraged trades—don’t let one rebound make you forget the risks. A true bottom requires confirmation from price action, trading volume, and buying demand. $BTC
{future}(BTCUSDT)
🚨 BTC has fallen below a key psychological support level! $65,000 is back in reach, and bulls and bears are locked in a fierce battle! The latest market data shows Bitcoin has climbed back above $65,000 and is currently trading at $65,099.98, though it is still down 3.81% over the past 24 hours. This makes things interesting: although the price has regained the $65,000 level, overall losses remain, suggesting short-term selling pressure hasn’t completely faded. $65,000 is now like a city gate that bulls and bears are fighting to control. The bulls want to defend it to prove the market still has the strength to rebound; the bears want to push the price back down and let fear continue to spread. Keep an eye on two signals next: first, whether BTC can hold above $65,000 consistently rather than briefly breaking through before falling back; second, whether trading volume picks up during the rebound. If the price rises without significant buying support, be cautious—it may just be a technical bounce during a downturn. 📉 For the broader crypto market, BTC remains a key barometer of sentiment. If it can’t hold steady, ETH and other altcoins are often more likely to come under pressure. However, a single dip below or move back above $65,000 isn’t enough to conclude that the trend has reversed. The market’s favorite trick is to spark a rebound when everyone is panicking, then suddenly turn around when everyone gets excited. Right now, managing your position is more important than rushing to call the bottom. This is especially true for highly leveraged trades—don’t let one rebound make you forget the risks. A true bottom requires confirmation from price action, trading volume, and buying demand. $BTC

43
·
--
Every time $ETH turns bearish, the U dealers raise their prices! It’s so infuriating! In crypto, the only ones who never lose money are the U dealers.
{future}(ETHUSDT)
Every time $ETH turns bearish, the U dealers raise their prices! It’s so infuriating! In crypto, the only ones who never lose money are the U dealers.

4
1.8k
·
--
😱 Utterly brutal! Shorted ZEC at $148 and held on for a year with an unrealized loss of 83%—this is torture on nightmare difficulty!
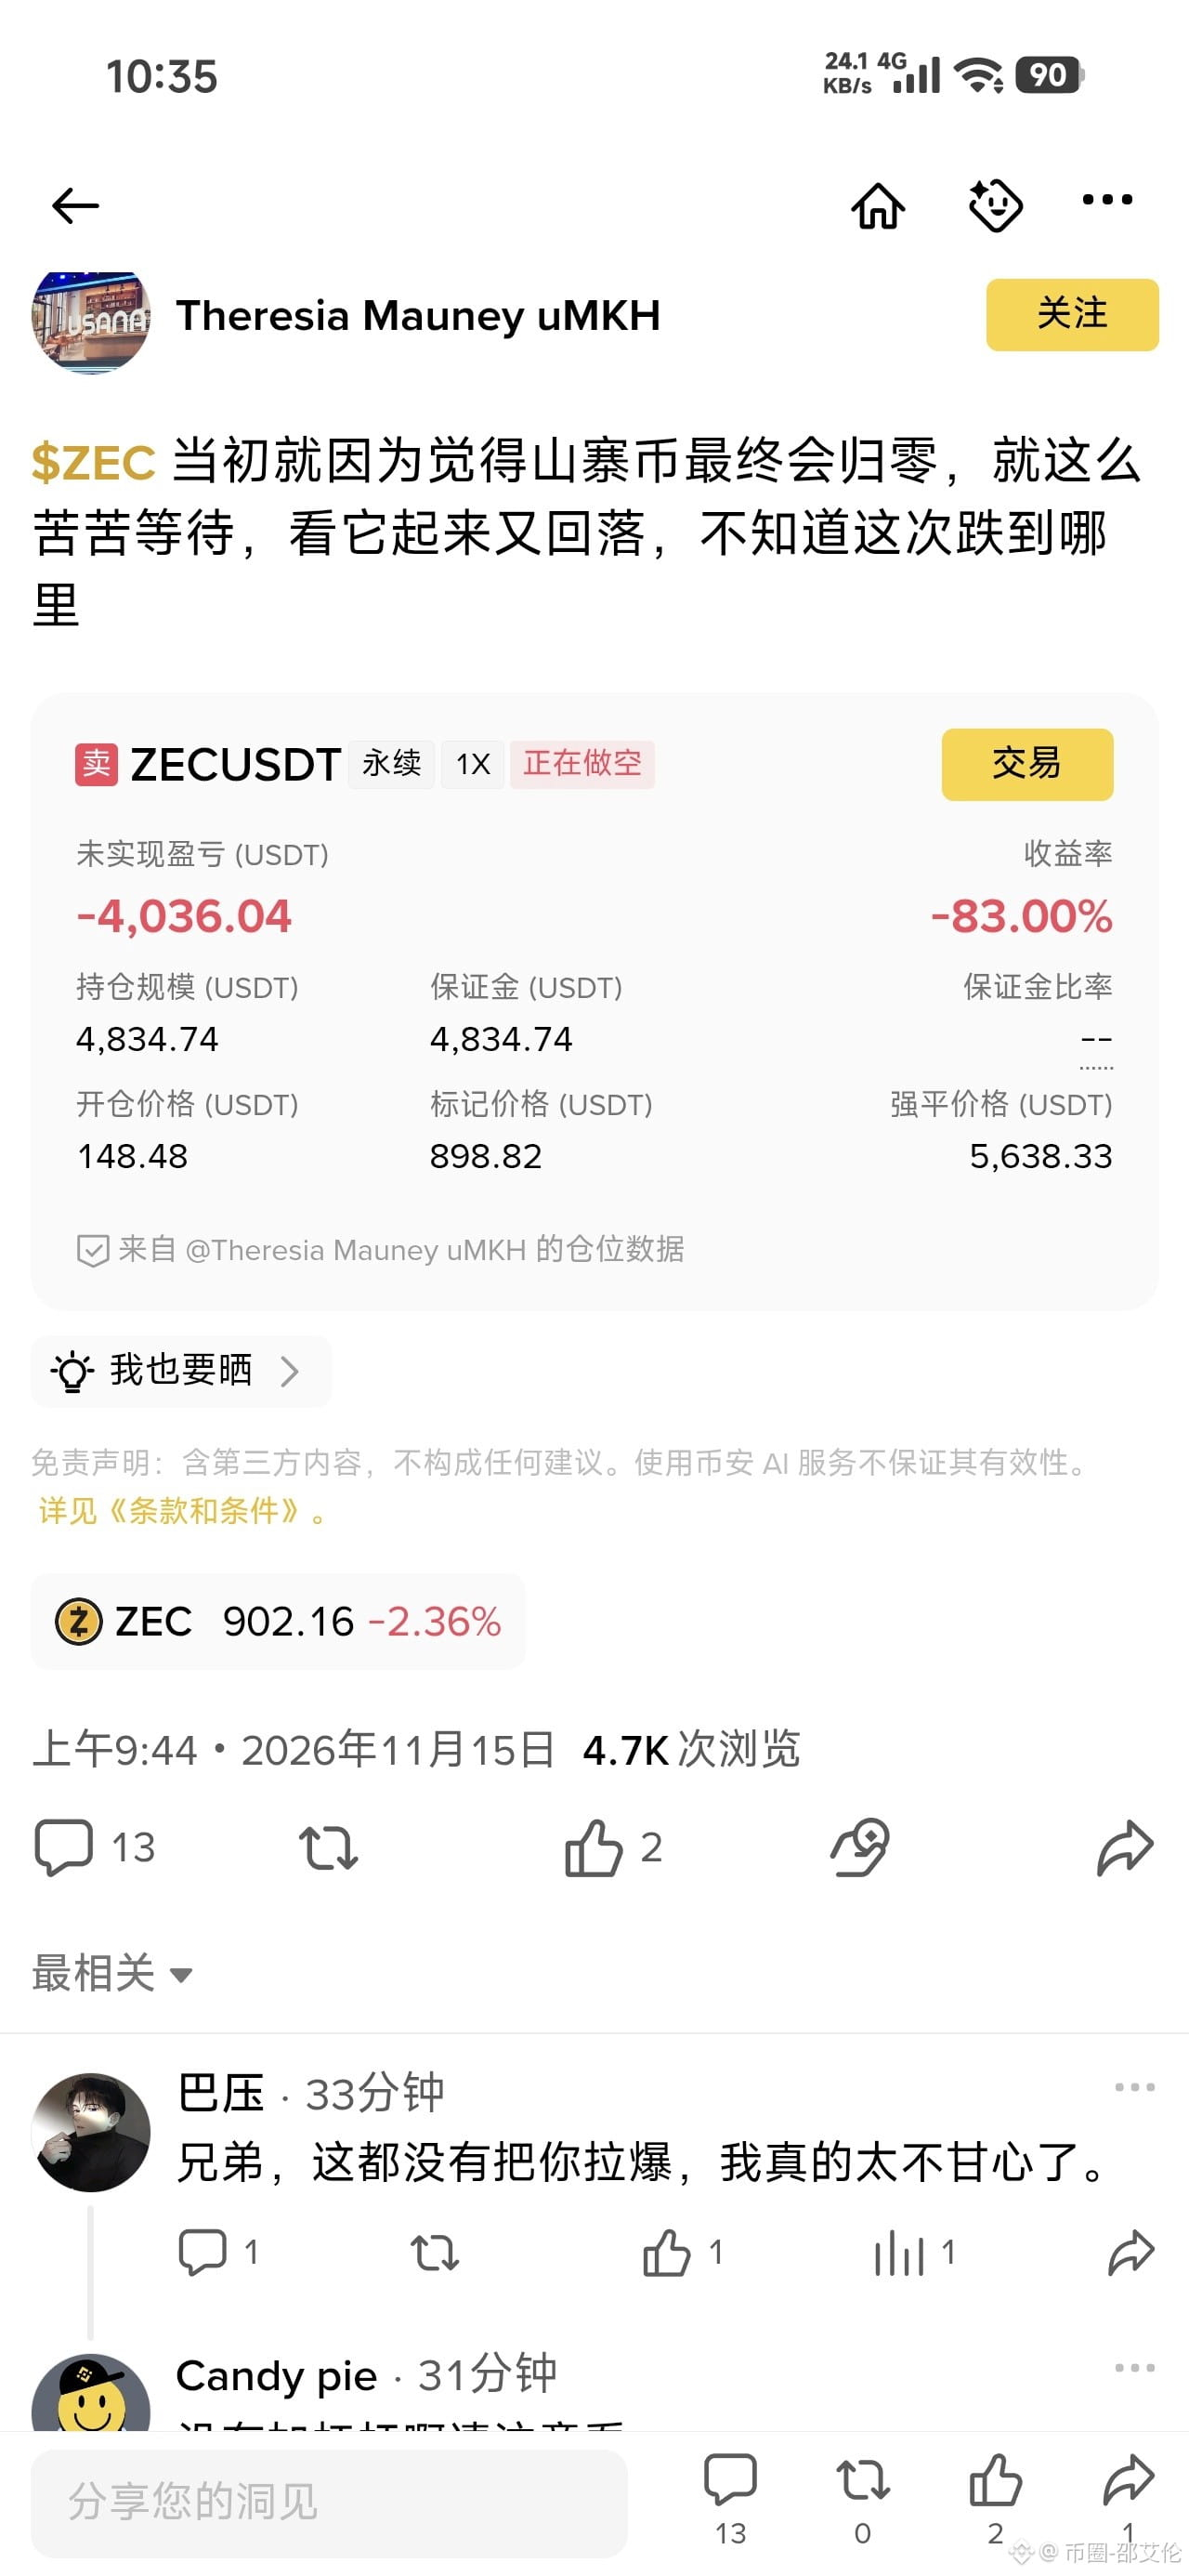
Guys, what’s the scariest thing about trading futures? It’s not getting liquidated as soon as you open a position—it’s being tormented over and over by the market, like a frog slowly boiled alive. Today I came across this trader named “Theresia Mauney uMKH,” and honestly, it made me catch my breath.
Take a look at these incredibly brutal position details:
📉 Contract: ZECUSDT perpetual
🎯 Direction: Short (1x leverage)
🔴 Average entry price: 148.48
📈 Mark price: 898.82 (current price is around 899)
🩸 Unrealized PnL: -4,036 USDT (-83.00%)
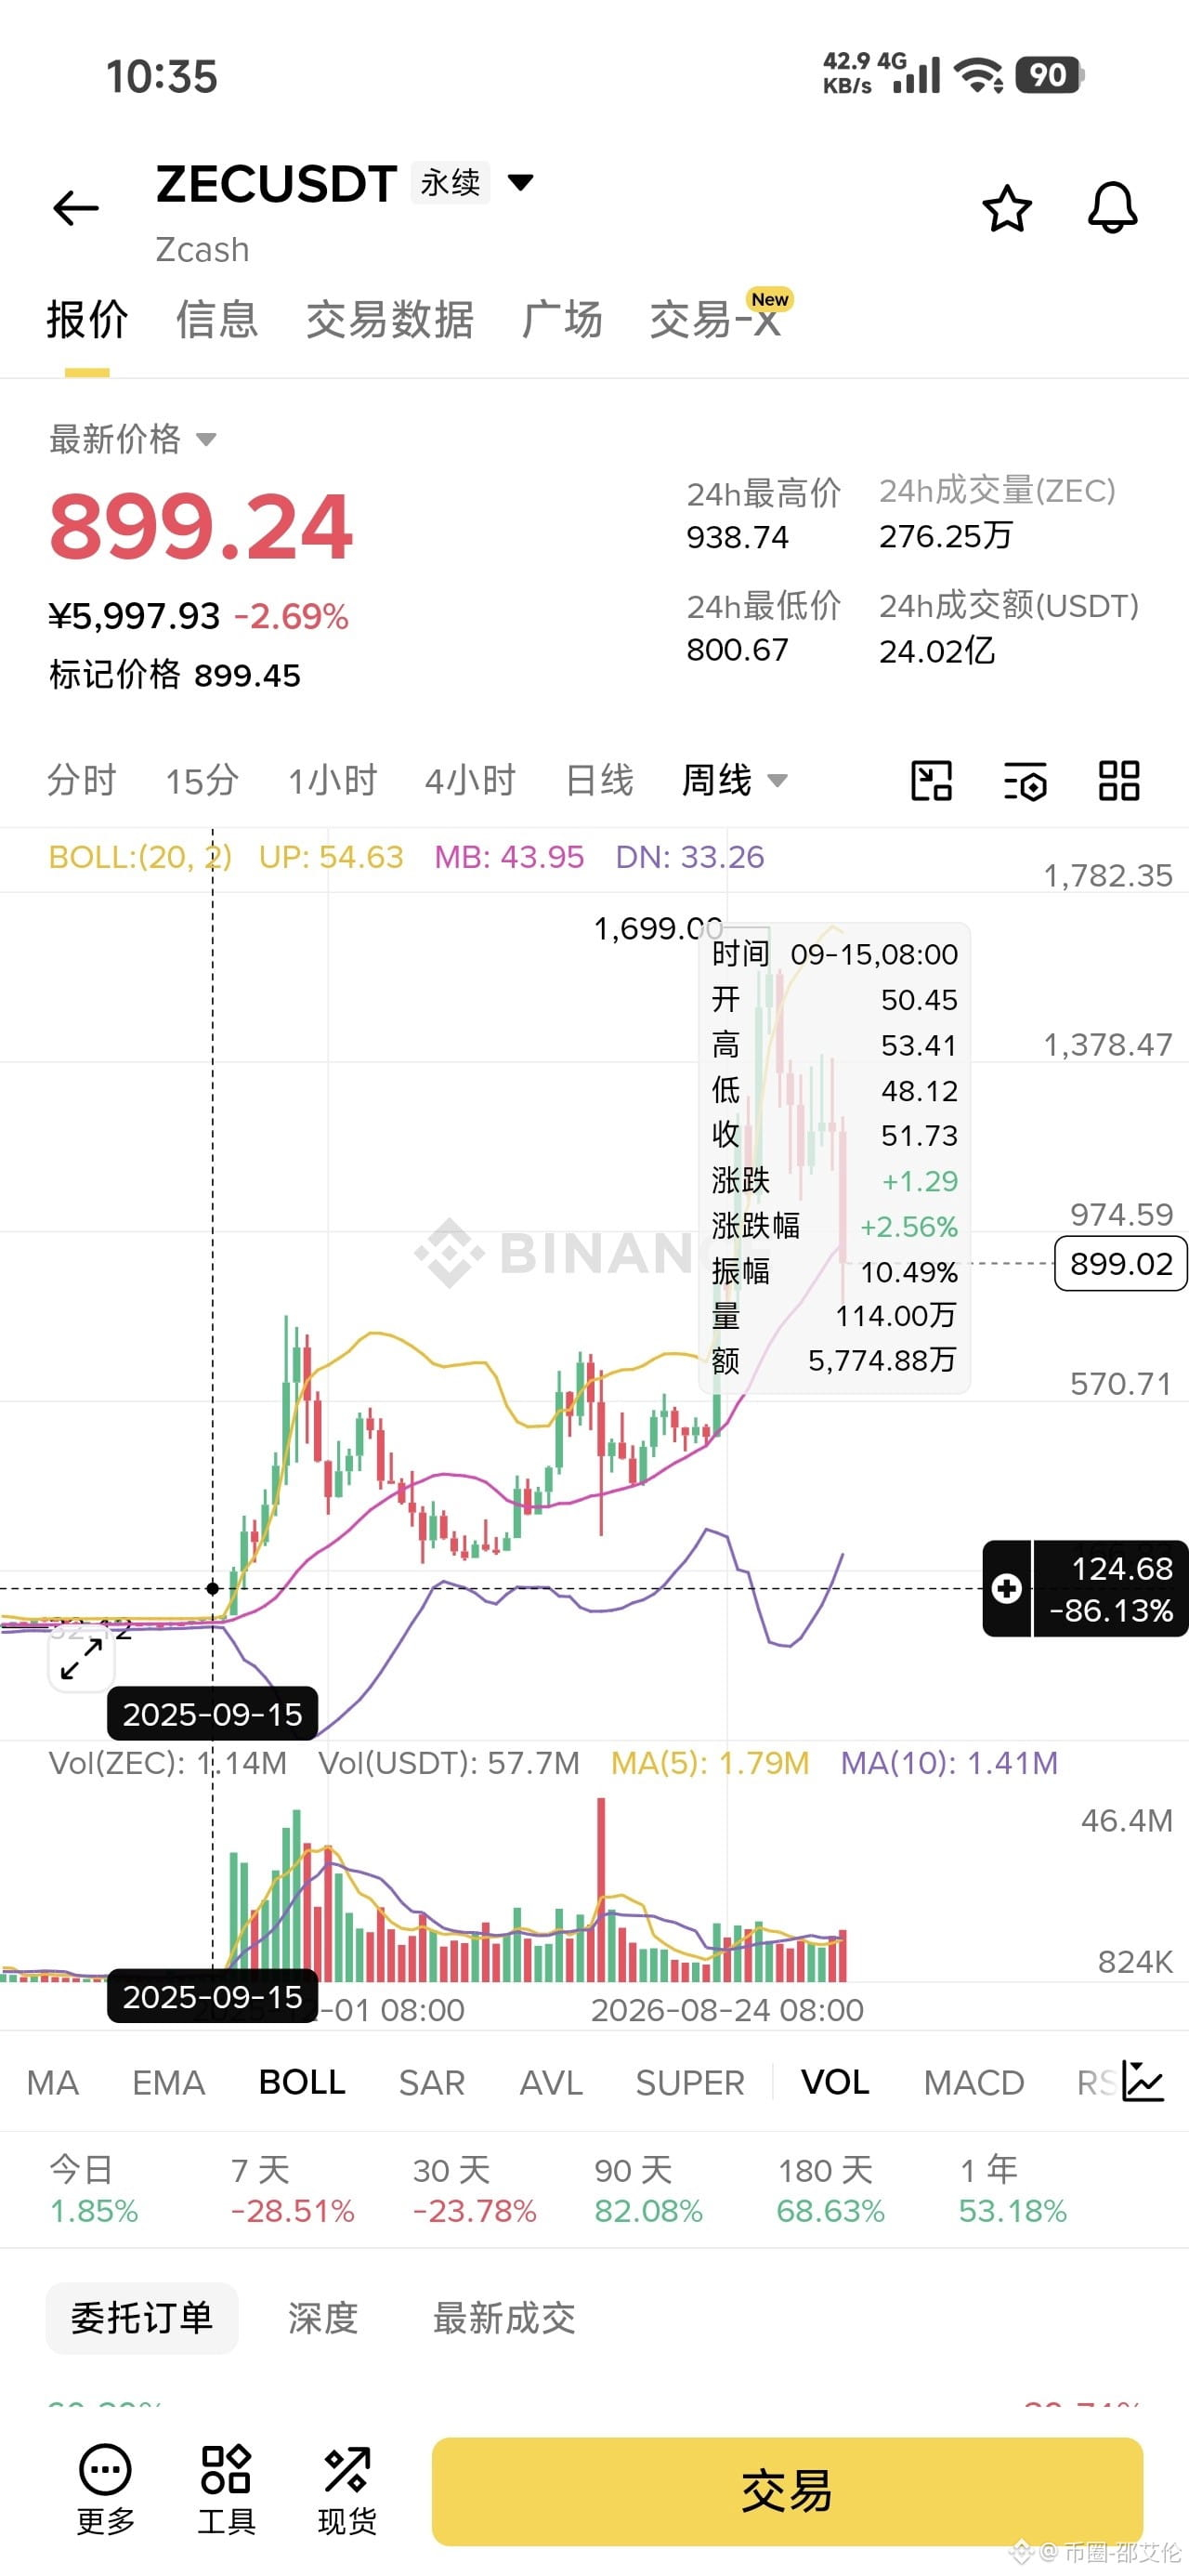
Get it, guys? He opened a short when ZEC was only $148! Then ZEC went absolutely berserk, soaring to a high of $1,699 (check the weekly chart in image 1)—more than a tenfold increase!
Why wasn’t he liquidated?
That’s the one thing to be “thankful” for. He used 1x leverage (with sufficient margin), and his liquidation price is 5,638.33. If he’d used even 3x or 5x leverage, there wouldn’t have been a trace of him left after a surge like that.
A hard-earned warning for all traders:
1. Never try to pick the top by shorting a strong, wildly volatile coin. The power of a trend is terrifying, and there’s no limit to how high market makers can push a price. Holding on against the trend can cost you dearly.
2. Holding on for a year with 1x leverage is still a slow-motion suicide. Sure, he wasn’t liquidated, but his capital has been tied up indefinitely. If he’d put that money into earning interest or swing trading other coins, he could have made it back long ago.
3. “I think it should go down” ≠ “It’s going to go down soon.” The market is always right. Don’t fight the trend.
Now ZEC has retreated from its high of 1,699 to 899, and he’s still deeply underwater. Guys, do you think ZEC can fall back to his entry price (148)? If it were you, facing a short position that’s been deeply underwater for a year, would you cut your losses now and admit you were wrong, or keep holding on?👇$ZEC
{future}(ZECUSDT)
😱 Utterly brutal! Shorted ZEC at $148 and held on for a year with an unrealized loss of 83%—this is torture on nightmare difficulty!
Guys, what’s the scariest thing about trading futures? It’s not getting liquidated as soon as you open a position—it’s being tormented over and over by the market, like a frog slowly boiled alive. Today I came across this trader named “Theresia Mauney uMKH,” and honestly, it made me catch my breath.
Take a look at these incredibly brutal position details:
📉 Contract: ZECUSDT perpetual
🎯 Direction: Short (1x leverage)
🔴 Average entry price: 148.48
📈 Mark price: 898.82 (current price is around 899)
🩸 Unrealized PnL: -4,036 USDT (-83.00%)
Get it, guys? He opened a short when ZEC was only $148! Then ZEC went absolutely berserk, soaring to a high of $1,699 (check the weekly chart in image 1)—more than a tenfold increase!
Why wasn’t he liquidated?
That’s the one thing to be “thankful” for. He used 1x leverage (with sufficient margin), and his liquidation price is 5,638.33. If he’d used even 3x or 5x leverage, there wouldn’t have been a trace of him left after a surge like that.
A hard-earned warning for all traders:
1. Never try to pick the top by shorting a strong, wildly volatile coin. The power of a trend is terrifying, and there’s no limit to how high market makers can push a price. Holding on against the trend can cost you dearly.
2. Holding on for a year with 1x leverage is still a slow-motion suicide. Sure, he wasn’t liquidated, but his capital has been tied up indefinitely. If he’d put that money into earning interest or swing trading other coins, he could have made it back long ago.
3. “I think it should go down” ≠ “It’s going to go down soon.” The market is always right. Don’t fight the trend.
Now ZEC has retreated from its high of 1,699 to 899, and he’s still deeply underwater. Guys, do you think ZEC can fall back to his entry price (148)? If it were you, facing a short position that’s been deeply underwater for a year, would you cut your losses now and admit you were wrong, or keep holding on?👇$ZEC
Guys, what’s the scariest thing about trading futures? It’s not getting liquidated as soon as you open a position—it’s being tormented over and over by the market, like a frog slowly boiled alive. Today I came across this trader named “Theresia Mauney uMKH,” and honestly, it made me catch my breath.
Take a look at these incredibly brutal position details:
📉 Contract: ZECUSDT perpetual
🎯 Direction: Short (1x leverage)
🔴 Average entry price: 148.48
📈 Mark price: 898.82 (current price is around 899)
🩸 Unrealized PnL: -4,036 USDT (-83.00%)
Get it, guys? He opened a short when ZEC was only $148! Then ZEC went absolutely berserk, soaring to a high of $1,699 (check the weekly chart in image 1)—more than a tenfold increase!
Why wasn’t he liquidated?
That’s the one thing to be “thankful” for. He used 1x leverage (with sufficient margin), and his liquidation price is 5,638.33. If he’d used even 3x or 5x leverage, there wouldn’t have been a trace of him left after a surge like that.
A hard-earned warning for all traders:
1. Never try to pick the top by shorting a strong, wildly volatile coin. The power of a trend is terrifying, and there’s no limit to how high market makers can push a price. Holding on against the trend can cost you dearly.
2. Holding on for a year with 1x leverage is still a slow-motion suicide. Sure, he wasn’t liquidated, but his capital has been tied up indefinitely. If he’d put that money into earning interest or swing trading other coins, he could have made it back long ago.
3. “I think it should go down” ≠ “It’s going to go down soon.” The market is always right. Don’t fight the trend.
Now ZEC has retreated from its high of 1,699 to 899, and he’s still deeply underwater. Guys, do you think ZEC can fall back to his entry price (148)? If it were you, facing a short position that’s been deeply underwater for a year, would you cut your losses now and admit you were wrong, or keep holding on?👇$ZEC
200
·
--
🚀 Up nearly 50%! EVAA defies the trend and rockets higher, as smart money rakes in 910K U and shorts get crushed!
Guys, while Bitcoin is grinding out a bottom, this altcoin is acting up again! Keeping an eye on the charts today, I spotted EVAA going absolutely wild against the trend, surging 46.98% in a single day to hit 1.589!
In a market that just keeps sliding, it’s a real standout. But the most exciting part isn’t the rally—it’s the incredibly intense battle over the money behind it.
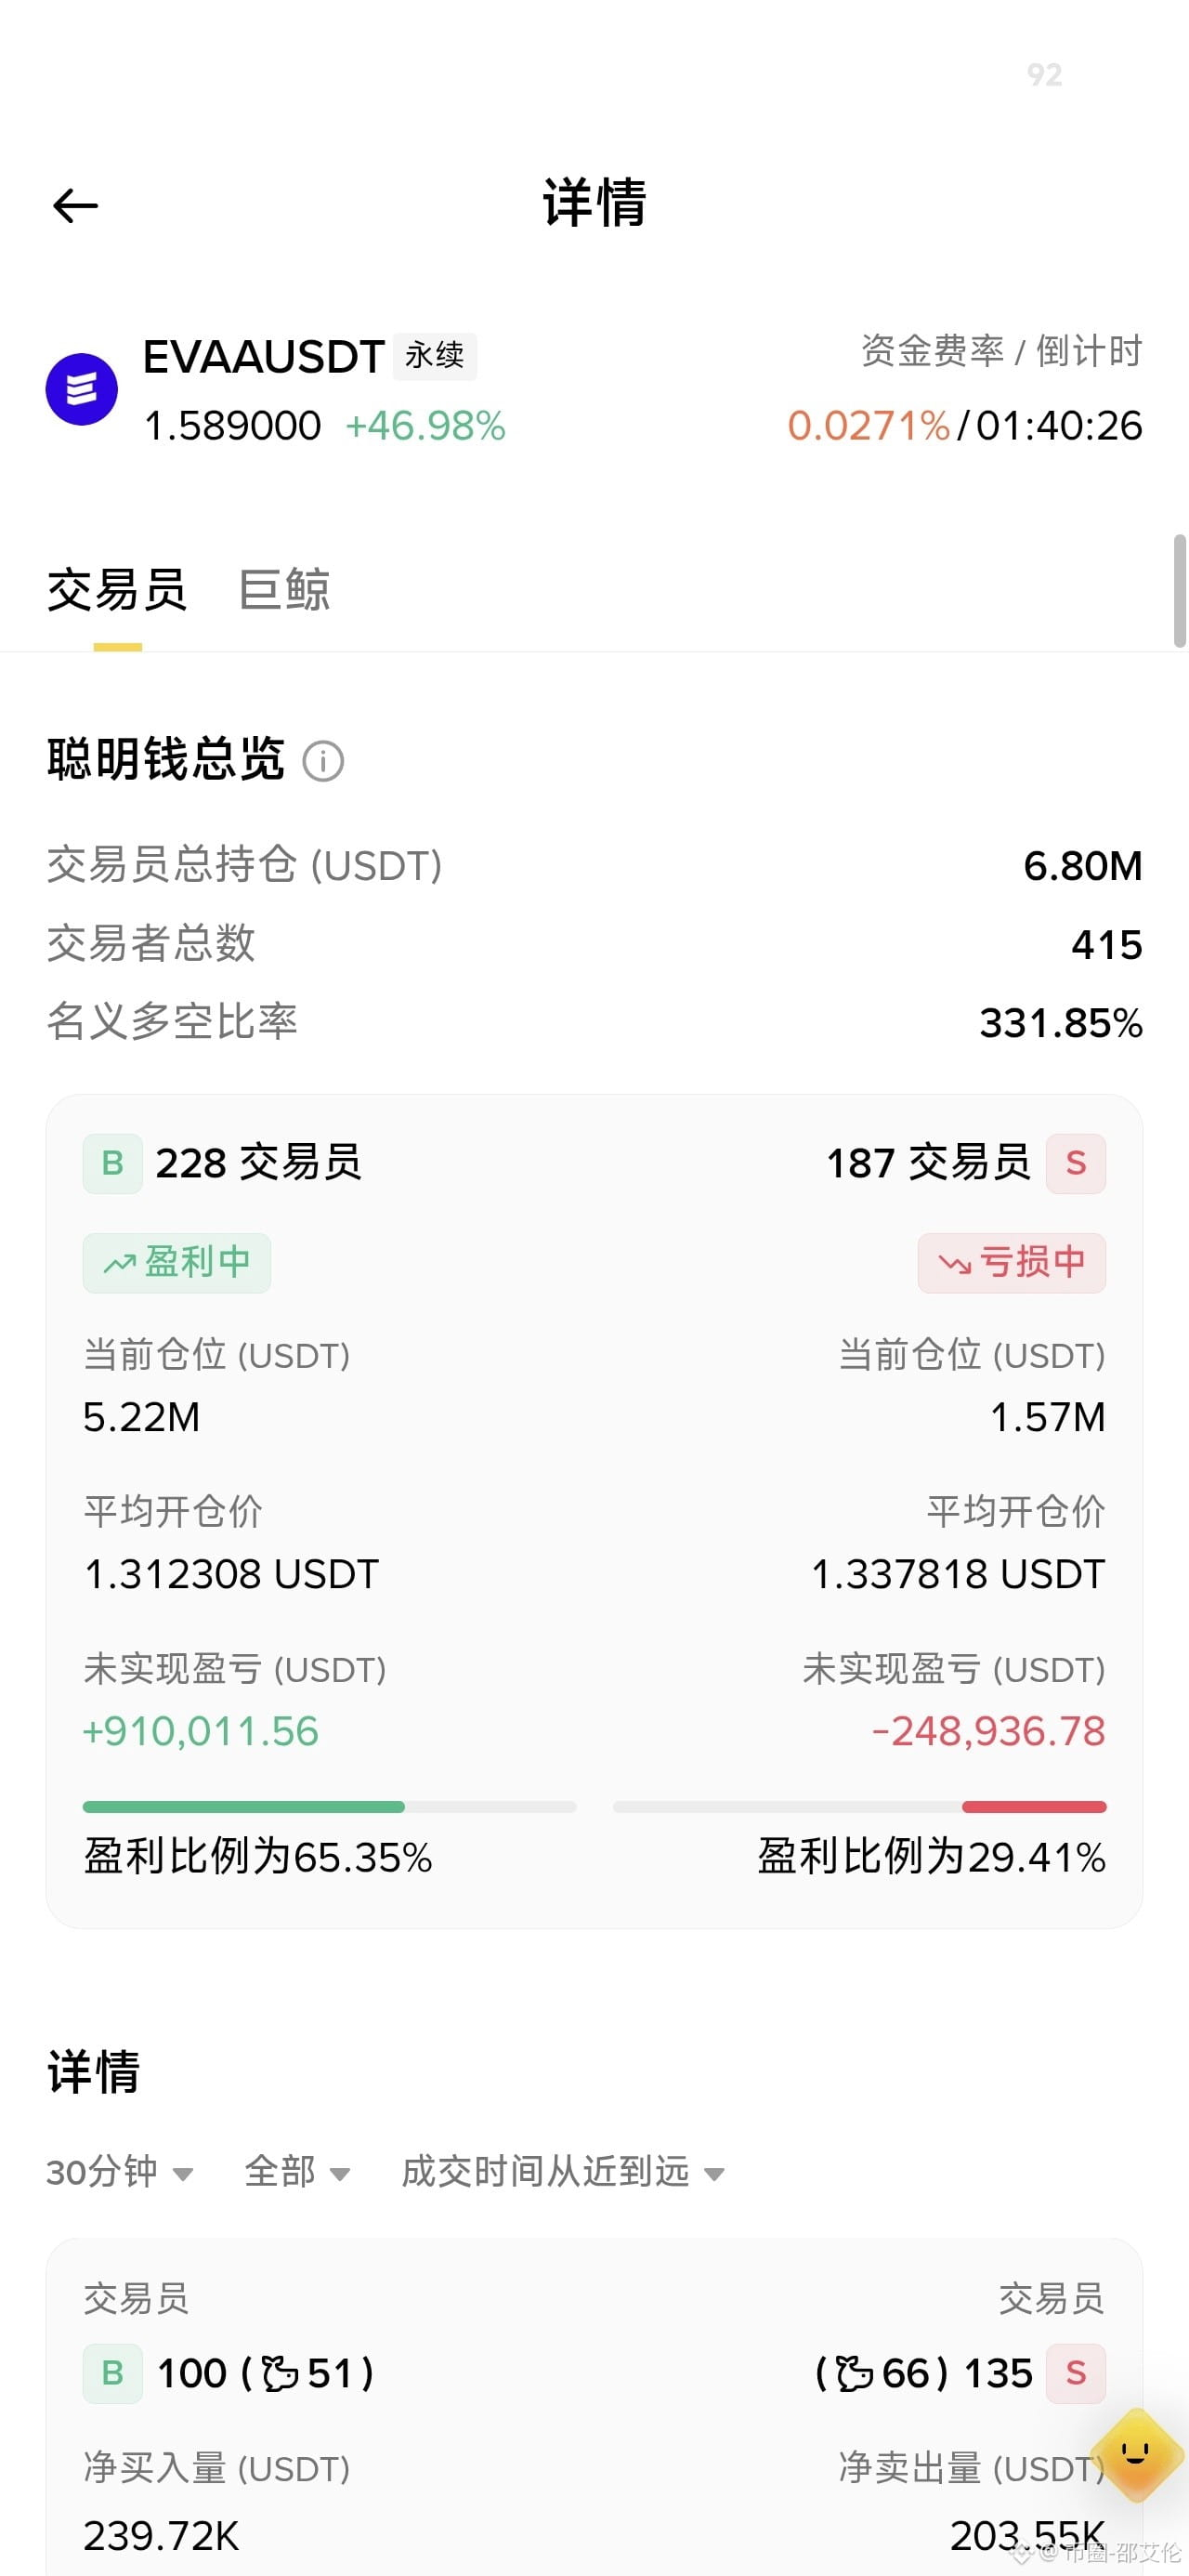
Take a look at these eye-popping “smart money” stats in chart one:
🧠 Whales are piling into longs, while shorts get steamrolled:
· Total positions stand at a whopping 6.8 million U!
· The notional long/short ratio has reached a staggering 331.85%! In other words, the major players are almost unanimously bullish.
· 228 bullish traders (in profit) entered at an average price of 1.31 and are now up a massive 910K U!
· Meanwhile, 187 short traders (in the red) entered at an average price of 1.33 and are now sitting on a hard loss of 248K U.
What does this tell us? The big players have the market firmly in their grip, using shorts as “fuel” to drive the price higher. Anyone who saw the rally and jumped in to short the top has been trapped by this relentless surge.
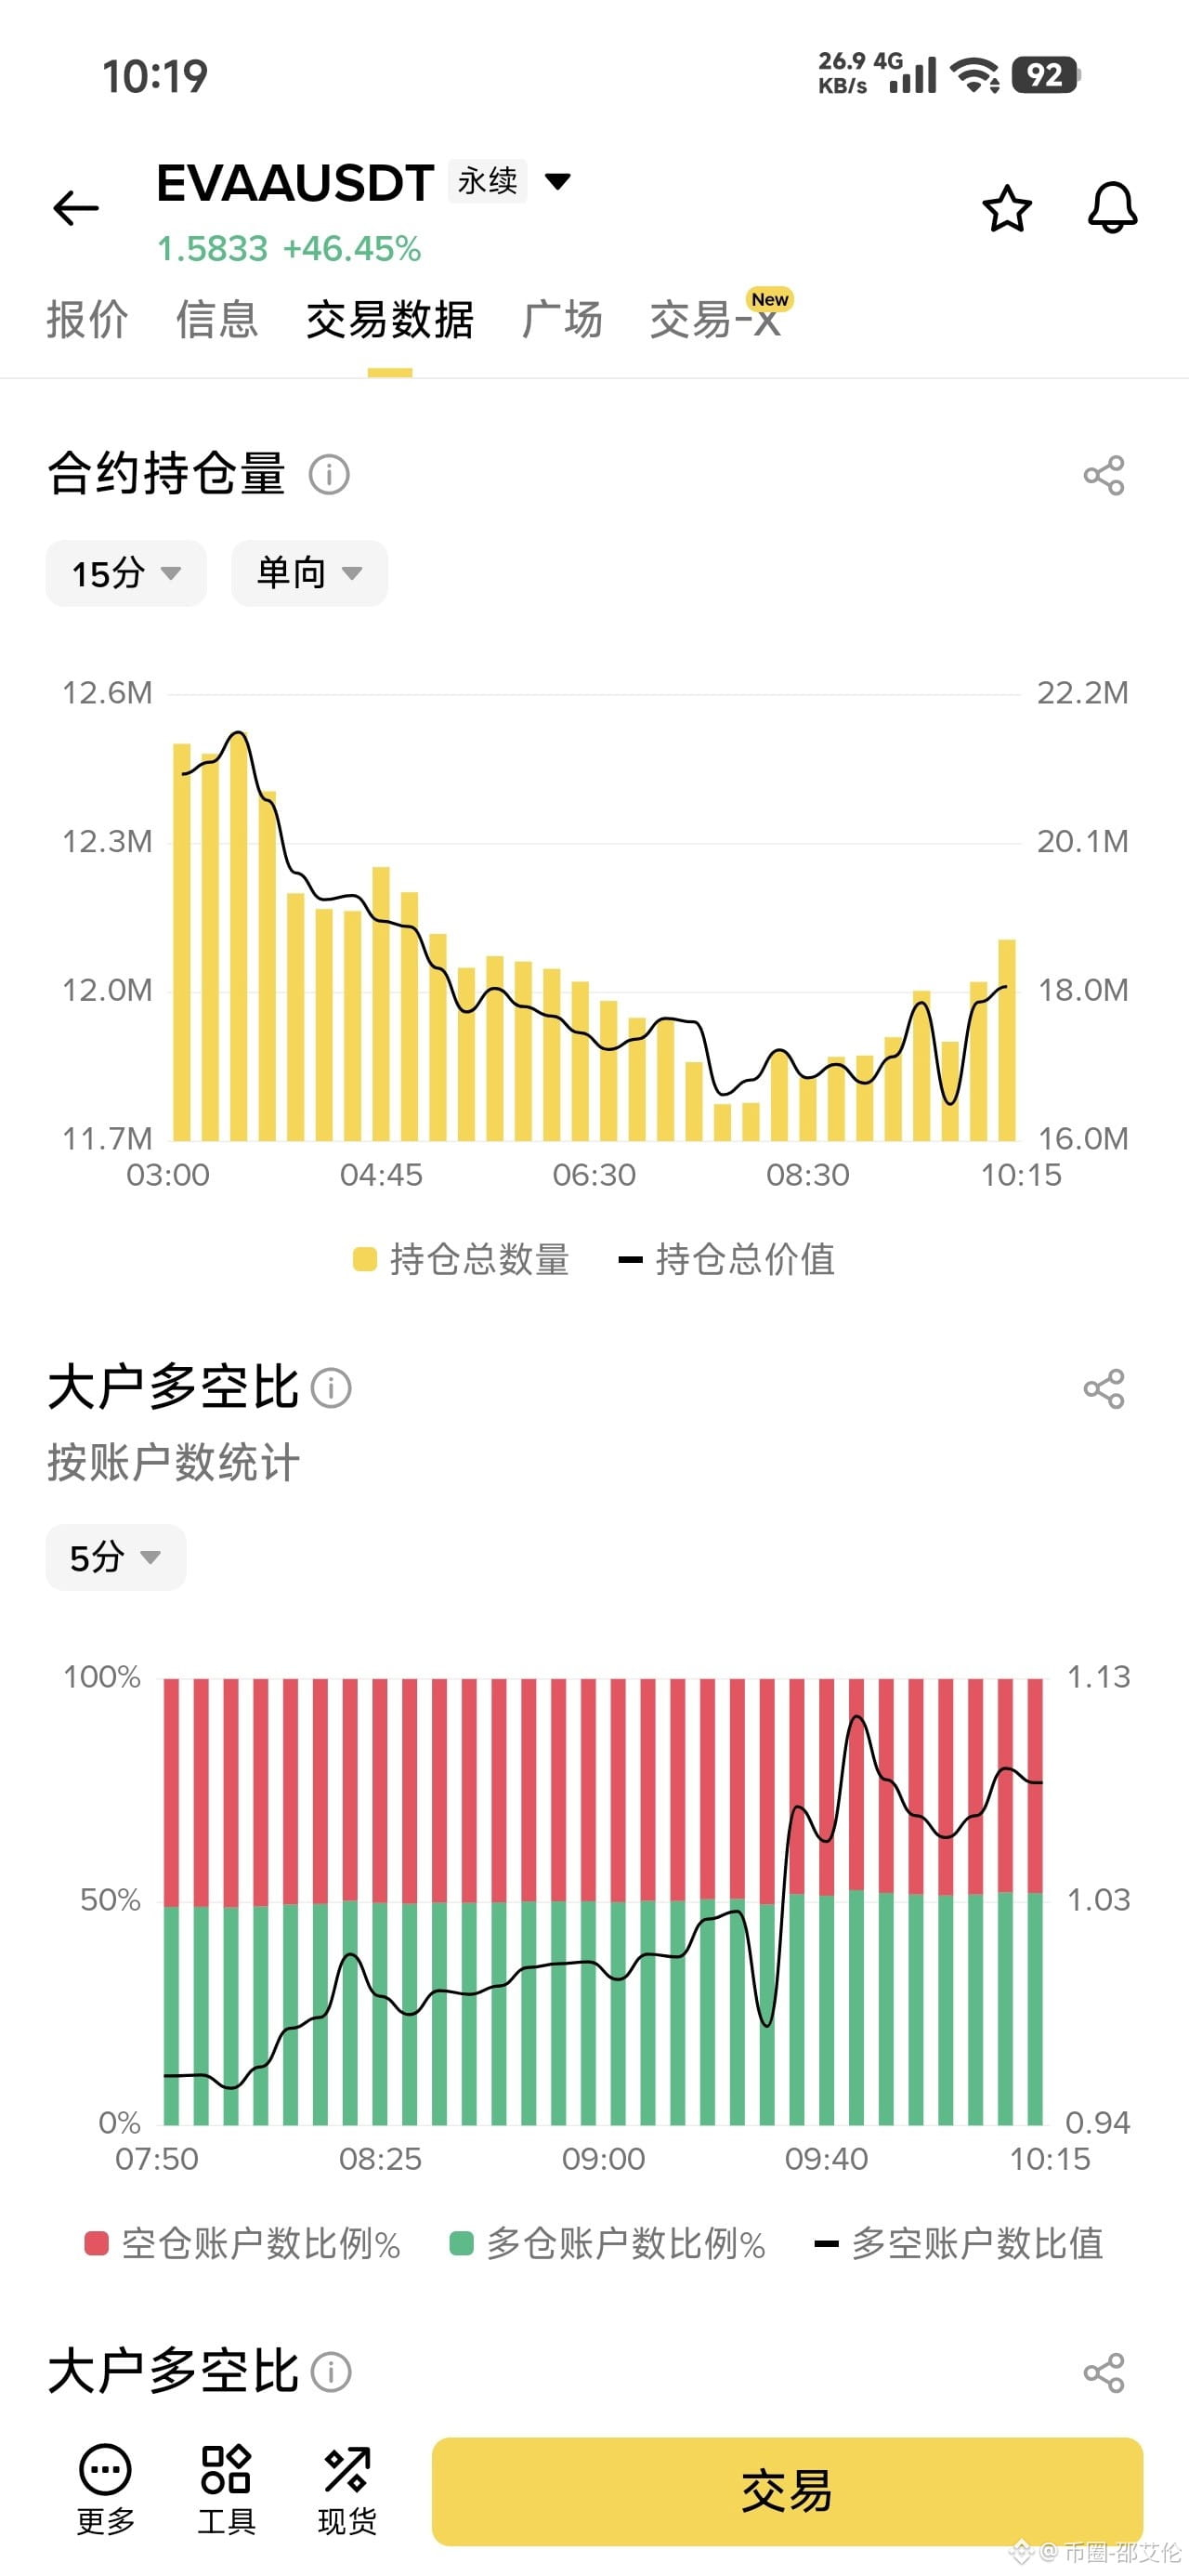
Now let’s look at the technical data in chart two—there’s a lot going on beneath the surface:
📉 Open interest is quietly shrinking:
Notice how the yellow bars (total open interest) have been falling from their highs, while the white line (total value of open interest) has started to turn upward near the bottom. What does that mean? Most likely, earlier short positions were forced to close at a loss, while the remaining longs are pushing the price higher with fewer positions and more concentrated capital.
📈 Retail traders are aggressively shorting, while big players are desperately going long:
Check the large-trader long/short ratio below (by account count). The green line (long accounts) surged after 8:30 a.m. and has stayed near its highs. Retail traders may think, “It’s gone up too much—it has to pull back,” and open shorts, only to get a harsh lesson from the big players.
But guys, the more an altcoin like this explodes against the trend, the more cautious you should be:
It isn’t following the broader market at all—it’s being driven entirely by market sentiment and capital flows. The harder it’s rallying now, the more brutally it could crash once the big players decide they’ve made enough and start taking profits. That 910K U in profit could be cashed out at any moment.
$EVAA
{future}(EVAAUSDT)
🚀 Up nearly 50%! EVAA defies the trend and rockets higher, as smart money rakes in 910K U and shorts get crushed!
Guys, while Bitcoin is grinding out a bottom, this altcoin is acting up again! Keeping an eye on the charts today, I spotted EVAA going absolutely wild against the trend, surging 46.98% in a single day to hit 1.589!
In a market that just keeps sliding, it’s a real standout. But the most exciting part isn’t the rally—it’s the incredibly intense battle over the money behind it.
Take a look at these eye-popping “smart money” stats in chart one:
🧠 Whales are piling into longs, while shorts get steamrolled:
· Total positions stand at a whopping 6.8 million U!
· The notional long/short ratio has reached a staggering 331.85%! In other words, the major players are almost unanimously bullish.
· 228 bullish traders (in profit) entered at an average price of 1.31 and are now up a massive 910K U!
· Meanwhile, 187 short traders (in the red) entered at an average price of 1.33 and are now sitting on a hard loss of 248K U.
What does this tell us? The big players have the market firmly in their grip, using shorts as “fuel” to drive the price higher. Anyone who saw the rally and jumped in to short the top has been trapped by this relentless surge.
Now let’s look at the technical data in chart two—there’s a lot going on beneath the surface:
📉 Open interest is quietly shrinking:
Notice how the yellow bars (total open interest) have been falling from their highs, while the white line (total value of open interest) has started to turn upward near the bottom. What does that mean? Most likely, earlier short positions were forced to close at a loss, while the remaining longs are pushing the price higher with fewer positions and more concentrated capital.
📈 Retail traders are aggressively shorting, while big players are desperately going long:
Check the large-trader long/short ratio below (by account count). The green line (long accounts) surged after 8:30 a.m. and has stayed near its highs. Retail traders may think, “It’s gone up too much—it has to pull back,” and open shorts, only to get a harsh lesson from the big players.
But guys, the more an altcoin like this explodes against the trend, the more cautious you should be:
It isn’t following the broader market at all—it’s being driven entirely by market sentiment and capital flows. The harder it’s rallying now, the more brutally it could crash once the big players decide they’ve made enough and start taking profits. That 910K U in profit could be cashed out at any moment.
$EVAA
Guys, while Bitcoin is grinding out a bottom, this altcoin is acting up again! Keeping an eye on the charts today, I spotted EVAA going absolutely wild against the trend, surging 46.98% in a single day to hit 1.589!
In a market that just keeps sliding, it’s a real standout. But the most exciting part isn’t the rally—it’s the incredibly intense battle over the money behind it.
Take a look at these eye-popping “smart money” stats in chart one:
🧠 Whales are piling into longs, while shorts get steamrolled:
· Total positions stand at a whopping 6.8 million U!
· The notional long/short ratio has reached a staggering 331.85%! In other words, the major players are almost unanimously bullish.
· 228 bullish traders (in profit) entered at an average price of 1.31 and are now up a massive 910K U!
· Meanwhile, 187 short traders (in the red) entered at an average price of 1.33 and are now sitting on a hard loss of 248K U.
What does this tell us? The big players have the market firmly in their grip, using shorts as “fuel” to drive the price higher. Anyone who saw the rally and jumped in to short the top has been trapped by this relentless surge.
Now let’s look at the technical data in chart two—there’s a lot going on beneath the surface:
📉 Open interest is quietly shrinking:
Notice how the yellow bars (total open interest) have been falling from their highs, while the white line (total value of open interest) has started to turn upward near the bottom. What does that mean? Most likely, earlier short positions were forced to close at a loss, while the remaining longs are pushing the price higher with fewer positions and more concentrated capital.
📈 Retail traders are aggressively shorting, while big players are desperately going long:
Check the large-trader long/short ratio below (by account count). The green line (long accounts) surged after 8:30 a.m. and has stayed near its highs. Retail traders may think, “It’s gone up too much—it has to pull back,” and open shorts, only to get a harsh lesson from the big players.
But guys, the more an altcoin like this explodes against the trend, the more cautious you should be:
It isn’t following the broader market at all—it’s being driven entirely by market sentiment and capital flows. The harder it’s rallying now, the more brutally it could crash once the big players decide they’ve made enough and start taking profits. That 910K U in profit could be cashed out at any moment.
$EVAA
13
·
--
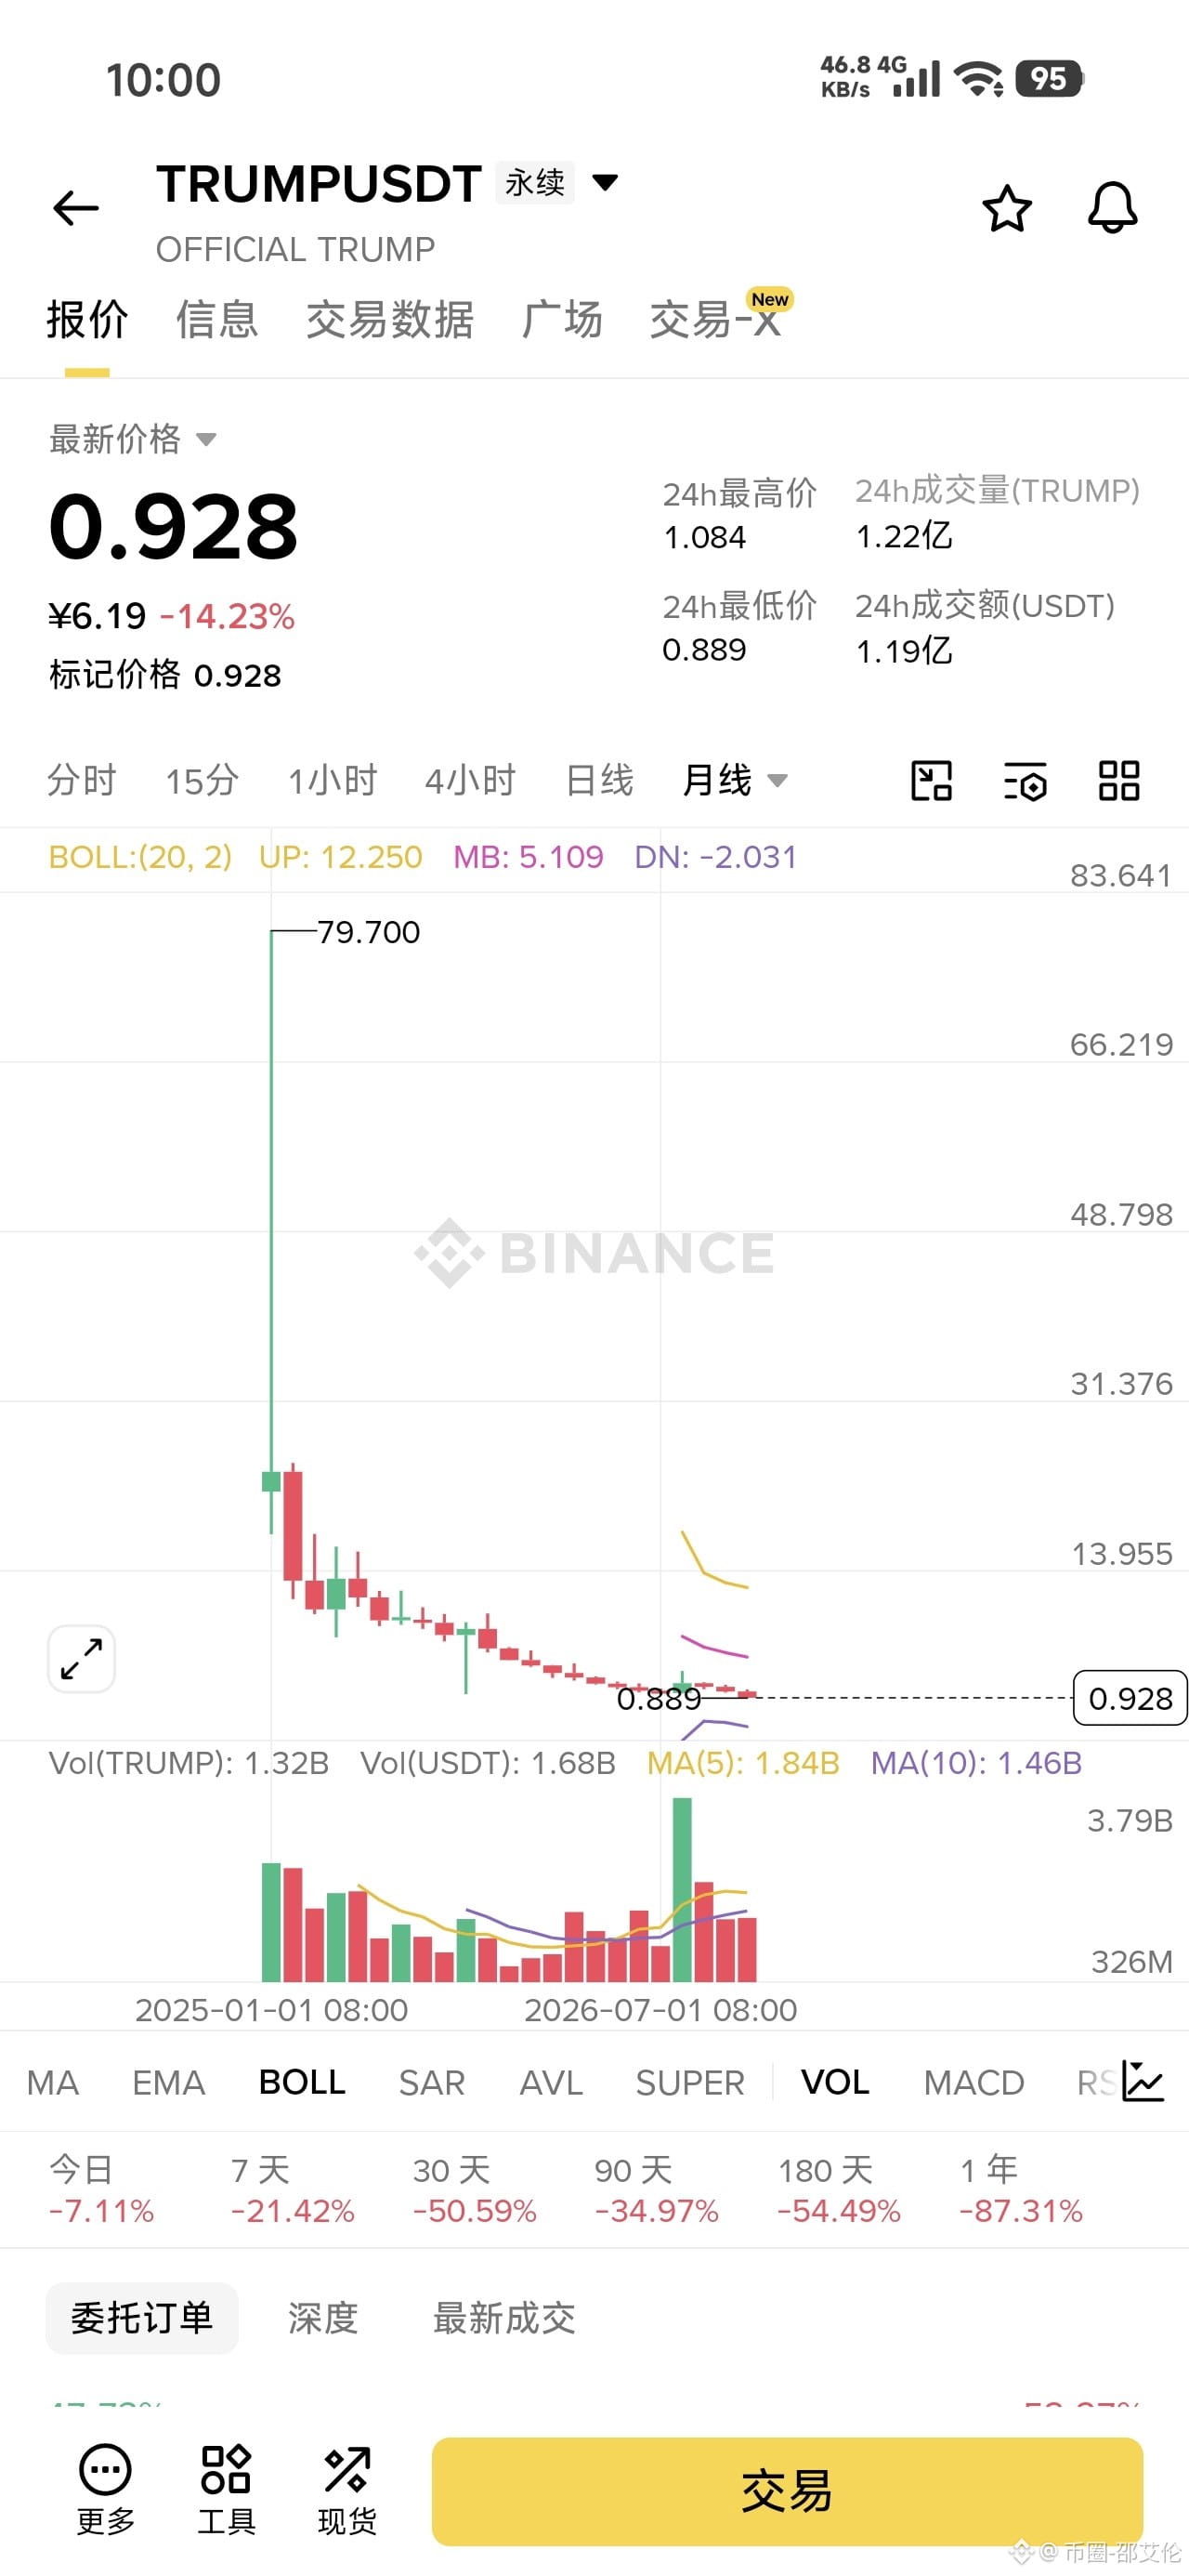
How could Trump hype things up so $TRUMP might rise back to 80?
{future}(TRUMPUSDT)
How could Trump hype things up so $TRUMP might rise back to 80?

3
1.8k
·
--
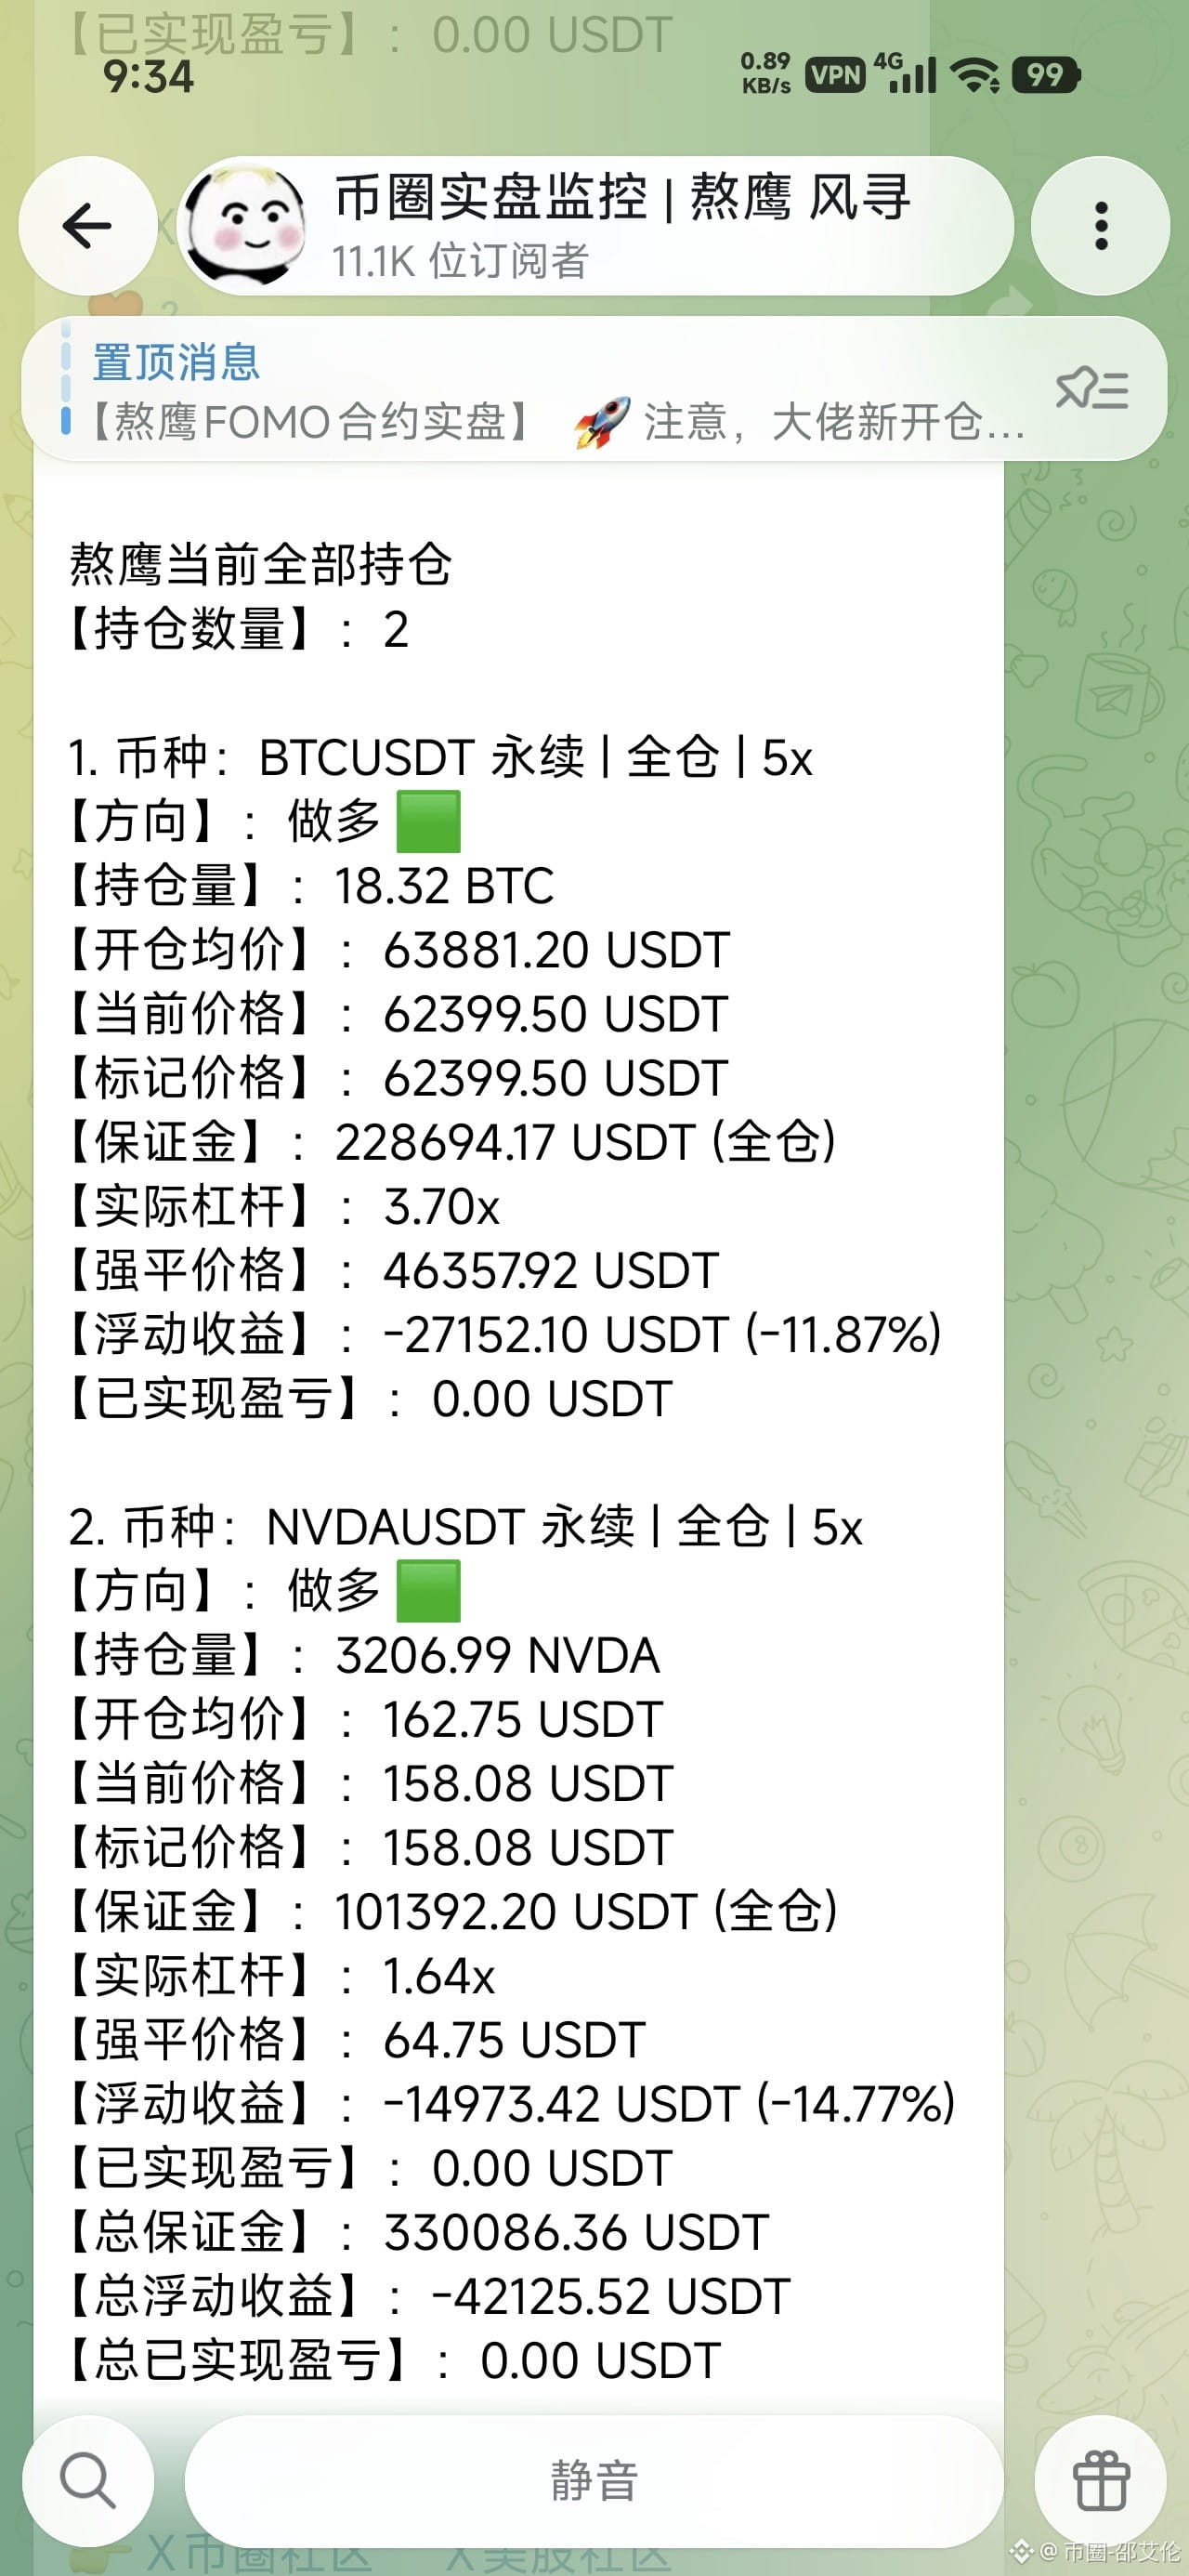
🚨 Tried to buy the dip but got caught! Latest positions of the Ao Ying whale revealed: doubling down on Bitcoin and Nvidia, with total unrealized losses exceeding 42,000 USDT!
Guys, we’re used to seeing “Ao Ying Capital” make a killing by shorting high and buying low. Today, let’s take a look at his latest wipeout! I just spotted these live positions in a Telegram monitoring channel, and this time the whale has well and truly landed in a trap.
Here’s a look at his current positions:
He’s currently holding just two positions, both long, and both using cross margin.
Overview:
He has put up 330,000 USDT in total margin, and his current total unrealized P&L is -42,125.52 USDT (about 300,000 RMB).
A closer look at the whale’s trades:
1. Got caught while loading up on the dip: He opened his Bitcoin position at 63,881, clearly looking to buy the bottom of this steep drop. But the price has continued falling and is now at 62,399. Although he’s sitting on an unrealized loss of over 10,000 USDT, he has 220,000 USDT in total margin as a buffer, and his liquidation price is 46,357—nowhere near the current price. That suggests his position management is excellent, and he’s not worried about being stuck in a short-term drawdown.
2. Venturing into U.S. stocks: Besides BTC, he also opened a cross-margin position in Nvidia (NVDA). His entry price was 162.75, and the current price is 158.08. Nvidia has taken a beating amid a string of black swan events, including “Jensen Huang leaving the company.” The whale is clearly trying to buy the dip in the “AI sector’s undisputed leader.” His actual leverage, however, is only 1.64x, and his liquidation price is 64.75, so he’s very safe.
3. The risk resilience of cross margin: Although both positions are in the red, that hefty margin shows the whale has kept plenty of funds in reserve. That’s the difference between an experienced trader and a retail sucker: never go all in, and always leave yourself a way out.
A lot of people might ask: Isn’t Ao Ying known for aggressive shorting? Why is he all long now?
That’s what it means to go with the trend. He profited from the plunge with high-level shorts earlier, and now that the price has fallen to the relatively low level of 63,000, he’s started positioning for a rebound by switching to longs. The correction just isn’t over yet, so for now he’s sitting on unrealized losses.
$BTC
{future}(BTCUSDT)
🚨 Tried to buy the dip but got caught! Latest positions of the Ao Ying whale revealed: doubling down on Bitcoin and Nvidia, with total unrealized losses exceeding 42,000 USDT!
Guys, we’re used to seeing “Ao Ying Capital” make a killing by shorting high and buying low. Today, let’s take a look at his latest wipeout! I just spotted these live positions in a Telegram monitoring channel, and this time the whale has well and truly landed in a trap.
Here’s a look at his current positions:
He’s currently holding just two positions, both long, and both using cross margin.
Overview:
He has put up 330,000 USDT in total margin, and his current total unrealized P&L is -42,125.52 USDT (about 300,000 RMB).
A closer look at the whale’s trades:
1. Got caught while loading up on the dip: He opened his Bitcoin position at 63,881, clearly looking to buy the bottom of this steep drop. But the price has continued falling and is now at 62,399. Although he’s sitting on an unrealized loss of over 10,000 USDT, he has 220,000 USDT in total margin as a buffer, and his liquidation price is 46,357—nowhere near the current price. That suggests his position management is excellent, and he’s not worried about being stuck in a short-term drawdown.
2. Venturing into U.S. stocks: Besides BTC, he also opened a cross-margin position in Nvidia (NVDA). His entry price was 162.75, and the current price is 158.08. Nvidia has taken a beating amid a string of black swan events, including “Jensen Huang leaving the company.” The whale is clearly trying to buy the dip in the “AI sector’s undisputed leader.” His actual leverage, however, is only 1.64x, and his liquidation price is 64.75, so he’s very safe.
3. The risk resilience of cross margin: Although both positions are in the red, that hefty margin shows the whale has kept plenty of funds in reserve. That’s the difference between an experienced trader and a retail sucker: never go all in, and always leave yourself a way out.
A lot of people might ask: Isn’t Ao Ying known for aggressive shorting? Why is he all long now?
That’s what it means to go with the trend. He profited from the plunge with high-level shorts earlier, and now that the price has fallen to the relatively low level of 63,000, he’s started positioning for a rebound by switching to longs. The correction just isn’t over yet, so for now he’s sitting on unrealized losses.
$BTC
Guys, we’re used to seeing “Ao Ying Capital” make a killing by shorting high and buying low. Today, let’s take a look at his latest wipeout! I just spotted these live positions in a Telegram monitoring channel, and this time the whale has well and truly landed in a trap.
Here’s a look at his current positions:
He’s currently holding just two positions, both long, and both using cross margin.
Overview:
He has put up 330,000 USDT in total margin, and his current total unrealized P&L is -42,125.52 USDT (about 300,000 RMB).
A closer look at the whale’s trades:
1. Got caught while loading up on the dip: He opened his Bitcoin position at 63,881, clearly looking to buy the bottom of this steep drop. But the price has continued falling and is now at 62,399. Although he’s sitting on an unrealized loss of over 10,000 USDT, he has 220,000 USDT in total margin as a buffer, and his liquidation price is 46,357—nowhere near the current price. That suggests his position management is excellent, and he’s not worried about being stuck in a short-term drawdown.
2. Venturing into U.S. stocks: Besides BTC, he also opened a cross-margin position in Nvidia (NVDA). His entry price was 162.75, and the current price is 158.08. Nvidia has taken a beating amid a string of black swan events, including “Jensen Huang leaving the company.” The whale is clearly trying to buy the dip in the “AI sector’s undisputed leader.” His actual leverage, however, is only 1.64x, and his liquidation price is 64.75, so he’s very safe.
3. The risk resilience of cross margin: Although both positions are in the red, that hefty margin shows the whale has kept plenty of funds in reserve. That’s the difference between an experienced trader and a retail sucker: never go all in, and always leave yourself a way out.
A lot of people might ask: Isn’t Ao Ying known for aggressive shorting? Why is he all long now?
That’s what it means to go with the trend. He profited from the plunge with high-level shorts earlier, and now that the price has fallen to the relatively low level of 63,000, he’s started positioning for a rebound by switching to longs. The correction just isn’t over yet, so for now he’s sitting on unrealized losses.
$BTC
1
152
·
--
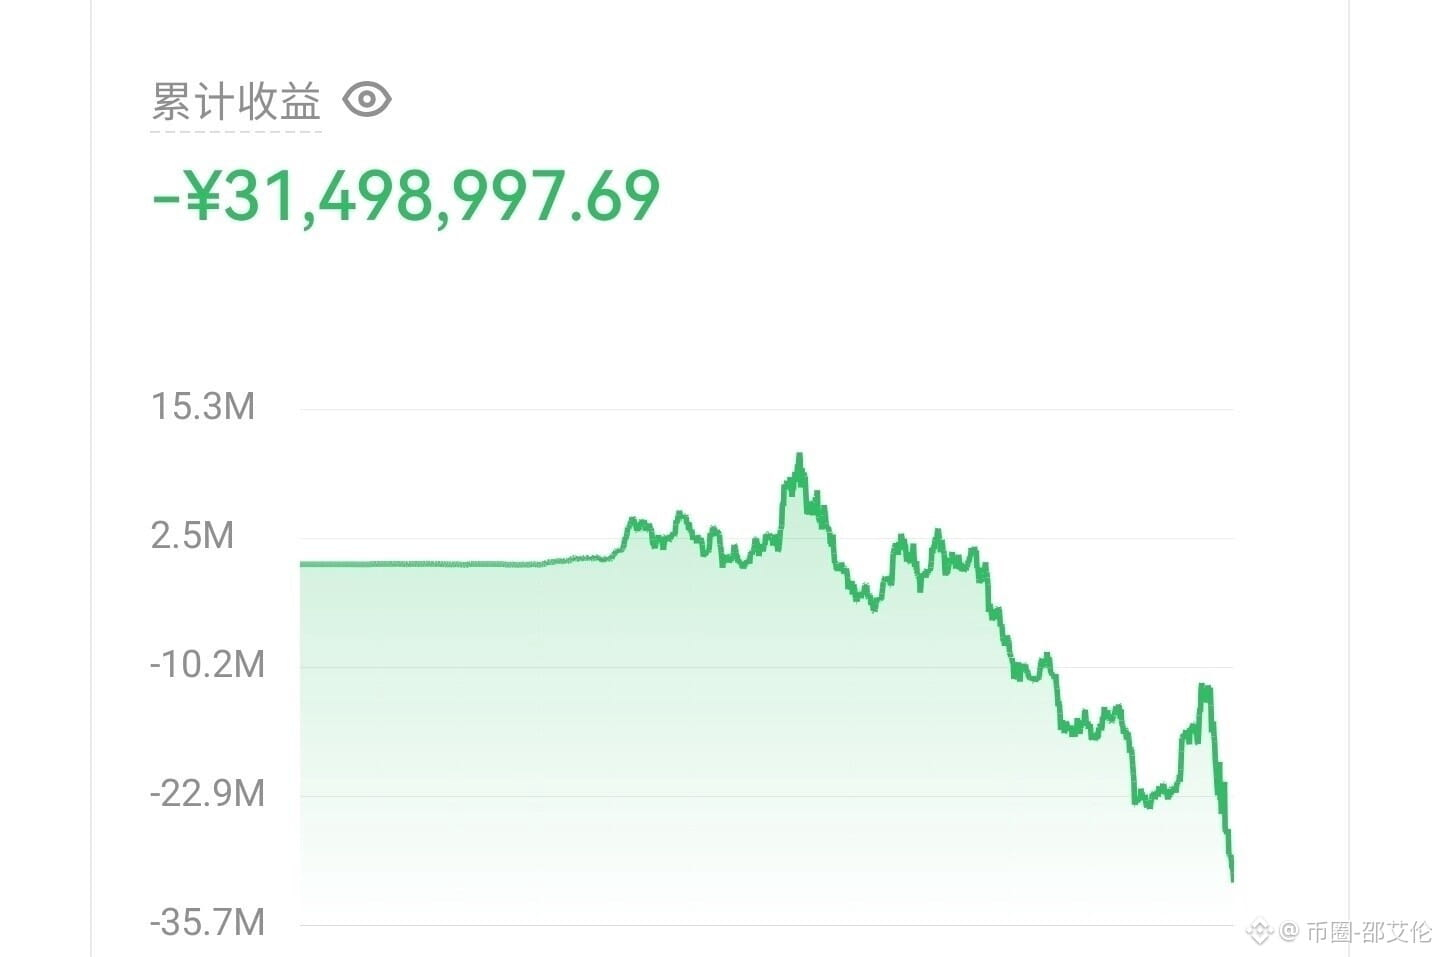
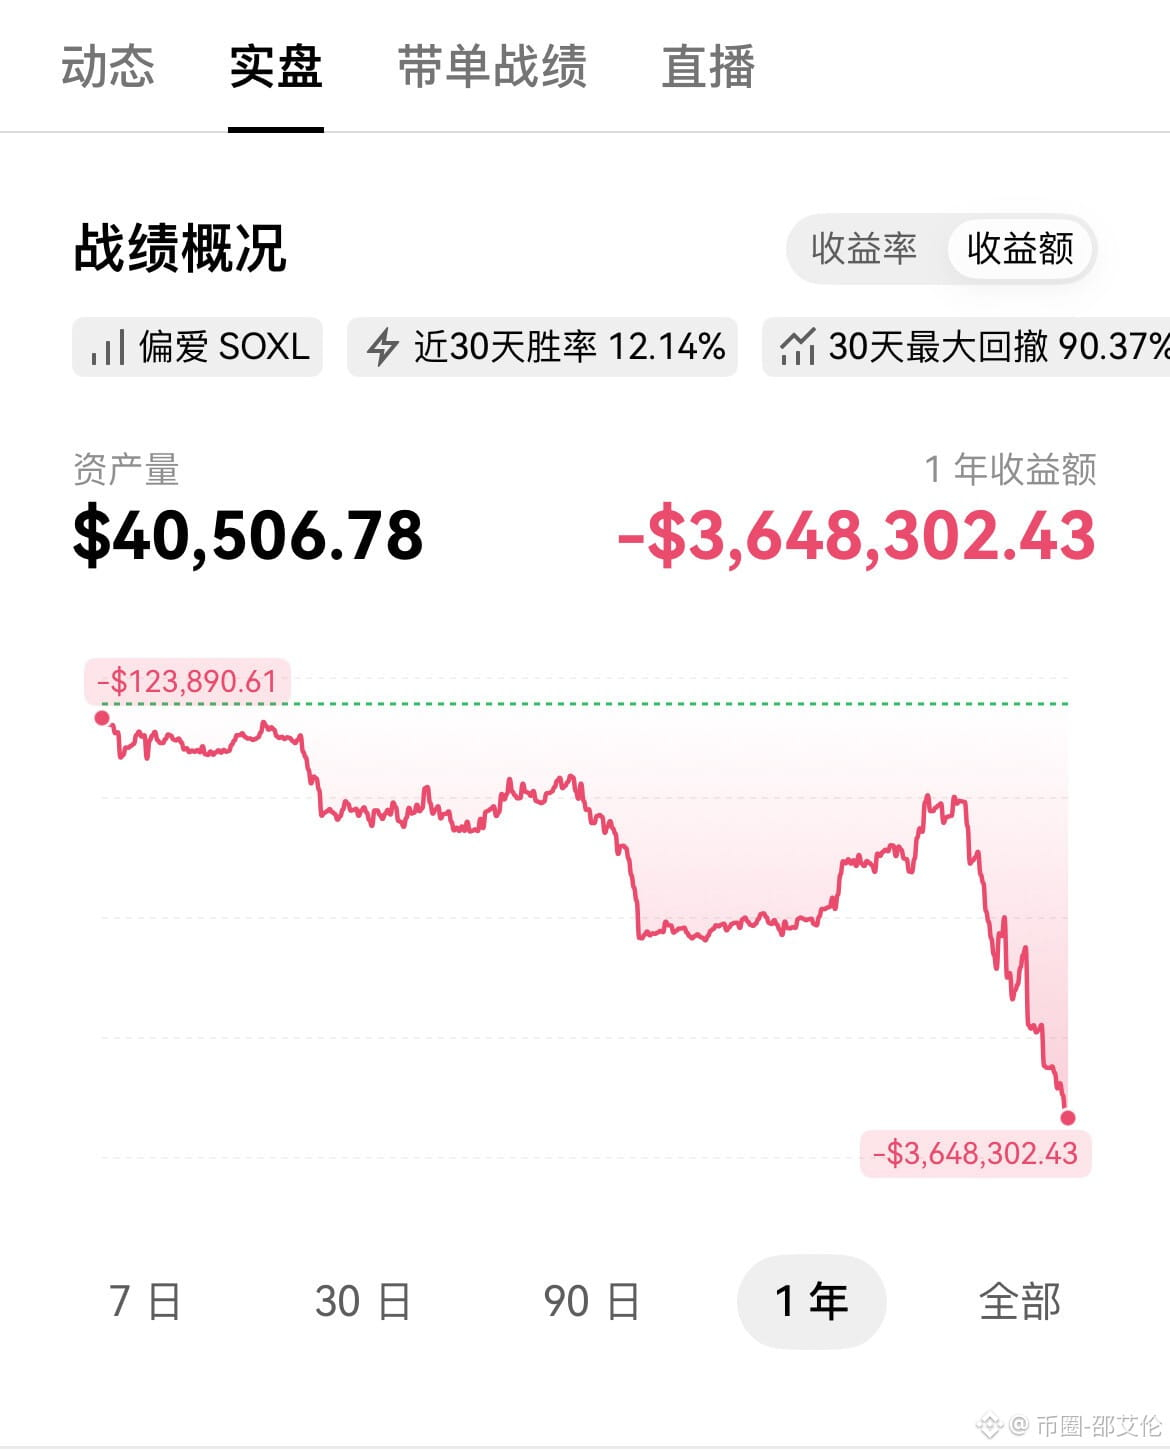
🩸 The whale has fallen! Down $3.64 million in a year. He said he’d quit once he’d made 30 million, but ended up losing more than 30 million!
Guys, the market has been falling so hard these past few days it’s hard to breathe. But when I saw this screenshot of “Baibai Ge”’s live trading account, I was genuinely speechless. This isn’t just a loss—it’s a downright “wealth-shredding machine”!
Like this guy said, it’s really hard to watch. He said he’d quit once he’d made 30 million, but he’s ended up losing more than 30 million yuan for real!
Take a look at this brutal track record. It’s shocking:
💀 1-year P&L: -$3,648,302** (US dollars! Equivalent to more than ¥26 million)
💀 **Total P&L:** **-¥31,498,997** (Chinese yuan!)
📉 **Account assets:** Once worth tens of millions, the account is now down to a pitiful **$40,506.
📉 Win rate over the past 30 days: a dismal 12.14%.
📉 Maximum drawdown: 90.37%! The equity curve plunged almost vertically in a “cliff-like” drop toward the end.
How did he turn such a strong hand into a complete mess?
1. Extreme greed and refusing to exit at the top: He held his long position for a full 9 months. When BTC surged to 87,000, his profits were enormous, but he didn’t take profit. Now that it’s fallen below 70,000, all those gains are gone—and he’s even in the red.
2. Recklessly using high leverage: Of his three BTC long positions, one was 20x isolated margin, and the other two were 25x cross margin! In a one-way crash, 25x cross margin means a 4% drop is all it takes to wipe you out. In the end, the returns were driven down to -45.06% and -36.25%.
3. The market taught him a harsh lesson: The market never plays fair. One headline or one black swan event can instantly wipe out someone who’s heavily invested with high leverage. This crash smashed straight through his capital safety net.
Guys, this painful lesson is right in front of us:
Never assume that “being bullish on the big picture means you can load up on high leverage and ride it out.” In extreme wick-inducing market conditions, the margin for error with full positions and high leverage is zero! Profits are just paper wealth while you’re winning, but losses come out of your real pocket.
Losing 30 million in a year would have broken most people. Looking at this cliff-like equity curve is enough to send a chill down your spine. I hope this big player can get back on his feet, and I hope we can all learn from this: in this market, staying alive is always more important than how much you make.
$BTC
{future}(BTCUSDT)
🩸 The whale has fallen! Down $3.64 million in a year. He said he’d quit once he’d made 30 million, but ended up losing more than 30 million!
Guys, the market has been falling so hard these past few days it’s hard to breathe. But when I saw this screenshot of “Baibai Ge”’s live trading account, I was genuinely speechless. This isn’t just a loss—it’s a downright “wealth-shredding machine”!
Like this guy said, it’s really hard to watch. He said he’d quit once he’d made 30 million, but he’s ended up losing more than 30 million yuan for real!
Take a look at this brutal track record. It’s shocking:
💀 1-year P&L: -$3,648,302** (US dollars! Equivalent to more than ¥26 million)
💀 **Total P&L:** **-¥31,498,997** (Chinese yuan!)
📉 **Account assets:** Once worth tens of millions, the account is now down to a pitiful **$40,506.
📉 Win rate over the past 30 days: a dismal 12.14%.
📉 Maximum drawdown: 90.37%! The equity curve plunged almost vertically in a “cliff-like” drop toward the end.
How did he turn such a strong hand into a complete mess?
1. Extreme greed and refusing to exit at the top: He held his long position for a full 9 months. When BTC surged to 87,000, his profits were enormous, but he didn’t take profit. Now that it’s fallen below 70,000, all those gains are gone—and he’s even in the red.
2. Recklessly using high leverage: Of his three BTC long positions, one was 20x isolated margin, and the other two were 25x cross margin! In a one-way crash, 25x cross margin means a 4% drop is all it takes to wipe you out. In the end, the returns were driven down to -45.06% and -36.25%.
3. The market taught him a harsh lesson: The market never plays fair. One headline or one black swan event can instantly wipe out someone who’s heavily invested with high leverage. This crash smashed straight through his capital safety net.
Guys, this painful lesson is right in front of us:
Never assume that “being bullish on the big picture means you can load up on high leverage and ride it out.” In extreme wick-inducing market conditions, the margin for error with full positions and high leverage is zero! Profits are just paper wealth while you’re winning, but losses come out of your real pocket.
Losing 30 million in a year would have broken most people. Looking at this cliff-like equity curve is enough to send a chill down your spine. I hope this big player can get back on his feet, and I hope we can all learn from this: in this market, staying alive is always more important than how much you make.
$BTC
Guys, the market has been falling so hard these past few days it’s hard to breathe. But when I saw this screenshot of “Baibai Ge”’s live trading account, I was genuinely speechless. This isn’t just a loss—it’s a downright “wealth-shredding machine”!
Like this guy said, it’s really hard to watch. He said he’d quit once he’d made 30 million, but he’s ended up losing more than 30 million yuan for real!
Take a look at this brutal track record. It’s shocking:
💀 1-year P&L: -$3,648,302** (US dollars! Equivalent to more than ¥26 million)
💀 **Total P&L:** **-¥31,498,997** (Chinese yuan!)
📉 **Account assets:** Once worth tens of millions, the account is now down to a pitiful **$40,506.
📉 Win rate over the past 30 days: a dismal 12.14%.
📉 Maximum drawdown: 90.37%! The equity curve plunged almost vertically in a “cliff-like” drop toward the end.
How did he turn such a strong hand into a complete mess?
1. Extreme greed and refusing to exit at the top: He held his long position for a full 9 months. When BTC surged to 87,000, his profits were enormous, but he didn’t take profit. Now that it’s fallen below 70,000, all those gains are gone—and he’s even in the red.
2. Recklessly using high leverage: Of his three BTC long positions, one was 20x isolated margin, and the other two were 25x cross margin! In a one-way crash, 25x cross margin means a 4% drop is all it takes to wipe you out. In the end, the returns were driven down to -45.06% and -36.25%.
3. The market taught him a harsh lesson: The market never plays fair. One headline or one black swan event can instantly wipe out someone who’s heavily invested with high leverage. This crash smashed straight through his capital safety net.
Guys, this painful lesson is right in front of us:
Never assume that “being bullish on the big picture means you can load up on high leverage and ride it out.” In extreme wick-inducing market conditions, the margin for error with full positions and high leverage is zero! Profits are just paper wealth while you’re winning, but losses come out of your real pocket.
Losing 30 million in a year would have broken most people. Looking at this cliff-like equity curve is enough to send a chill down your spine. I hope this big player can get back on his feet, and I hope we can all learn from this: in this market, staying alive is always more important than how much you make.
$BTC
2
1.9k
·
--
I just read Yi Lihua’s new article. He recapped an hour-long conversation he had with Sun Yuchen (Brother Sun) last night, and there was a lot of information.
Yi Lihua mentioned that after selling the top on Bitcoin at $86,000, he spent a long time waiting for a chance to buy the dip. But he’s come around to this view: “It’s perfectly normal to liquidate when circumstances change. You can’t keep making the same mistake.”
The two of them are no longer just thinking about Bitcoin trading data; they’re looking at the broader U.S. stock market over the next year or two. What’s the key variable? The Democrats coming to power, along with the Jensen Huang incident, has disrupted the AI ecosystem in the short term.
Brother Sun’s current view is crystal clear: bearish on the Nasdaq, bearish on Bitcoin. He even said bluntly that liquidating AI stocks now might turn out to be the perfect move before a future peak.
There are just two reasons behind this pessimism. First, over the past few years, AI giants like Nvidia have been fueled by boundless optimism about the trend, while leverage has far outpaced actual revenue growth. The bubble is obvious. Second, if a leading company runs into trouble, the entire supply chain could collapse along with it.
$BTC
{future}(BTCUSDT)
I just read Yi Lihua’s new article. He recapped an hour-long conversation he had with Sun Yuchen (Brother Sun) last night, and there was a lot of information.
Yi Lihua mentioned that after selling the top on Bitcoin at $86,000, he spent a long time waiting for a chance to buy the dip. But he’s come around to this view: “It’s perfectly normal to liquidate when circumstances change. You can’t keep making the same mistake.”
The two of them are no longer just thinking about Bitcoin trading data; they’re looking at the broader U.S. stock market over the next year or two. What’s the key variable? The Democrats coming to power, along with the Jensen Huang incident, has disrupted the AI ecosystem in the short term.
Brother Sun’s current view is crystal clear: bearish on the Nasdaq, bearish on Bitcoin. He even said bluntly that liquidating AI stocks now might turn out to be the perfect move before a future peak.
There are just two reasons behind this pessimism. First, over the past few years, AI giants like Nvidia have been fueled by boundless optimism about the trend, while leverage has far outpaced actual revenue growth. The bubble is obvious. Second, if a leading company runs into trouble, the entire supply chain could collapse along with it.
$BTC
Yi Lihua mentioned that after selling the top on Bitcoin at $86,000, he spent a long time waiting for a chance to buy the dip. But he’s come around to this view: “It’s perfectly normal to liquidate when circumstances change. You can’t keep making the same mistake.”
The two of them are no longer just thinking about Bitcoin trading data; they’re looking at the broader U.S. stock market over the next year or two. What’s the key variable? The Democrats coming to power, along with the Jensen Huang incident, has disrupted the AI ecosystem in the short term.
Brother Sun’s current view is crystal clear: bearish on the Nasdaq, bearish on Bitcoin. He even said bluntly that liquidating AI stocks now might turn out to be the perfect move before a future peak.
There are just two reasons behind this pessimism. First, over the past few years, AI giants like Nvidia have been fueled by boundless optimism about the trend, while leverage has far outpaced actual revenue growth. The bubble is obvious. Second, if a leading company runs into trouble, the entire supply chain could collapse along with it.
$BTC

1
341
·
--
If you win, you're successful; if you lose, you're a lousy gambling addict. $BTC
If you win, you're successful; if you lose, you're a lousy gambling addict. $BTC
59
·
--
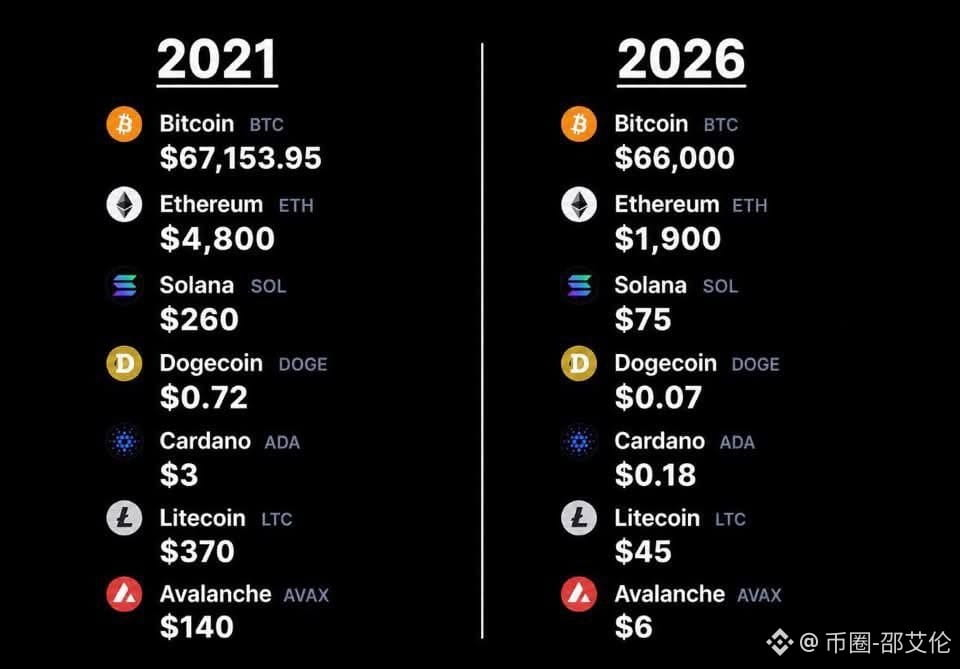
🩸 Shocking! 2021 vs. 2026 crypto price comparison: five years later, altcoins wiped out, while Bitcoin is still Bitcoin!
Guys, I saw an incredibly painful comparison chart today. It’s practically the perfect snapshot of “the crypto market’s retail investor bloodbath.” The left shows prices at the peak of the 2021 bull market, and the right shows prices now, in 2026.
There are only four words to describe it: absolutely brutal!
📉 Altcoin massacre—an ankle chop would’ve been a blessing:
· ETH (Ethereum): Fell from 4,800 to 1,900, dropping straight below the knee.
· SOL: Fell from 260 to 75, a drop of over 70%.
· DOGE (Dogecoin): Fell from 0.72 to 0.07, wiping out an entire zero!
· ADA (Cardano): Fell from 3 to 0.18. This wasn’t just a 50% cut—it was chopped right down to the ankle.
· LTC (Litecoin): Fell from 370 to 45, losing nearly 90%!
· AVAX (Avalanche): The worst of them all, dropping straight from 140 to 6 bucks—a 95% crash!
📈 The only saving grace: Bitcoin (BTC)
Amid all this sea of red (losses), only Bitcoin has held firm. From 67,153 in 2021, it somehow weathered the brutal market cycle and is now hovering around 66,000—almost back to its peak from that year.
What bloody truths does this chart reveal?
1️⃣ Bitcoin stands the test of time; altcoins come and go. BTC is the only one to make it through bull and bear markets—it’s the real hard currency. Those altcoin projects that were once hyped to the moon, claiming they’d upend Ethereum or replace Bitcoin, have all turned to dust five years later.
2️⃣ Don’t put your faith in altcoins. How many people held ADA or AVAX in 2021, thinking they were making value investments, only to be stuck holding the bag for five years? Altcoins are ultimately headed for zero. Once the whales have finished selling, all that’s left is retail investors’ despair.
3️⃣ Holding altcoins in spot for the long haul is slow-motion suicide. If you’d held these spot assets for five years, watched Bitcoin hit new highs while your own account shrank by 80%–90%, the psychological torture would be worse than getting liquidated.
This chart really sounds the death knell for everyone who likes to “go all in on altcoins.” Altcoins can certainly take off in a bull market, but remember to get out! Don’t wait for the tide to go out before realizing you’re swimming naked.
$BTC
{future}(BTCUSDT)
🩸 Shocking! 2021 vs. 2026 crypto price comparison: five years later, altcoins wiped out, while Bitcoin is still Bitcoin!
Guys, I saw an incredibly painful comparison chart today. It’s practically the perfect snapshot of “the crypto market’s retail investor bloodbath.” The left shows prices at the peak of the 2021 bull market, and the right shows prices now, in 2026.
There are only four words to describe it: absolutely brutal!
📉 Altcoin massacre—an ankle chop would’ve been a blessing:
· ETH (Ethereum): Fell from 4,800 to 1,900, dropping straight below the knee.
· SOL: Fell from 260 to 75, a drop of over 70%.
· DOGE (Dogecoin): Fell from 0.72 to 0.07, wiping out an entire zero!
· ADA (Cardano): Fell from 3 to 0.18. This wasn’t just a 50% cut—it was chopped right down to the ankle.
· LTC (Litecoin): Fell from 370 to 45, losing nearly 90%!
· AVAX (Avalanche): The worst of them all, dropping straight from 140 to 6 bucks—a 95% crash!
📈 The only saving grace: Bitcoin (BTC)
Amid all this sea of red (losses), only Bitcoin has held firm. From 67,153 in 2021, it somehow weathered the brutal market cycle and is now hovering around 66,000—almost back to its peak from that year.
What bloody truths does this chart reveal?
1️⃣ Bitcoin stands the test of time; altcoins come and go. BTC is the only one to make it through bull and bear markets—it’s the real hard currency. Those altcoin projects that were once hyped to the moon, claiming they’d upend Ethereum or replace Bitcoin, have all turned to dust five years later.
2️⃣ Don’t put your faith in altcoins. How many people held ADA or AVAX in 2021, thinking they were making value investments, only to be stuck holding the bag for five years? Altcoins are ultimately headed for zero. Once the whales have finished selling, all that’s left is retail investors’ despair.
3️⃣ Holding altcoins in spot for the long haul is slow-motion suicide. If you’d held these spot assets for five years, watched Bitcoin hit new highs while your own account shrank by 80%–90%, the psychological torture would be worse than getting liquidated.
This chart really sounds the death knell for everyone who likes to “go all in on altcoins.” Altcoins can certainly take off in a bull market, but remember to get out! Don’t wait for the tide to go out before realizing you’re swimming naked.
$BTC
Guys, I saw an incredibly painful comparison chart today. It’s practically the perfect snapshot of “the crypto market’s retail investor bloodbath.” The left shows prices at the peak of the 2021 bull market, and the right shows prices now, in 2026.
There are only four words to describe it: absolutely brutal!
📉 Altcoin massacre—an ankle chop would’ve been a blessing:
· ETH (Ethereum): Fell from 4,800 to 1,900, dropping straight below the knee.
· SOL: Fell from 260 to 75, a drop of over 70%.
· DOGE (Dogecoin): Fell from 0.72 to 0.07, wiping out an entire zero!
· ADA (Cardano): Fell from 3 to 0.18. This wasn’t just a 50% cut—it was chopped right down to the ankle.
· LTC (Litecoin): Fell from 370 to 45, losing nearly 90%!
· AVAX (Avalanche): The worst of them all, dropping straight from 140 to 6 bucks—a 95% crash!
📈 The only saving grace: Bitcoin (BTC)
Amid all this sea of red (losses), only Bitcoin has held firm. From 67,153 in 2021, it somehow weathered the brutal market cycle and is now hovering around 66,000—almost back to its peak from that year.
What bloody truths does this chart reveal?
1️⃣ Bitcoin stands the test of time; altcoins come and go. BTC is the only one to make it through bull and bear markets—it’s the real hard currency. Those altcoin projects that were once hyped to the moon, claiming they’d upend Ethereum or replace Bitcoin, have all turned to dust five years later.
2️⃣ Don’t put your faith in altcoins. How many people held ADA or AVAX in 2021, thinking they were making value investments, only to be stuck holding the bag for five years? Altcoins are ultimately headed for zero. Once the whales have finished selling, all that’s left is retail investors’ despair.
3️⃣ Holding altcoins in spot for the long haul is slow-motion suicide. If you’d held these spot assets for five years, watched Bitcoin hit new highs while your own account shrank by 80%–90%, the psychological torture would be worse than getting liquidated.
This chart really sounds the death knell for everyone who likes to “go all in on altcoins.” Altcoins can certainly take off in a bull market, but remember to get out! Don’t wait for the tide to go out before realizing you’re swimming naked.
$BTC

1.3k
·
--
The Fear Index has fallen to 12. Is it time to buy the dip?❓
November 14 $BTC Comprehensive Market Analysis
💰News:
NVIDIA CEO Jensen Huang’s resignation and the related turmoil continue to weigh on tech stocks and risk appetite, with effects spilling over into the crypto market.
A stronger U.S. dollar + simultaneous pressure on risk assets, compounded by liquidations of leveraged long positions (some reports put single-day liquidations at hundreds of millions to over $1 billion).
💰Capital flows:
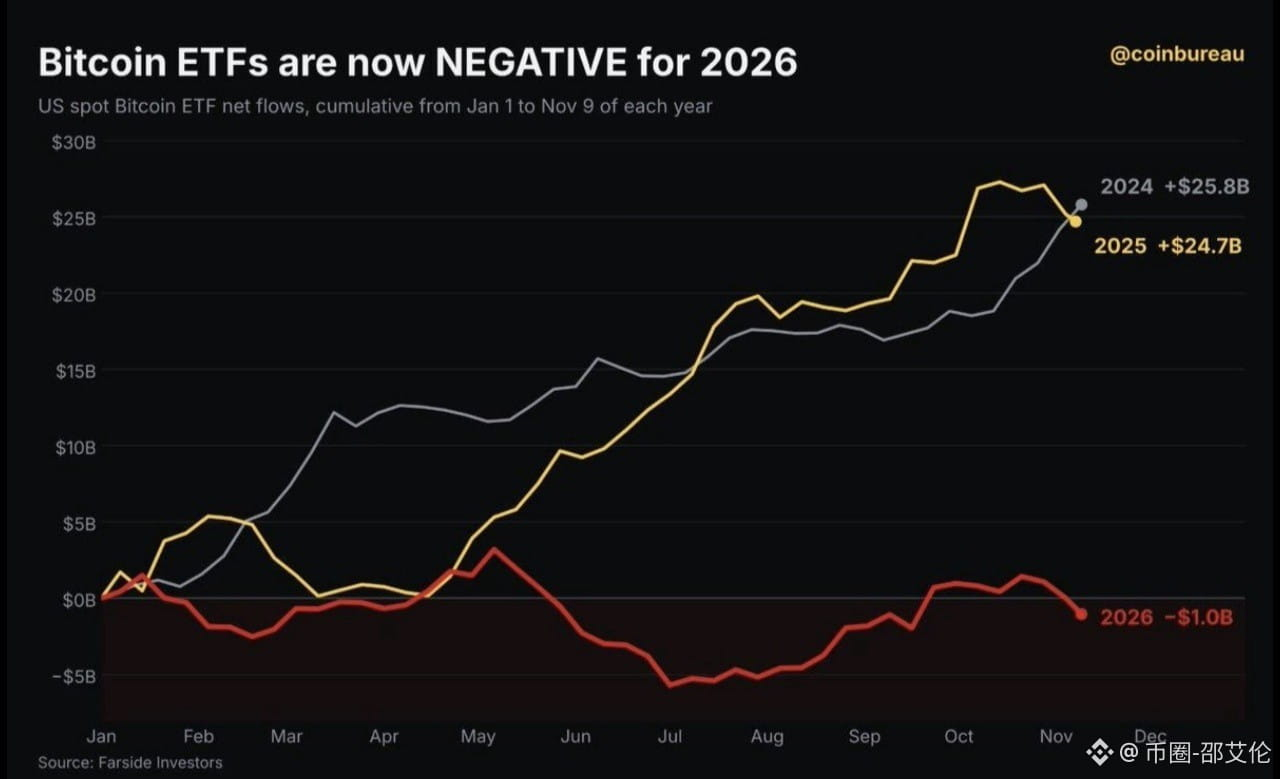
U.S. spot Bitcoin ETFs: Net outflows of about $284M on November 12 and about $300M on November 11, extending the multi-day outflow trend. Cumulative outflows over the past 5–7 trading days exceeded $1.4B. Outflows so far in November have been substantial, with BlackRock IBIT remaining the largest source of outflows.
There is insufficient inflow of new capital, stablecoin supply growth is weak, and hedging demand is lacking. The ETF channel’s shift from “supportive buying” to “sustained redemptions” is a key capital-flow driver of this downturn.
💰Sentiment:
The Fear Index is now around 12. Market sentiment is highly cautious, with oversold conditions and fear occurring together. You can start building a position in batches💹
💰Technical analysis:
The daily RSI is deeply oversold (around 25 or lower), suggesting a potential technical rebound, but the moving averages remain bearishly aligned and momentum is still weak.
You can start building a position in batches at this level. If you’re optimistic about its long-term prospects, consider buying in batches here. You really don’t need to worry about temporary unrealized losses.
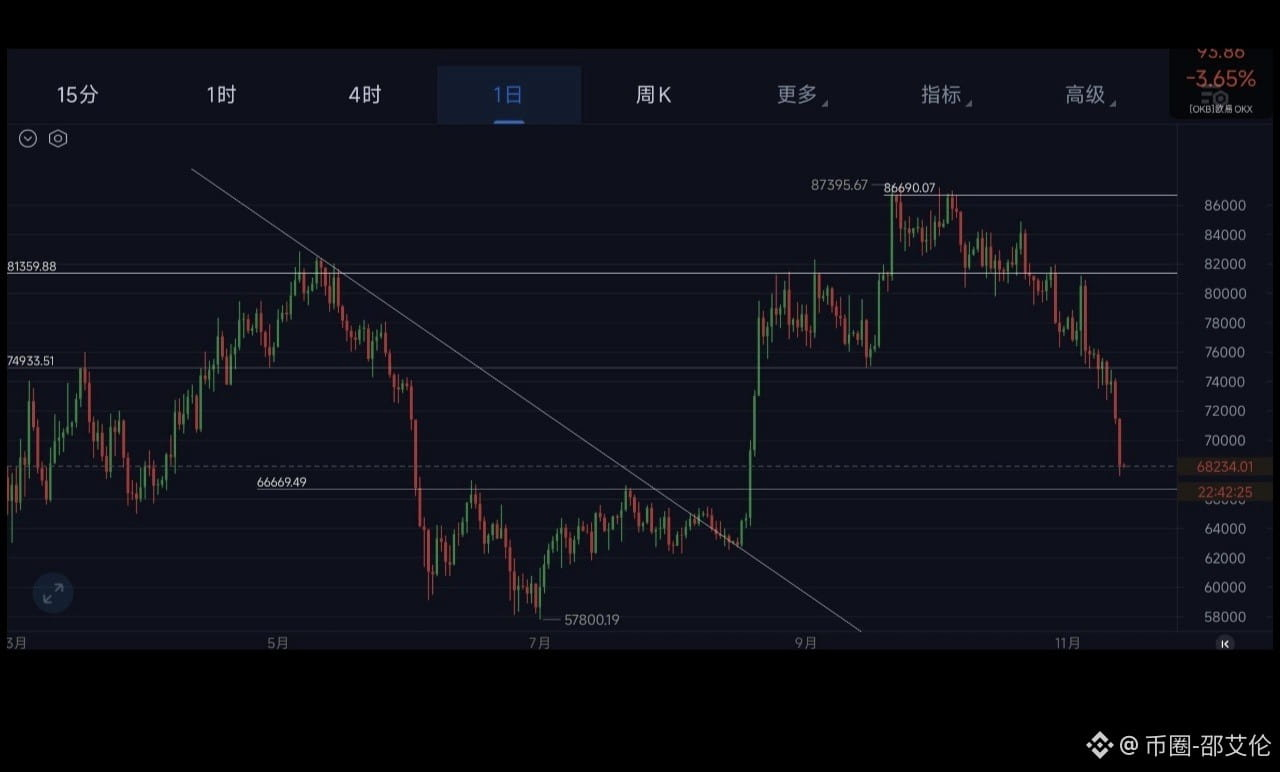
The next important support below is 67000, also the upper boundary of the previous range and the point where the rally began.
Support: 67000–63000
Resistance: 68800–70500
$BTC
{future}(BTCUSDT)
The Fear Index has fallen to 12. Is it time to buy the dip?❓
November 14 $BTC Comprehensive Market Analysis
💰News:
NVIDIA CEO Jensen Huang’s resignation and the related turmoil continue to weigh on tech stocks and risk appetite, with effects spilling over into the crypto market.
A stronger U.S. dollar + simultaneous pressure on risk assets, compounded by liquidations of leveraged long positions (some reports put single-day liquidations at hundreds of millions to over $1 billion).
💰Capital flows:
U.S. spot Bitcoin ETFs: Net outflows of about $284M on November 12 and about $300M on November 11, extending the multi-day outflow trend. Cumulative outflows over the past 5–7 trading days exceeded $1.4B. Outflows so far in November have been substantial, with BlackRock IBIT remaining the largest source of outflows.
There is insufficient inflow of new capital, stablecoin supply growth is weak, and hedging demand is lacking. The ETF channel’s shift from “supportive buying” to “sustained redemptions” is a key capital-flow driver of this downturn.
💰Sentiment:
The Fear Index is now around 12. Market sentiment is highly cautious, with oversold conditions and fear occurring together. You can start building a position in batches💹
💰Technical analysis:
The daily RSI is deeply oversold (around 25 or lower), suggesting a potential technical rebound, but the moving averages remain bearishly aligned and momentum is still weak.
You can start building a position in batches at this level. If you’re optimistic about its long-term prospects, consider buying in batches here. You really don’t need to worry about temporary unrealized losses.
The next important support below is 67000, also the upper boundary of the previous range and the point where the rally began.
Support: 67000–63000
Resistance: 68800–70500
$BTC
November 14 $BTC Comprehensive Market Analysis
💰News:
NVIDIA CEO Jensen Huang’s resignation and the related turmoil continue to weigh on tech stocks and risk appetite, with effects spilling over into the crypto market.
A stronger U.S. dollar + simultaneous pressure on risk assets, compounded by liquidations of leveraged long positions (some reports put single-day liquidations at hundreds of millions to over $1 billion).
💰Capital flows:
U.S. spot Bitcoin ETFs: Net outflows of about $284M on November 12 and about $300M on November 11, extending the multi-day outflow trend. Cumulative outflows over the past 5–7 trading days exceeded $1.4B. Outflows so far in November have been substantial, with BlackRock IBIT remaining the largest source of outflows.
There is insufficient inflow of new capital, stablecoin supply growth is weak, and hedging demand is lacking. The ETF channel’s shift from “supportive buying” to “sustained redemptions” is a key capital-flow driver of this downturn.
💰Sentiment:
The Fear Index is now around 12. Market sentiment is highly cautious, with oversold conditions and fear occurring together. You can start building a position in batches💹
💰Technical analysis:
The daily RSI is deeply oversold (around 25 or lower), suggesting a potential technical rebound, but the moving averages remain bearishly aligned and momentum is still weak.
You can start building a position in batches at this level. If you’re optimistic about its long-term prospects, consider buying in batches here. You really don’t need to worry about temporary unrealized losses.
The next important support below is 67000, also the upper boundary of the previous range and the point where the rally began.
Support: 67000–63000
Resistance: 68800–70500
$BTC
86
·
--
🚨 $BTC Daily Chart Alert: 17 of 22 indicators bearish! Bull/Bear ratio 5:17 (5 bullish · 0 neutral); bears have the upper hand overall · bearish bias 📉
🔴 Trend 0 bullish, 8 bearish: MA below the annual moving average|EMA fast line below, bearish convergence|BOLL below the lower band · extremely weak/oversold|SAR below the stop-loss line|MACD death cross · expanding green bars|DMI -DI leads a strong decline|TRIX / DMA in bearish territory —— all eight bearish; that previous medium-term bullish base is gone
🟡 Momentum 3 bullish, 4 bearish: RSI 24.4 and WR 95.1 enter oversold territory; ROC -11.16% plunges, inviting a speculative rebound; only rebound expectations remain. KDJ 9.5 bearish, CCI -184 still below -100, both BIAS lines show negative deviation, and MTM momentum is negative
🟢 Sentiment 2 bullish, 2 bearish: CR 112 shows strong bulls; VR 59 is in a depressed zone · selling pressure is nearly exhausted. But BRAR shows weak bull power, and PSY 41.7 is pessimistic · bears are in control
🔴 Capital Flow 0 bullish, 3 bearish: OBV is trending down, EMV is below the zero line, and MFI 32.6 shows sellers in control; outflows have not stopped
⚠️ The entire trend group has collapsed + capital continues to flow out. Oversold conditions may bring only a bounce, not a reversal. Don’t rush to buy the dip; risk management comes first! 🛡️
$BTC
{future}(BTCUSDT)
🚨 $BTC Daily Chart Alert: 17 of 22 indicators bearish! Bull/Bear ratio 5:17 (5 bullish · 0 neutral); bears have the upper hand overall · bearish bias 📉
🔴 Trend 0 bullish, 8 bearish: MA below the annual moving average|EMA fast line below, bearish convergence|BOLL below the lower band · extremely weak/oversold|SAR below the stop-loss line|MACD death cross · expanding green bars|DMI -DI leads a strong decline|TRIX / DMA in bearish territory —— all eight bearish; that previous medium-term bullish base is gone
🟡 Momentum 3 bullish, 4 bearish: RSI 24.4 and WR 95.1 enter oversold territory; ROC -11.16% plunges, inviting a speculative rebound; only rebound expectations remain. KDJ 9.5 bearish, CCI -184 still below -100, both BIAS lines show negative deviation, and MTM momentum is negative
🟢 Sentiment 2 bullish, 2 bearish: CR 112 shows strong bulls; VR 59 is in a depressed zone · selling pressure is nearly exhausted. But BRAR shows weak bull power, and PSY 41.7 is pessimistic · bears are in control
🔴 Capital Flow 0 bullish, 3 bearish: OBV is trending down, EMV is below the zero line, and MFI 32.6 shows sellers in control; outflows have not stopped
⚠️ The entire trend group has collapsed + capital continues to flow out. Oversold conditions may bring only a bounce, not a reversal. Don’t rush to buy the dip; risk management comes first! 🛡️
$BTC
🔴 Trend 0 bullish, 8 bearish: MA below the annual moving average|EMA fast line below, bearish convergence|BOLL below the lower band · extremely weak/oversold|SAR below the stop-loss line|MACD death cross · expanding green bars|DMI -DI leads a strong decline|TRIX / DMA in bearish territory —— all eight bearish; that previous medium-term bullish base is gone
🟡 Momentum 3 bullish, 4 bearish: RSI 24.4 and WR 95.1 enter oversold territory; ROC -11.16% plunges, inviting a speculative rebound; only rebound expectations remain. KDJ 9.5 bearish, CCI -184 still below -100, both BIAS lines show negative deviation, and MTM momentum is negative
🟢 Sentiment 2 bullish, 2 bearish: CR 112 shows strong bulls; VR 59 is in a depressed zone · selling pressure is nearly exhausted. But BRAR shows weak bull power, and PSY 41.7 is pessimistic · bears are in control
🔴 Capital Flow 0 bullish, 3 bearish: OBV is trending down, EMV is below the zero line, and MFI 32.6 shows sellers in control; outflows have not stopped
⚠️ The entire trend group has collapsed + capital continues to flow out. Oversold conditions may bring only a bounce, not a reversal. Don’t rush to buy the dip; risk management comes first! 🛡️
$BTC

100
·
--

Article
This is an in-depth review and analysis of “Old Devil’s” historical live trading records.This is an in-depth review and analysis of “Old Devil’s” historical live trading records.
Judging by this screenshot, these results are nothing short of textbook “futures trading legend” performance. All 5 core trades over 15 days were profitable (a 100% win rate), using an extremely aggressive 35x cross-margin leverage.
Here is an in-depth breakdown of its trading logic, techniques, and risk management:
📊 Overview of Key Figures
· Total profit: Across just the 6 trades shown in the screenshot, realized profits totaled an impressive $3,143,227 (equivalent to over RMB 22 million).
· Leverage: Almost all trades used 35x cross margin, with only a very small number using isolated margin.
This is an in-depth review and analysis of “Old Devil’s” historical live trading records.
This is an in-depth review and analysis of “Old Devil’s” historical live trading records.
Judging by this screenshot, these results are nothing short of textbook “futures trading legend” performance. All 5 core trades over 15 days were profitable (a 100% win rate), using an extremely aggressive 35x cross-margin leverage.
Here is an in-depth breakdown of its trading logic, techniques, and risk management:
📊 Overview of Key Figures
· Total profit: Across just the 6 trades shown in the screenshot, realized profits totaled an impressive $3,143,227 (equivalent to over RMB 22 million).
· Leverage: Almost all trades used 35x cross margin, with only a very small number using isolated margin.
Judging by this screenshot, these results are nothing short of textbook “futures trading legend” performance. All 5 core trades over 15 days were profitable (a 100% win rate), using an extremely aggressive 35x cross-margin leverage.
Here is an in-depth breakdown of its trading logic, techniques, and risk management:
📊 Overview of Key Figures
· Total profit: Across just the 6 trades shown in the screenshot, realized profits totaled an impressive $3,143,227 (equivalent to over RMB 22 million).
· Leverage: Almost all trades used 35x cross margin, with only a very small number using isolated margin.
13
·
--
🚀 Absolutely insane! Up 238% in a single day—the wild AKE coin is grinding the shorts into the ground!
Guys, the broader market was practically lifeless tonight, but then this coin called AKE put on a show and took off right where it stood. It’s completely off the charts!
Take a look at the candlestick chart in image two. This isn’t an ordinary rally—it’s a straight-up vertical launch! The price has shot up to 0.010216, up 238.73% in a single day! It hit a 24-hour high of 0.0104, and the trading volume is absolutely staggering, with turnover going through the roof. Looking at the Bollinger Bands, the price left the upper band (0.009075) in the dust a while ago. This is a full-on, explosive short squeeze.
Why has it surged so wildly? The funding data in image one tells the whole story:
📈 Position value is skyrocketing, while the total number of positions is plummeting!
Look closely at the yellow bars and the white line. The yellow bars (total number of open positions) have been sliding down from their highs, which suggests many shorts have been wiped out or stopped out and closed their positions. But the white line (total value of open positions) is still climbing like crazy. What does that tell us? The remaining longs are aggressively adding to their positions, using huge amounts of capital to force the price higher!
🩸 The large traders’ long-short ratio has completely collapsed:
Now look at the long-short ratio below. The red line (short positions) had the upper hand earlier, but in the latter half of the rally, the ratio plunged off a cliff. That means a whole lot of large and retail traders who were short got completely “carried out” in this surge—or despairingly cut their losses. The rally won’t stop until the shorts are dead, and right now they’ve been wiped out completely.
But guys, these extreme, wild coins are also the most dangerous:
A surge like this usually comes with extreme manipulation. If the big players take profits at the top, or the longs run out of money, the sell-off could turn into a sheer cliff of cascading liquidations. Chasing the price now is like reaching into a fire for chestnuts; and if you’re stubborn enough to try shorting the top, a single big green candle could liquidate you in seconds.
This brutal 238% surge—who knows how many overnight-wealth stories it created, and how many short sellers it buried. With this bulldozer of a rally showing no pullbacks, how much longer do you think it can keep going? Anyone here make money on it? 👇$AKE
{future}(AKEUSDT)
🚀 Absolutely insane! Up 238% in a single day—the wild AKE coin is grinding the shorts into the ground!
Guys, the broader market was practically lifeless tonight, but then this coin called AKE put on a show and took off right where it stood. It’s completely off the charts!
Take a look at the candlestick chart in image two. This isn’t an ordinary rally—it’s a straight-up vertical launch! The price has shot up to 0.010216, up 238.73% in a single day! It hit a 24-hour high of 0.0104, and the trading volume is absolutely staggering, with turnover going through the roof. Looking at the Bollinger Bands, the price left the upper band (0.009075) in the dust a while ago. This is a full-on, explosive short squeeze.
Why has it surged so wildly? The funding data in image one tells the whole story:
📈 Position value is skyrocketing, while the total number of positions is plummeting!
Look closely at the yellow bars and the white line. The yellow bars (total number of open positions) have been sliding down from their highs, which suggests many shorts have been wiped out or stopped out and closed their positions. But the white line (total value of open positions) is still climbing like crazy. What does that tell us? The remaining longs are aggressively adding to their positions, using huge amounts of capital to force the price higher!
🩸 The large traders’ long-short ratio has completely collapsed:
Now look at the long-short ratio below. The red line (short positions) had the upper hand earlier, but in the latter half of the rally, the ratio plunged off a cliff. That means a whole lot of large and retail traders who were short got completely “carried out” in this surge—or despairingly cut their losses. The rally won’t stop until the shorts are dead, and right now they’ve been wiped out completely.
But guys, these extreme, wild coins are also the most dangerous:
A surge like this usually comes with extreme manipulation. If the big players take profits at the top, or the longs run out of money, the sell-off could turn into a sheer cliff of cascading liquidations. Chasing the price now is like reaching into a fire for chestnuts; and if you’re stubborn enough to try shorting the top, a single big green candle could liquidate you in seconds.
This brutal 238% surge—who knows how many overnight-wealth stories it created, and how many short sellers it buried. With this bulldozer of a rally showing no pullbacks, how much longer do you think it can keep going? Anyone here make money on it? 👇$AKE
Guys, the broader market was practically lifeless tonight, but then this coin called AKE put on a show and took off right where it stood. It’s completely off the charts!
Take a look at the candlestick chart in image two. This isn’t an ordinary rally—it’s a straight-up vertical launch! The price has shot up to 0.010216, up 238.73% in a single day! It hit a 24-hour high of 0.0104, and the trading volume is absolutely staggering, with turnover going through the roof. Looking at the Bollinger Bands, the price left the upper band (0.009075) in the dust a while ago. This is a full-on, explosive short squeeze.
Why has it surged so wildly? The funding data in image one tells the whole story:
📈 Position value is skyrocketing, while the total number of positions is plummeting!
Look closely at the yellow bars and the white line. The yellow bars (total number of open positions) have been sliding down from their highs, which suggests many shorts have been wiped out or stopped out and closed their positions. But the white line (total value of open positions) is still climbing like crazy. What does that tell us? The remaining longs are aggressively adding to their positions, using huge amounts of capital to force the price higher!
🩸 The large traders’ long-short ratio has completely collapsed:
Now look at the long-short ratio below. The red line (short positions) had the upper hand earlier, but in the latter half of the rally, the ratio plunged off a cliff. That means a whole lot of large and retail traders who were short got completely “carried out” in this surge—or despairingly cut their losses. The rally won’t stop until the shorts are dead, and right now they’ve been wiped out completely.
But guys, these extreme, wild coins are also the most dangerous:
A surge like this usually comes with extreme manipulation. If the big players take profits at the top, or the longs run out of money, the sell-off could turn into a sheer cliff of cascading liquidations. Chasing the price now is like reaching into a fire for chestnuts; and if you’re stubborn enough to try shorting the top, a single big green candle could liquidate you in seconds.
This brutal 238% surge—who knows how many overnight-wealth stories it created, and how many short sellers it buried. With this bulldozer of a rally showing no pullbacks, how much longer do you think it can keep going? Anyone here make money on it? 👇$AKE
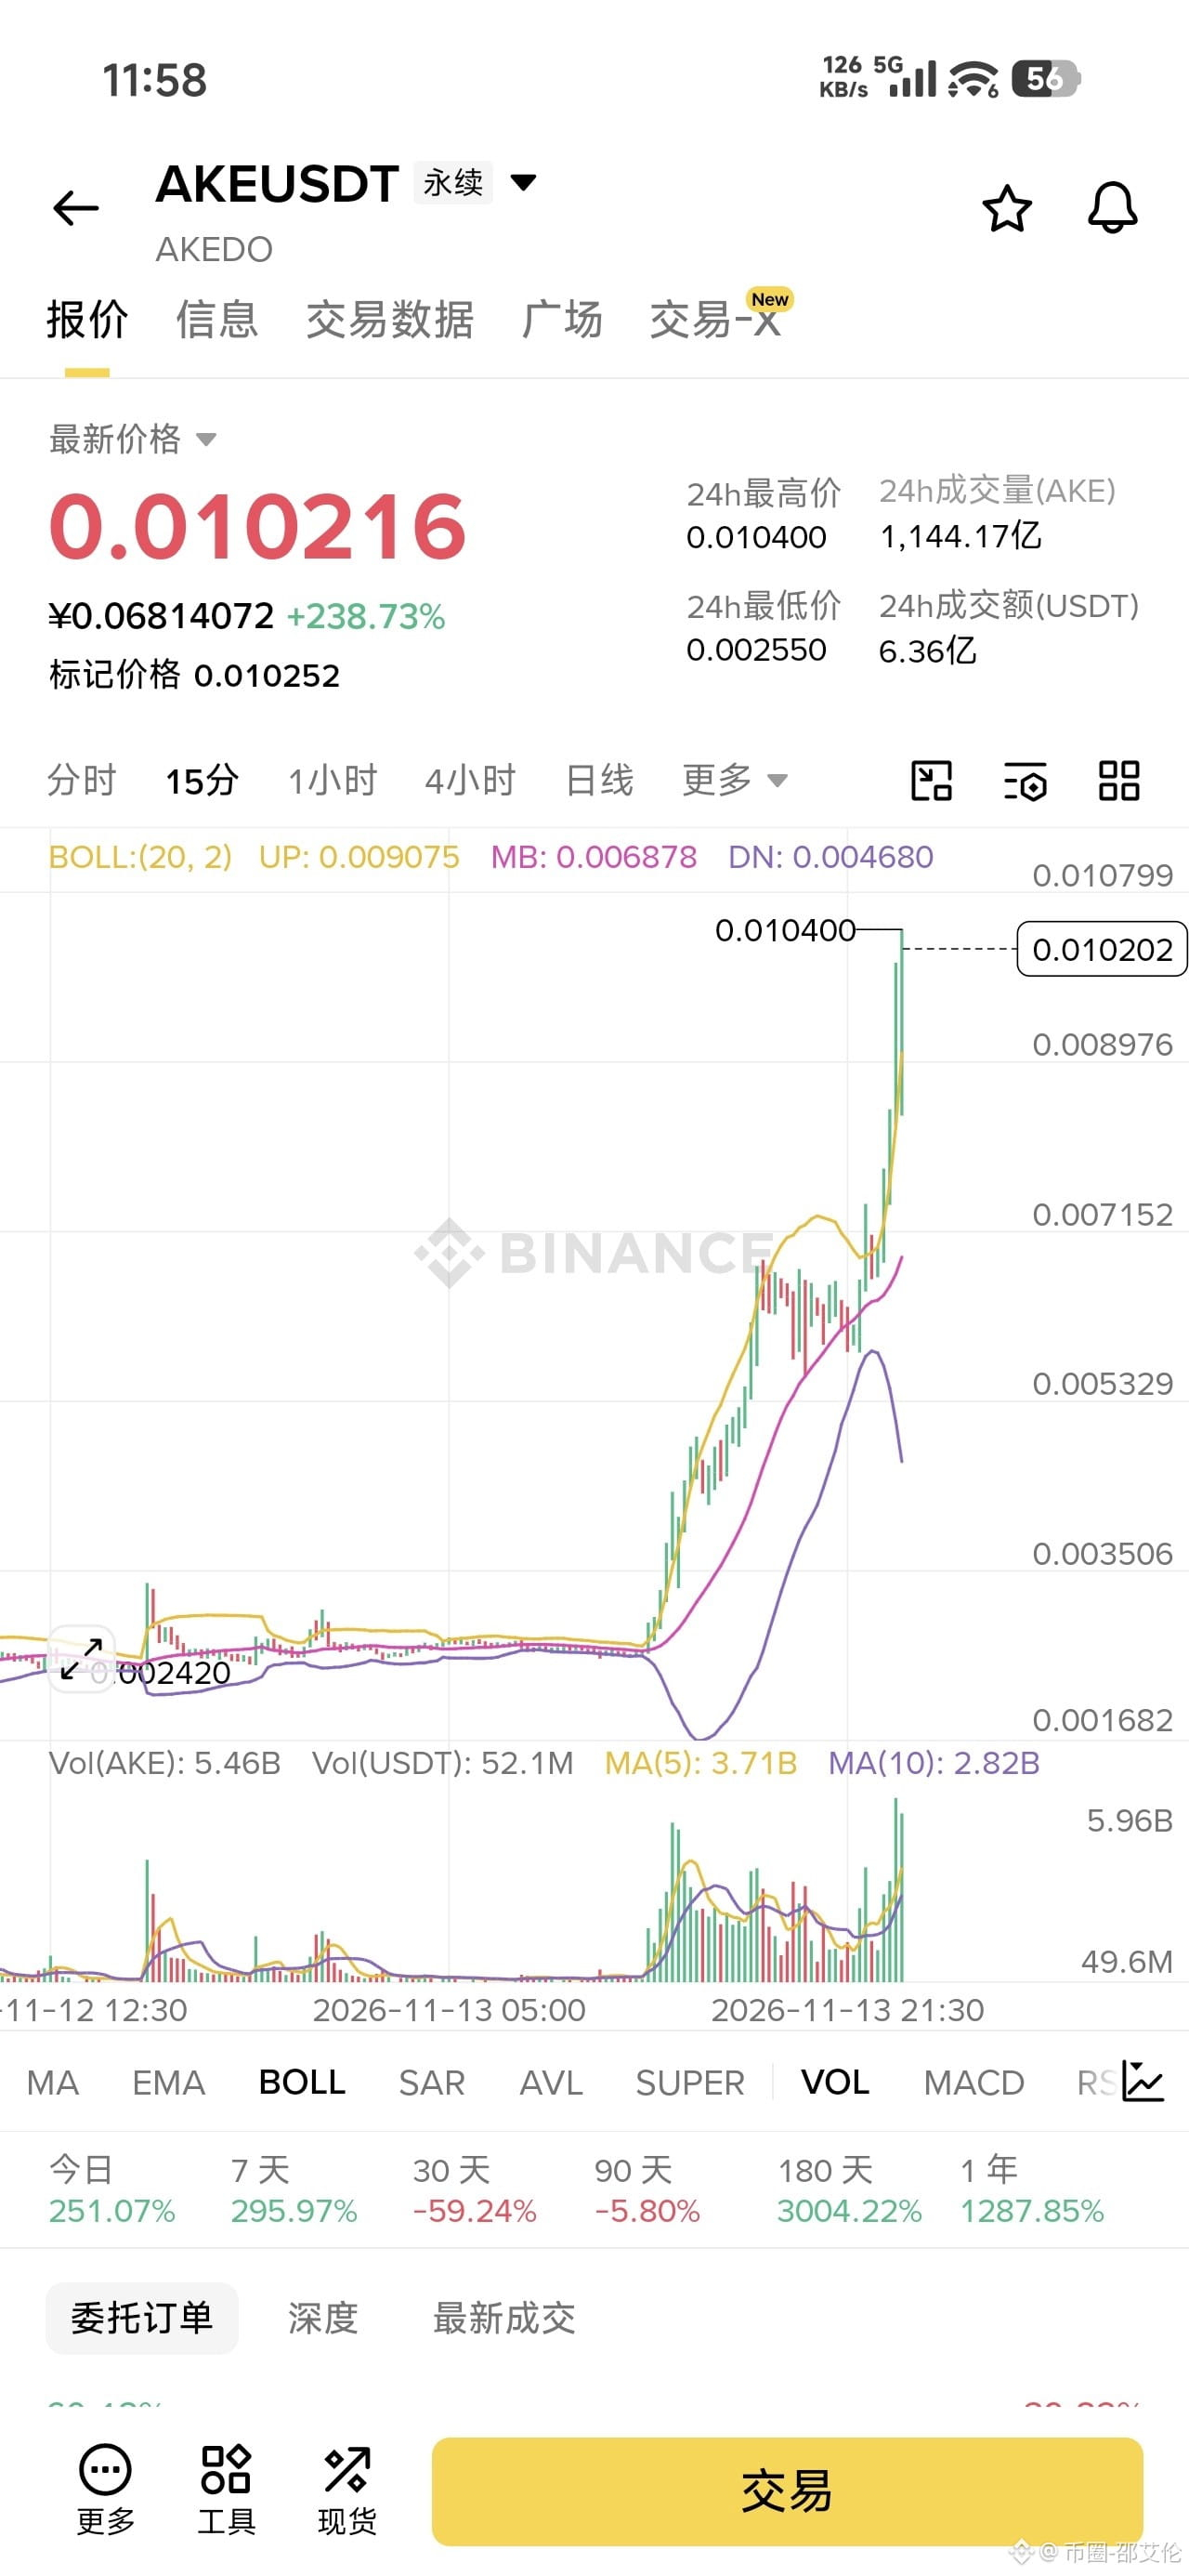
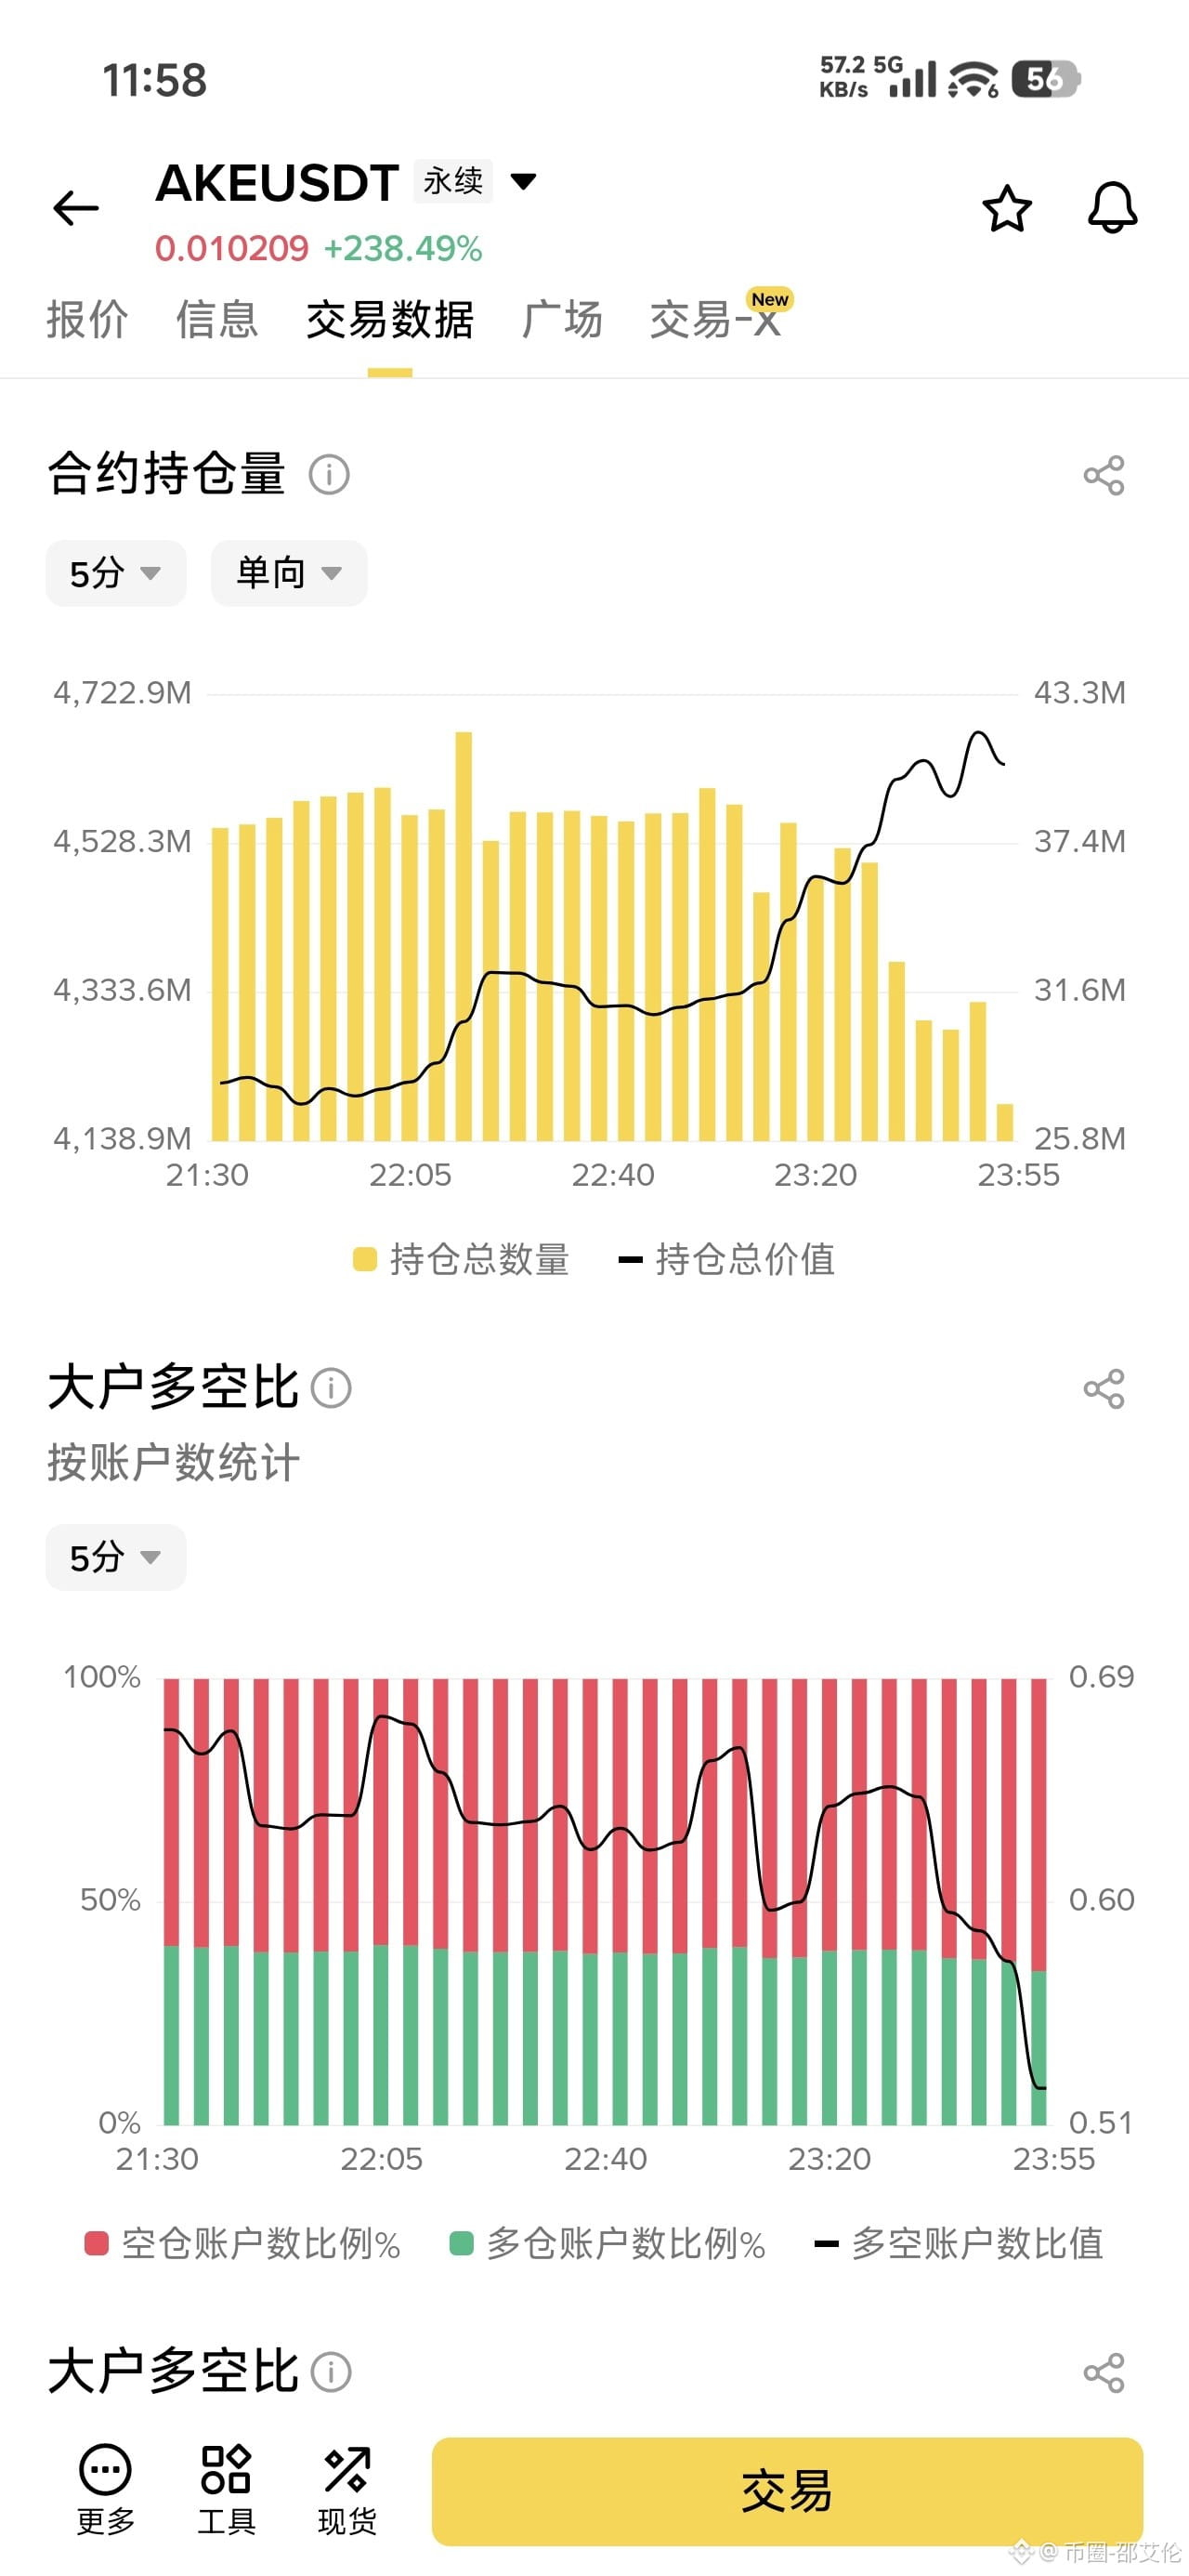
405
·
--
🤡 When prices rise, they shout “100K”; when they fall, they shout “30K”! Just how many people have these “chameleon” analysts led astray?
Guys, the recent market action has really been driving us crazy. But even more maddening than the market are those “genius” analysts online who stir things up every day!
When prices are rising, they practically shove a megaphone in your ear and shout: “The bull market is back! 100K is the target! Get in now or you’ll miss out!” But as soon as prices take even a small plunge, they immediately change their tune: “It’s over! The bear market is here! We’re going straight to 30K! Cut your losses and get out now!”
Good grief, the market sounds like a game of make-believe when they talk about it. They just flap their lips and throw out 100K or 30K like it’s nothing.
Today, let’s take a closer look at just how harmful these analysts who “make things up as they go” can be:
1️⃣ Pure emotion amplifiers, with no logic whatsoever
They don’t look at macroeconomic data, capital flows, or technical support. They only look at a few candlesticks right in front of them. When prices rise, they’re blindly bullish; when prices fall, they’re blindly bearish. That’s not analysis—it’s “reading the chart.” Trade based on what these people say, and you’ll always buy at the top and sell at the bottom.
2️⃣ No scruples when it comes to chasing traffic
Crypto is all about attention, and the more extreme the opinions, the more likely they are to grab people’s attention. Shout “100K” or “30K,” and they can rack up tens of thousands of views and a bunch of anxious followers asking “What should we do, boss?” in the comments. They may not have placed a single trade themselves—they just give advice from the sidelines. They profit from your attention, while you lose your hard-earned money!
3️⃣ The scariest part is that retail investors really believe them
A lot of people are already panicking. The moment they see an influencer shout “30K,” they lose it and hand over their blood-soaked holdings. And what happens? Often, the market rebounds sharply right after they sell at a loss. Those so-called “beacons” are all contrarian indicators.
What does real trading look like?
It means staying calm and watching the charts, just like that sharp trader we saw before, no matter what everyone else is shouting. When the price reaches support (say, around 68,000), they’re willing to buy; when it hits resistance (say, above 70,000), they get out decisively and take their swing-trading profits.
The market always goes against human nature. Be greedy when others are fearful, and fearful when others are greedy. Don’t let the extreme opinions of these “weathervanes” throw you off course.
$BTC
{future}(BTCUSDT)
🤡 When prices rise, they shout “100K”; when they fall, they shout “30K”! Just how many people have these “chameleon” analysts led astray?
Guys, the recent market action has really been driving us crazy. But even more maddening than the market are those “genius” analysts online who stir things up every day!
When prices are rising, they practically shove a megaphone in your ear and shout: “The bull market is back! 100K is the target! Get in now or you’ll miss out!” But as soon as prices take even a small plunge, they immediately change their tune: “It’s over! The bear market is here! We’re going straight to 30K! Cut your losses and get out now!”
Good grief, the market sounds like a game of make-believe when they talk about it. They just flap their lips and throw out 100K or 30K like it’s nothing.
Today, let’s take a closer look at just how harmful these analysts who “make things up as they go” can be:
1️⃣ Pure emotion amplifiers, with no logic whatsoever
They don’t look at macroeconomic data, capital flows, or technical support. They only look at a few candlesticks right in front of them. When prices rise, they’re blindly bullish; when prices fall, they’re blindly bearish. That’s not analysis—it’s “reading the chart.” Trade based on what these people say, and you’ll always buy at the top and sell at the bottom.
2️⃣ No scruples when it comes to chasing traffic
Crypto is all about attention, and the more extreme the opinions, the more likely they are to grab people’s attention. Shout “100K” or “30K,” and they can rack up tens of thousands of views and a bunch of anxious followers asking “What should we do, boss?” in the comments. They may not have placed a single trade themselves—they just give advice from the sidelines. They profit from your attention, while you lose your hard-earned money!
3️⃣ The scariest part is that retail investors really believe them
A lot of people are already panicking. The moment they see an influencer shout “30K,” they lose it and hand over their blood-soaked holdings. And what happens? Often, the market rebounds sharply right after they sell at a loss. Those so-called “beacons” are all contrarian indicators.
What does real trading look like?
It means staying calm and watching the charts, just like that sharp trader we saw before, no matter what everyone else is shouting. When the price reaches support (say, around 68,000), they’re willing to buy; when it hits resistance (say, above 70,000), they get out decisively and take their swing-trading profits.
The market always goes against human nature. Be greedy when others are fearful, and fearful when others are greedy. Don’t let the extreme opinions of these “weathervanes” throw you off course.
$BTC
Guys, the recent market action has really been driving us crazy. But even more maddening than the market are those “genius” analysts online who stir things up every day!
When prices are rising, they practically shove a megaphone in your ear and shout: “The bull market is back! 100K is the target! Get in now or you’ll miss out!” But as soon as prices take even a small plunge, they immediately change their tune: “It’s over! The bear market is here! We’re going straight to 30K! Cut your losses and get out now!”
Good grief, the market sounds like a game of make-believe when they talk about it. They just flap their lips and throw out 100K or 30K like it’s nothing.
Today, let’s take a closer look at just how harmful these analysts who “make things up as they go” can be:
1️⃣ Pure emotion amplifiers, with no logic whatsoever
They don’t look at macroeconomic data, capital flows, or technical support. They only look at a few candlesticks right in front of them. When prices rise, they’re blindly bullish; when prices fall, they’re blindly bearish. That’s not analysis—it’s “reading the chart.” Trade based on what these people say, and you’ll always buy at the top and sell at the bottom.
2️⃣ No scruples when it comes to chasing traffic
Crypto is all about attention, and the more extreme the opinions, the more likely they are to grab people’s attention. Shout “100K” or “30K,” and they can rack up tens of thousands of views and a bunch of anxious followers asking “What should we do, boss?” in the comments. They may not have placed a single trade themselves—they just give advice from the sidelines. They profit from your attention, while you lose your hard-earned money!
3️⃣ The scariest part is that retail investors really believe them
A lot of people are already panicking. The moment they see an influencer shout “30K,” they lose it and hand over their blood-soaked holdings. And what happens? Often, the market rebounds sharply right after they sell at a loss. Those so-called “beacons” are all contrarian indicators.
What does real trading look like?
It means staying calm and watching the charts, just like that sharp trader we saw before, no matter what everyone else is shouting. When the price reaches support (say, around 68,000), they’re willing to buy; when it hits resistance (say, above 70,000), they get out decisively and take their swing-trading profits.
The market always goes against human nature. Be greedy when others are fearful, and fearful when others are greedy. Don’t let the extreme opinions of these “weathervanes” throw you off course.
$BTC
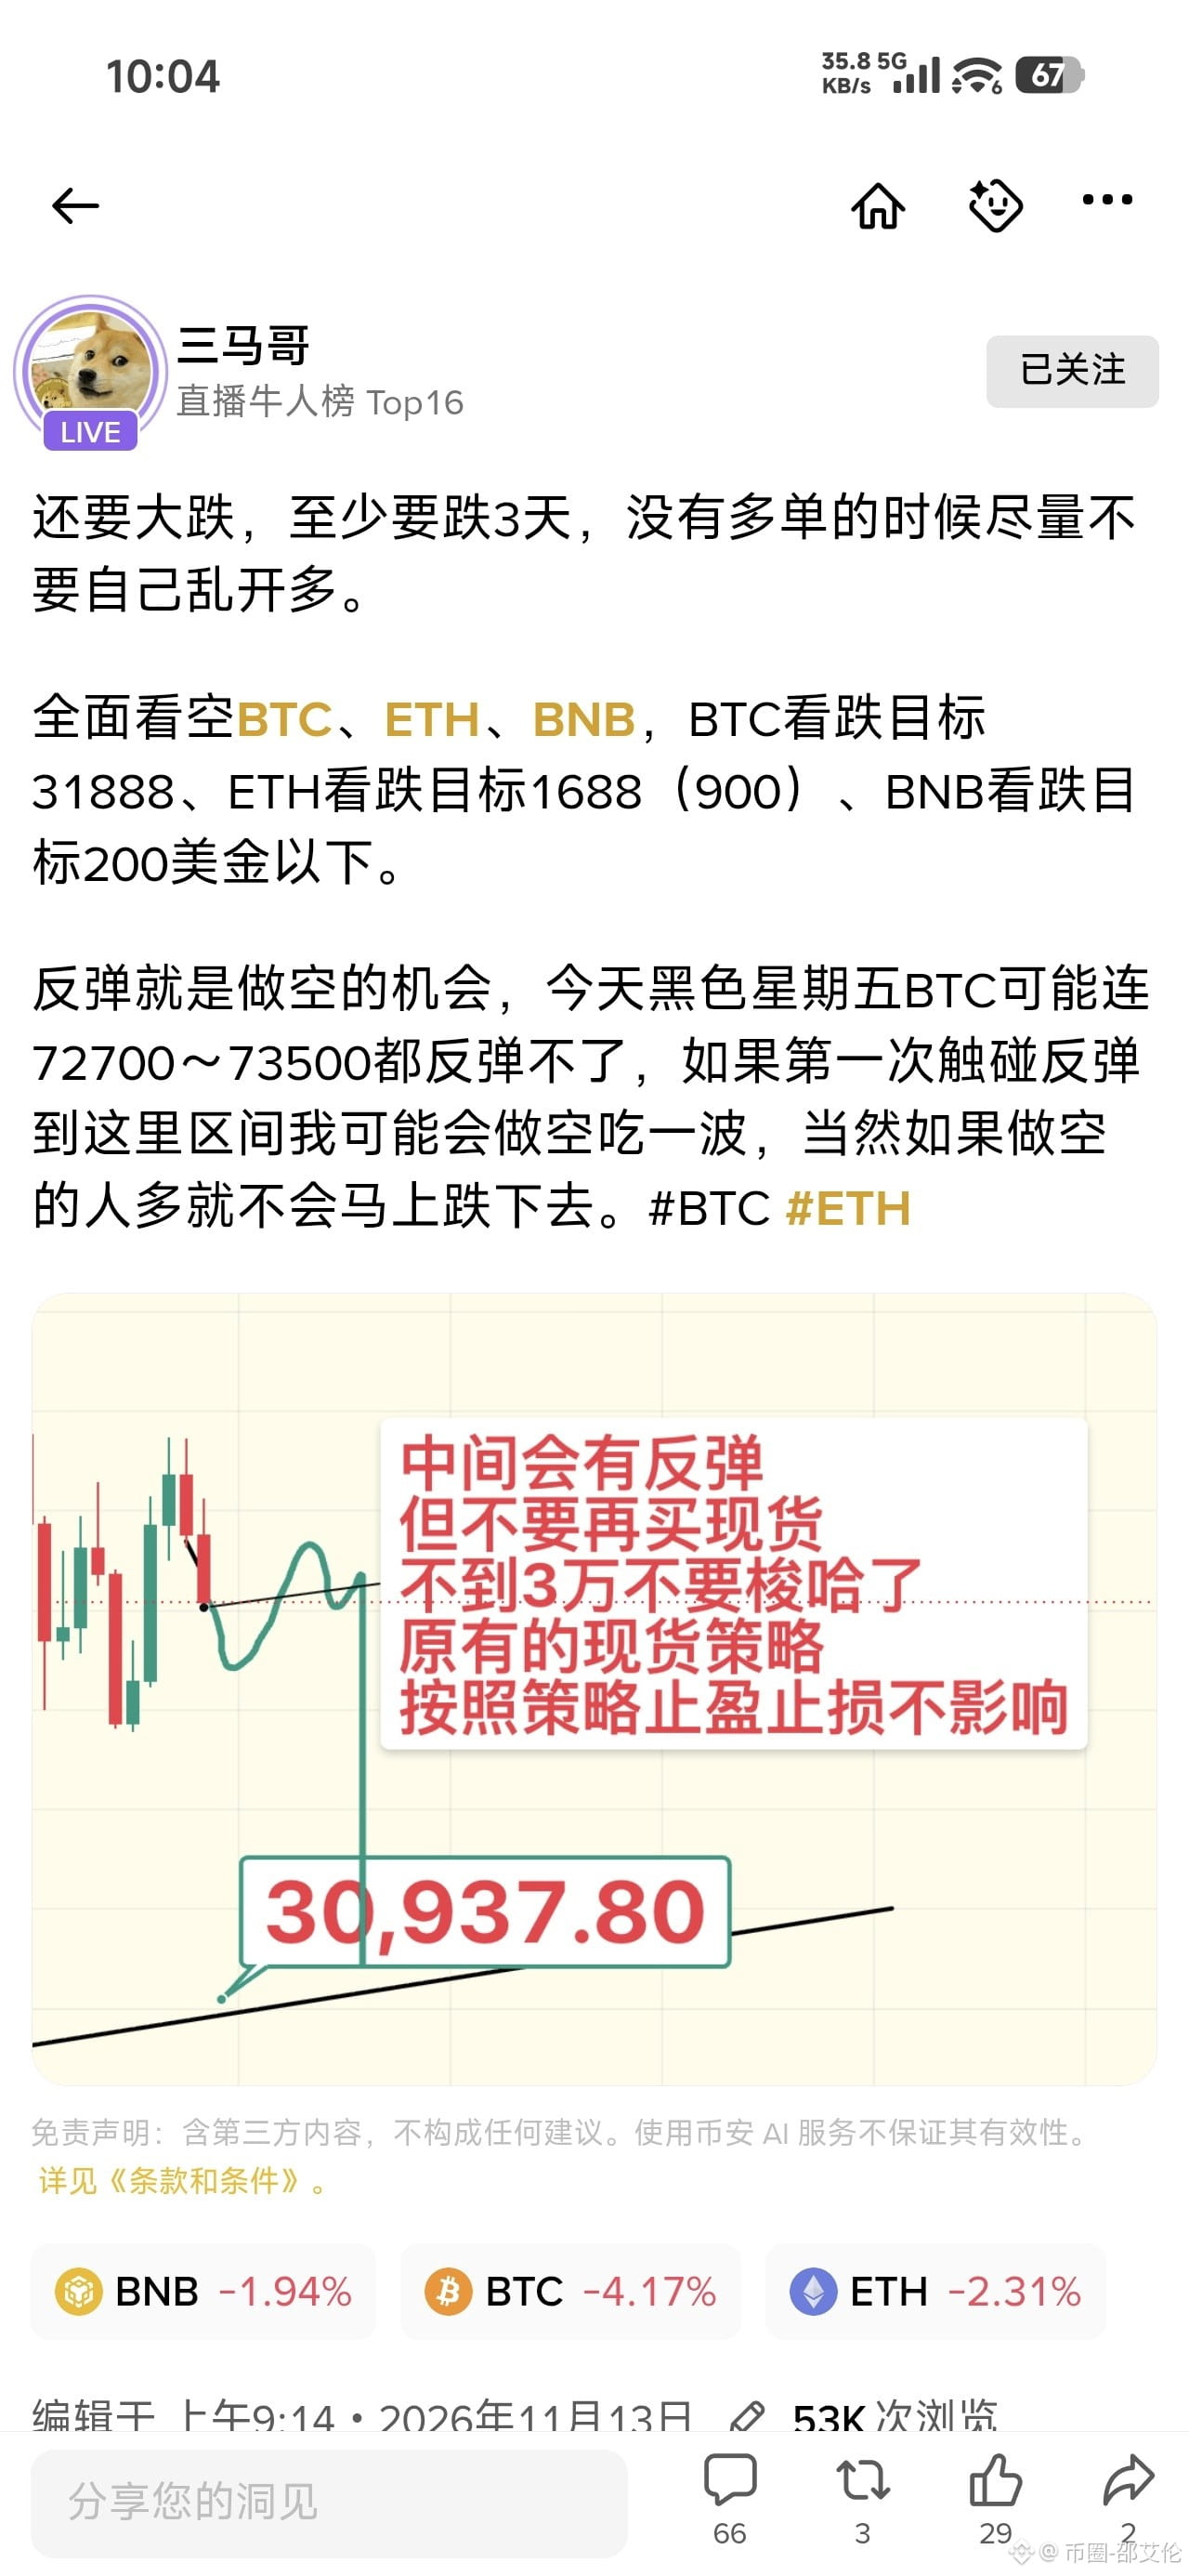
33
Log in to explore more content
Join global crypto users on Binance Square
⚡️ Get latest and useful information about crypto.
💬 Trusted by the world’s largest crypto exchange.
👍 Discover real insights from verified creators.
Email / Phone number
Trending Topics
CryptoSelloffTriggersMultipleWhaleLiquidations
178,434 views
1,773 Discussing
Crypto Liquidations Top $2B in 24 Hours as 329,000 Traders Are Wiped Out
Binance News
·40 Likes
·54.3k views
USSpotXRPETFsSeeLargestWeeklyOutflowIn8Months
158,536 views
1,548 Discussing
WillFOMCMinutesReinforceRateHikeExpectations?
46,020 views
737 Discussing