
Cكريبتونايت
539 Posts
Cكريبتونايت
Report
Block User
خبير تحليل في الاسواق المالية Financial markets analyst
Frequent Trader
4.1 Years
267 Following
334 Followers
793 Liked
Posts
All
Quotes
Live
·
--
I hope everyone who reads my comment will follow me and I will follow back.
Please, everyone who reads my post, please follow me
I hope everyone who reads my comment will follow me and I will follow back.
Please, everyone who reads my post, please follow me
Please, everyone who reads my post, please follow me
2
·
--
Same as what I said exactly. The one who heard my words and entered—buy with a thousand congratulations
and continue your goal
0.27
0.25
0.22
Same as what I said exactly. The one who heard my words and entered—buy with a thousand congratulations
and continue your goal
0.27
0.25
0.22
and continue your goal
0.27
0.25
0.22
Cكريبتونايت
·
--
Opportunity for a golden trade Coin $MAGMA Wait for the closing of the 4-hour candle. If it closes below 0.31, take it for sale and be calm
73
·
--
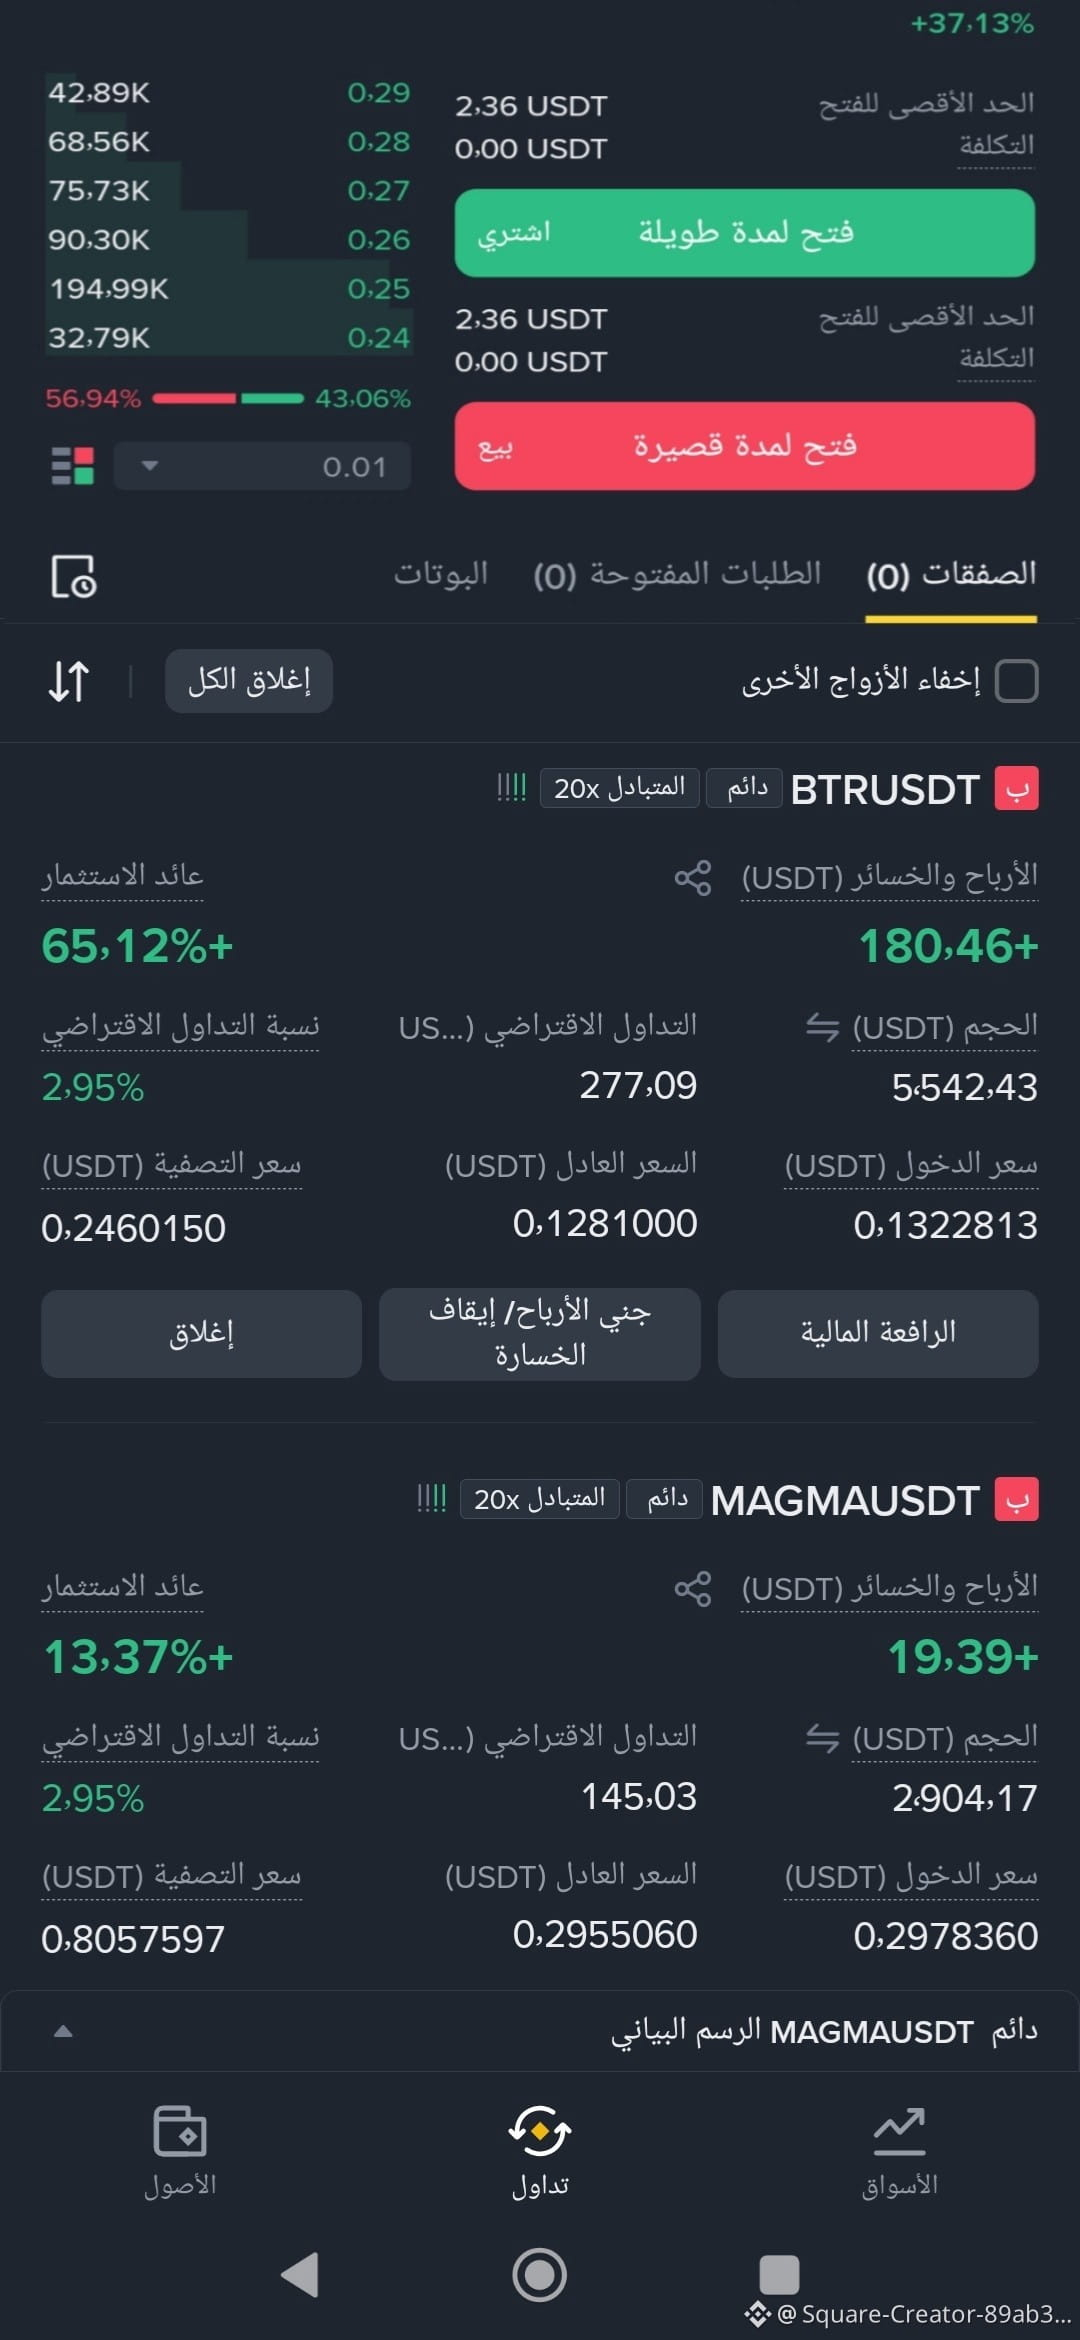
Anyone who comes after my words is now on the beautiful profit.
Congratulations, guys!
Anyone who comes after my words is now on the beautiful profit.
Congratulations, guys!
Congratulations, guys!
Cكريبتونايت
·
--
Opportunity for a golden trade Coin $MAGMA Wait for the closing of the 4-hour candle. If it closes below 0.31, take it for sale and be calm
4
·
--
Opportunity for a golden trade Coin $MAGMA Wait for the closing of the 4-hour candle. If it closes below 0.31, take it for sale and be calm
{future}(MAGMAUSDT)
Opportunity for a golden trade Coin $MAGMA Wait for the closing of the 4-hour candle. If it closes below 0.31, take it for sale and be calm
2
285
·
--
#dusk $DUSK @Dusk_Foundation
🚀 The future of financial privacy and legal compliance with @Dusk!
In a world of blockchain and increasing regulatory requirements, @Dusk’s project offers revolutionary solutions that combine full privacy with regulatory compliance (Compliance) for real financial assets (RWA).
Using “Zero-Knowledge Proofs” technologies, the @Dusk network enables institutions and companies to trade tokenized assets and financial instruments securely, with superior data protection—without violating the law.
The unique code $DUSK is not just fuel for the network, but a fundamental pillar of a privacy-enhanced digital asset growth ecosystem. The future of institutional finance begins here! 💎
#dusk $DUSK @Dusk
🚀 The future of financial privacy and legal compliance with @Dusk!
In a world of blockchain and increasing regulatory requirements, @Dusk’s project offers revolutionary solutions that combine full privacy with regulatory compliance (Compliance) for real financial assets (RWA).
Using “Zero-Knowledge Proofs” technologies, the @Dusk network enables institutions and companies to trade tokenized assets and financial instruments securely, with superior data protection—without violating the law.
The unique code $DUSK is not just fuel for the network, but a fundamental pillar of a privacy-enhanced digital asset growth ecosystem. The future of institutional finance begins here! 💎
🚀 The future of financial privacy and legal compliance with @Dusk!
In a world of blockchain and increasing regulatory requirements, @Dusk’s project offers revolutionary solutions that combine full privacy with regulatory compliance (Compliance) for real financial assets (RWA).
Using “Zero-Knowledge Proofs” technologies, the @Dusk network enables institutions and companies to trade tokenized assets and financial instruments securely, with superior data protection—without violating the law.
The unique code $DUSK is not just fuel for the network, but a fundamental pillar of a privacy-enhanced digital asset growth ecosystem. The future of institutional finance begins here! 💎

3
113
·
--
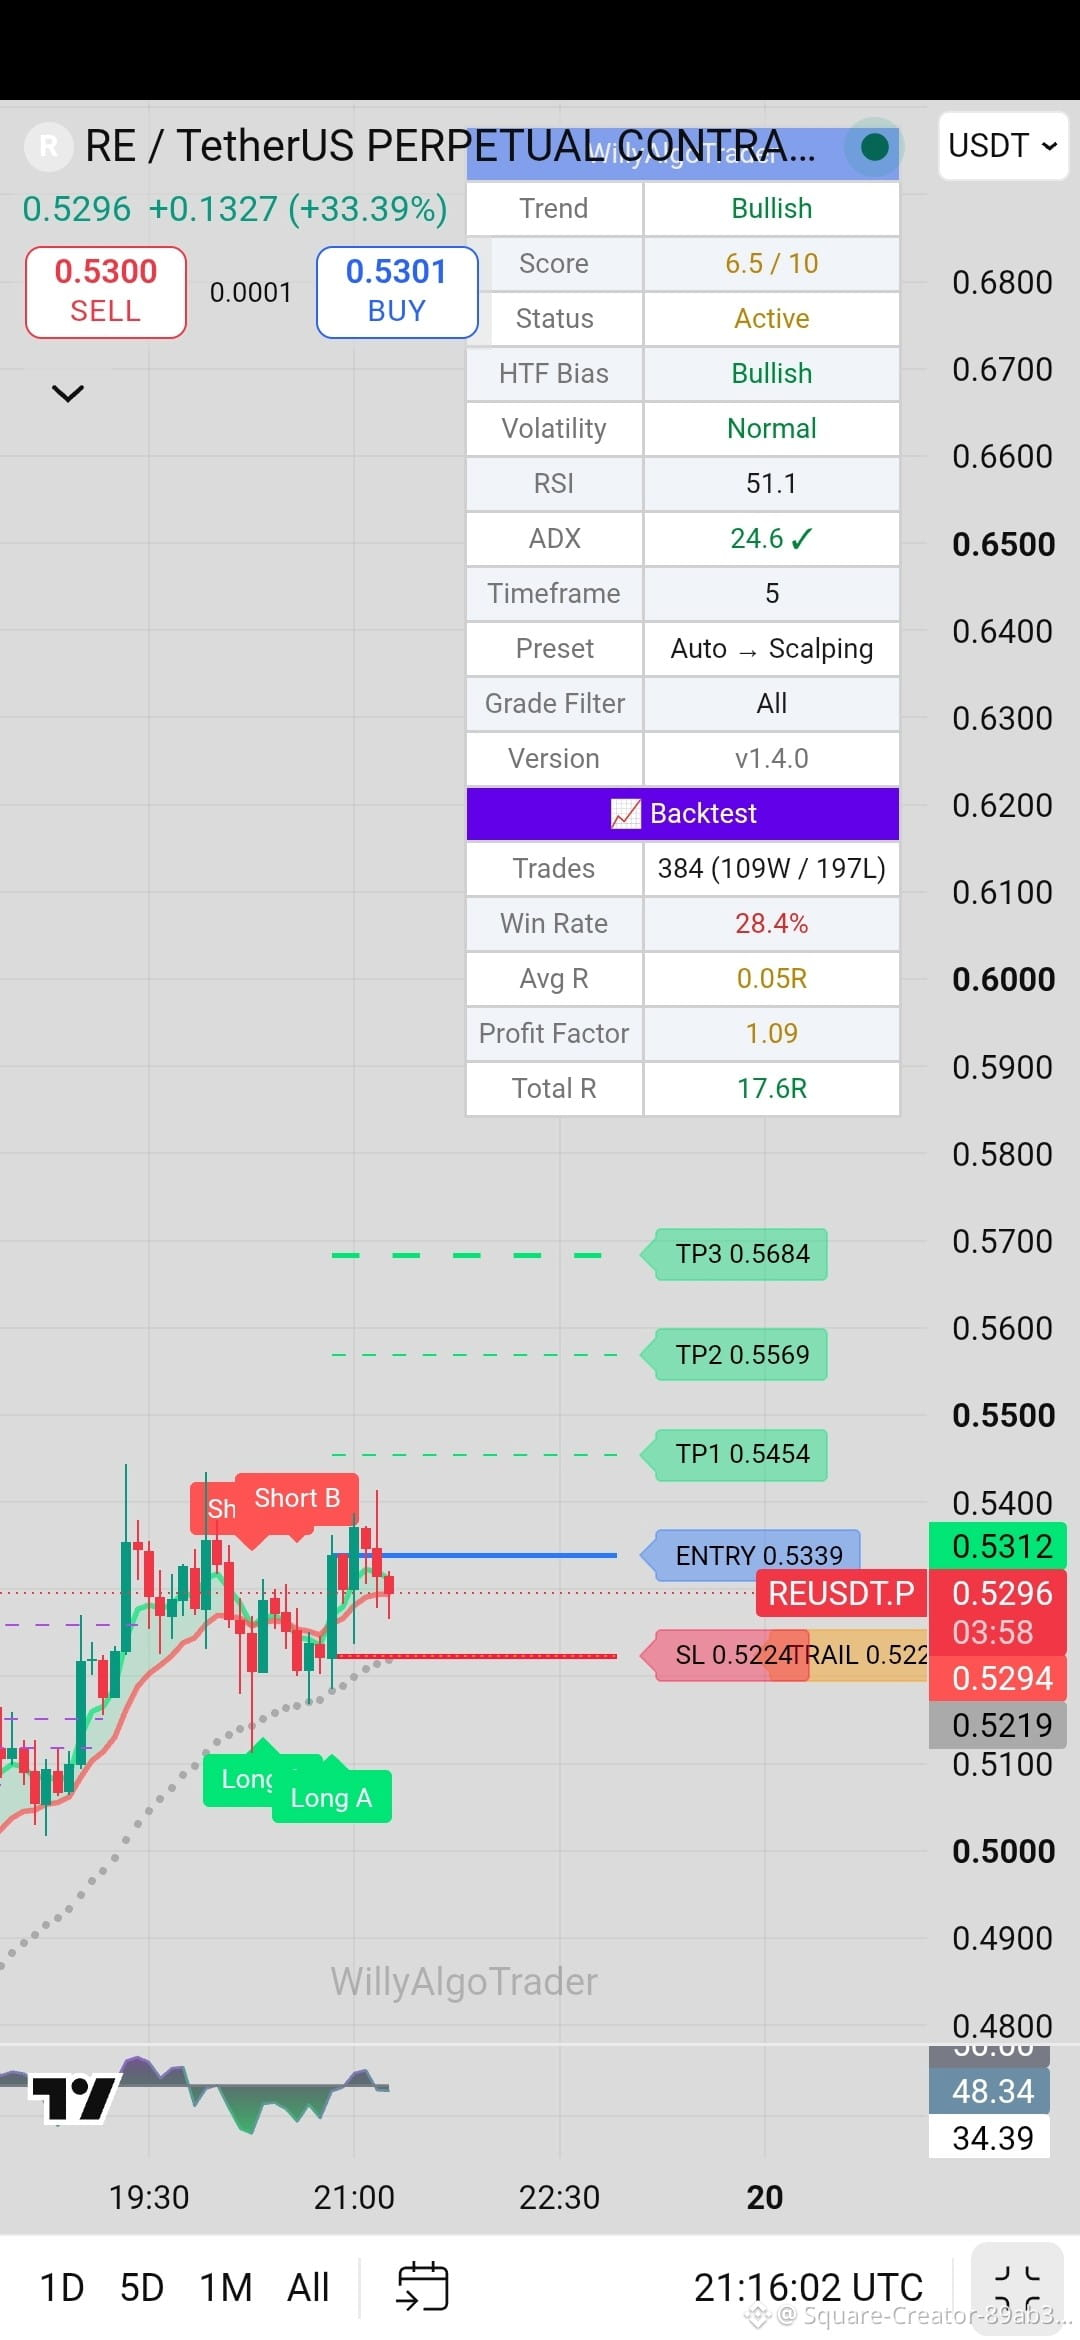
deal quick Line blue entrance And the brother Mr. Dr Your goal The red Stop loss
quick deal coin $RE blue line entrance brother green goals and red stop loss
{future}(REUSDT)
deal quick Line blue entrance And the brother Mr. Dr Your goal The red Stop loss
quick deal coin $RE blue line entrance brother green goals and red stop loss
quick deal coin $RE blue line entrance brother green goals and red stop loss
526
·
--
In-depth analysis of coin $LAB with guaranteed trade entry points
{future}(LABUSDT)
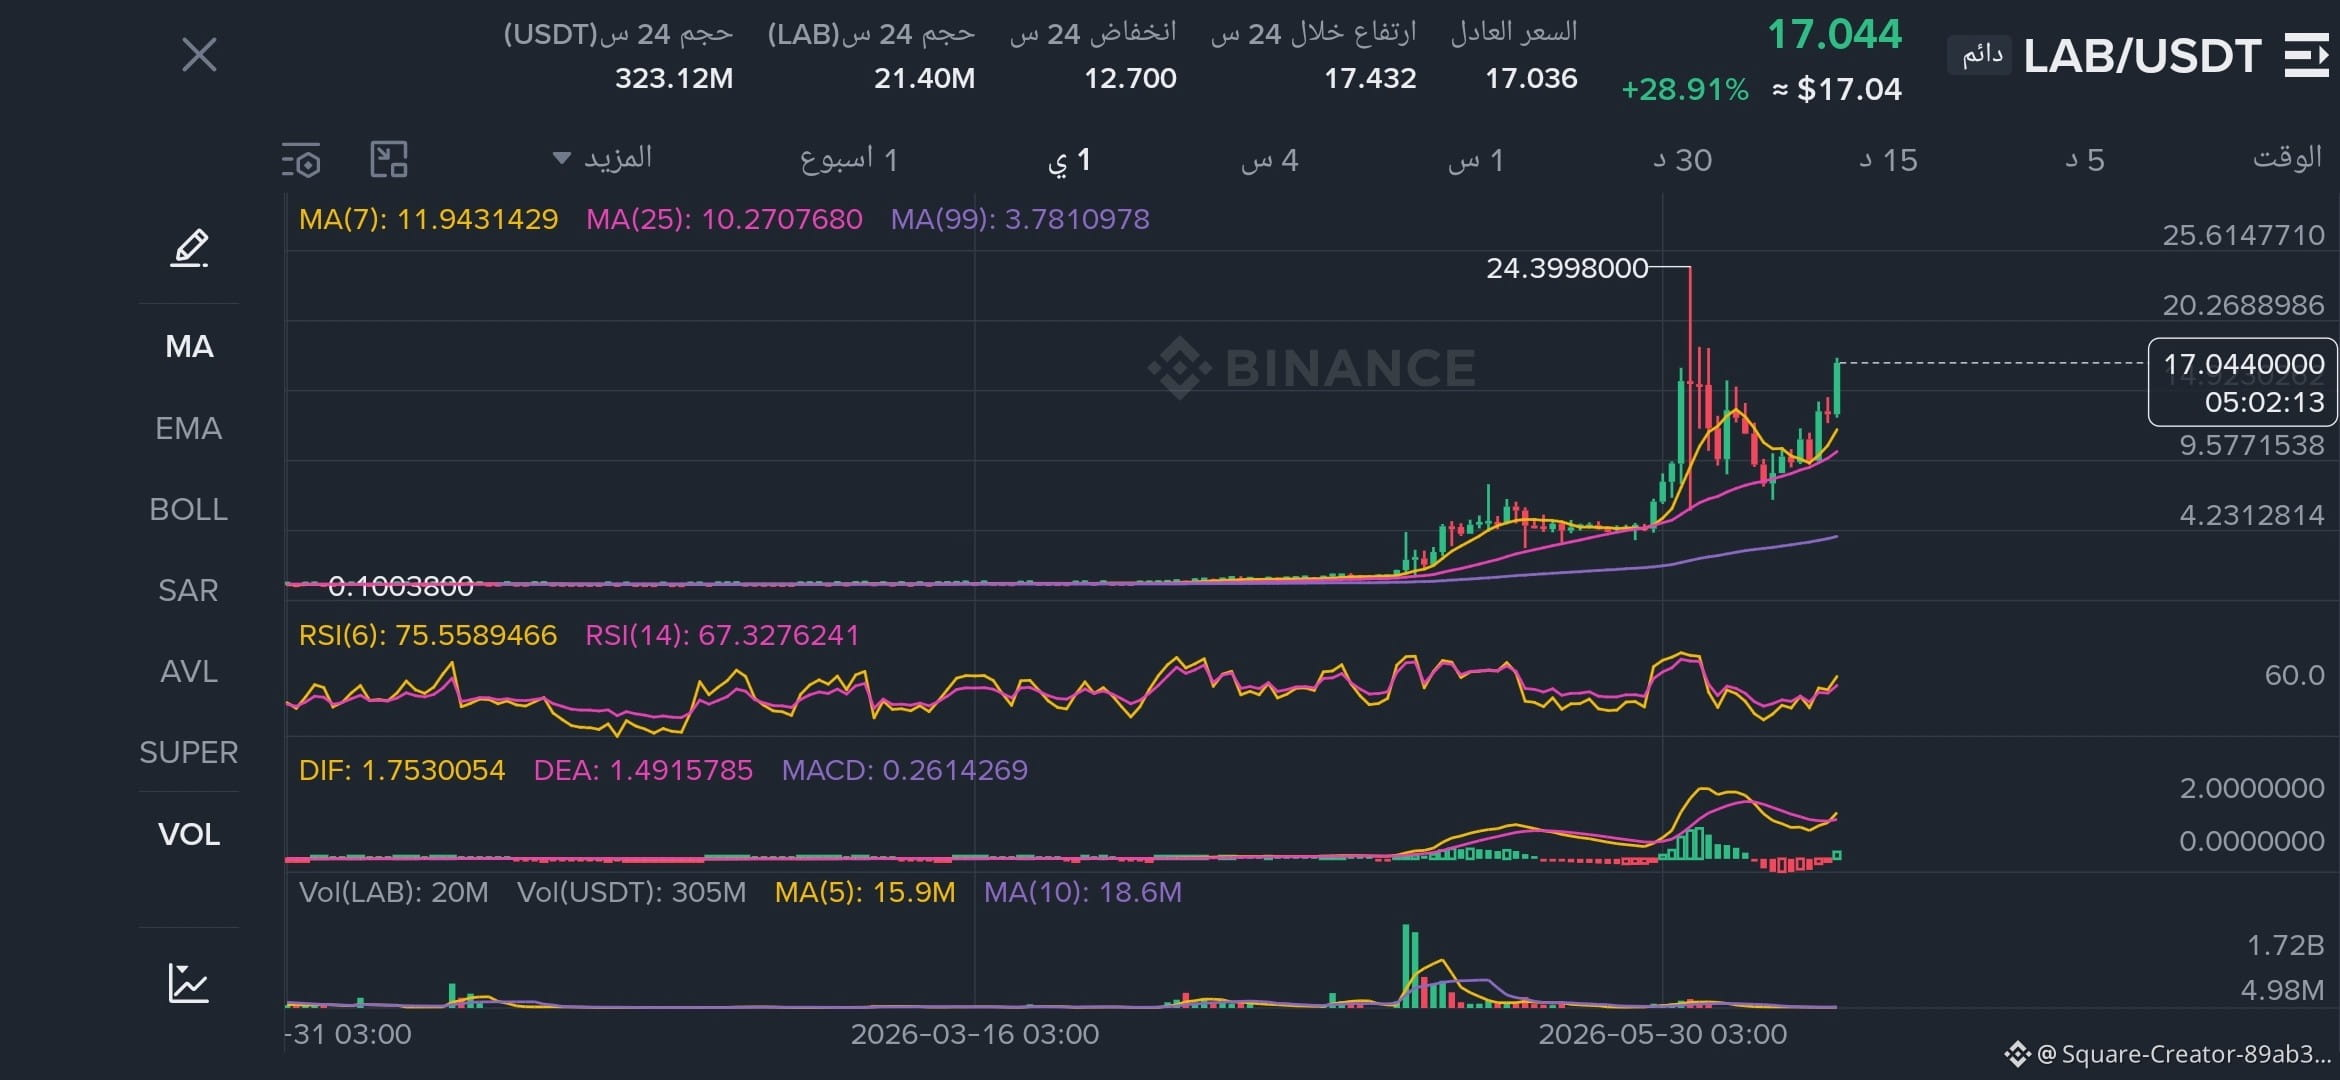
🛑 Current chart reading and indicators:
Overall Trend:
The coin is on a strong bullish trend clearly visible on the daily frame.
The current price is 17.044, achieving an increase of 28.91%+.
The price is trading above the moving averages MA(7) at 11.94 and MA(25) at 10.27, indicating significant buying power.
Relative Strength Index (RSI):
RSI(6) is at 75.55 and RSI(14) at 67.32.
This indicates that the price is approaching or has already entered the overbought zone. Buying directly from the current peak carries a high risk of a sudden downward correction (Profit Taking).
MACD Indicator:
The DIF line is above the DEA line, and the green bars have started to increase again, reflecting renewed bullish momentum, but the current candle has approached the previous peak (24.39).
🎯 Suggested trading plan (entry and exit points)
Since the price is currently high and has risen strongly, the best strategy is to wait for a correction (Buy the Dip) and not chase the price to avoid getting stuck at the peak.
1. Suitable entry points (support)
First entry point (medium risk): at levels $11.94 to $12.70 (retesting MA(7) and the nearby daily low).
Second entry point (stronger and safer): at levels $9.57 to $10.27.
2. Targets
First target: $20.26
Second target: $24.39
3. Stop loss
Closing a candle below $9.50 completely nullifies the bullish scenario.
In-depth analysis of coin $LAB with guaranteed trade entry points
🛑 Current chart reading and indicators:
Overall Trend:
The coin is on a strong bullish trend clearly visible on the daily frame.
The current price is 17.044, achieving an increase of 28.91%+.
The price is trading above the moving averages MA(7) at 11.94 and MA(25) at 10.27, indicating significant buying power.
Relative Strength Index (RSI):
RSI(6) is at 75.55 and RSI(14) at 67.32.
This indicates that the price is approaching or has already entered the overbought zone. Buying directly from the current peak carries a high risk of a sudden downward correction (Profit Taking).
MACD Indicator:
The DIF line is above the DEA line, and the green bars have started to increase again, reflecting renewed bullish momentum, but the current candle has approached the previous peak (24.39).
🎯 Suggested trading plan (entry and exit points)
Since the price is currently high and has risen strongly, the best strategy is to wait for a correction (Buy the Dip) and not chase the price to avoid getting stuck at the peak.
1. Suitable entry points (support)
First entry point (medium risk): at levels $11.94 to $12.70 (retesting MA(7) and the nearby daily low).
Second entry point (stronger and safer): at levels $9.57 to $10.27.
2. Targets
First target: $20.26
Second target: $24.39
3. Stop loss
Closing a candle below $9.50 completely nullifies the bullish scenario.
🛑 Current chart reading and indicators:
Overall Trend:
The coin is on a strong bullish trend clearly visible on the daily frame.
The current price is 17.044, achieving an increase of 28.91%+.
The price is trading above the moving averages MA(7) at 11.94 and MA(25) at 10.27, indicating significant buying power.
Relative Strength Index (RSI):
RSI(6) is at 75.55 and RSI(14) at 67.32.
This indicates that the price is approaching or has already entered the overbought zone. Buying directly from the current peak carries a high risk of a sudden downward correction (Profit Taking).
MACD Indicator:
The DIF line is above the DEA line, and the green bars have started to increase again, reflecting renewed bullish momentum, but the current candle has approached the previous peak (24.39).
🎯 Suggested trading plan (entry and exit points)
Since the price is currently high and has risen strongly, the best strategy is to wait for a correction (Buy the Dip) and not chase the price to avoid getting stuck at the peak.
1. Suitable entry points (support)
First entry point (medium risk): at levels $11.94 to $12.70 (retesting MA(7) and the nearby daily low).
Second entry point (stronger and safer): at levels $9.57 to $10.27.
2. Targets
First target: $20.26
Second target: $24.39
3. Stop loss
Closing a candle below $9.50 completely nullifies the bullish scenario.
2
142
·
--
Detailed Analysis 📊 of VELVET with Guaranteed Entry Points
$VELVET
{future}(VELVETUSDT)
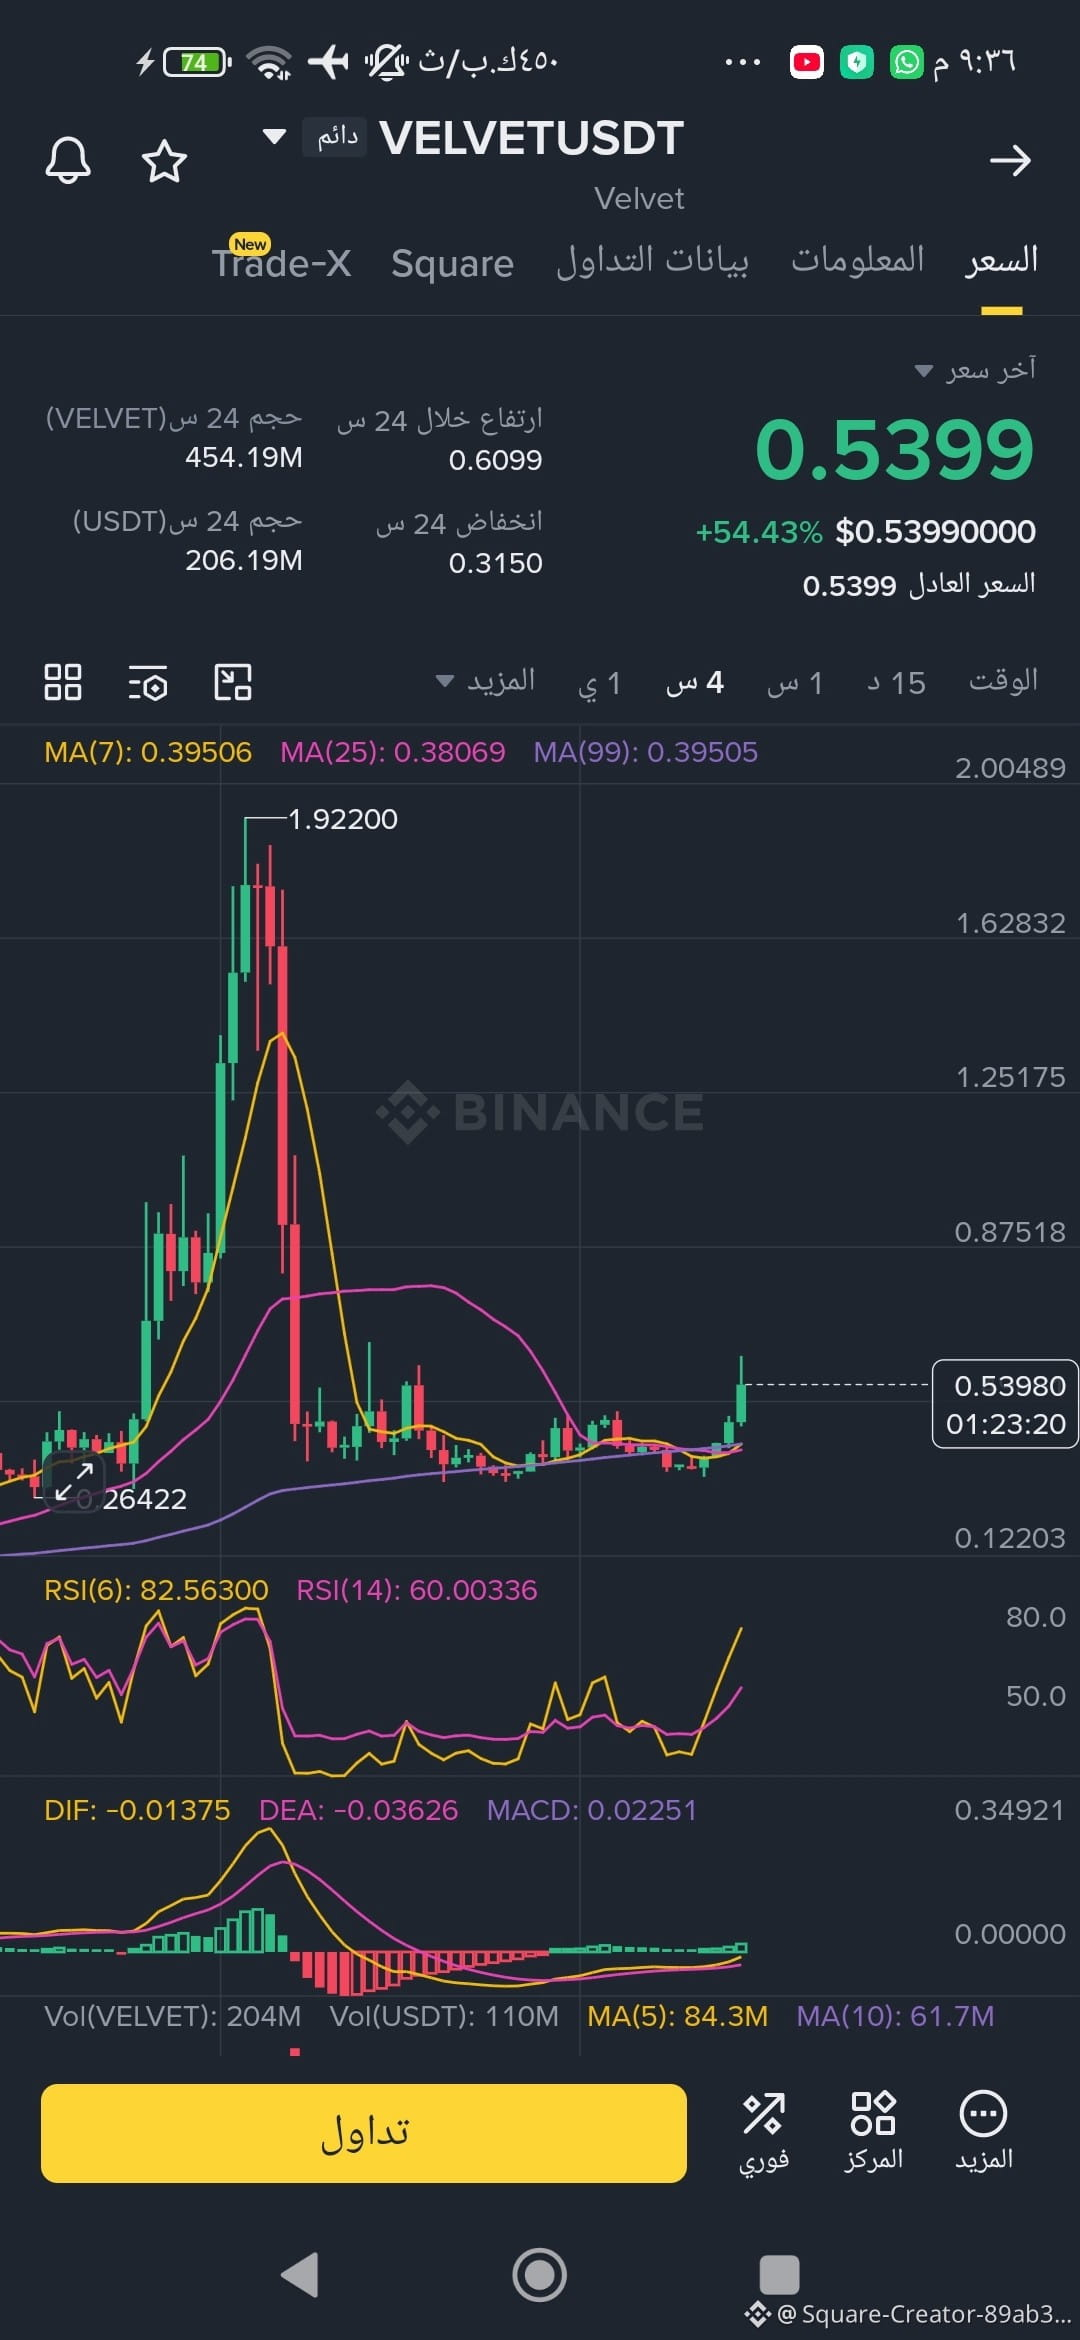
The chart shows that the VELVETUSDT pair on the 4-hour timeframe is in a recovery wave after a sharp decline. The price is currently near 0.538 with a clear increase in volume, and the MACD is turning positive. However, the short-term RSI is high, indicating the possibility of a short-term correction.
Nearby Resistance
🟥0.55 – 0.58: First resistance.
🟥0.65 – 0.70: Stronger resistance if the upward momentum continues.
Support
🟩0.47 – 0.49: Near support.
🟩0.40 – 0.42: Major support.
Potential Buying Plan
Wait for a daily or 4-hour candle to close above 0.55.
Enter between 0.55 and 0.57 after confirmation of the breakout.
Stop loss below 0.49. 🚫
Targets:
0.651
0.752
0.903
Short Selling Plan
If the price fails to hold above 0.55 and reversal candles appear after breaking 0.49, the potential targets are:
0.441
0.402
Detailed Analysis 📊 of VELVET with Guaranteed Entry Points
$VELVET
The chart shows that the VELVETUSDT pair on the 4-hour timeframe is in a recovery wave after a sharp decline. The price is currently near 0.538 with a clear increase in volume, and the MACD is turning positive. However, the short-term RSI is high, indicating the possibility of a short-term correction.
Nearby Resistance
🟥0.55 – 0.58: First resistance.
🟥0.65 – 0.70: Stronger resistance if the upward momentum continues.
Support
🟩0.47 – 0.49: Near support.
🟩0.40 – 0.42: Major support.
Potential Buying Plan
Wait for a daily or 4-hour candle to close above 0.55.
Enter between 0.55 and 0.57 after confirmation of the breakout.
Stop loss below 0.49. 🚫
Targets:
0.651
0.752
0.903
Short Selling Plan
If the price fails to hold above 0.55 and reversal candles appear after breaking 0.49, the potential targets are:
0.441
0.402
$VELVET
The chart shows that the VELVETUSDT pair on the 4-hour timeframe is in a recovery wave after a sharp decline. The price is currently near 0.538 with a clear increase in volume, and the MACD is turning positive. However, the short-term RSI is high, indicating the possibility of a short-term correction.
Nearby Resistance
🟥0.55 – 0.58: First resistance.
🟥0.65 – 0.70: Stronger resistance if the upward momentum continues.
Support
🟩0.47 – 0.49: Near support.
🟩0.40 – 0.42: Major support.
Potential Buying Plan
Wait for a daily or 4-hour candle to close above 0.55.
Enter between 0.55 and 0.57 after confirmation of the breakout.
Stop loss below 0.49. 🚫
Targets:
0.651
0.752
0.903
Short Selling Plan
If the price fails to hold above 0.55 and reversal candles appear after breaking 0.49, the potential targets are:
0.441
0.402
2
1
91
·
--
Detailed Analysis of SYN Currency with Guaranteed Entry Points
$SYN
{future}(SYNUSDT)
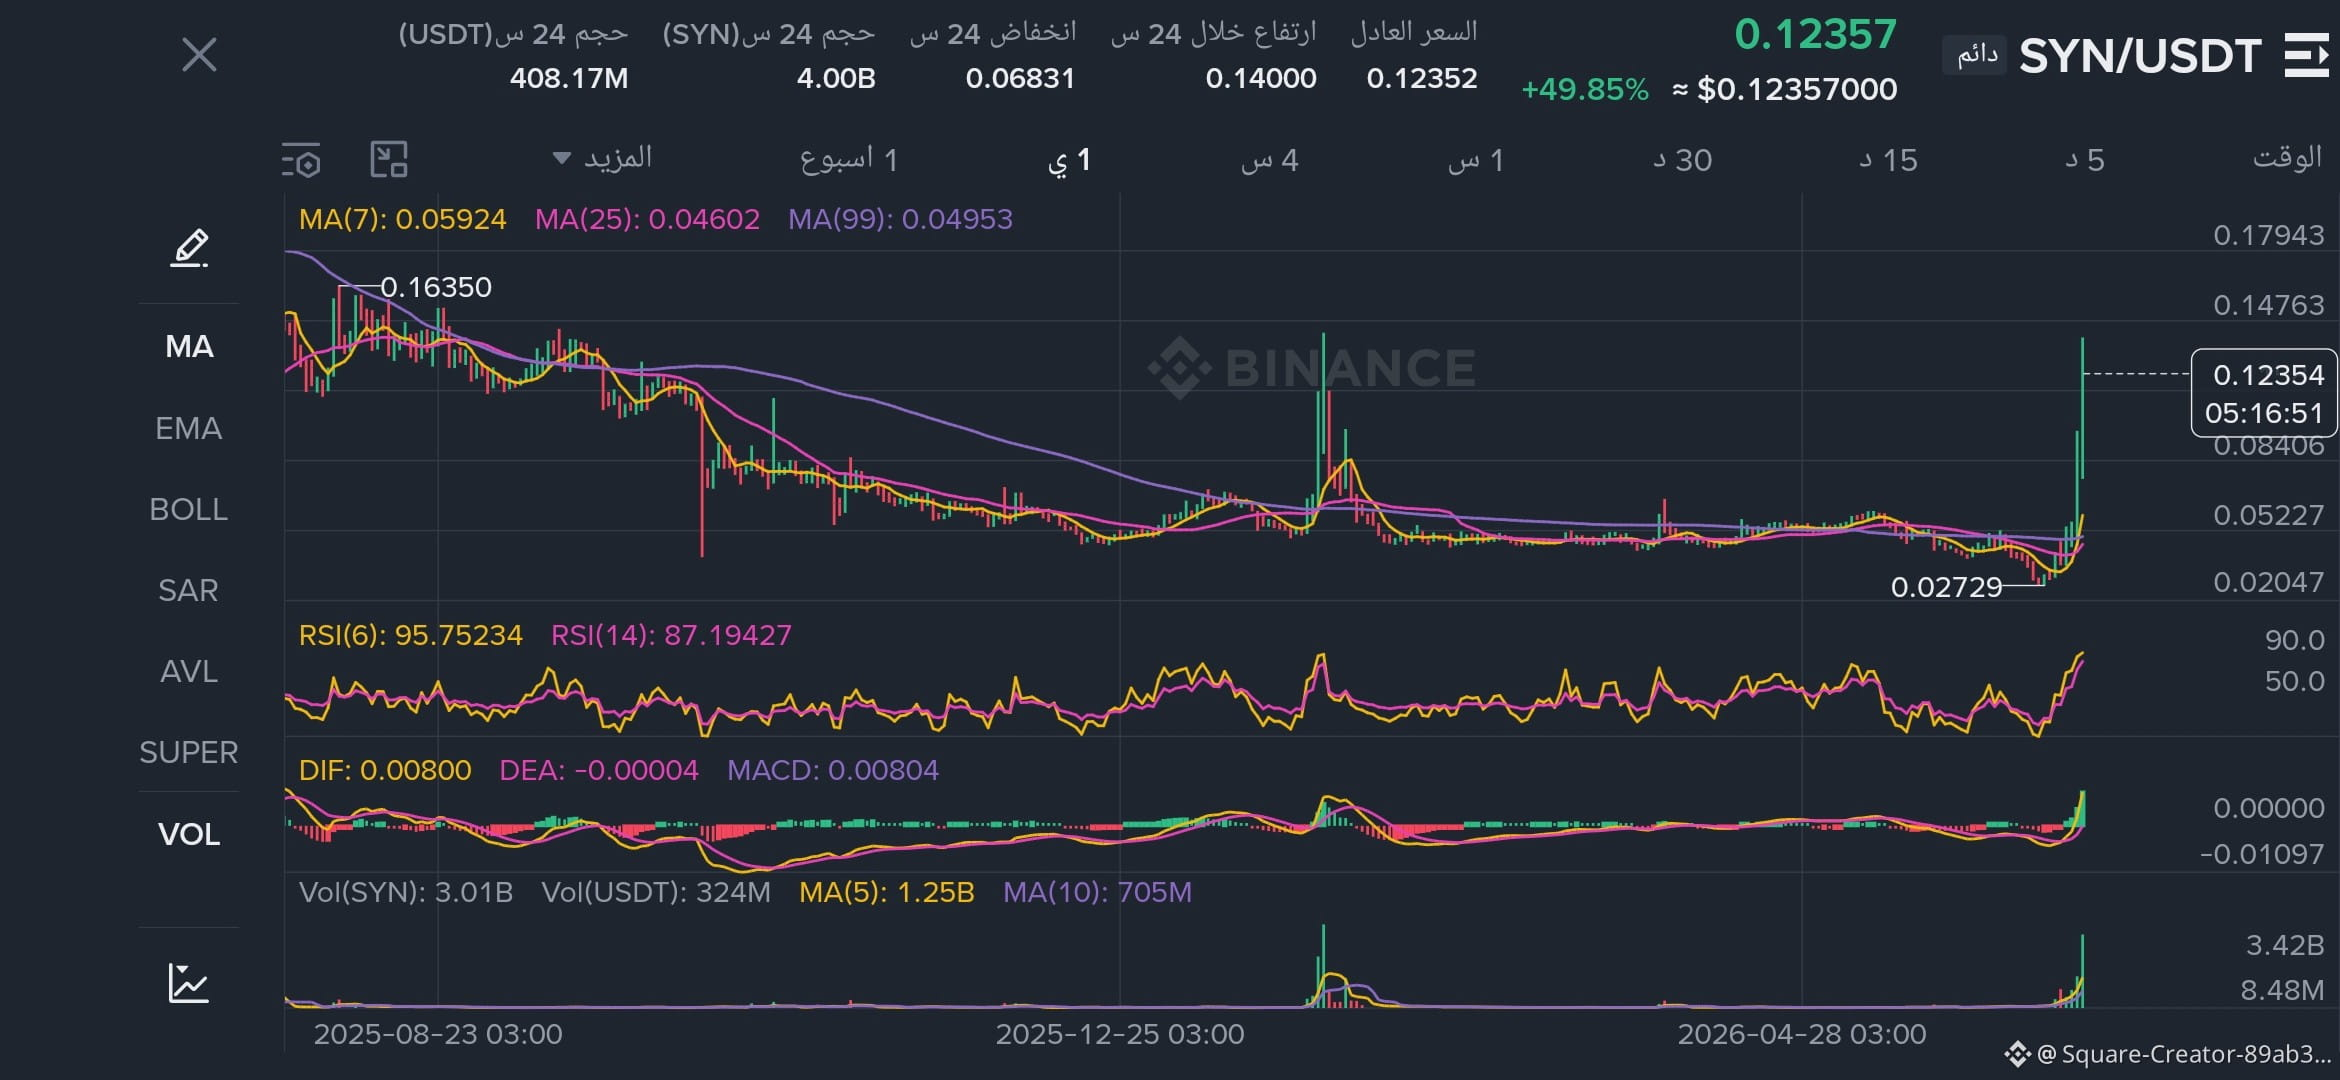
From the attached chart of the SYN/USDT pair on the daily timeframe, a very strong upward surge occurred with a significant increase in trading volume. However, the RSI indicator is very high (above 85), which means the price is overbought and may experience a correction or strong volatility.
No trade is guaranteed, especially after a nearly 50% rise in one day.
Resistance
0.125 – 0.130 Current resistance.
0.147 – 0.163 Strong resistance zone (previous high).
Support
0.100 – 0.105 Initial support.
0.084 Important support.
0.052 Key support if a deep correction occurs.
A safer buying plan
Do not chase the current price.
Wait for a correction towards 0.100–0.105 and then the appearance of retracement candles.
Stop loss below 0.084. Targets:
0.147
0.163
0.180 if the momentum continues.
Short Selling Plan:
If strong reversal candles appear and the price fails to break through 0.125–0.130, a decline towards:
0.105
0.084 is possible. Entering a sell position immediately after the current rally carries high risk, as the currency is in a state of strong momentum. Entering a buy position at these levels is also not ideal.
Detailed Analysis of SYN Currency with Guaranteed Entry Points
$SYN
From the attached chart of the SYN/USDT pair on the daily timeframe, a very strong upward surge occurred with a significant increase in trading volume. However, the RSI indicator is very high (above 85), which means the price is overbought and may experience a correction or strong volatility.
No trade is guaranteed, especially after a nearly 50% rise in one day.
Resistance
0.125 – 0.130 Current resistance.
0.147 – 0.163 Strong resistance zone (previous high).
Support
0.100 – 0.105 Initial support.
0.084 Important support.
0.052 Key support if a deep correction occurs.
A safer buying plan
Do not chase the current price.
Wait for a correction towards 0.100–0.105 and then the appearance of retracement candles.
Stop loss below 0.084. Targets:
0.147
0.163
0.180 if the momentum continues.
Short Selling Plan:
If strong reversal candles appear and the price fails to break through 0.125–0.130, a decline towards:
0.105
0.084 is possible. Entering a sell position immediately after the current rally carries high risk, as the currency is in a state of strong momentum. Entering a buy position at these levels is also not ideal.
$SYN
From the attached chart of the SYN/USDT pair on the daily timeframe, a very strong upward surge occurred with a significant increase in trading volume. However, the RSI indicator is very high (above 85), which means the price is overbought and may experience a correction or strong volatility.
No trade is guaranteed, especially after a nearly 50% rise in one day.
Resistance
0.125 – 0.130 Current resistance.
0.147 – 0.163 Strong resistance zone (previous high).
Support
0.100 – 0.105 Initial support.
0.084 Important support.
0.052 Key support if a deep correction occurs.
A safer buying plan
Do not chase the current price.
Wait for a correction towards 0.100–0.105 and then the appearance of retracement candles.
Stop loss below 0.084. Targets:
0.147
0.163
0.180 if the momentum continues.
Short Selling Plan:
If strong reversal candles appear and the price fails to break through 0.125–0.130, a decline towards:
0.105
0.084 is possible. Entering a sell position immediately after the current rally carries high risk, as the currency is in a state of strong momentum. Entering a buy position at these levels is also not ideal.
1
1
154
·
--
Based on the daily chart of $ZEREBRO
{future}(ZEREBROUSDT)
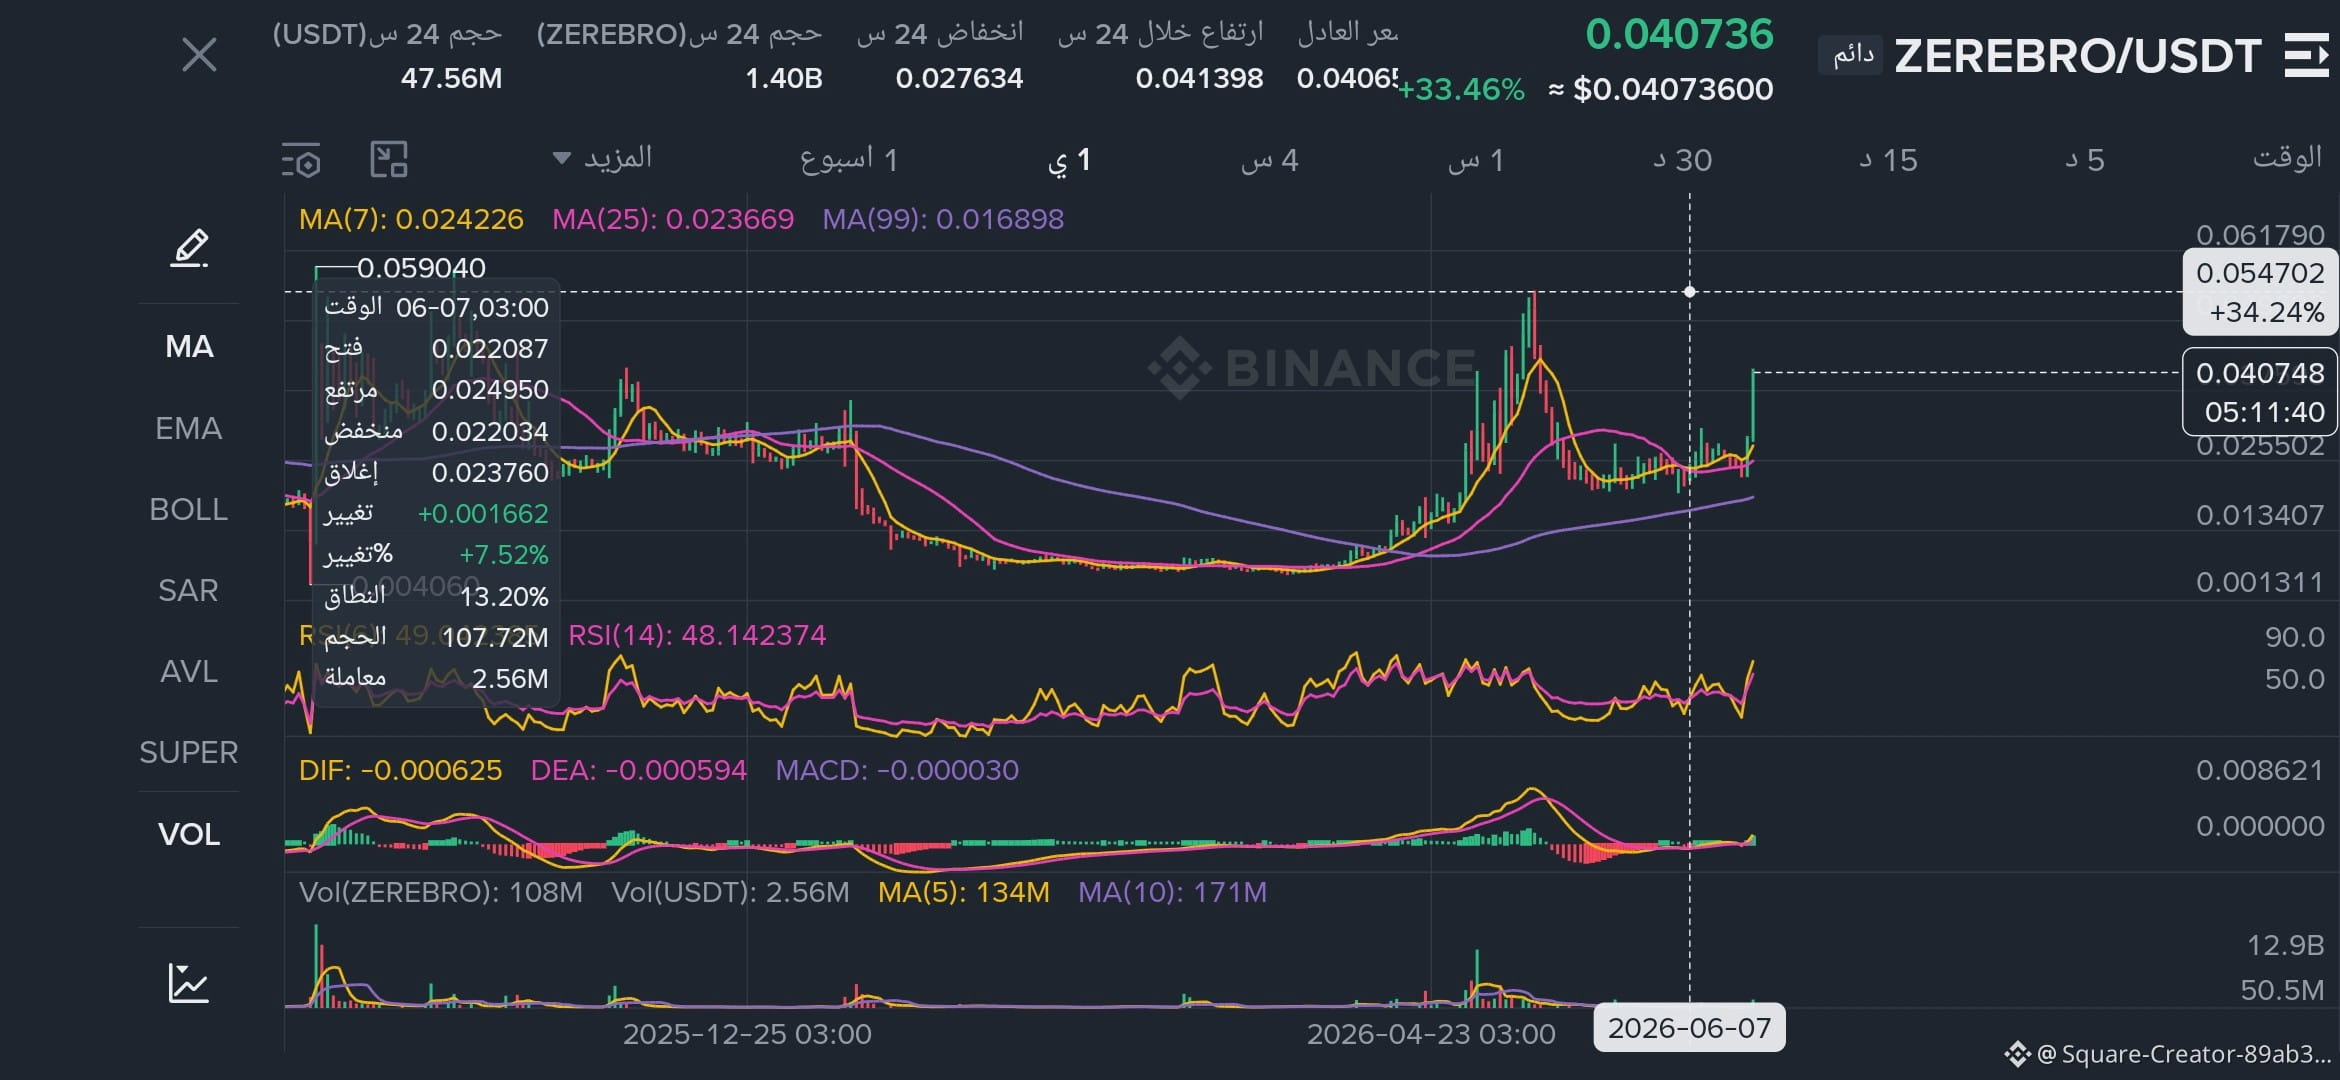
/USDT, the overall trend has turned bullish after a long consolidation period. The current price is around 0.0407, supported by increasing volume, but there is a significant resistance area just above the current price.
There is no guaranteed trade in the market, so waiting for confirmation is safer than chasing the price.
Resistance Levels
0.042 – 0.045: Near-term resistance.
0.054 – 0.059: Strong resistance zone and previous high.
Support Levels
0.033 – 0.035: First support area.
0.025 – 0.027: Major support zone, aligned with key moving averages.
Potential Long Setup
If the price closes above 0.042 on the 4-hour or daily timeframe with strong volume:
Entry: 0.042 – 0.043
Stop Loss: 0.036
Targets:
0.054
0.059
0.065 if bullish momentum continues
Buy-the-Dip Scenario
If the price retraces to 0.033 – 0.035 and shows bullish reversal candles:
This area could provide a better entry.
Stop Loss: Below 0.029.
Bearish Scenario
If the price fails to break above 0.042 and loses 0.033 support, it may decline toward 0.027.
At the moment, the trend favors the upside, but the price is approaching resistance. Waiting for either a confirmed breakout or a pullback to support would offer a better risk-to-reward ratio.
Based on the daily chart of $ZEREBRO
/USDT, the overall trend has turned bullish after a long consolidation period. The current price is around 0.0407, supported by increasing volume, but there is a significant resistance area just above the current price.
There is no guaranteed trade in the market, so waiting for confirmation is safer than chasing the price.
Resistance Levels
0.042 – 0.045: Near-term resistance.
0.054 – 0.059: Strong resistance zone and previous high.
Support Levels
0.033 – 0.035: First support area.
0.025 – 0.027: Major support zone, aligned with key moving averages.
Potential Long Setup
If the price closes above 0.042 on the 4-hour or daily timeframe with strong volume:
Entry: 0.042 – 0.043
Stop Loss: 0.036
Targets:
0.054
0.059
0.065 if bullish momentum continues
Buy-the-Dip Scenario
If the price retraces to 0.033 – 0.035 and shows bullish reversal candles:
This area could provide a better entry.
Stop Loss: Below 0.029.
Bearish Scenario
If the price fails to break above 0.042 and loses 0.033 support, it may decline toward 0.027.
At the moment, the trend favors the upside, but the price is approaching resistance. Waiting for either a confirmed breakout or a pullback to support would offer a better risk-to-reward ratio.
/USDT, the overall trend has turned bullish after a long consolidation period. The current price is around 0.0407, supported by increasing volume, but there is a significant resistance area just above the current price.
There is no guaranteed trade in the market, so waiting for confirmation is safer than chasing the price.
Resistance Levels
0.042 – 0.045: Near-term resistance.
0.054 – 0.059: Strong resistance zone and previous high.
Support Levels
0.033 – 0.035: First support area.
0.025 – 0.027: Major support zone, aligned with key moving averages.
Potential Long Setup
If the price closes above 0.042 on the 4-hour or daily timeframe with strong volume:
Entry: 0.042 – 0.043
Stop Loss: 0.036
Targets:
0.054
0.059
0.065 if bullish momentum continues
Buy-the-Dip Scenario
If the price retraces to 0.033 – 0.035 and shows bullish reversal candles:
This area could provide a better entry.
Stop Loss: Below 0.029.
Bearish Scenario
If the price fails to break above 0.042 and loses 0.033 support, it may decline toward 0.027.
At the moment, the trend favors the upside, but the price is approaching resistance. Waiting for either a confirmed breakout or a pullback to support would offer a better risk-to-reward ratio.
1
1
90
·
--
📊 In-depth analysis for crypto $ZEREBRO with guaranteed entry points
{future}(ZEREBROUSDT)
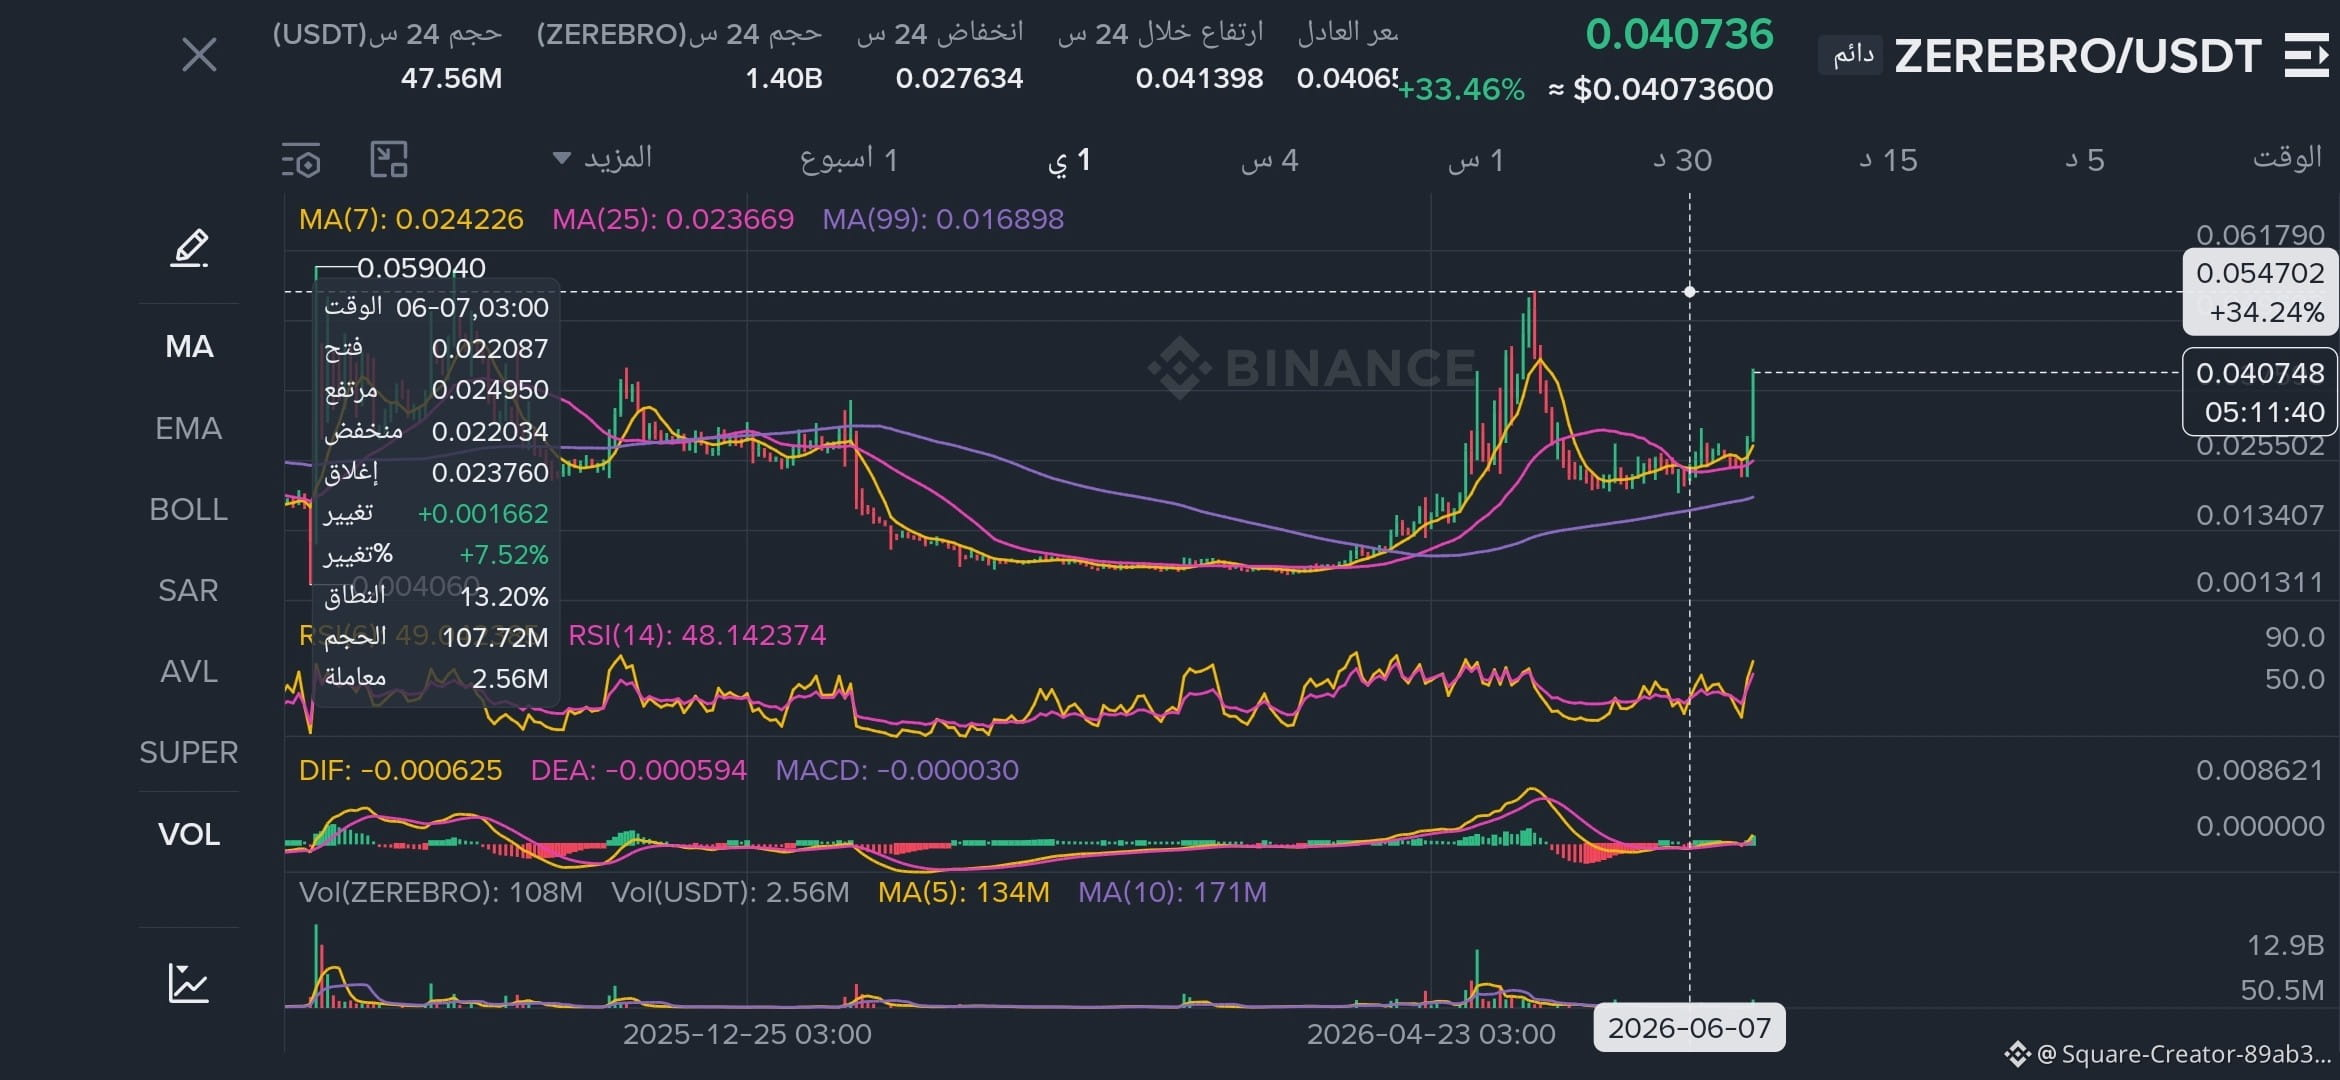
from the daily chart of the ZEREBRO/USDT pair, the overall trend has turned bullish after a long accumulation phase, with the price currently at 0.0407 and an increase in volume, but there’s significant resistance just above the price.
There are no guaranteed trades, so it’s best to wait for a confirmation of movement instead of chasing the price.
Resistance levels:
0.042 – 0.045 close resistance.
0.054 – 0.059 strong resistance zone (previous high).
Support levels:
0.033 – 0.035 first support.
0.025 – 0.027 major support, which aligns with moving averages.
Potential buy plan:
If the price closes daily or on the 4-hour above 0.042 with volume continuing to rise:
Entry: 0.042 – 0.043
Stop loss: 0.036
Targets:
0.054
0.059
0.065 if momentum continues
Buy plan after correction:
If the price returns to the 0.033 – 0.035 zone and bullish reversal candles appear:
This can be considered a better entry zone.
Stop loss below 0.029.
Bearish scenario:
If the price fails to break above 0.042 and breaks below 0.033, it may retrace towards 0.027.
Currently, the trend leans bullish, but the price is near resistance, so waiting for a clear breakout or a correction towards support provides a better risk-reward ratio.
📊 In-depth analysis for crypto $ZEREBRO with guaranteed entry points
from the daily chart of the ZEREBRO/USDT pair, the overall trend has turned bullish after a long accumulation phase, with the price currently at 0.0407 and an increase in volume, but there’s significant resistance just above the price.
There are no guaranteed trades, so it’s best to wait for a confirmation of movement instead of chasing the price.
Resistance levels:
0.042 – 0.045 close resistance.
0.054 – 0.059 strong resistance zone (previous high).
Support levels:
0.033 – 0.035 first support.
0.025 – 0.027 major support, which aligns with moving averages.
Potential buy plan:
If the price closes daily or on the 4-hour above 0.042 with volume continuing to rise:
Entry: 0.042 – 0.043
Stop loss: 0.036
Targets:
0.054
0.059
0.065 if momentum continues
Buy plan after correction:
If the price returns to the 0.033 – 0.035 zone and bullish reversal candles appear:
This can be considered a better entry zone.
Stop loss below 0.029.
Bearish scenario:
If the price fails to break above 0.042 and breaks below 0.033, it may retrace towards 0.027.
Currently, the trend leans bullish, but the price is near resistance, so waiting for a clear breakout or a correction towards support provides a better risk-reward ratio.
from the daily chart of the ZEREBRO/USDT pair, the overall trend has turned bullish after a long accumulation phase, with the price currently at 0.0407 and an increase in volume, but there’s significant resistance just above the price.
There are no guaranteed trades, so it’s best to wait for a confirmation of movement instead of chasing the price.
Resistance levels:
0.042 – 0.045 close resistance.
0.054 – 0.059 strong resistance zone (previous high).
Support levels:
0.033 – 0.035 first support.
0.025 – 0.027 major support, which aligns with moving averages.
Potential buy plan:
If the price closes daily or on the 4-hour above 0.042 with volume continuing to rise:
Entry: 0.042 – 0.043
Stop loss: 0.036
Targets:
0.054
0.059
0.065 if momentum continues
Buy plan after correction:
If the price returns to the 0.033 – 0.035 zone and bullish reversal candles appear:
This can be considered a better entry zone.
Stop loss below 0.029.
Bearish scenario:
If the price fails to break above 0.042 and breaks below 0.033, it may retrace towards 0.027.
Currently, the trend leans bullish, but the price is near resistance, so waiting for a clear breakout or a correction towards support provides a better risk-reward ratio.
1
1
137
·
--
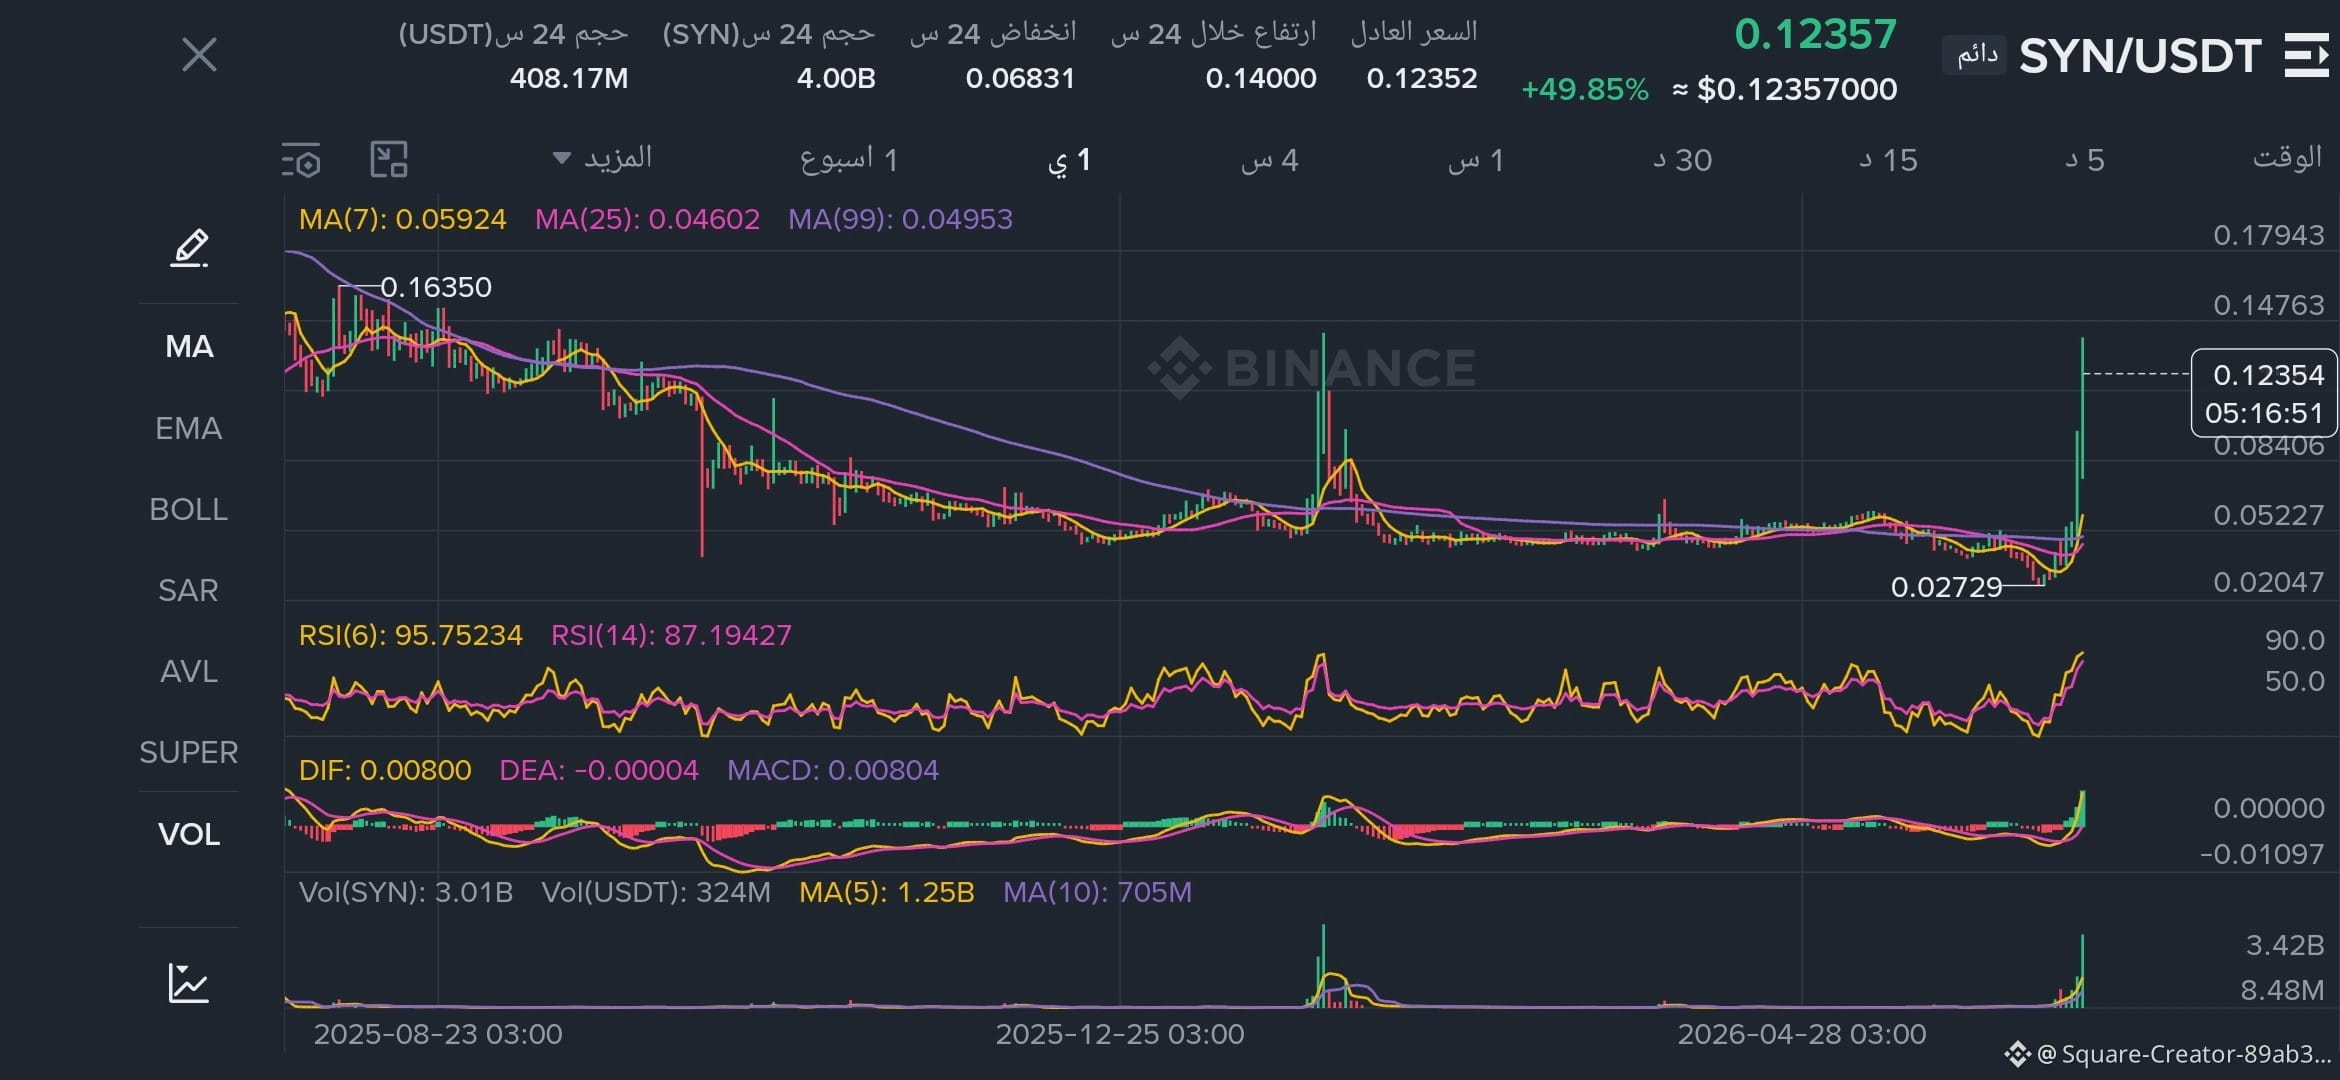
📊In-depth analysis for coin $SYN with guaranteed trade entry points
{future}(SYNUSDT)
From the attached image of the SYN/USDT pair on the daily chart, there was a very strong bullish wave with a significant increase in trading volumes, but the RSI indicator is extremely high (above 85), which means the price is in overbought territory and might experience a correction or strong volatility.
There are no guaranteed trades, especially after a nearly 50% rise in a single day.
Resistance
0.125 – 0.130 current resistance.
0.147 – 0.163 strong resistance zone (previous high).
Support
0.100 – 0.105 first support.
0.084 important support.
0.052 major support if a deep correction occurs.
Safer buying plan
Avoid chasing the current price.
Wait for a correction towards 0.100–0.105, then look for bullish candlestick patterns.
Stop loss below 0.084.
Targets:
0.147
0.163
0.180 if momentum continues.
Shorting plan
If strong bearish candlesticks appear and the price fails to break through 0.125–0.130, a drop towards may occur:
0.105
0.084
Entering a short position at the current rise carries high risk, as the coin is in strong momentum, and entering a buy at these levels is also not ideal.
.
📊In-depth analysis for coin $SYN with guaranteed trade entry points
From the attached image of the SYN/USDT pair on the daily chart, there was a very strong bullish wave with a significant increase in trading volumes, but the RSI indicator is extremely high (above 85), which means the price is in overbought territory and might experience a correction or strong volatility.
There are no guaranteed trades, especially after a nearly 50% rise in a single day.
Resistance
0.125 – 0.130 current resistance.
0.147 – 0.163 strong resistance zone (previous high).
Support
0.100 – 0.105 first support.
0.084 important support.
0.052 major support if a deep correction occurs.
Safer buying plan
Avoid chasing the current price.
Wait for a correction towards 0.100–0.105, then look for bullish candlestick patterns.
Stop loss below 0.084.
Targets:
0.147
0.163
0.180 if momentum continues.
Shorting plan
If strong bearish candlesticks appear and the price fails to break through 0.125–0.130, a drop towards may occur:
0.105
0.084
Entering a short position at the current rise carries high risk, as the coin is in strong momentum, and entering a buy at these levels is also not ideal.
.
From the attached image of the SYN/USDT pair on the daily chart, there was a very strong bullish wave with a significant increase in trading volumes, but the RSI indicator is extremely high (above 85), which means the price is in overbought territory and might experience a correction or strong volatility.
There are no guaranteed trades, especially after a nearly 50% rise in a single day.
Resistance
0.125 – 0.130 current resistance.
0.147 – 0.163 strong resistance zone (previous high).
Support
0.100 – 0.105 first support.
0.084 important support.
0.052 major support if a deep correction occurs.
Safer buying plan
Avoid chasing the current price.
Wait for a correction towards 0.100–0.105, then look for bullish candlestick patterns.
Stop loss below 0.084.
Targets:
0.147
0.163
0.180 if momentum continues.
Shorting plan
If strong bearish candlesticks appear and the price fails to break through 0.125–0.130, a drop towards may occur:
0.105
0.084
Entering a short position at the current rise carries high risk, as the coin is in strong momentum, and entering a buy at these levels is also not ideal.
.
1
1
138
·
--
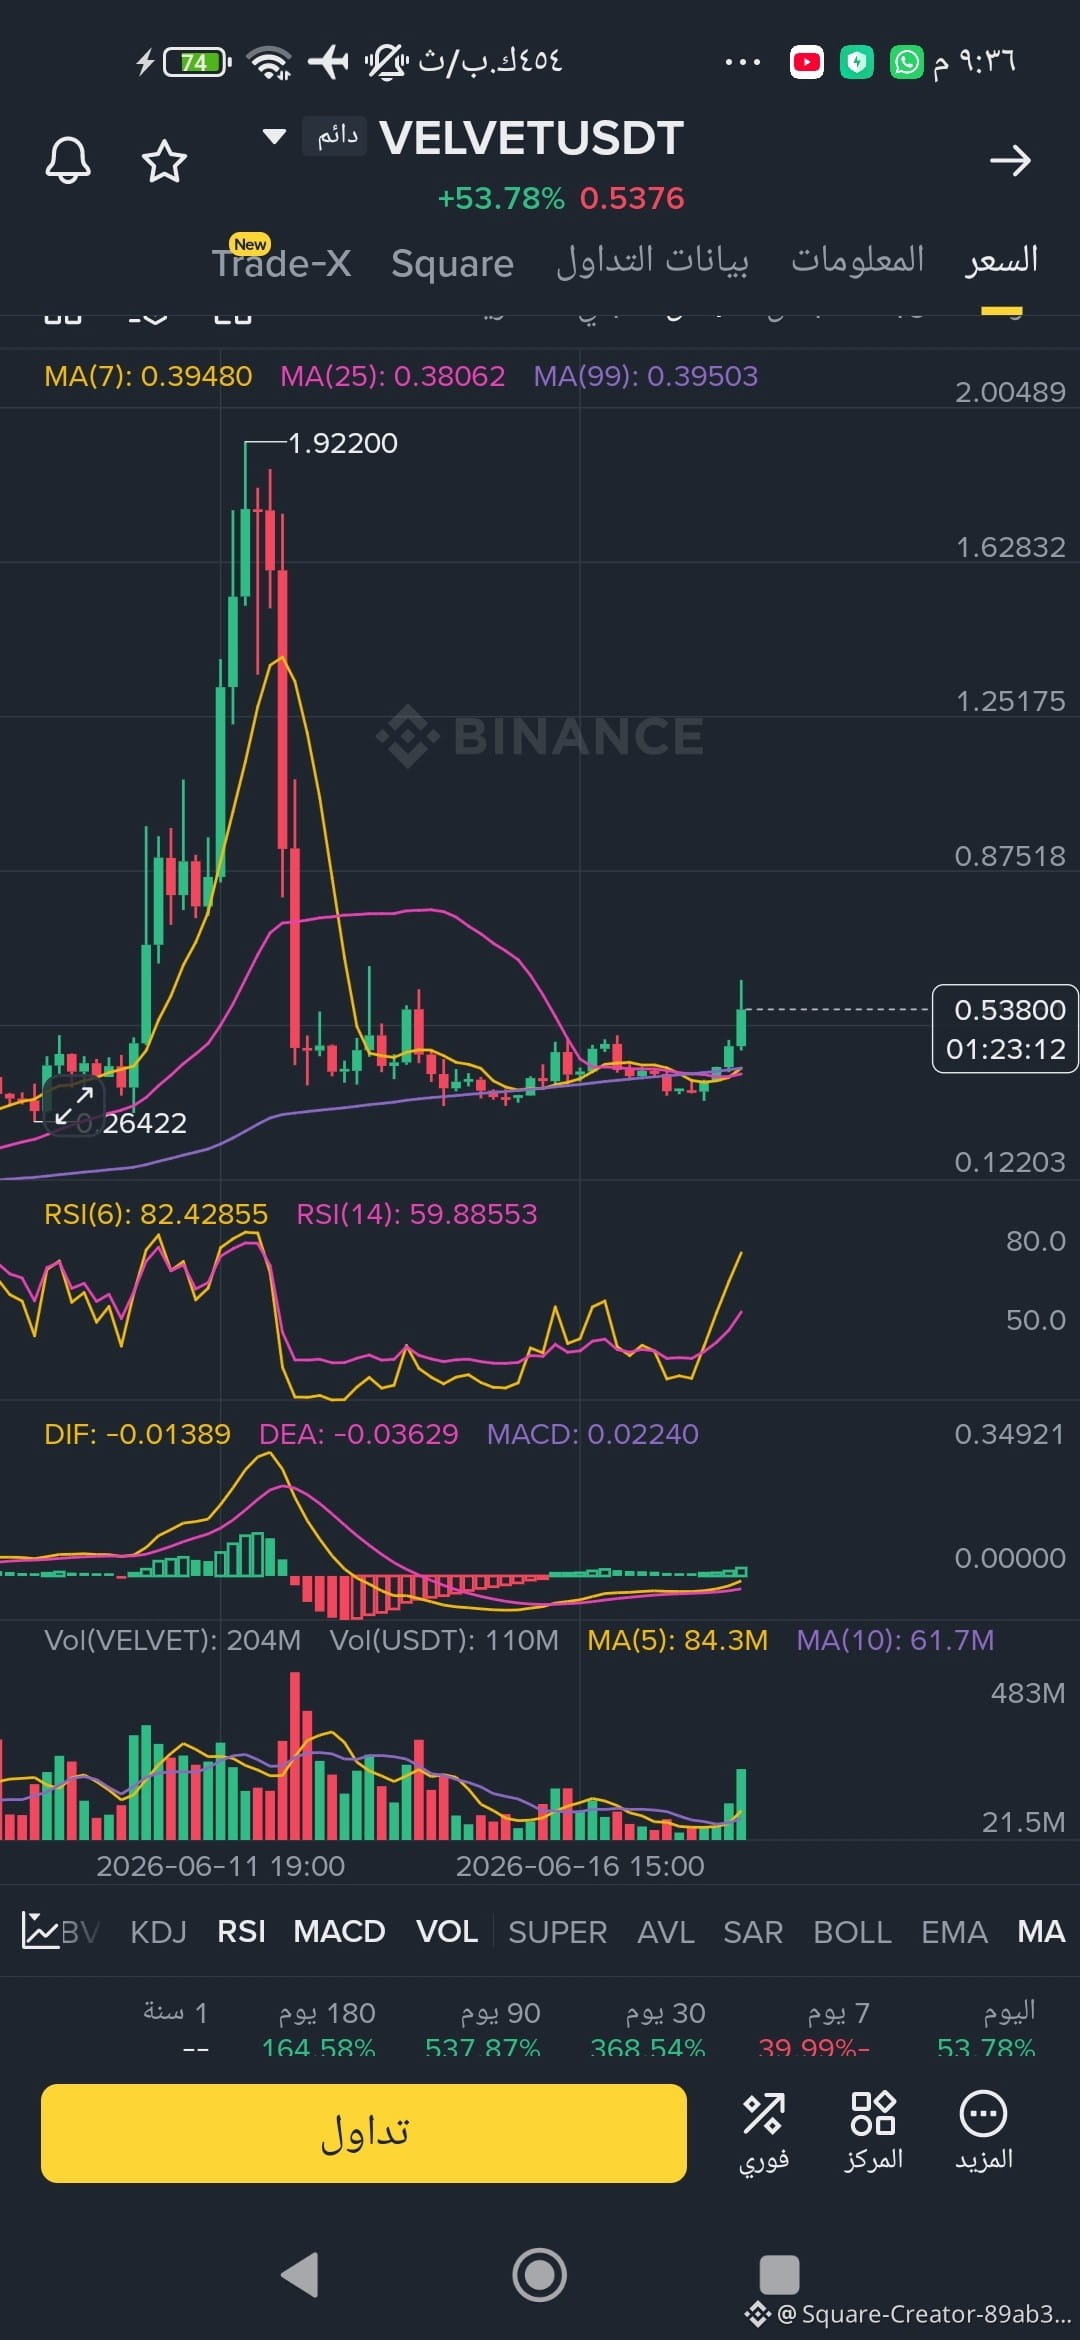
Accurate analysis 📊 for crypto $VELVET with guaranteed trade entry points
{future}(VELVETUSDT)
From the chart, it shows that the VELVETUSDT pair on the 4-hour timeframe is in a recovery wave after a strong drop, and the price is currently around 0.538 with a noticeable increase in volume. The MACD is starting to turn positive, but the short-term RSI is high, indicating a potential for a brief correction.
Nearby resistance
🟥0.55 – 0.58 first resistance level.
🟥0.65 – 0.70 stronger resistance if the bullish momentum continues.
Support
🟩0.47 – 0.49 near support.
🟩0.40 – 0.42 major support.
Potential buying plan
Wait for a daily or 4-hour candlestick to close above 0.55.
Enter between 0.55 and 0.57 after confirming the breakout.
Stop loss below 0.49.🚫
Targets:
0.651️⃣
0.752️⃣
0.903️⃣
Selling plan (short)
If the price fails to hold above 0.55 and reversal candles appear with a break below 0.49, potential targets could be:
0.441️⃣
0.402️⃣
Accurate analysis 📊 for crypto $VELVET with guaranteed trade entry points
From the chart, it shows that the VELVETUSDT pair on the 4-hour timeframe is in a recovery wave after a strong drop, and the price is currently around 0.538 with a noticeable increase in volume. The MACD is starting to turn positive, but the short-term RSI is high, indicating a potential for a brief correction.
Nearby resistance
🟥0.55 – 0.58 first resistance level.
🟥0.65 – 0.70 stronger resistance if the bullish momentum continues.
Support
🟩0.47 – 0.49 near support.
🟩0.40 – 0.42 major support.
Potential buying plan
Wait for a daily or 4-hour candlestick to close above 0.55.
Enter between 0.55 and 0.57 after confirming the breakout.
Stop loss below 0.49.🚫
Targets:
0.651️⃣
0.752️⃣
0.903️⃣
Selling plan (short)
If the price fails to hold above 0.55 and reversal candles appear with a break below 0.49, potential targets could be:
0.441️⃣
0.402️⃣
From the chart, it shows that the VELVETUSDT pair on the 4-hour timeframe is in a recovery wave after a strong drop, and the price is currently around 0.538 with a noticeable increase in volume. The MACD is starting to turn positive, but the short-term RSI is high, indicating a potential for a brief correction.
Nearby resistance
🟥0.55 – 0.58 first resistance level.
🟥0.65 – 0.70 stronger resistance if the bullish momentum continues.
Support
🟩0.47 – 0.49 near support.
🟩0.40 – 0.42 major support.
Potential buying plan
Wait for a daily or 4-hour candlestick to close above 0.55.
Enter between 0.55 and 0.57 after confirming the breakout.
Stop loss below 0.49.🚫
Targets:
0.651️⃣
0.752️⃣
0.903️⃣
Selling plan (short)
If the price fails to hold above 0.55 and reversal candles appear with a break below 0.49, potential targets could be:
0.441️⃣
0.402️⃣
1
3
245
·
--
Ethereum is about to dip or will it pump? Share your thoughts in the comments and let's see who’s the genius in analysis
$ETH
{future}(ETHUSDT)
Ethereum is about to dip or will it pump? Share your thoughts in the comments and let's see who’s the genius in analysis
$ETH
$ETH
1
1
1
145
·
--
Based on the daily chart for the STG/USDT pair shown in the , here is a pre$STG
{future}(STGUSDT)
Based on the daily chart for the STG/USDT pair shown in the image ., here is a precise technical analysis featuring the key Support and Resistance levels to help you map out your trade setup:
🛑 Resistance Levels
Resistance levels represent zones where selling pressure and profit-taking are highly concentrated, preventing the price from climbing further in the short term:
First Resistance (Current Peak): 0.3950
Analysis: This is the exact local high reached during the recent massive bullish impulse (indicated by the horizontal line on the chart). The price immediately pulled back upon touching it, making it the strongest immediate barrier.
Second Resistance (Extended Target): 0.4100
Analysis: This acts as the next psychological and technical target if the price manages to break above the first resistance and close a daily candle firmly above it.
🟢 Support Levels
Support levels represent zones where buying interest is expected to step in, acting as a floor to prevent the price from entering a free fall:
First Support (Immediate Retest): 0.2800
Analysis: This level aligns with previous minor peaks formed during prior breakout attempts. The price frequently needs to drop and retest such broken resistances to confirm them as new valid support.
Second Support (Major Demand Zone): 0.2150
Analysis: This area served as a heavy ceiling for a multi-month accumulation/sideways phase. Since it was broken by a massive daily candle, it has now transformed into a major institutional demand zone and will act as a price magnet during a healthy market correction.
Third Support (Moving Averages): 0.2050
Analysis: This level converges perfectly with the daily Moving Averages, MA(7) and MA(25). A daily close below this zone would completely invalidate the current bullish structure.
🧭 How to Use These Levels for Trading
The Safe Buying Strategy: Avoid chasing the green candle at the current price (0.3822). Instead, wait for a healthy pullback to set buy orders around Support 1 (0.2800) or ladder down to Support 2 (0.2150) for a much safer risk-to-reward entry.
The Breakout Strategy: Alternatively, if the daily candle closes convincingly above 0.3950 with sustained high volume, you can look for a long position on the retest of that level, targeting 0.4100 and beyond.
Stop-Loss Management: If you enter near the support levels, your strict stop-loss should be a daily candle close below 0.1950 (just beneath the third support line).
Based on the daily chart for the STG/USDT pair shown in the , here is a pre
$STG
Based on the daily chart for the STG/USDT pair shown in the image ., here is a precise technical analysis featuring the key Support and Resistance levels to help you map out your trade setup:
🛑 Resistance Levels
Resistance levels represent zones where selling pressure and profit-taking are highly concentrated, preventing the price from climbing further in the short term:
First Resistance (Current Peak): 0.3950
Analysis: This is the exact local high reached during the recent massive bullish impulse (indicated by the horizontal line on the chart). The price immediately pulled back upon touching it, making it the strongest immediate barrier.
Second Resistance (Extended Target): 0.4100
Analysis: This acts as the next psychological and technical target if the price manages to break above the first resistance and close a daily candle firmly above it.
🟢 Support Levels
Support levels represent zones where buying interest is expected to step in, acting as a floor to prevent the price from entering a free fall:
First Support (Immediate Retest): 0.2800
Analysis: This level aligns with previous minor peaks formed during prior breakout attempts. The price frequently needs to drop and retest such broken resistances to confirm them as new valid support.
Second Support (Major Demand Zone): 0.2150
Analysis: This area served as a heavy ceiling for a multi-month accumulation/sideways phase. Since it was broken by a massive daily candle, it has now transformed into a major institutional demand zone and will act as a price magnet during a healthy market correction.
Third Support (Moving Averages): 0.2050
Analysis: This level converges perfectly with the daily Moving Averages, MA(7) and MA(25). A daily close below this zone would completely invalidate the current bullish structure.
🧭 How to Use These Levels for Trading
The Safe Buying Strategy: Avoid chasing the green candle at the current price (0.3822). Instead, wait for a healthy pullback to set buy orders around Support 1 (0.2800) or ladder down to Support 2 (0.2150) for a much safer risk-to-reward entry.
The Breakout Strategy: Alternatively, if the daily candle closes convincingly above 0.3950 with sustained high volume, you can look for a long position on the retest of that level, targeting 0.4100 and beyond.
Stop-Loss Management: If you enter near the support levels, your strict stop-loss should be a daily candle close below 0.1950 (just beneath the third support line).
Based on the daily chart for the STG/USDT pair shown in the image ., here is a precise technical analysis featuring the key Support and Resistance levels to help you map out your trade setup:
🛑 Resistance Levels
Resistance levels represent zones where selling pressure and profit-taking are highly concentrated, preventing the price from climbing further in the short term:
First Resistance (Current Peak): 0.3950
Analysis: This is the exact local high reached during the recent massive bullish impulse (indicated by the horizontal line on the chart). The price immediately pulled back upon touching it, making it the strongest immediate barrier.
Second Resistance (Extended Target): 0.4100
Analysis: This acts as the next psychological and technical target if the price manages to break above the first resistance and close a daily candle firmly above it.
🟢 Support Levels
Support levels represent zones where buying interest is expected to step in, acting as a floor to prevent the price from entering a free fall:
First Support (Immediate Retest): 0.2800
Analysis: This level aligns with previous minor peaks formed during prior breakout attempts. The price frequently needs to drop and retest such broken resistances to confirm them as new valid support.
Second Support (Major Demand Zone): 0.2150
Analysis: This area served as a heavy ceiling for a multi-month accumulation/sideways phase. Since it was broken by a massive daily candle, it has now transformed into a major institutional demand zone and will act as a price magnet during a healthy market correction.
Third Support (Moving Averages): 0.2050
Analysis: This level converges perfectly with the daily Moving Averages, MA(7) and MA(25). A daily close below this zone would completely invalidate the current bullish structure.
🧭 How to Use These Levels for Trading
The Safe Buying Strategy: Avoid chasing the green candle at the current price (0.3822). Instead, wait for a healthy pullback to set buy orders around Support 1 (0.2800) or ladder down to Support 2 (0.2150) for a much safer risk-to-reward entry.
The Breakout Strategy: Alternatively, if the daily candle closes convincingly above 0.3950 with sustained high volume, you can look for a long position on the retest of that level, targeting 0.4100 and beyond.
Stop-Loss Management: If you enter near the support levels, your strict stop-loss should be a daily candle close below 0.1950 (just beneath the third support line).
1
213
·
--
In-depth analysis for pair $STG
{future}(STGUSDT)
🛑 Resistance Levels
Resistance is where selling and profit-taking ramp up, preventing the price from climbing right now:
First Resistance (current peak): 0.39501️⃣
Analysis: This is the highest peak reached during the recent price explosion as shown by the horizontal line on the candlestick chart. The price pulled back slightly upon touching it, making it the strongest resistance currently.
Second Resistance (upper range): 0.4100
Analysis: This represents the next psychological and technical level if the price manages to break through the first resistance and close a daily candle firmly above it.
🟢 Support Levels
Support is where buying power (a bounce back up) is expected to emerge, protecting the price from freefall:
First Support (nearby): 0.2800
Analysis: This represents the previous peak formed during past bounces (the broken peak). The price often needs to retest this level to confirm its shift from resistance to support.
Second Support (very strong): 0.2150
Analysis: This area previously represented the ceiling of the prior sideways movement and a stubborn resistance level that the price failed to break for several months. Breaking it with the current giant candle makes it a major support area and a magnet for the price in the event of a healthy correction.
Third Support (moving averages): 0.2050
In-depth analysis for pair $STG
🛑 Resistance Levels
Resistance is where selling and profit-taking ramp up, preventing the price from climbing right now:
First Resistance (current peak): 0.39501️⃣
Analysis: This is the highest peak reached during the recent price explosion as shown by the horizontal line on the candlestick chart. The price pulled back slightly upon touching it, making it the strongest resistance currently.
Second Resistance (upper range): 0.4100
Analysis: This represents the next psychological and technical level if the price manages to break through the first resistance and close a daily candle firmly above it.
🟢 Support Levels
Support is where buying power (a bounce back up) is expected to emerge, protecting the price from freefall:
First Support (nearby): 0.2800
Analysis: This represents the previous peak formed during past bounces (the broken peak). The price often needs to retest this level to confirm its shift from resistance to support.
Second Support (very strong): 0.2150
Analysis: This area previously represented the ceiling of the prior sideways movement and a stubborn resistance level that the price failed to break for several months. Breaking it with the current giant candle makes it a major support area and a magnet for the price in the event of a healthy correction.
Third Support (moving averages): 0.2050
🛑 Resistance Levels
Resistance is where selling and profit-taking ramp up, preventing the price from climbing right now:
First Resistance (current peak): 0.39501️⃣
Analysis: This is the highest peak reached during the recent price explosion as shown by the horizontal line on the candlestick chart. The price pulled back slightly upon touching it, making it the strongest resistance currently.
Second Resistance (upper range): 0.4100
Analysis: This represents the next psychological and technical level if the price manages to break through the first resistance and close a daily candle firmly above it.
🟢 Support Levels
Support is where buying power (a bounce back up) is expected to emerge, protecting the price from freefall:
First Support (nearby): 0.2800
Analysis: This represents the previous peak formed during past bounces (the broken peak). The price often needs to retest this level to confirm its shift from resistance to support.
Second Support (very strong): 0.2150
Analysis: This area previously represented the ceiling of the prior sideways movement and a stubborn resistance level that the price failed to break for several months. Breaking it with the current giant candle makes it a major support area and a magnet for the price in the event of a healthy correction.
Third Support (moving averages): 0.2050
6
1
472
·
--
#genius $GENIUS
The future outlook for $GENIUS: A revolution in the world of decentralized finance 🚀
In the fast-paced evolution of the crypto market, some projects stand out that don't just offer temporary solutions but are building a strong and sustainable infrastructure. The @GeniusOfficial project is a prime example of this innovation, blending cutting-edge tech with advanced security mechanisms to provide a unique experience for users in the DeFi space.
Investing in token $GENIUS isn't just about riding the current wave; it's a step towards supporting a digital ecosystem aimed at maximizing returns and minimizing risks through smart contracts designed with precision and care. The project proves day by day that real innovation relies on community and transparency.
If you're on the lookout for projects with a genuine vision and ongoing development, keeping up with this project's updates has become a must for anyone interested in the future of web 3.
#genius $GENIUS
The future outlook for $GENIUS : A revolution in the world of decentralized finance 🚀
In the fast-paced evolution of the crypto market, some projects stand out that don't just offer temporary solutions but are building a strong and sustainable infrastructure. The @GeniusOfficial project is a prime example of this innovation, blending cutting-edge tech with advanced security mechanisms to provide a unique experience for users in the DeFi space.
Investing in token $GENIUS isn't just about riding the current wave; it's a step towards supporting a digital ecosystem aimed at maximizing returns and minimizing risks through smart contracts designed with precision and care. The project proves day by day that real innovation relies on community and transparency.
If you're on the lookout for projects with a genuine vision and ongoing development, keeping up with this project's updates has become a must for anyone interested in the future of web 3.
The future outlook for $GENIUS : A revolution in the world of decentralized finance 🚀
In the fast-paced evolution of the crypto market, some projects stand out that don't just offer temporary solutions but are building a strong and sustainable infrastructure. The @GeniusOfficial project is a prime example of this innovation, blending cutting-edge tech with advanced security mechanisms to provide a unique experience for users in the DeFi space.
Investing in token $GENIUS isn't just about riding the current wave; it's a step towards supporting a digital ecosystem aimed at maximizing returns and minimizing risks through smart contracts designed with precision and care. The project proves day by day that real innovation relies on community and transparency.
If you're on the lookout for projects with a genuine vision and ongoing development, keeping up with this project's updates has become a must for anyone interested in the future of web 3.

2
156
·
--
We hit all three targets, congrats to everyone who joined us!
We hit all three targets, congrats to everyone who joined us!
Cكريبتونايت
·
--
BearishShort trade for coin $IO entry 0.1870🔴
First target 0.18001️⃣
Second target 0.17002️⃣
Third target 0.16003️⃣
Stop loss 0.19200🛑
First target 0.18001️⃣
Second target 0.17002️⃣
Third target 0.16003️⃣
Stop loss 0.19200🛑
1
1
18
·
--
Short position now at $BAS , enter at this price 0.02815
Targets
1️⃣ 0.02770
2️⃣ 0.02700
Short position now at $BAS , enter at this price 0.02815
Targets
1️⃣ 0.02770
2️⃣ 0.02700
Targets
1️⃣ 0.02770
2️⃣ 0.02700
1
2
2
71
·
--
Short trade for coin $JELLYJELLY
Place a sell order at price 0.065
Your targets will be 0.06100
And the second one further out at 0.05590
Stop loss if the price hits 0.06800
Or you can add leverage
{future}(JELLYJELLYUSDT)
Short trade for coin $JELLYJELLY
Place a sell order at price 0.065
Your targets will be 0.06100
And the second one further out at 0.05590
Stop loss if the price hits 0.06800
Or you can add leverage
Place a sell order at price 0.065
Your targets will be 0.06100
And the second one further out at 0.05590
Stop loss if the price hits 0.06800
Or you can add leverage
1
167
Log in to explore more content
Join global crypto users on Binance Square
⚡️ Get latest and useful information about crypto.
💬 Trusted by the world’s largest crypto exchange.
👍 Discover real insights from verified creators.
Email / Phone number
Trending Topics
NEARRisesNearly80%InAWeek
45,994 views
999 Discussing
#nearrisesnearly80%inaweek $NEAR just did +80% in 7 days and nobody is talking about WHY 🚀
$2.20 → $4.29 while the whole market was up only 6%.
The real drivers:
→ Intents Volume near $30B
→ Confidential Perps launch with Hyperliquid
→ TVL back to $190M + 52K active wallets
I watched it at $2.30 and did nothing. Lesson learned.
Are you holding or still watching from sidelines? 👀
$NEAR #NEARProtocol #CryptoNews
True News
·2 Likes
·821 views
MultiversXPlansHardForkRecovery
38,211 views
762 Discussing
CircleLaunchesInstitutionalBTCBackedBorrowing
35,867 views
817 Discussing