
salar khilji
6 Posts

salar khilji
Report
Block User
6 Following
26 Followers
17 Liked
Posts
·
--
Bullish
#MUBARAK $#🚨 Meme Coin Alert: Volume Is Speaking! 🔥
The meme-coin market is heating up, and one thing I’m watching closely is $MUBARAK 👀
📊 Why I’m watching it: • Strong 24H price momentum 📈
• Significant 24H trading volume 💰
• Volume is large compared with its market cap
• Meme-sector momentum is returning
• Could attract more traders if volume continues rising
⚠️ But remember: high volume doesn't guarantee another pump. Meme coins can move extremely fast in both directions.
🎯 My strategy: Don't FOMO. Watch for continued volume + price confirmation and manage risk carefully.
Are you watching $MUBARAK, or do you see another meme coin ready to move? 👇$
#MUBARAK $#🚨 Meme Coin Alert: Volume Is Speaking! 🔥
The meme-coin market is heating up, and one thing I’m watching closely is $MUBARAK 👀
📊 Why I’m watching it: • Strong 24H price momentum 📈
• Significant 24H trading volume 💰
• Volume is large compared with its market cap
• Meme-sector momentum is returning
• Could attract more traders if volume continues rising
⚠️ But remember: high volume doesn't guarantee another pump. Meme coins can move extremely fast in both directions.
🎯 My strategy: Don't FOMO. Watch for continued volume + price confirmation and manage risk carefully.
Are you watching $MUBARAK, or do you see another meme coin ready to move? 👇$
The meme-coin market is heating up, and one thing I’m watching closely is $MUBARAK 👀
📊 Why I’m watching it: • Strong 24H price momentum 📈
• Significant 24H trading volume 💰
• Volume is large compared with its market cap
• Meme-sector momentum is returning
• Could attract more traders if volume continues rising
⚠️ But remember: high volume doesn't guarantee another pump. Meme coins can move extremely fast in both directions.
🎯 My strategy: Don't FOMO. Watch for continued volume + price confirmation and manage risk carefully.
Are you watching $MUBARAK, or do you see another meme coin ready to move? 👇$

666
·
--
Bullish
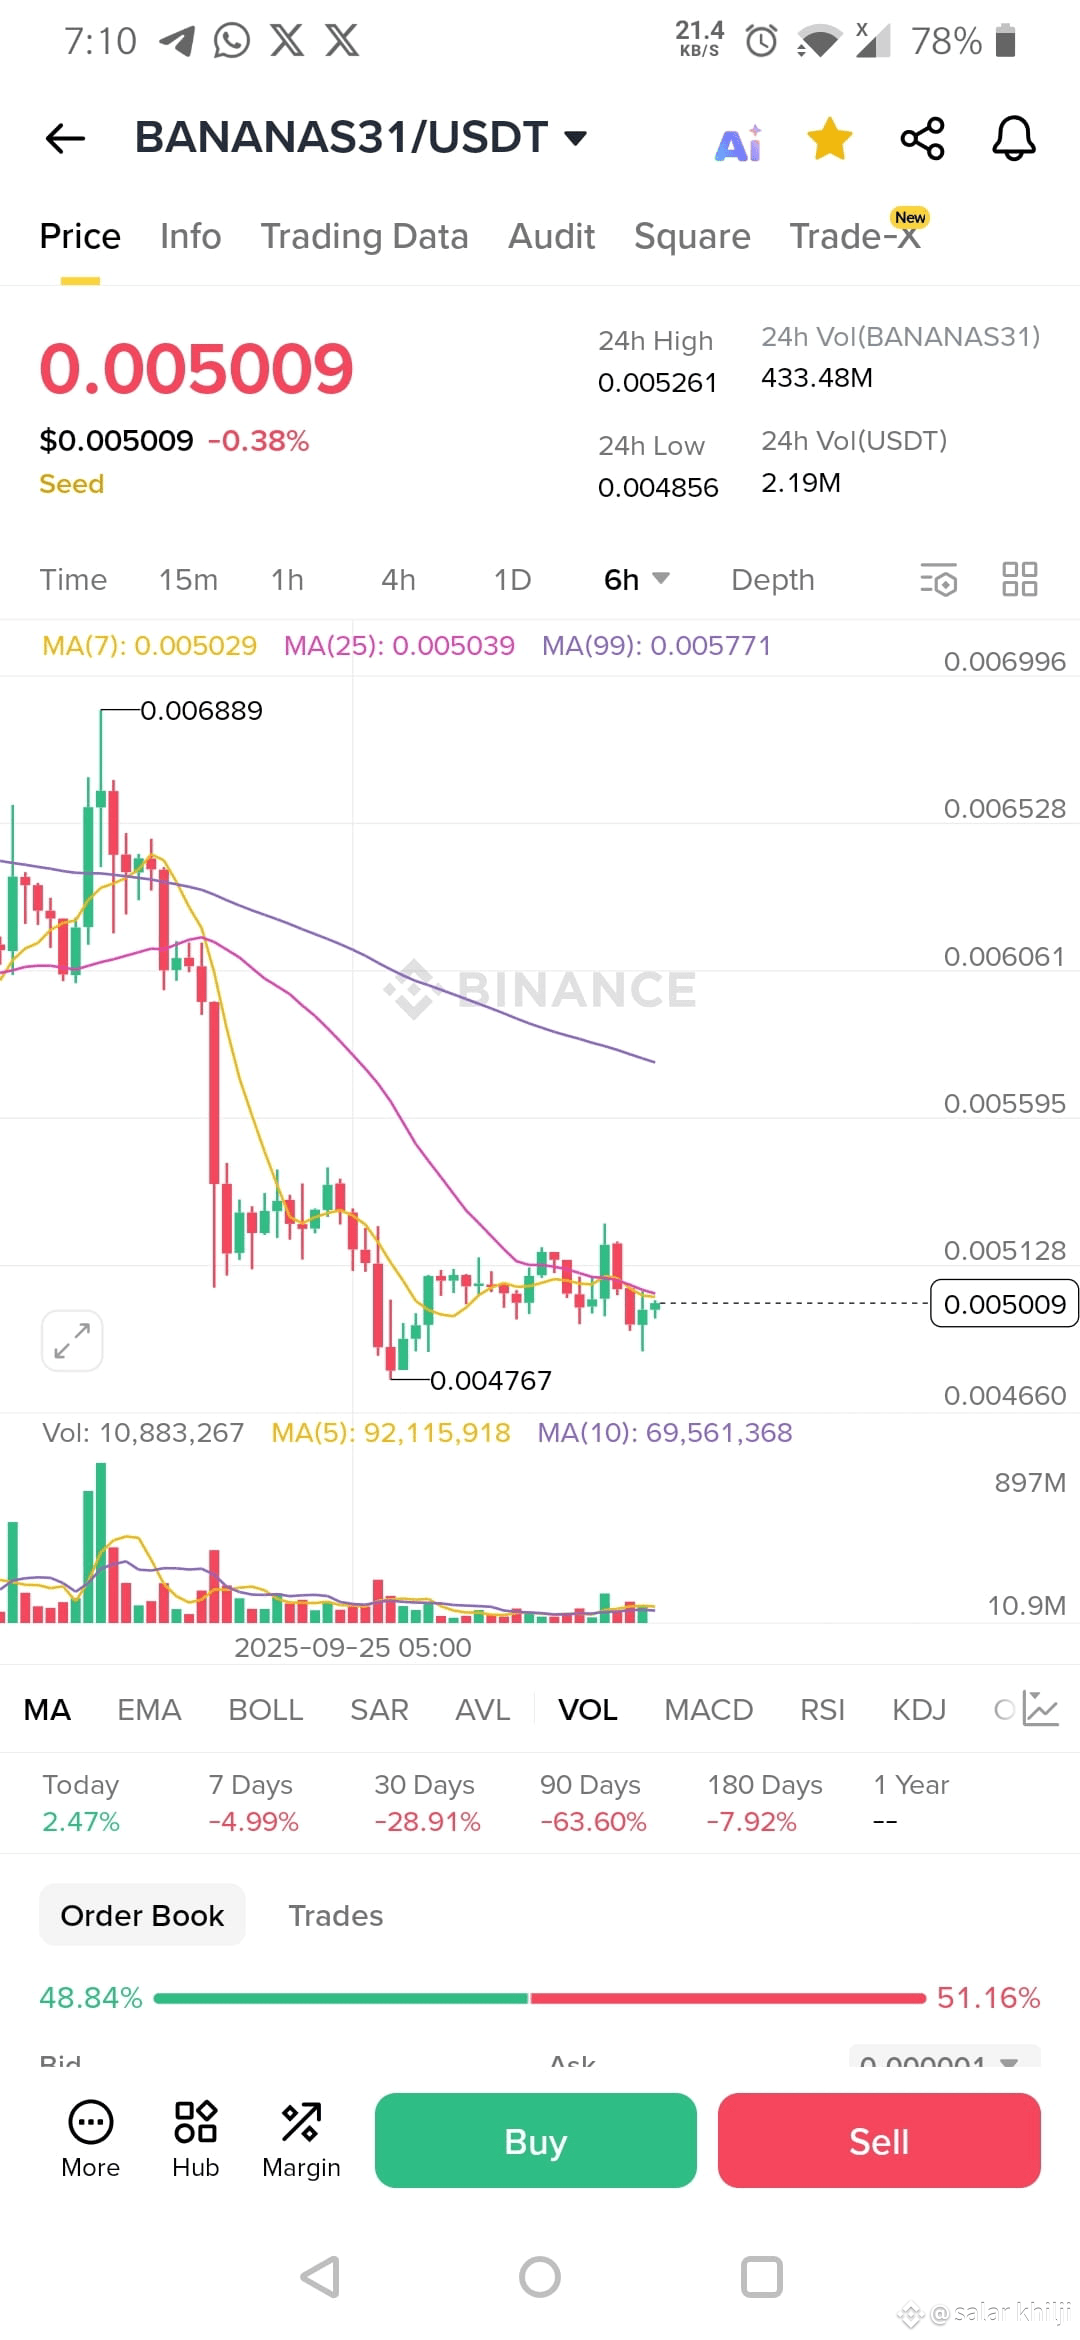
$BANANAS31 🍌 Banana31: The Meme Coin Everyone’s Watching!
Banana31 isn’t just another meme coin—it’s a community-driven experiment that blends humor, creativity, and crypto culture into one exciting package. 🚀 While some tokens only focus on price, Banana31 thrives on community vibes, viral memes, and unexpected energy.
Why should you keep an eye on it?
✅ Community Power – The Banana31 family is growing every day, sharing memes, challenges, and ideas that fuel the project’s buzz.
✅ Meme Magic – In crypto, memes move markets. Banana31 uses laughter as a weapon to attract attention and build momentum.
✅ Dream of $1 – Can Banana31 ever touch the golden $1 mark? That’s the ultimate question—and part of the fun journey!
✅ Early Vibes – Projects like this often start small but can surprise everyone when the community rallies together.
$BANANAS31 🍌 Banana31: The Meme Coin Everyone’s Watching!
Banana31 isn’t just another meme coin—it’s a community-driven experiment that blends humor, creativity, and crypto culture into one exciting package. 🚀 While some tokens only focus on price, Banana31 thrives on community vibes, viral memes, and unexpected energy.
Why should you keep an eye on it?
✅ Community Power – The Banana31 family is growing every day, sharing memes, challenges, and ideas that fuel the project’s buzz.
✅ Meme Magic – In crypto, memes move markets. Banana31 uses laughter as a weapon to attract attention and build momentum.
✅ Dream of $1 – Can Banana31 ever touch the golden $1 mark? That’s the ultimate question—and part of the fun journey!
✅ Early Vibes – Projects like this often start small but can surprise everyone when the community rallies together.
Banana31 isn’t just another meme coin—it’s a community-driven experiment that blends humor, creativity, and crypto culture into one exciting package. 🚀 While some tokens only focus on price, Banana31 thrives on community vibes, viral memes, and unexpected energy.
Why should you keep an eye on it?
✅ Community Power – The Banana31 family is growing every day, sharing memes, challenges, and ideas that fuel the project’s buzz.
✅ Meme Magic – In crypto, memes move markets. Banana31 uses laughter as a weapon to attract attention and build momentum.
✅ Dream of $1 – Can Banana31 ever touch the golden $1 mark? That’s the ultimate question—and part of the fun journey!
✅ Early Vibes – Projects like this often start small but can surprise everyone when the community rallies together.
62
·
--
As of February 23, 2025, Celestia (TIA) is trading at approximately $3.72.
Technical Analysis
Recent technical indicators present a mixed outlook for TIA:
Moving Averages: The 200-day moving average has been trending downward since January 9, 2025, with the current price below this average, suggesting potential resistance in upward movements.
Relative Strength Index (RSI): The RSI is below the neutral 30-70 range, indicating an oversold condition, which could precede a price rebound.
Fundamental Analysis
Celestia, launched on October 31, 2023, is a modular blockchain network designed to enhance scalability and interoperability. Its architecture allows for customizable blockchains, enabling developers to deploy decentralized applications with greater flexibility. During its genesis, 60 million TIA tokens (6% of the total supply) were airdropped to developers, researchers, and active participants in the ecosystem.
Price Predictions
Various forecasts provide insights into TIA's potential price trajectory:
Changelly: Predicts a 13.16% increase, with TIA reaching $3.44 by February 18, 2025.
CoinCodex: Offers a more optimistic short-term view, forecasting a price of $3.95 in five days and $9.98 in one month.
LongForecast: Projects a gradual rise, estimating TIA's price at $4.27 at the beginning of February 2025, with fluctuations throughout the month and an expected end-of-month price of $4.23.
In summary, while technical indicators suggest potential challenges, the fundamental strengths of Celestia's modular blockchain architecture and positive price forecasts indicate possible growth. As always, conduct thorough research and consider market volatility before making investment decisions.
$TIA
As of February 23, 2025, Celestia (TIA) is trading at approximately $3.72.
Technical Analysis
Recent technical indicators present a mixed outlook for TIA:
Moving Averages: The 200-day moving average has been trending downward since January 9, 2025, with the current price below this average, suggesting potential resistance in upward movements.
Relative Strength Index (RSI): The RSI is below the neutral 30-70 range, indicating an oversold condition, which could precede a price rebound.
Fundamental Analysis
Celestia, launched on October 31, 2023, is a modular blockchain network designed to enhance scalability and interoperability. Its architecture allows for customizable blockchains, enabling developers to deploy decentralized applications with greater flexibility. During its genesis, 60 million TIA tokens (6% of the total supply) were airdropped to developers, researchers, and active participants in the ecosystem.
Price Predictions
Various forecasts provide insights into TIA's potential price trajectory:
Changelly: Predicts a 13.16% increase, with TIA reaching $3.44 by February 18, 2025.
CoinCodex: Offers a more optimistic short-term view, forecasting a price of $3.95 in five days and $9.98 in one month.
LongForecast: Projects a gradual rise, estimating TIA's price at $4.27 at the beginning of February 2025, with fluctuations throughout the month and an expected end-of-month price of $4.23.
In summary, while technical indicators suggest potential challenges, the fundamental strengths of Celestia's modular blockchain architecture and positive price forecasts indicate possible growth. As always, conduct thorough research and consider market volatility before making investment decisions.
$TIA
Technical Analysis
Recent technical indicators present a mixed outlook for TIA:
Moving Averages: The 200-day moving average has been trending downward since January 9, 2025, with the current price below this average, suggesting potential resistance in upward movements.
Relative Strength Index (RSI): The RSI is below the neutral 30-70 range, indicating an oversold condition, which could precede a price rebound.
Fundamental Analysis
Celestia, launched on October 31, 2023, is a modular blockchain network designed to enhance scalability and interoperability. Its architecture allows for customizable blockchains, enabling developers to deploy decentralized applications with greater flexibility. During its genesis, 60 million TIA tokens (6% of the total supply) were airdropped to developers, researchers, and active participants in the ecosystem.
Price Predictions
Various forecasts provide insights into TIA's potential price trajectory:
Changelly: Predicts a 13.16% increase, with TIA reaching $3.44 by February 18, 2025.
CoinCodex: Offers a more optimistic short-term view, forecasting a price of $3.95 in five days and $9.98 in one month.
LongForecast: Projects a gradual rise, estimating TIA's price at $4.27 at the beginning of February 2025, with fluctuations throughout the month and an expected end-of-month price of $4.23.
In summary, while technical indicators suggest potential challenges, the fundamental strengths of Celestia's modular blockchain architecture and positive price forecasts indicate possible growth. As always, conduct thorough research and consider market volatility before making investment decisions.
$TIA
756
·
--
Sei (SEI) Analysis – February 23, 2025
Current Market Overview
Sei (SEI) is currently trading at $0.2722, showing a slight dip of -3.2% in the last 24 hours. The token has seen an intraday high of $0.2857 and a low of $0.2699.
---
Technical Analysis: Where Is SEI Heading?
Looking at the charts, SEI’s performance is somewhat neutral, leaning slightly bearish:
✅ Moving Averages: The price is below the 10-day and 20-day moving averages, signaling some downward pressure.
✅ RSI & Oscillators: The Relative Strength Index (RSI) is in the middle range, meaning SEI isn’t overbought or oversold—just hovering in neutral territory.
✅ MACD Indicator: The MACD (which helps spot trends) is flat, meaning there’s no strong bullish or bearish signal right now.
Fundamental Analysis: What’s Behind SEI?
Sei Network is a Layer 1 blockchain designed for trading—think of it as a blockchain built specifically for decentralized exchanges (DEXs). Unlike traditional blockchains, Sei focuses on speed and efficiency:
🔹 Fast Transactions: Sei’s Twin Turbo Consensus can finalize transactions in 300 milliseconds—faster than most competitors.
🔹 Cosmos SDK Integration: It’s part of the Cosmos ecosystem, allowing seamless communication with other blockchains.
🔹 Token Utility: SEI is used for transaction fees, staking, and governance, making it an integral part of the network.
🚀 Long-Term Outlook: While SEI has strong fundamentals, it has also faced price fluctuations. The future will depend on adoption, market trends, and broader crypto sentiment.
---
Final Thoughts: Should You Buy SEI?
If you’re considering investing, SEI has strong fundamentals but faces short-term technical uncertainty. A breakout past key resistance levels could lead to gains, while further dips could present a buying opportunity for long-term believers. As always, do your own research and manage risks wisely!
$SEI
Sei (SEI) Analysis – February 23, 2025
Current Market Overview
Sei (SEI) is currently trading at $0.2722, showing a slight dip of -3.2% in the last 24 hours. The token has seen an intraday high of $0.2857 and a low of $0.2699.
---
Technical Analysis: Where Is SEI Heading?
Looking at the charts, SEI’s performance is somewhat neutral, leaning slightly bearish:
✅ Moving Averages: The price is below the 10-day and 20-day moving averages, signaling some downward pressure.
✅ RSI & Oscillators: The Relative Strength Index (RSI) is in the middle range, meaning SEI isn’t overbought or oversold—just hovering in neutral territory.
✅ MACD Indicator: The MACD (which helps spot trends) is flat, meaning there’s no strong bullish or bearish signal right now.
Fundamental Analysis: What’s Behind SEI?
Sei Network is a Layer 1 blockchain designed for trading—think of it as a blockchain built specifically for decentralized exchanges (DEXs). Unlike traditional blockchains, Sei focuses on speed and efficiency:
🔹 Fast Transactions: Sei’s Twin Turbo Consensus can finalize transactions in 300 milliseconds—faster than most competitors.
🔹 Cosmos SDK Integration: It’s part of the Cosmos ecosystem, allowing seamless communication with other blockchains.
🔹 Token Utility: SEI is used for transaction fees, staking, and governance, making it an integral part of the network.
🚀 Long-Term Outlook: While SEI has strong fundamentals, it has also faced price fluctuations. The future will depend on adoption, market trends, and broader crypto sentiment.
---
Final Thoughts: Should You Buy SEI?
If you’re considering investing, SEI has strong fundamentals but faces short-term technical uncertainty. A breakout past key resistance levels could lead to gains, while further dips could present a buying opportunity for long-term believers. As always, do your own research and manage risks wisely!
$SEI
Current Market Overview
Sei (SEI) is currently trading at $0.2722, showing a slight dip of -3.2% in the last 24 hours. The token has seen an intraday high of $0.2857 and a low of $0.2699.
---
Technical Analysis: Where Is SEI Heading?
Looking at the charts, SEI’s performance is somewhat neutral, leaning slightly bearish:
✅ Moving Averages: The price is below the 10-day and 20-day moving averages, signaling some downward pressure.
✅ RSI & Oscillators: The Relative Strength Index (RSI) is in the middle range, meaning SEI isn’t overbought or oversold—just hovering in neutral territory.
✅ MACD Indicator: The MACD (which helps spot trends) is flat, meaning there’s no strong bullish or bearish signal right now.
Fundamental Analysis: What’s Behind SEI?
Sei Network is a Layer 1 blockchain designed for trading—think of it as a blockchain built specifically for decentralized exchanges (DEXs). Unlike traditional blockchains, Sei focuses on speed and efficiency:
🔹 Fast Transactions: Sei’s Twin Turbo Consensus can finalize transactions in 300 milliseconds—faster than most competitors.
🔹 Cosmos SDK Integration: It’s part of the Cosmos ecosystem, allowing seamless communication with other blockchains.
🔹 Token Utility: SEI is used for transaction fees, staking, and governance, making it an integral part of the network.
🚀 Long-Term Outlook: While SEI has strong fundamentals, it has also faced price fluctuations. The future will depend on adoption, market trends, and broader crypto sentiment.
---
Final Thoughts: Should You Buy SEI?
If you’re considering investing, SEI has strong fundamentals but faces short-term technical uncertainty. A breakout past key resistance levels could lead to gains, while further dips could present a buying opportunity for long-term believers. As always, do your own research and manage risks wisely!
$SEI
1
1
982
·
--
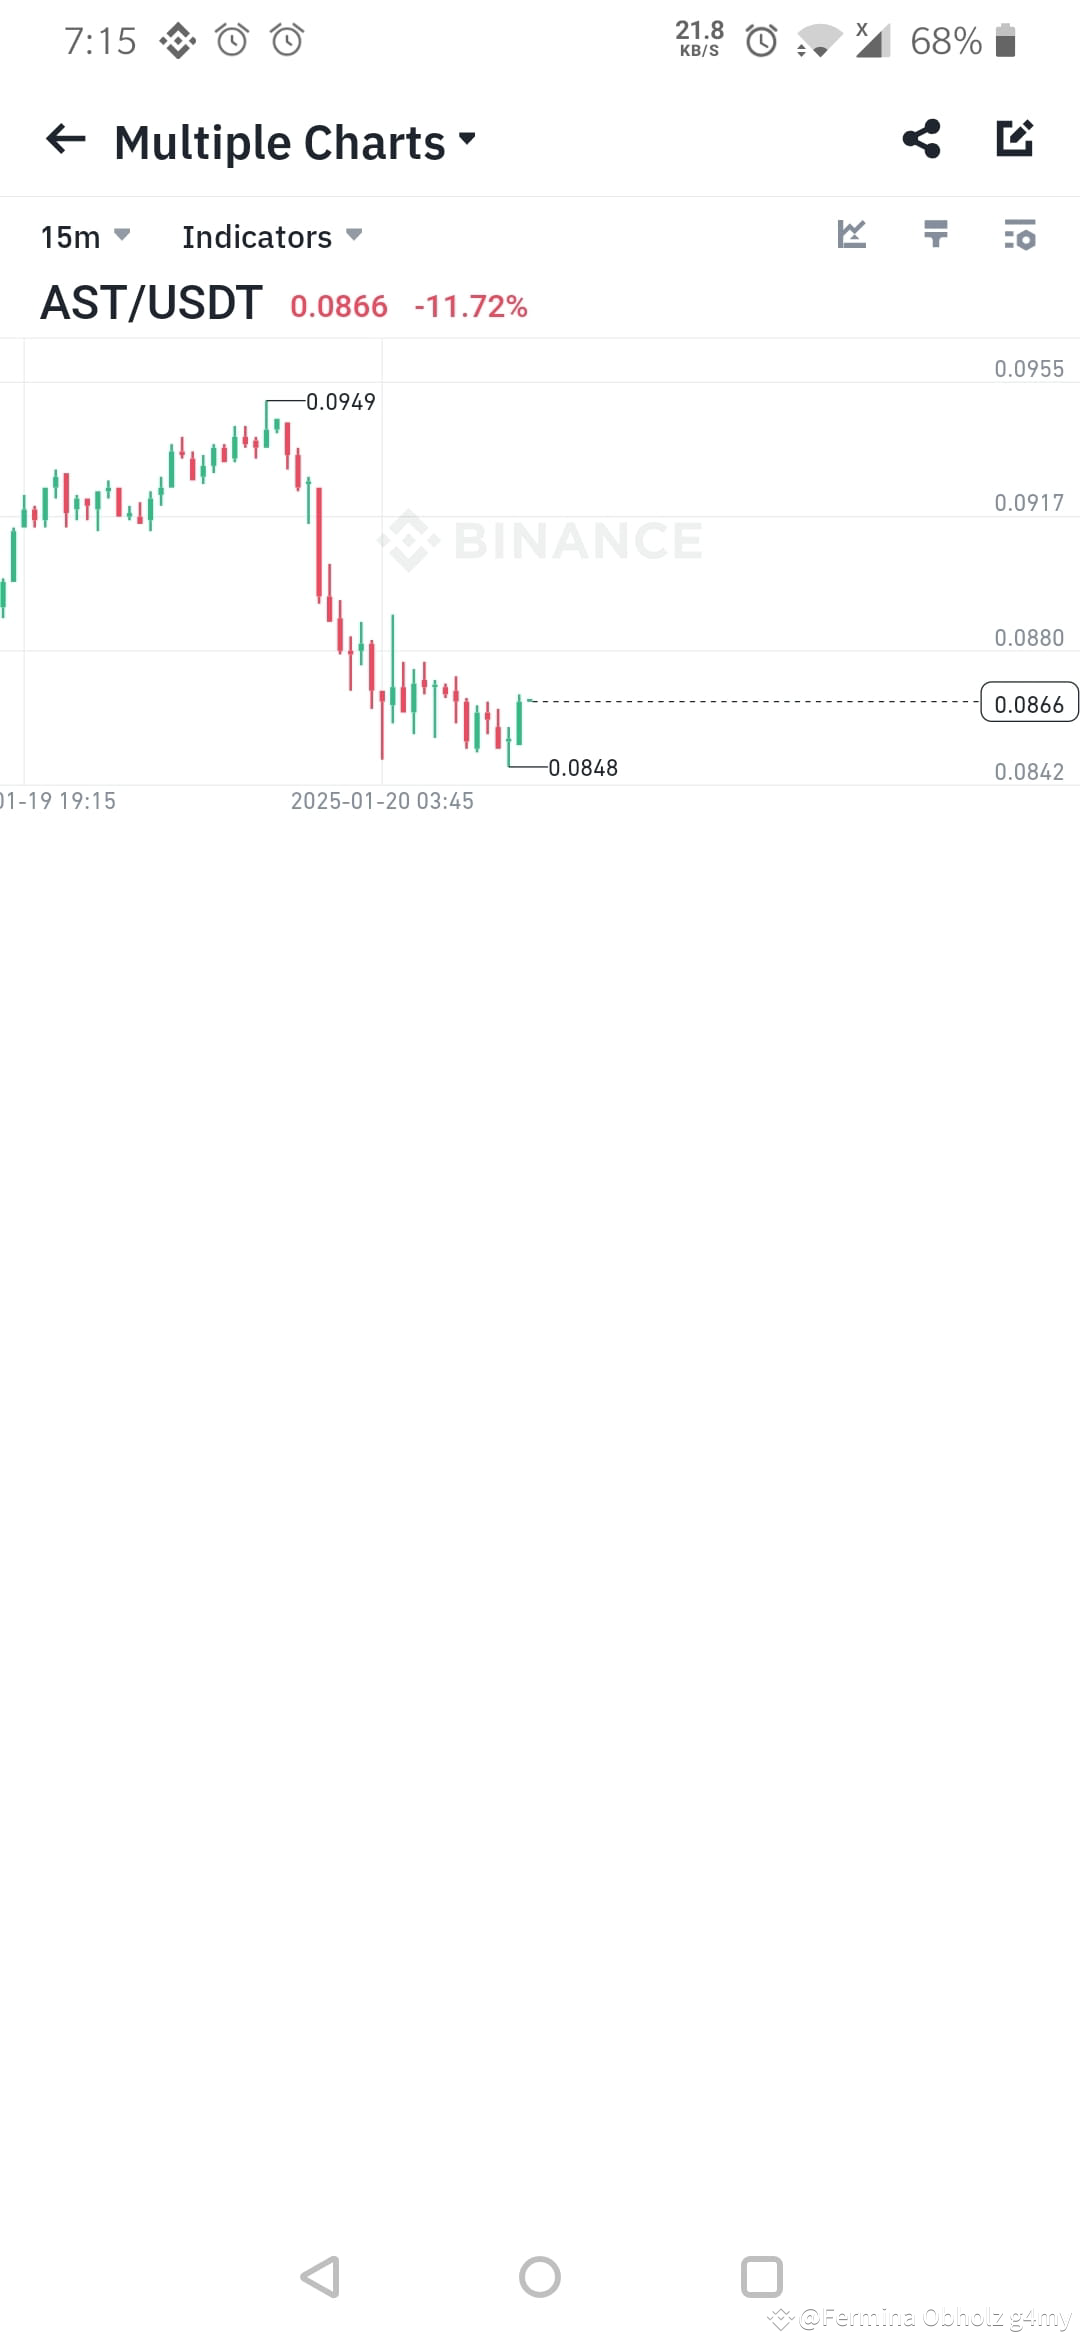
Current Market Overview
Price: $3,222.54 (as of January 20, 2025)
24-Hour Change: -3.86%
Intraday Range: $3,130.11 (low) - $3,441.53 (high)
Key Indicators
1. Trend Analysis:
Ethereum has been showing a consolidation phase after testing resistance around $3,500.
The recent pullback could indicate a potential retracement before another upward move.
2. Moving Averages:
50-Day MA: ETH is trading slightly below its 50-day moving average, which indicates short-term bearish momentum.
200-Day MA: Still above the 200-day MA, suggesting long-term bullish sentiment.
3. Relative Strength Index (RSI):
Current RSI: ~45 (neutral to slightly oversold territory). This indicates that ETH may soon see a recovery if buyers step in.
4. Support and Resistance Levels:
Support: $3,100 (key psychological and technical level).
Resistance: $3,500 (recent high). Breaking above this level could trigger a rally toward $3,800.
5. MACD (Moving Average Convergence Divergence):
MACD is trending downward, showing weakening bullish momentum. A crossover in the near future could signal a reversal.
Technical Outlook:
ETH is in a consolidation phase, with potential for a bounce if support at $3,100 holds. Traders should watch for volume spikes and RSI movements to gauge direction.
$ETH
{spot}(ETHUSDT)
Current Market Overview
Price: $3,222.54 (as of January 20, 2025)
24-Hour Change: -3.86%
Intraday Range: $3,130.11 (low) - $3,441.53 (high)
Key Indicators
1. Trend Analysis:
Ethereum has been showing a consolidation phase after testing resistance around $3,500.
The recent pullback could indicate a potential retracement before another upward move.
2. Moving Averages:
50-Day MA: ETH is trading slightly below its 50-day moving average, which indicates short-term bearish momentum.
200-Day MA: Still above the 200-day MA, suggesting long-term bullish sentiment.
3. Relative Strength Index (RSI):
Current RSI: ~45 (neutral to slightly oversold territory). This indicates that ETH may soon see a recovery if buyers step in.
4. Support and Resistance Levels:
Support: $3,100 (key psychological and technical level).
Resistance: $3,500 (recent high). Breaking above this level could trigger a rally toward $3,800.
5. MACD (Moving Average Convergence Divergence):
MACD is trending downward, showing weakening bullish momentum. A crossover in the near future could signal a reversal.
Technical Outlook:
ETH is in a consolidation phase, with potential for a bounce if support at $3,100 holds. Traders should watch for volume spikes and RSI movements to gauge direction.
$ETH
Price: $3,222.54 (as of January 20, 2025)
24-Hour Change: -3.86%
Intraday Range: $3,130.11 (low) - $3,441.53 (high)
Key Indicators
1. Trend Analysis:
Ethereum has been showing a consolidation phase after testing resistance around $3,500.
The recent pullback could indicate a potential retracement before another upward move.
2. Moving Averages:
50-Day MA: ETH is trading slightly below its 50-day moving average, which indicates short-term bearish momentum.
200-Day MA: Still above the 200-day MA, suggesting long-term bullish sentiment.
3. Relative Strength Index (RSI):
Current RSI: ~45 (neutral to slightly oversold territory). This indicates that ETH may soon see a recovery if buyers step in.
4. Support and Resistance Levels:
Support: $3,100 (key psychological and technical level).
Resistance: $3,500 (recent high). Breaking above this level could trigger a rally toward $3,800.
5. MACD (Moving Average Convergence Divergence):
MACD is trending downward, showing weakening bullish momentum. A crossover in the near future could signal a reversal.
Technical Outlook:
ETH is in a consolidation phase, with potential for a bounce if support at $3,100 holds. Traders should watch for volume spikes and RSI movements to gauge direction.
$ETH
8
590
·
--
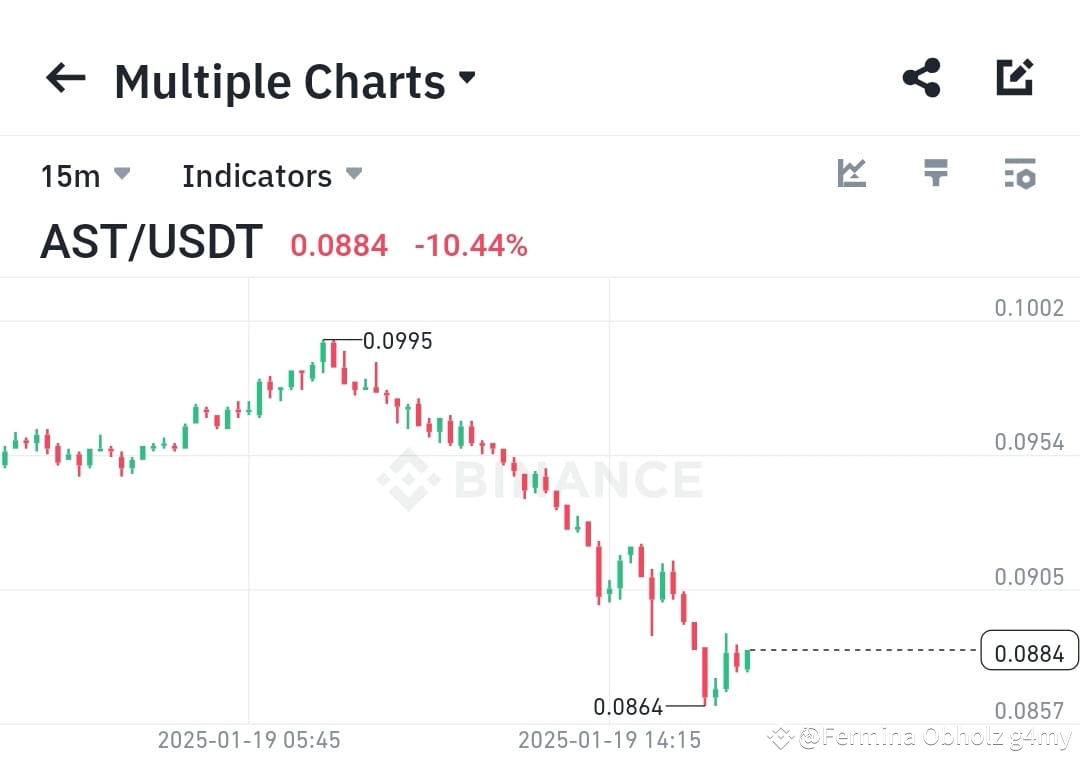
Binance Coin (BNB): A Modest Upward Potential
Binance Coin (BNB), the native token of the Binance exchange, has been displaying consistent growth patterns over recent weeks. Currently trading at $684.23, it has dipped slightly by 2.29%, presenting an opportunity for buyers to step in.
Technical Analysis:
50-Day SMA: $696.23
200-Day SMA: $598.26
14-Day RSI: 54.79 (neutral-bullish territory)
The price is approaching the 50-Day SMA, a critical resistance level. If breached, BNB could rally toward $736.96 by January 21, signaling a 3.93% increase in the short term.
Market Sentiment:
The Fear & Greed Index sits at 75, indicating "Greed," a sign that bullish momentum may persist.
$BNB
Binance Coin (BNB): A Modest Upward Potential
Binance Coin (BNB), the native token of the Binance exchange, has been displaying consistent growth patterns over recent weeks. Currently trading at $684.23, it has dipped slightly by 2.29%, presenting an opportunity for buyers to step in.
Technical Analysis:
50-Day SMA: $696.23
200-Day SMA: $598.26
14-Day RSI: 54.79 (neutral-bullish territory)
The price is approaching the 50-Day SMA, a critical resistance level. If breached, BNB could rally toward $736.96 by January 21, signaling a 3.93% increase in the short term.
Market Sentiment:
The Fear & Greed Index sits at 75, indicating "Greed," a sign that bullish momentum may persist.
$BNB
Binance Coin (BNB), the native token of the Binance exchange, has been displaying consistent growth patterns over recent weeks. Currently trading at $684.23, it has dipped slightly by 2.29%, presenting an opportunity for buyers to step in.
Technical Analysis:
50-Day SMA: $696.23
200-Day SMA: $598.26
14-Day RSI: 54.79 (neutral-bullish territory)
The price is approaching the 50-Day SMA, a critical resistance level. If breached, BNB could rally toward $736.96 by January 21, signaling a 3.93% increase in the short term.
Market Sentiment:
The Fear & Greed Index sits at 75, indicating "Greed," a sign that bullish momentum may persist.
$BNB
8
504
Log in to explore more content
Join global crypto users on Binance Square
⚡️ Get latest and useful information about crypto.
💬 Trusted by the world’s largest crypto exchange.
👍 Discover real insights from verified creators.
Email / Phone number
Trending Topics
BitcoinHits$85K
854 views
61 Discussing
Roughly $5B in visible $BTC short liquidations stacked between $83K–$85K. In an uptrend, that's fuel.
When shorts liquidate, they're forced to market-buy. That buying pressure drives price higher, triggering the next layer of liquidations above — a cascade of demand feeding itself.
We saw this exact dynamic on the run from $67K to $80K. The setup looks identical now. Expect the next leg to follow the same playbook: liquidation-driven momentum, systematic buying pressure, and continuation until the fuel runs out.
This is how bull markets accelerate. The chart is setting up clean, and the mechanics are in place. Watch for the break above $83K — that's where the cascade starts.
QuantFreedom
·3 Likes
·2.4k views
ECBStartsBlockchainEuroSettlement
376 views
83 Discussing
SouthAfricaProposesCryptoExchangeControls
7,936 views
336 Discussing