

Nadine Babel xUDq
1k Posts

Nadine Babel xUDq
Report
Block User
République démocratique du Congo 🇨🇩 🚨
Open Trade
Frequent Trader
1.7 Years
428 Following
1.1K+ Followers
2.0K+ Liked
Posts
Portfolio
All
Quotes
Videos
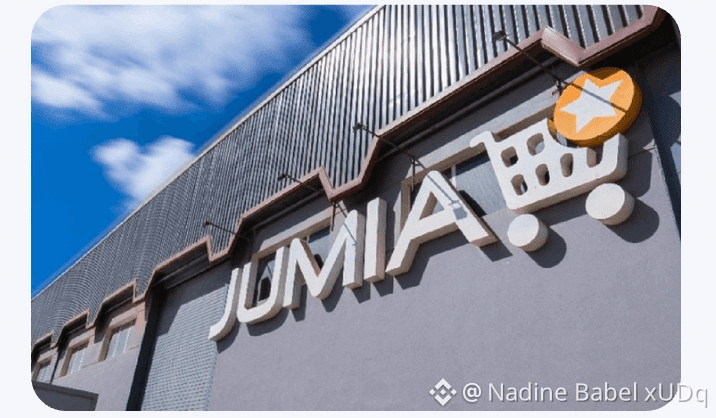
The International Finance Corporation (IFC), a subsidiary of the World Bank Group, announced on August 12, 2026 a $25 million equity investment in Jumia Technologies AG (NYSE: JMIA), the largest publicly listed e-commerce platform on the African continent. The investment forms part of a broader $50 million fundraising round, alongside existing shareholders such as AXIAN and newly selected investors.
According to the IFC, the investment is intended to help integrate approximately 60,000 active local sellers per year more effectively into the digital economy, support nearly 1,800 direct jobs, and create revenue opportunities for more than 100,000 independent sales agents across the markets where Jumia operates, including several countries in the UEMOA area (Côte d’Ivoire, Senegal). The stated goal is to strengthen the group’s logistics infrastructure and integrated marketplace network for its next phase of growth.
The International Finance Corporation (IFC), a subsidiary of the World Bank Group, announced on August 12, 2026 a $25 million equity investment in Jumia Technologies AG (NYSE: JMIA), the largest publicly listed e-commerce platform on the African continent. The investment forms part of a broader $50 million fundraising round, alongside existing shareholders such as AXIAN and newly selected investors.
According to the IFC, the investment is intended to help integrate approximately 60,000 active local sellers per year more effectively into the digital economy, support nearly 1,800 direct jobs, and create revenue opportunities for more than 100,000 independent sales agents across the markets where Jumia operates, including several countries in the UEMOA area (Côte d’Ivoire, Senegal). The stated goal is to strengthen the group’s logistics infrastructure and integrated marketplace network for its next phase of growth.
According to the IFC, the investment is intended to help integrate approximately 60,000 active local sellers per year more effectively into the digital economy, support nearly 1,800 direct jobs, and create revenue opportunities for more than 100,000 independent sales agents across the markets where Jumia operates, including several countries in the UEMOA area (Côte d’Ivoire, Senegal). The stated goal is to strengthen the group’s logistics infrastructure and integrated marketplace network for its next phase of growth.
205
157
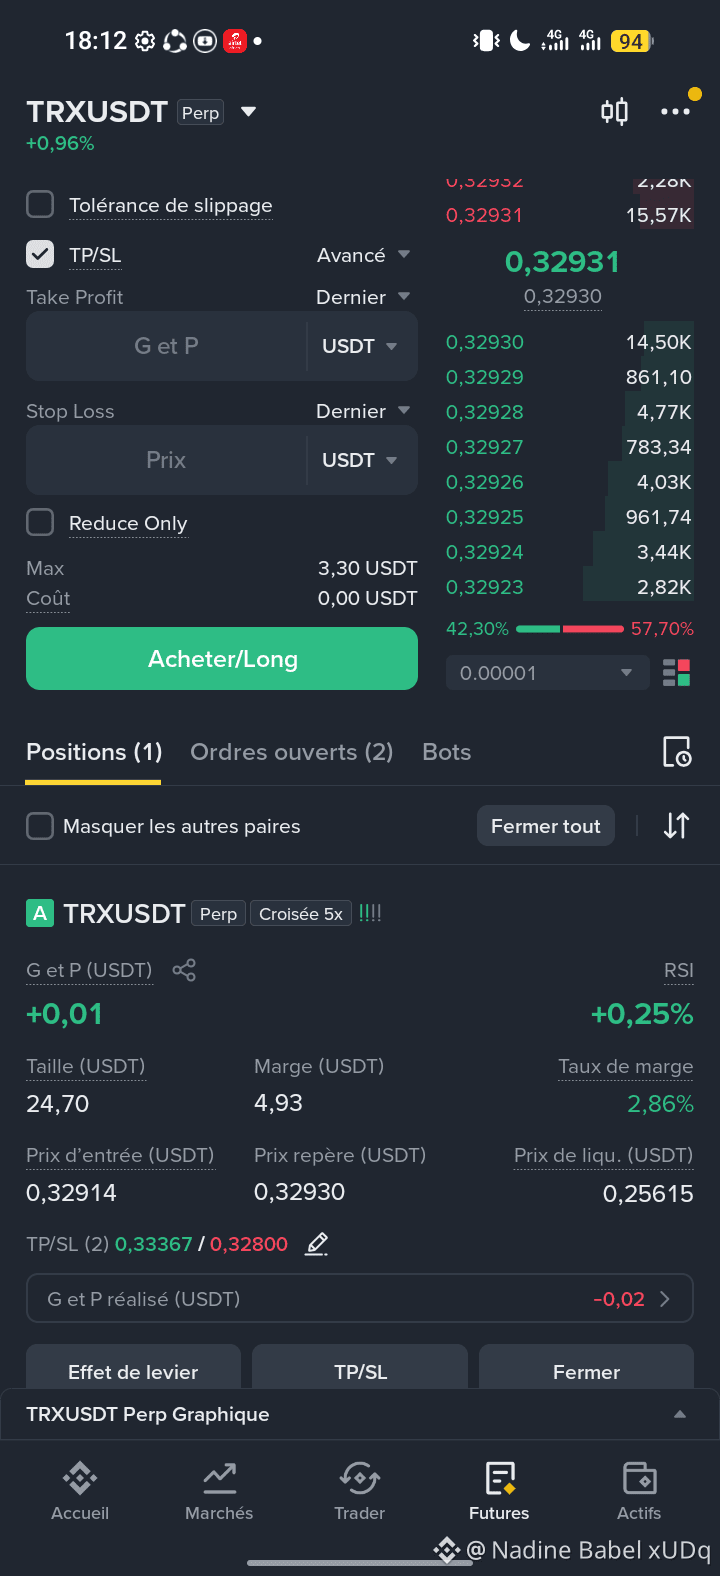
good evening everyone i start trading with tron TRX 🔥🔥🔥
good evening everyone i start trading with tron TRX 🔥🔥🔥
121
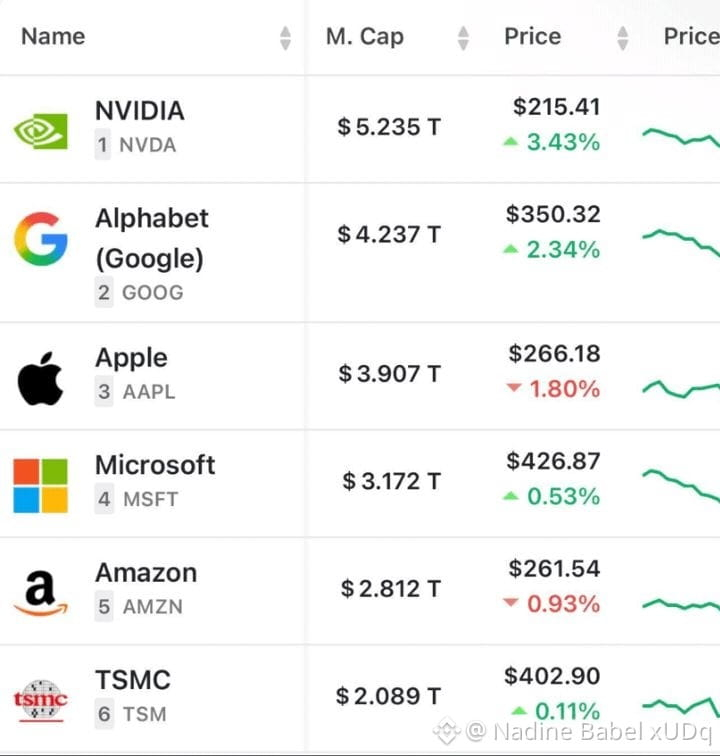
$BTC LATEST UPDATE: Nvidia's market cap has surpassed $5.2 trillion.
$BTC LATEST UPDATE: Nvidia's market cap has surpassed $5.2 trillion.
450
the overall market direction is still clear to me, just as I explained in my previous analyses.
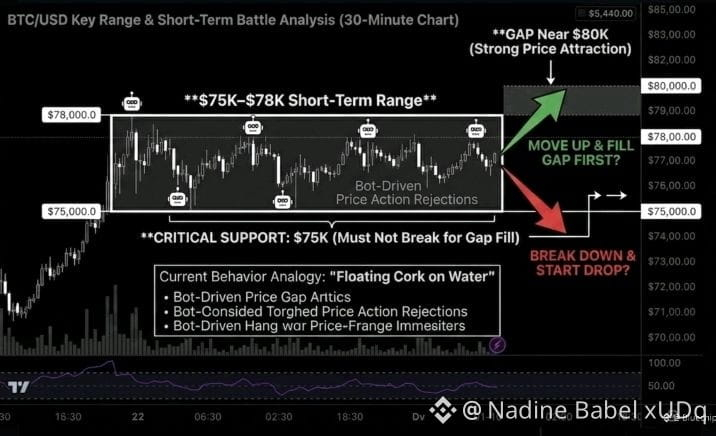
But in the short term, within the range of $75K–$78K, the situation is very murky.
There's obvious price action driven by bots that constantly rejects both breakouts and breakdowns.
You typically see this kind of behavior either as:
distribution near local tops or accumulation around key support levels. I previously explained this using the analogy of a "floating cork on water."
You can also see it clearly through the long wicks on lower timeframes, both above and below the price.
At the same time, there's still a large gap near $80K that continues to strongly attract the price before any major bearish movement.
On the flip side, $75K remains a critical support level that can't be broken if the market still wants to target that gap fill.
So, the battle is still ongoing.
The short-term situation remains unclear:
Is Bitcoin going to pump and fill the gap first…
or break down immediately and start the drop from here?
Personally, I expect a significant event regarding BTC's price in the next few hours.
I believe a big move is coming soon (most likely a bearish move, a drop
the overall market direction is still clear to me, just as I explained in my previous analyses.
But in the short term, within the range of $75K–$78K, the situation is very murky.
There's obvious price action driven by bots that constantly rejects both breakouts and breakdowns.
You typically see this kind of behavior either as:
distribution near local tops or accumulation around key support levels. I previously explained this using the analogy of a "floating cork on water."
You can also see it clearly through the long wicks on lower timeframes, both above and below the price.
At the same time, there's still a large gap near $80K that continues to strongly attract the price before any major bearish movement.
On the flip side, $75K remains a critical support level that can't be broken if the market still wants to target that gap fill.
So, the battle is still ongoing.
The short-term situation remains unclear:
Is Bitcoin going to pump and fill the gap first…
or break down immediately and start the drop from here?
Personally, I expect a significant event regarding BTC's price in the next few hours.
I believe a big move is coming soon (most likely a bearish move, a drop
But in the short term, within the range of $75K–$78K, the situation is very murky.
There's obvious price action driven by bots that constantly rejects both breakouts and breakdowns.
You typically see this kind of behavior either as:
distribution near local tops or accumulation around key support levels. I previously explained this using the analogy of a "floating cork on water."
You can also see it clearly through the long wicks on lower timeframes, both above and below the price.
At the same time, there's still a large gap near $80K that continues to strongly attract the price before any major bearish movement.
On the flip side, $75K remains a critical support level that can't be broken if the market still wants to target that gap fill.
So, the battle is still ongoing.
The short-term situation remains unclear:
Is Bitcoin going to pump and fill the gap first…
or break down immediately and start the drop from here?
Personally, I expect a significant event regarding BTC's price in the next few hours.
I believe a big move is coming soon (most likely a bearish move, a drop
116
Are you worried about the current drop in price of $BTC ? Check this out👇🏾
Based on my analyses, crypto cycles - bull runs or bear markets - are trends that unfold over time. Historically, a bear market lasts about a year, while a bull run can stretch up to three years. And don't forget: crypto is still a nascent ecosystem.
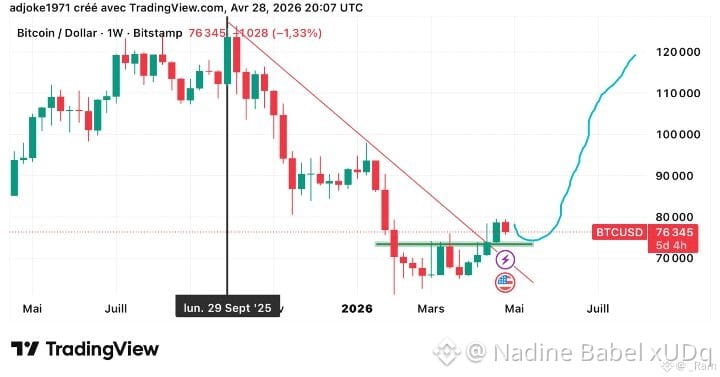
Today, the current market structure shows something interesting: a potential reversal phase. And just to remind you, the structure of a bear market or a bull run corresponds in charting to a monthly trend. The bear market trend seems to be forming a well-known technical analysis structure - a double bottom - which suggests a high probability of an upward rebound.
To confirm this pattern, there's a key movement: the pullback. And that's exactly what's forming right now. For the moment, nothing contradicts this scenario.
The critical point to watch: the weekly close.
If the price were to drop significantly towards very low zones (around 65,000), then the pattern could be called into question.
But if Bitcoin holds and closes around the high zones (around $73,000), then the chances of confirmation become very strong.
And generally, once the pullback is validated… the following week could trigger a strong bullish impulse. A real expansion movement, capable of driving the price to new highs.
So yes, the pattern is in the process of confirmation. And in my opinion, there's a strong likelihood that it will validate.
But beyond that: a Bitcoin around 60,000 is still much closer to its potential bottom than to its previous ATH.
So the real question isn't "can it drop further"… but rather: do you still want to hesitate while the market prepares to take off?$BTC
Are you worried about the current drop in price of $BTC ? Check this out👇🏾
Based on my analyses, crypto cycles - bull runs or bear markets - are trends that unfold over time. Historically, a bear market lasts about a year, while a bull run can stretch up to three years. And don't forget: crypto is still a nascent ecosystem.
Today, the current market structure shows something interesting: a potential reversal phase. And just to remind you, the structure of a bear market or a bull run corresponds in charting to a monthly trend. The bear market trend seems to be forming a well-known technical analysis structure - a double bottom - which suggests a high probability of an upward rebound.
To confirm this pattern, there's a key movement: the pullback. And that's exactly what's forming right now. For the moment, nothing contradicts this scenario.
The critical point to watch: the weekly close.
If the price were to drop significantly towards very low zones (around 65,000), then the pattern could be called into question.
But if Bitcoin holds and closes around the high zones (around $73,000), then the chances of confirmation become very strong.
And generally, once the pullback is validated… the following week could trigger a strong bullish impulse. A real expansion movement, capable of driving the price to new highs.
So yes, the pattern is in the process of confirmation. And in my opinion, there's a strong likelihood that it will validate.
But beyond that: a Bitcoin around 60,000 is still much closer to its potential bottom than to its previous ATH.
So the real question isn't "can it drop further"… but rather: do you still want to hesitate while the market prepares to take off?$BTC
Based on my analyses, crypto cycles - bull runs or bear markets - are trends that unfold over time. Historically, a bear market lasts about a year, while a bull run can stretch up to three years. And don't forget: crypto is still a nascent ecosystem.
Today, the current market structure shows something interesting: a potential reversal phase. And just to remind you, the structure of a bear market or a bull run corresponds in charting to a monthly trend. The bear market trend seems to be forming a well-known technical analysis structure - a double bottom - which suggests a high probability of an upward rebound.
To confirm this pattern, there's a key movement: the pullback. And that's exactly what's forming right now. For the moment, nothing contradicts this scenario.
The critical point to watch: the weekly close.
If the price were to drop significantly towards very low zones (around 65,000), then the pattern could be called into question.
But if Bitcoin holds and closes around the high zones (around $73,000), then the chances of confirmation become very strong.
And generally, once the pullback is validated… the following week could trigger a strong bullish impulse. A real expansion movement, capable of driving the price to new highs.
So yes, the pattern is in the process of confirmation. And in my opinion, there's a strong likelihood that it will validate.
But beyond that: a Bitcoin around 60,000 is still much closer to its potential bottom than to its previous ATH.
So the real question isn't "can it drop further"… but rather: do you still want to hesitate while the market prepares to take off?$BTC
135
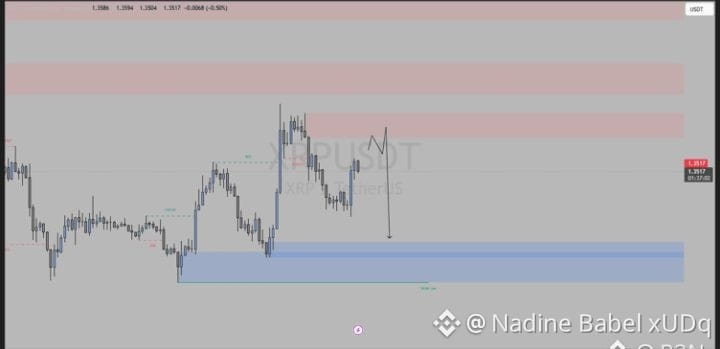
I am currently following $XRP around 1.35, and the chart shows me a fairly simple setup. We had a CHoCH and a few BOS signals, which tells me that the structure has changed. The red zones above are supply, the blue zone below is demand, and right now, the price is stuck between the two.
What I'm watching is the reaction to this marked low on the chart. If buyers defend it, I expect the price to return to the upper supply zone before falling — essentially a liquidity grab before going down. This projection makes sense given how XRP has respected these zones.
However, if this low breaks cleanly, the demand pocket becomes the real test. A failure there would confirm that sellers are in control and open the door to a deeper decline. For me, the trade is simple: watch how the price behaves at the low and at the demand zone. If it holds and bounces, we have a short-term rally; if it fails, the bearish continuation sets in.$XRP
I am currently following $XRP around 1.35, and the chart shows me a fairly simple setup. We had a CHoCH and a few BOS signals, which tells me that the structure has changed. The red zones above are supply, the blue zone below is demand, and right now, the price is stuck between the two.
What I'm watching is the reaction to this marked low on the chart. If buyers defend it, I expect the price to return to the upper supply zone before falling — essentially a liquidity grab before going down. This projection makes sense given how XRP has respected these zones.
However, if this low breaks cleanly, the demand pocket becomes the real test. A failure there would confirm that sellers are in control and open the door to a deeper decline. For me, the trade is simple: watch how the price behaves at the low and at the demand zone. If it holds and bounces, we have a short-term rally; if it fails, the bearish continuation sets in.$XRP
What I'm watching is the reaction to this marked low on the chart. If buyers defend it, I expect the price to return to the upper supply zone before falling — essentially a liquidity grab before going down. This projection makes sense given how XRP has respected these zones.
However, if this low breaks cleanly, the demand pocket becomes the real test. A failure there would confirm that sellers are in control and open the door to a deeper decline. For me, the trade is simple: watch how the price behaves at the low and at the demand zone. If it holds and bounces, we have a short-term rally; if it fails, the bearish continuation sets in.$XRP
1
1.3k
Bitcoin Alert: Imminent Drop”🚨🚨
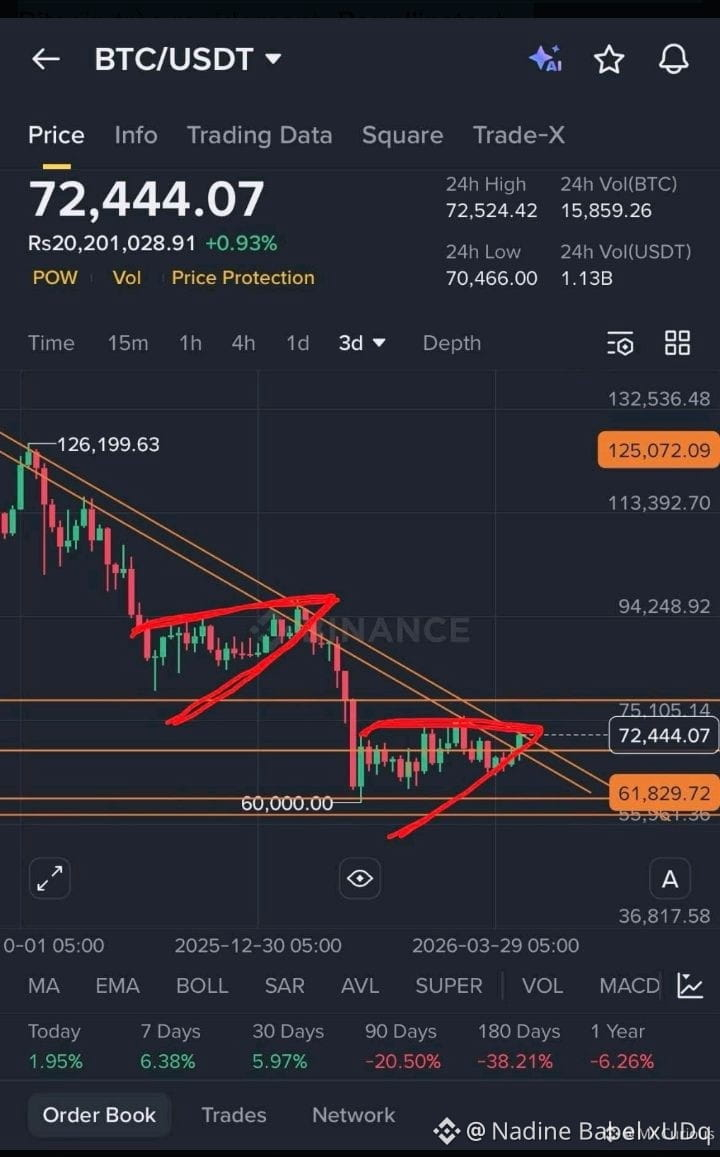
According to technical analysis, a drop in Bitcoin is expected very soon. It may slightly increase to primarily liquidate short traders, but in my opinion, you will see the drop in Bitcoin very quickly. For now…
If anyone wants advice, let me know.
Trade here smartly 👇🏻$BTC
Bitcoin Alert: Imminent Drop”🚨🚨
According to technical analysis, a drop in Bitcoin is expected very soon. It may slightly increase to primarily liquidate short traders, but in my opinion, you will see the drop in Bitcoin very quickly. For now…
If anyone wants advice, let me know.
Trade here smartly 👇🏻$BTC
According to technical analysis, a drop in Bitcoin is expected very soon. It may slightly increase to primarily liquidate short traders, but in my opinion, you will see the drop in Bitcoin very quickly. For now…
If anyone wants advice, let me know.
Trade here smartly 👇🏻$BTC
1
979
the speculative premium is back
The Delta growth rate has decisively increased again. It rose from about -0.019 in early February to 0.138 in the last full print, including a rise from 0.077 to 0.138 over the last 30 days. This matters because this metric tracks the gap between the growth of market capitalization and the growth of realized capitalization. ETH is no longer trading in an undervaluation regime. The speculative expansion is rebuilding.
The Delta between whales and retail is oriented in the same direction. The metric is near 0.315 in the last full reading, up from about 0.177 30 days ago and 0.122 90 days ago. This shows that whales remain net long compared to retail.
The multi-timeframe momentum adds an important layer of confirmation. It reached a low near -0.403 in early February, remained negative for most of the recent structure, and only returned above zero in early April. It is now near 0.040. This does not mean that the momentum is fully extended. But it shows that broad multi-horizon pressure has eased, and that the weekly, monthly, quarterly, and annual price structures are beginning to align again.
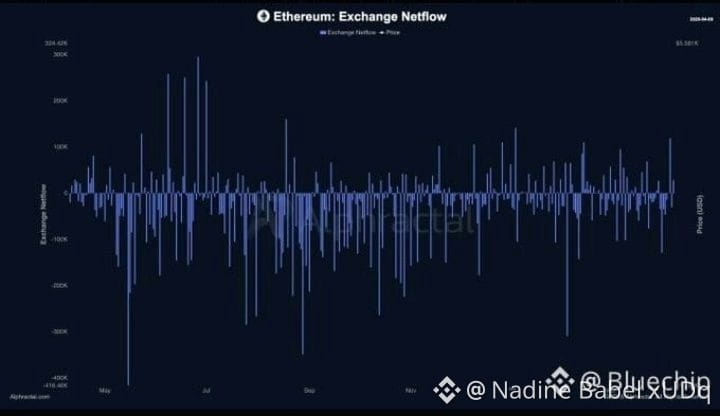
The net exchange flow reinforces the setup. Over the last 30 days, the net flow is still negative by about 389K ETH. Over the last 90 days, it is negative by about 1.0M ETH, with negative days outnumbering positive days in both windows. This means that the supply on the exchange side is still leaving the market rather than accumulating on exchanges.
The key point is simple: speculative pressure is increasing, whales are leaning long, momentum is rising, and exchange supply is still tightening.
the speculative premium is back
The Delta growth rate has decisively increased again. It rose from about -0.019 in early February to 0.138 in the last full print, including a rise from 0.077 to 0.138 over the last 30 days. This matters because this metric tracks the gap between the growth of market capitalization and the growth of realized capitalization. ETH is no longer trading in an undervaluation regime. The speculative expansion is rebuilding.
The Delta between whales and retail is oriented in the same direction. The metric is near 0.315 in the last full reading, up from about 0.177 30 days ago and 0.122 90 days ago. This shows that whales remain net long compared to retail.
The multi-timeframe momentum adds an important layer of confirmation. It reached a low near -0.403 in early February, remained negative for most of the recent structure, and only returned above zero in early April. It is now near 0.040. This does not mean that the momentum is fully extended. But it shows that broad multi-horizon pressure has eased, and that the weekly, monthly, quarterly, and annual price structures are beginning to align again.
The net exchange flow reinforces the setup. Over the last 30 days, the net flow is still negative by about 389K ETH. Over the last 90 days, it is negative by about 1.0M ETH, with negative days outnumbering positive days in both windows. This means that the supply on the exchange side is still leaving the market rather than accumulating on exchanges.
The key point is simple: speculative pressure is increasing, whales are leaning long, momentum is rising, and exchange supply is still tightening.
The Delta growth rate has decisively increased again. It rose from about -0.019 in early February to 0.138 in the last full print, including a rise from 0.077 to 0.138 over the last 30 days. This matters because this metric tracks the gap between the growth of market capitalization and the growth of realized capitalization. ETH is no longer trading in an undervaluation regime. The speculative expansion is rebuilding.
The Delta between whales and retail is oriented in the same direction. The metric is near 0.315 in the last full reading, up from about 0.177 30 days ago and 0.122 90 days ago. This shows that whales remain net long compared to retail.
The multi-timeframe momentum adds an important layer of confirmation. It reached a low near -0.403 in early February, remained negative for most of the recent structure, and only returned above zero in early April. It is now near 0.040. This does not mean that the momentum is fully extended. But it shows that broad multi-horizon pressure has eased, and that the weekly, monthly, quarterly, and annual price structures are beginning to align again.
The net exchange flow reinforces the setup. Over the last 30 days, the net flow is still negative by about 389K ETH. Over the last 90 days, it is negative by about 1.0M ETH, with negative days outnumbering positive days in both windows. This means that the supply on the exchange side is still leaving the market rather than accumulating on exchanges.
The key point is simple: speculative pressure is increasing, whales are leaning long, momentum is rising, and exchange supply is still tightening.
158
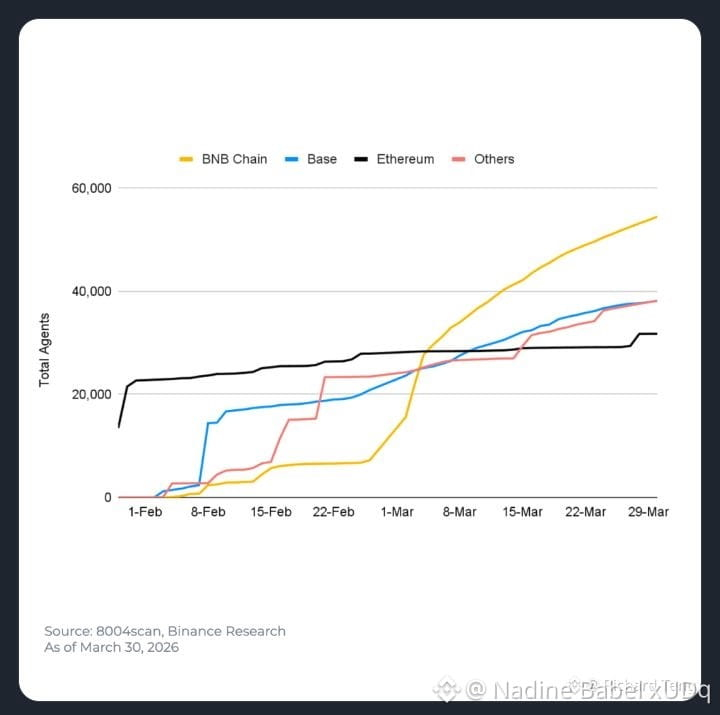
$BTC From 337 to over 162,000 registered AI agents in just a few months.
The ERC-8004 identity standard on the chain is rapidly evolving across 22 networks, with BNB Chain leading with 33.5% of all registrations.
$BTC From 337 to over 162,000 registered AI agents in just a few months.
The ERC-8004 identity standard on the chain is rapidly evolving across 22 networks, with BNB Chain leading with 33.5% of all registrations.
The ERC-8004 identity standard on the chain is rapidly evolving across 22 networks, with BNB Chain leading with 33.5% of all registrations.
92
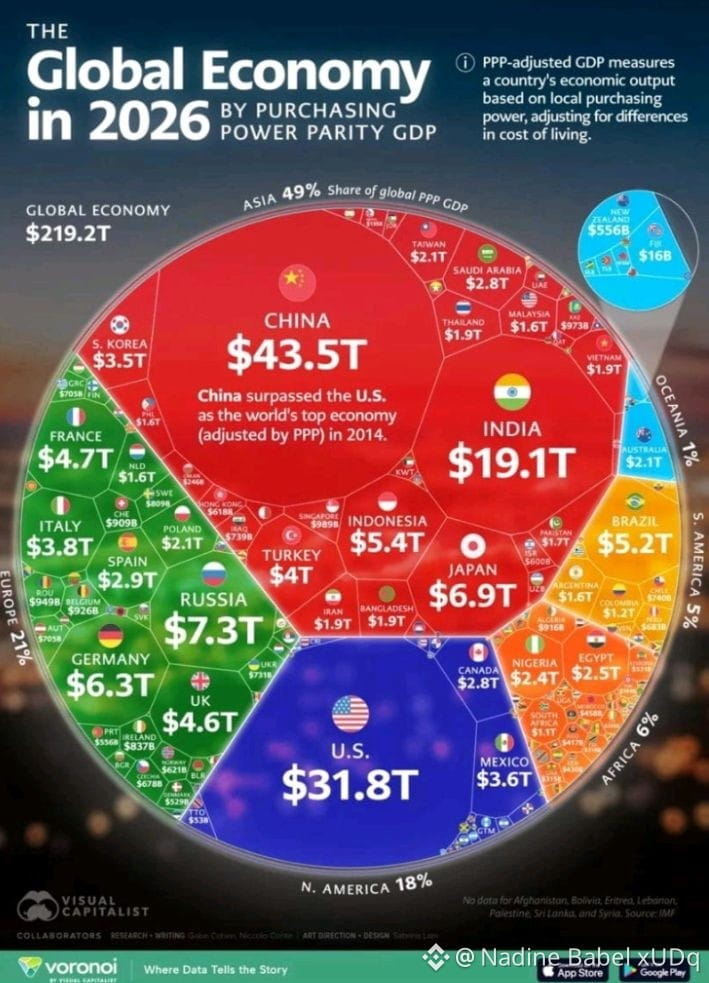
This graph shows the size of global economies in 2026, not with the classic GDP, but with GDP in purchasing power parity.
👉 First, the terms to understand:
✅ GDP = Gross Domestic Product. It is the total value of what a country produces in goods and services over a year.
✅ PPP = Purchasing Power Parity. This allows for comparison of economies while taking into account local cost of living. One dollar does not buy the same thing everywhere.
✅ Therefore, GDP in PPP seeks to measure the real economic weight of a country, not just its value converted at the exchange rate.
👉 China is the world's largest economy in PPP with 43.5 trillion dollars
👉 The United States remains huge with 31.8 trillion, but is no longer first with this method of calculation
👉 Asia represents 49% of the global GDP in PPP, which means it accounts for almost half of the global economy
👉 India, with 19.1 trillion, confirms it is becoming a major growth engine
What I see is a gradual shift in the global center of gravity.
Europe is a mature bloc, meaning it is a developed area, with less rapid growth, a weaker demographic, and markets already well established.
We are talking about a multipolar world, a world where economic power is no longer concentrated solely in the West. There are now several major poles: United States, China, India, Europe.
This map therefore does not only say who is the richest.
It mainly shows where growth, consumption, and ultimately, investment opportunities are shifting.
This graph shows the size of global economies in 2026, not with the classic GDP, but with GDP in purchasing power parity.
👉 First, the terms to understand:
✅ GDP = Gross Domestic Product. It is the total value of what a country produces in goods and services over a year.
✅ PPP = Purchasing Power Parity. This allows for comparison of economies while taking into account local cost of living. One dollar does not buy the same thing everywhere.
✅ Therefore, GDP in PPP seeks to measure the real economic weight of a country, not just its value converted at the exchange rate.
👉 China is the world's largest economy in PPP with 43.5 trillion dollars
👉 The United States remains huge with 31.8 trillion, but is no longer first with this method of calculation
👉 Asia represents 49% of the global GDP in PPP, which means it accounts for almost half of the global economy
👉 India, with 19.1 trillion, confirms it is becoming a major growth engine
What I see is a gradual shift in the global center of gravity.
Europe is a mature bloc, meaning it is a developed area, with less rapid growth, a weaker demographic, and markets already well established.
We are talking about a multipolar world, a world where economic power is no longer concentrated solely in the West. There are now several major poles: United States, China, India, Europe.
This map therefore does not only say who is the richest.
It mainly shows where growth, consumption, and ultimately, investment opportunities are shifting.
👉 First, the terms to understand:
✅ GDP = Gross Domestic Product. It is the total value of what a country produces in goods and services over a year.
✅ PPP = Purchasing Power Parity. This allows for comparison of economies while taking into account local cost of living. One dollar does not buy the same thing everywhere.
✅ Therefore, GDP in PPP seeks to measure the real economic weight of a country, not just its value converted at the exchange rate.
👉 China is the world's largest economy in PPP with 43.5 trillion dollars
👉 The United States remains huge with 31.8 trillion, but is no longer first with this method of calculation
👉 Asia represents 49% of the global GDP in PPP, which means it accounts for almost half of the global economy
👉 India, with 19.1 trillion, confirms it is becoming a major growth engine
What I see is a gradual shift in the global center of gravity.
Europe is a mature bloc, meaning it is a developed area, with less rapid growth, a weaker demographic, and markets already well established.
We are talking about a multipolar world, a world where economic power is no longer concentrated solely in the West. There are now several major poles: United States, China, India, Europe.
This map therefore does not only say who is the richest.
It mainly shows where growth, consumption, and ultimately, investment opportunities are shifting.
12
🚨LATEST NEWS:👇👇👇👇👇
The former White House Chief of Staff "Rahm Emanuel" revealed that Israeli Prime Minister 🇮🇱 "Netanyahu" had asked every American president 🇺🇸, including Bill Clinton, Barack Obama, George Bush, and Joe Biden, to take significant military action against Iran 🇮🇷.
According to "Rahm Emanuel", each American president 🇺🇸 assessed the potential risks of war against Iran 🇮🇷 at the request of the Israeli Prime Minister 🇮🇱 and decided that this step was not in the American national interest 🇺🇸. All presidents rejected the request after conducting a detailed review of the situation; therefore, holding Israel 🇮🇱 accountable contradicts the constitutional responsibility of the American president 🇺🇸.
He stated that the American system 🇺🇸 is such that an elected president takes an oath with his hand on the "Bible" and becomes the Commander-in-Chief, and the final decision regarding the lives of soldiers rests with his authority. "Rahm Emanuel" also shared a personal aspect by saying that the father of two children—now seven-month-old twins—will never see their father and a chair in their home will always remain empty.
"Rahm Emanuel" further clarified that this decision belongs to the President and blaming someone else is pointless.
🚨LATEST NEWS:👇👇👇👇👇
The former White House Chief of Staff "Rahm Emanuel" revealed that Israeli Prime Minister 🇮🇱 "Netanyahu" had asked every American president 🇺🇸, including Bill Clinton, Barack Obama, George Bush, and Joe Biden, to take significant military action against Iran 🇮🇷.
According to "Rahm Emanuel", each American president 🇺🇸 assessed the potential risks of war against Iran 🇮🇷 at the request of the Israeli Prime Minister 🇮🇱 and decided that this step was not in the American national interest 🇺🇸. All presidents rejected the request after conducting a detailed review of the situation; therefore, holding Israel 🇮🇱 accountable contradicts the constitutional responsibility of the American president 🇺🇸.
He stated that the American system 🇺🇸 is such that an elected president takes an oath with his hand on the "Bible" and becomes the Commander-in-Chief, and the final decision regarding the lives of soldiers rests with his authority. "Rahm Emanuel" also shared a personal aspect by saying that the father of two children—now seven-month-old twins—will never see their father and a chair in their home will always remain empty.
"Rahm Emanuel" further clarified that this decision belongs to the President and blaming someone else is pointless.
The former White House Chief of Staff "Rahm Emanuel" revealed that Israeli Prime Minister 🇮🇱 "Netanyahu" had asked every American president 🇺🇸, including Bill Clinton, Barack Obama, George Bush, and Joe Biden, to take significant military action against Iran 🇮🇷.
According to "Rahm Emanuel", each American president 🇺🇸 assessed the potential risks of war against Iran 🇮🇷 at the request of the Israeli Prime Minister 🇮🇱 and decided that this step was not in the American national interest 🇺🇸. All presidents rejected the request after conducting a detailed review of the situation; therefore, holding Israel 🇮🇱 accountable contradicts the constitutional responsibility of the American president 🇺🇸.
He stated that the American system 🇺🇸 is such that an elected president takes an oath with his hand on the "Bible" and becomes the Commander-in-Chief, and the final decision regarding the lives of soldiers rests with his authority. "Rahm Emanuel" also shared a personal aspect by saying that the father of two children—now seven-month-old twins—will never see their father and a chair in their home will always remain empty.
"Rahm Emanuel" further clarified that this decision belongs to the President and blaming someone else is pointless.

1k
Guys… wake up before it's too late 😮💨💀
Sometimes, golden opportunities present themselves right in front of you…
but people keep ignoring them and regret it later.
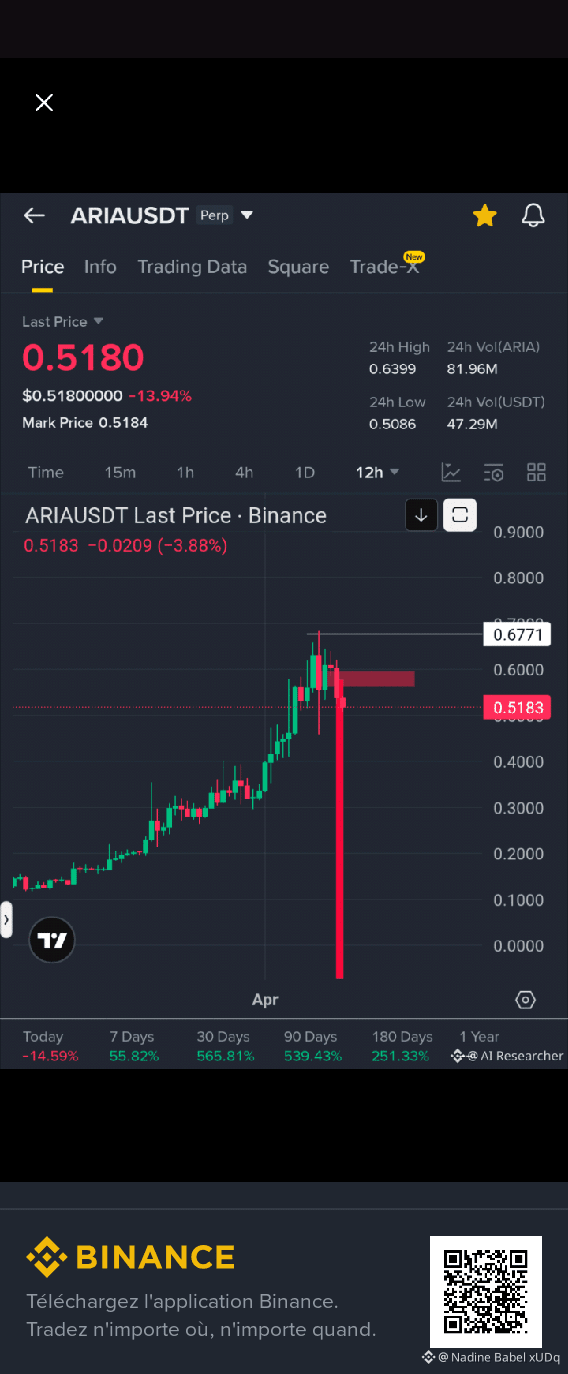
Look at $ARIA 👀
I checked the on-chain data… and it's very clear:
The big whales are slowly starting to realize profits.
And if you look at the chart… it already looks weak.
Something big is about to happen.
A liquidity hunt is coming… and buyers will become the liquidity.
You know I don't trade on emotions… I follow the data.
That's why I have already opened a short position here.
It can easily drop below $0.3 👀
Now, everything is in front of you.
If you miss this again… then nothing can save you.
I did my part, I warned you.
and $SIREN and $ARIA both stupid together.
Now, it's your turn…
Act smartly or regret it later 😮💨
Guys… wake up before it's too late 😮💨💀
Sometimes, golden opportunities present themselves right in front of you…
but people keep ignoring them and regret it later.
Look at $ARIA 👀
I checked the on-chain data… and it's very clear:
The big whales are slowly starting to realize profits.
And if you look at the chart… it already looks weak.
Something big is about to happen.
A liquidity hunt is coming… and buyers will become the liquidity.
You know I don't trade on emotions… I follow the data.
That's why I have already opened a short position here.
It can easily drop below $0.3 👀
Now, everything is in front of you.
If you miss this again… then nothing can save you.
I did my part, I warned you.
and $SIREN and $ARIA both stupid together.
Now, it's your turn…
Act smartly or regret it later 😮💨
Sometimes, golden opportunities present themselves right in front of you…
but people keep ignoring them and regret it later.
Look at $ARIA 👀
I checked the on-chain data… and it's very clear:
The big whales are slowly starting to realize profits.
And if you look at the chart… it already looks weak.
Something big is about to happen.
A liquidity hunt is coming… and buyers will become the liquidity.
You know I don't trade on emotions… I follow the data.
That's why I have already opened a short position here.
It can easily drop below $0.3 👀
Now, everything is in front of you.
If you miss this again… then nothing can save you.
I did my part, I warned you.
and $SIREN and $ARIA both stupid together.
Now, it's your turn…
Act smartly or regret it later 😮💨
1
897
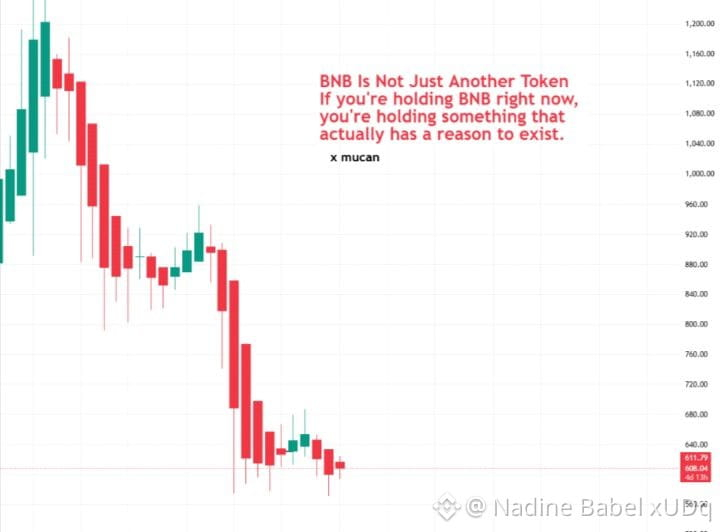
you buy $BNB - Add #Aster
If you buy $SOL - Add #pump
If you buy $TON - Add #NOT
Each blockchain has its own living world inside, and when the main coin rises, everything inside that world rises with it.
That's why when BNB moves, Aster moves, when SOL takes off, the Pumpfun token moves with it, when TON runs, NOT runs alongside it, these are not separate bets, they are the same bet just from two angles.
Most people only buy the big coin and miss the real gains that are just below, don't be that person.
Buy the chain, add the ecosystem, and see how different your portfolio is when the market turns green.
$BNB
you buy $BNB - Add #Aster
If you buy $SOL - Add #pump
If you buy $TON - Add #NOT
Each blockchain has its own living world inside, and when the main coin rises, everything inside that world rises with it.
That's why when BNB moves, Aster moves, when SOL takes off, the Pumpfun token moves with it, when TON runs, NOT runs alongside it, these are not separate bets, they are the same bet just from two angles.
Most people only buy the big coin and miss the real gains that are just below, don't be that person.
Buy the chain, add the ecosystem, and see how different your portfolio is when the market turns green.
$BNB
If you buy $SOL - Add #pump
If you buy $TON - Add #NOT
Each blockchain has its own living world inside, and when the main coin rises, everything inside that world rises with it.
That's why when BNB moves, Aster moves, when SOL takes off, the Pumpfun token moves with it, when TON runs, NOT runs alongside it, these are not separate bets, they are the same bet just from two angles.
Most people only buy the big coin and miss the real gains that are just below, don't be that person.
Buy the chain, add the ecosystem, and see how different your portfolio is when the market turns green.
$BNB
1
455
THE NEXT OFFICIAL ANNOUNCEMENT FROM IRAN WILL BE DECISIVE FOR THE ENTIRE MARKET
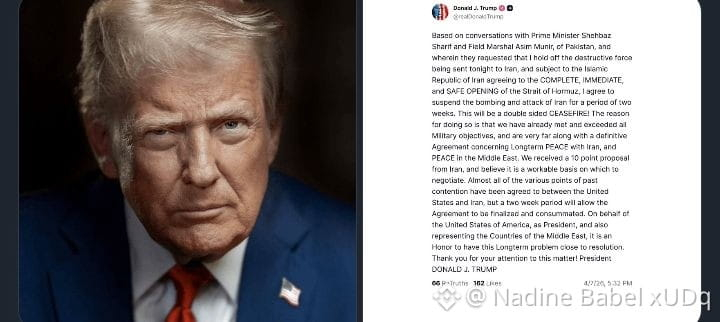
President Trump has just announced a two-week ceasefire with Iran, provided that Iran completely opens the Strait of Hormuz for the passage of ships.
Despite the very tense situation over the last 24 hours, and the multiple strikes from the USA and their allies Israel, the deadline initially given by Trump - for Iran to fully open the strait or face airstrikes on its infrastructure - was about 60 minutes on the countdown.
The work of the mediators, particularly Pakistan, has finally led to an acceptance of a two-week ceasefire by Trump, if Iran agrees to completely open the strait.
For now, markets are reacting positively, but everything now depends on Tehran's official response, as well as the respect for the ceasefire by the United States and their allies on the ground.
Note that Iran generally rejects temporary ceasefires and demands strong guarantees (end of strikes, compensations, etc.)
This means that even if the market is currently pumping, the risk of a reversal remains extremely high.
As long as Iran has not officially validated the opening of the strait and accepted the conditions, any pump remains fragile.
It is also important to understand one thing:
Iran is not just in an economic logic, but in a geopolitical and strategic logic.
Accepting to open the strait under pressure = loss of leverage. So they can:
> delay the decision
> set new conditions
> or even completely refuse
So even if it is going up currently ($BTC , $ETH $CL …), it is a rise under tension.
Stay cautious $BTC
THE NEXT OFFICIAL ANNOUNCEMENT FROM IRAN WILL BE DECISIVE FOR THE ENTIRE MARKET
President Trump has just announced a two-week ceasefire with Iran, provided that Iran completely opens the Strait of Hormuz for the passage of ships.
Despite the very tense situation over the last 24 hours, and the multiple strikes from the USA and their allies Israel, the deadline initially given by Trump - for Iran to fully open the strait or face airstrikes on its infrastructure - was about 60 minutes on the countdown.
The work of the mediators, particularly Pakistan, has finally led to an acceptance of a two-week ceasefire by Trump, if Iran agrees to completely open the strait.
For now, markets are reacting positively, but everything now depends on Tehran's official response, as well as the respect for the ceasefire by the United States and their allies on the ground.
Note that Iran generally rejects temporary ceasefires and demands strong guarantees (end of strikes, compensations, etc.)
This means that even if the market is currently pumping, the risk of a reversal remains extremely high.
As long as Iran has not officially validated the opening of the strait and accepted the conditions, any pump remains fragile.
It is also important to understand one thing:
Iran is not just in an economic logic, but in a geopolitical and strategic logic.
Accepting to open the strait under pressure = loss of leverage. So they can:
> delay the decision
> set new conditions
> or even completely refuse
So even if it is going up currently ($BTC , $ETH $CL …), it is a rise under tension.
Stay cautious $BTC
President Trump has just announced a two-week ceasefire with Iran, provided that Iran completely opens the Strait of Hormuz for the passage of ships.
Despite the very tense situation over the last 24 hours, and the multiple strikes from the USA and their allies Israel, the deadline initially given by Trump - for Iran to fully open the strait or face airstrikes on its infrastructure - was about 60 minutes on the countdown.
The work of the mediators, particularly Pakistan, has finally led to an acceptance of a two-week ceasefire by Trump, if Iran agrees to completely open the strait.
For now, markets are reacting positively, but everything now depends on Tehran's official response, as well as the respect for the ceasefire by the United States and their allies on the ground.
Note that Iran generally rejects temporary ceasefires and demands strong guarantees (end of strikes, compensations, etc.)
This means that even if the market is currently pumping, the risk of a reversal remains extremely high.
As long as Iran has not officially validated the opening of the strait and accepted the conditions, any pump remains fragile.
It is also important to understand one thing:
Iran is not just in an economic logic, but in a geopolitical and strategic logic.
Accepting to open the strait under pressure = loss of leverage. So they can:
> delay the decision
> set new conditions
> or even completely refuse
So even if it is going up currently ($BTC , $ETH $CL …), it is a rise under tension.
Stay cautious $BTC
15
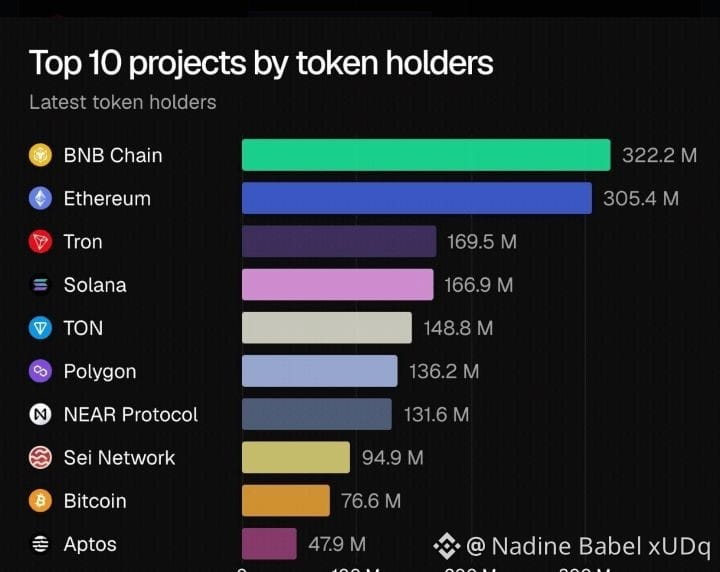
$BNB BNBCHAIN REACHES 322M HOLDERS, LEADING GLOBAL ADOPTION OF CRYPTOS
The BNB chain has taken the lead as the most widely held crypto network, reaching 322.2 million token holders. Ethereum closely follows with 305.4 million.
The gap at the top remains narrow, but the BNB chain continues to pull ahead, signaling strong retail penetration and ecosystem reach. Ethereum maintains its position as the dominant smart contract platform, supported by deep liquidity and developer activity.
Tron, Solana, and TON complete the next tier, each exceeding 140 million holders. These networks continue to benefit from low fees and high throughput, driving user growth in emerging markets.
Further down the list, Polygon, NEAR, and Sei show steady expansion, while Bitcoin stands at 76.6 million holders, reflecting its different role as a store of value rather than a high-frequency user chain.$BNB
$BNB BNBCHAIN REACHES 322M HOLDERS, LEADING GLOBAL ADOPTION OF CRYPTOS
The BNB chain has taken the lead as the most widely held crypto network, reaching 322.2 million token holders. Ethereum closely follows with 305.4 million.
The gap at the top remains narrow, but the BNB chain continues to pull ahead, signaling strong retail penetration and ecosystem reach. Ethereum maintains its position as the dominant smart contract platform, supported by deep liquidity and developer activity.
Tron, Solana, and TON complete the next tier, each exceeding 140 million holders. These networks continue to benefit from low fees and high throughput, driving user growth in emerging markets.
Further down the list, Polygon, NEAR, and Sei show steady expansion, while Bitcoin stands at 76.6 million holders, reflecting its different role as a store of value rather than a high-frequency user chain.$BNB
The BNB chain has taken the lead as the most widely held crypto network, reaching 322.2 million token holders. Ethereum closely follows with 305.4 million.
The gap at the top remains narrow, but the BNB chain continues to pull ahead, signaling strong retail penetration and ecosystem reach. Ethereum maintains its position as the dominant smart contract platform, supported by deep liquidity and developer activity.
Tron, Solana, and TON complete the next tier, each exceeding 140 million holders. These networks continue to benefit from low fees and high throughput, driving user growth in emerging markets.
Further down the list, Polygon, NEAR, and Sei show steady expansion, while Bitcoin stands at 76.6 million holders, reflecting its different role as a store of value rather than a high-frequency user chain.$BNB
118
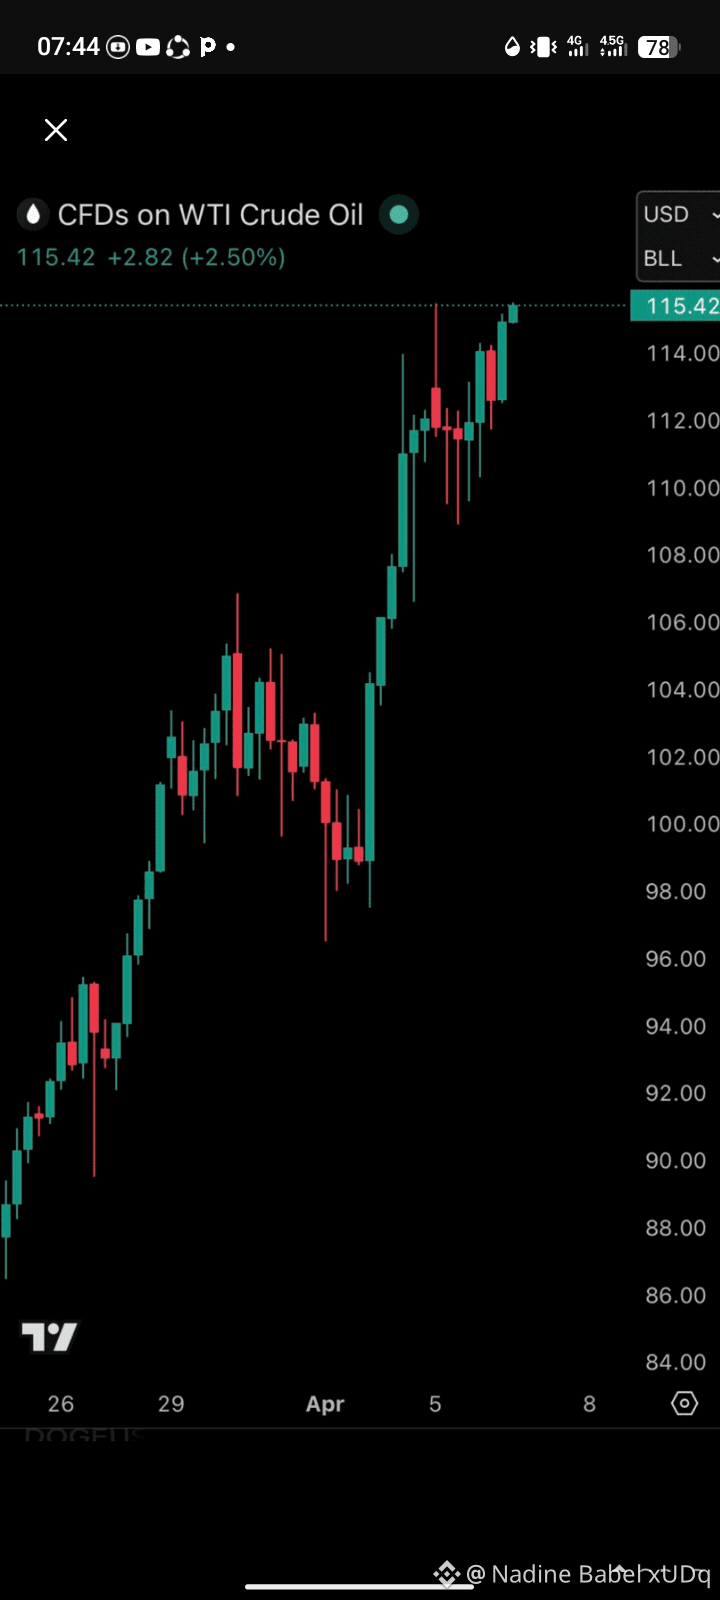
URGENT: American oil prices extend their gains to $115.50/barrel, now up by +110% since the low of December 2025.
Inflation expectations are rising.
URGENT: American oil prices extend their gains to $115.50/barrel, now up by +110% since the low of December 2025.
Inflation expectations are rising.
Inflation expectations are rising.
14
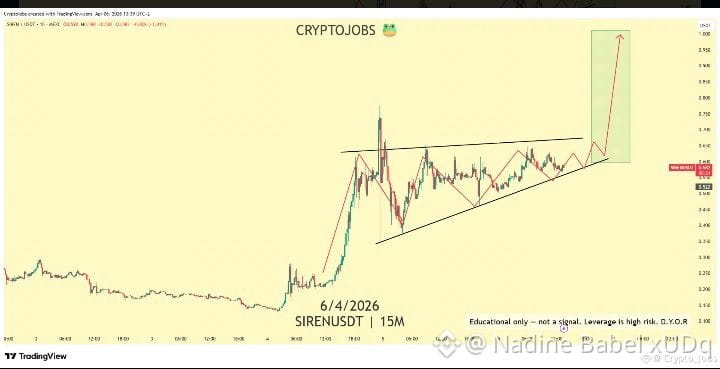
I checked twice $SIREN and the next move could be a push towards 1.00$+ 🚀
I checked twice $SIREN and the next move could be a push towards 1.00$+ 🚀
23
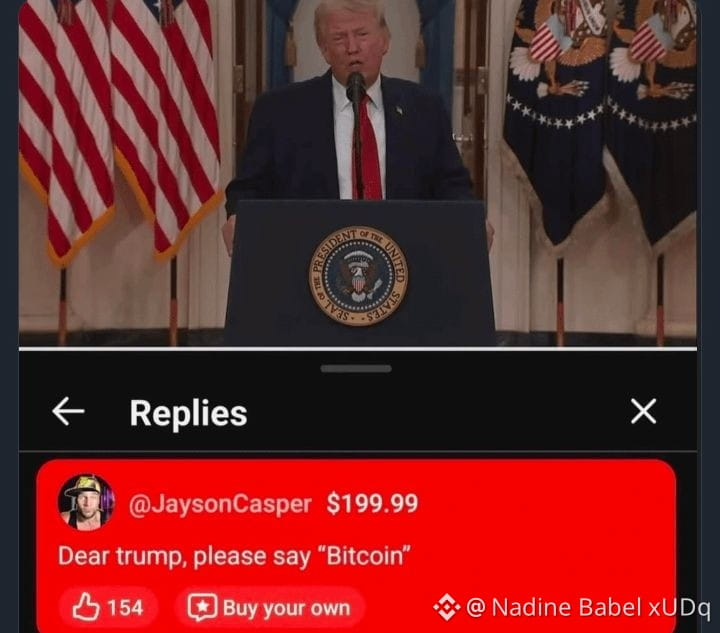
Guys, my friend literally left a tip of $199.9 during Trump's live and wrote:
"Please Trump, say Bitcoin" 😭😂
Because he knows we are already in a long position on BTC 💀📈
At this point, if $BTC doesn't reach 70K... we're going bankrupt 💀🤣$BTC
Guys, my friend literally left a tip of $199.9 during Trump's live and wrote:
"Please Trump, say Bitcoin" 😭😂
Because he knows we are already in a long position on BTC 💀📈
At this point, if $BTC doesn't reach 70K... we're going bankrupt 💀🤣$BTC
"Please Trump, say Bitcoin" 😭😂
Because he knows we are already in a long position on BTC 💀📈
At this point, if $BTC doesn't reach 70K... we're going bankrupt 💀🤣$BTC
643
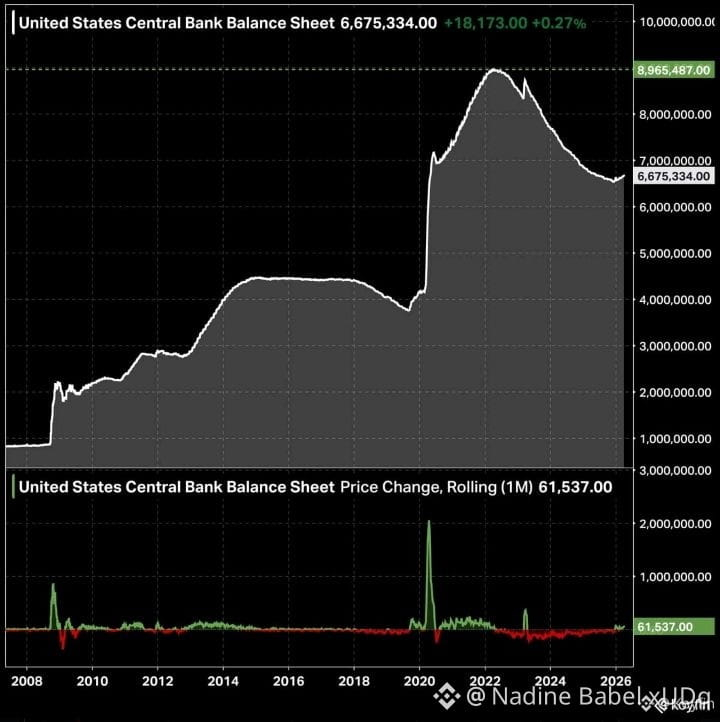
December 2025 marked the relative low for the Federal Reserve's balance sheet.
Since then, it has increased by approximately 2.15% over 4 months.
December 2025 marked the relative low for the Federal Reserve's balance sheet.
Since then, it has increased by approximately 2.15% over 4 months.
Since then, it has increased by approximately 2.15% over 4 months.
174
Log in to explore more content
Join global crypto users on Binance Square
⚡️ Get latest and useful information about crypto.
💬 Trusted by the world’s largest crypto exchange.
👍 Discover real insights from verified creators.
Email / Phone number
Trending Topics
CircleMints500MUSDCOnSolana
2,145 views
190 Discussing
💰 MASSIVE: Circle Mints $500M $USDC on Solana!
Circle just minted 500 Million $USDC on Solana in 2 transactions ($250M + $250M) on Sept 25, in just 5.5 hours! 🚀
Solana now holds $7.48B+ $USDC dominance - over 50% of its $14.7B stablecoin supply.
Why Solana?
⚡️ Speed: 65k TPS
💸 Low Fees: $0.00025
🔥 DeFi Hub: Jupiter, Raydium pumping
This is one of the largest single-day mints & signals HUGE institutional demand for Solana ecosystem.
Bullish for $SOL? 👇
#Circle #USDC #Solana #Stablecoin #DeFi#circlemints500musdconsolana
True News
·8 Likes
·2.3k views
PolymarketBankFailureBetsDrawFDICConcern
13,635 views
442 Discussing
BlackRockBuildsTokenizedPortfoliosForOndo
10,534 views
307 Discussing