
tou头
1.4k Posts

tou头
Report
Block User
0 Following
55 Followers
64 Liked
Posts
·
--
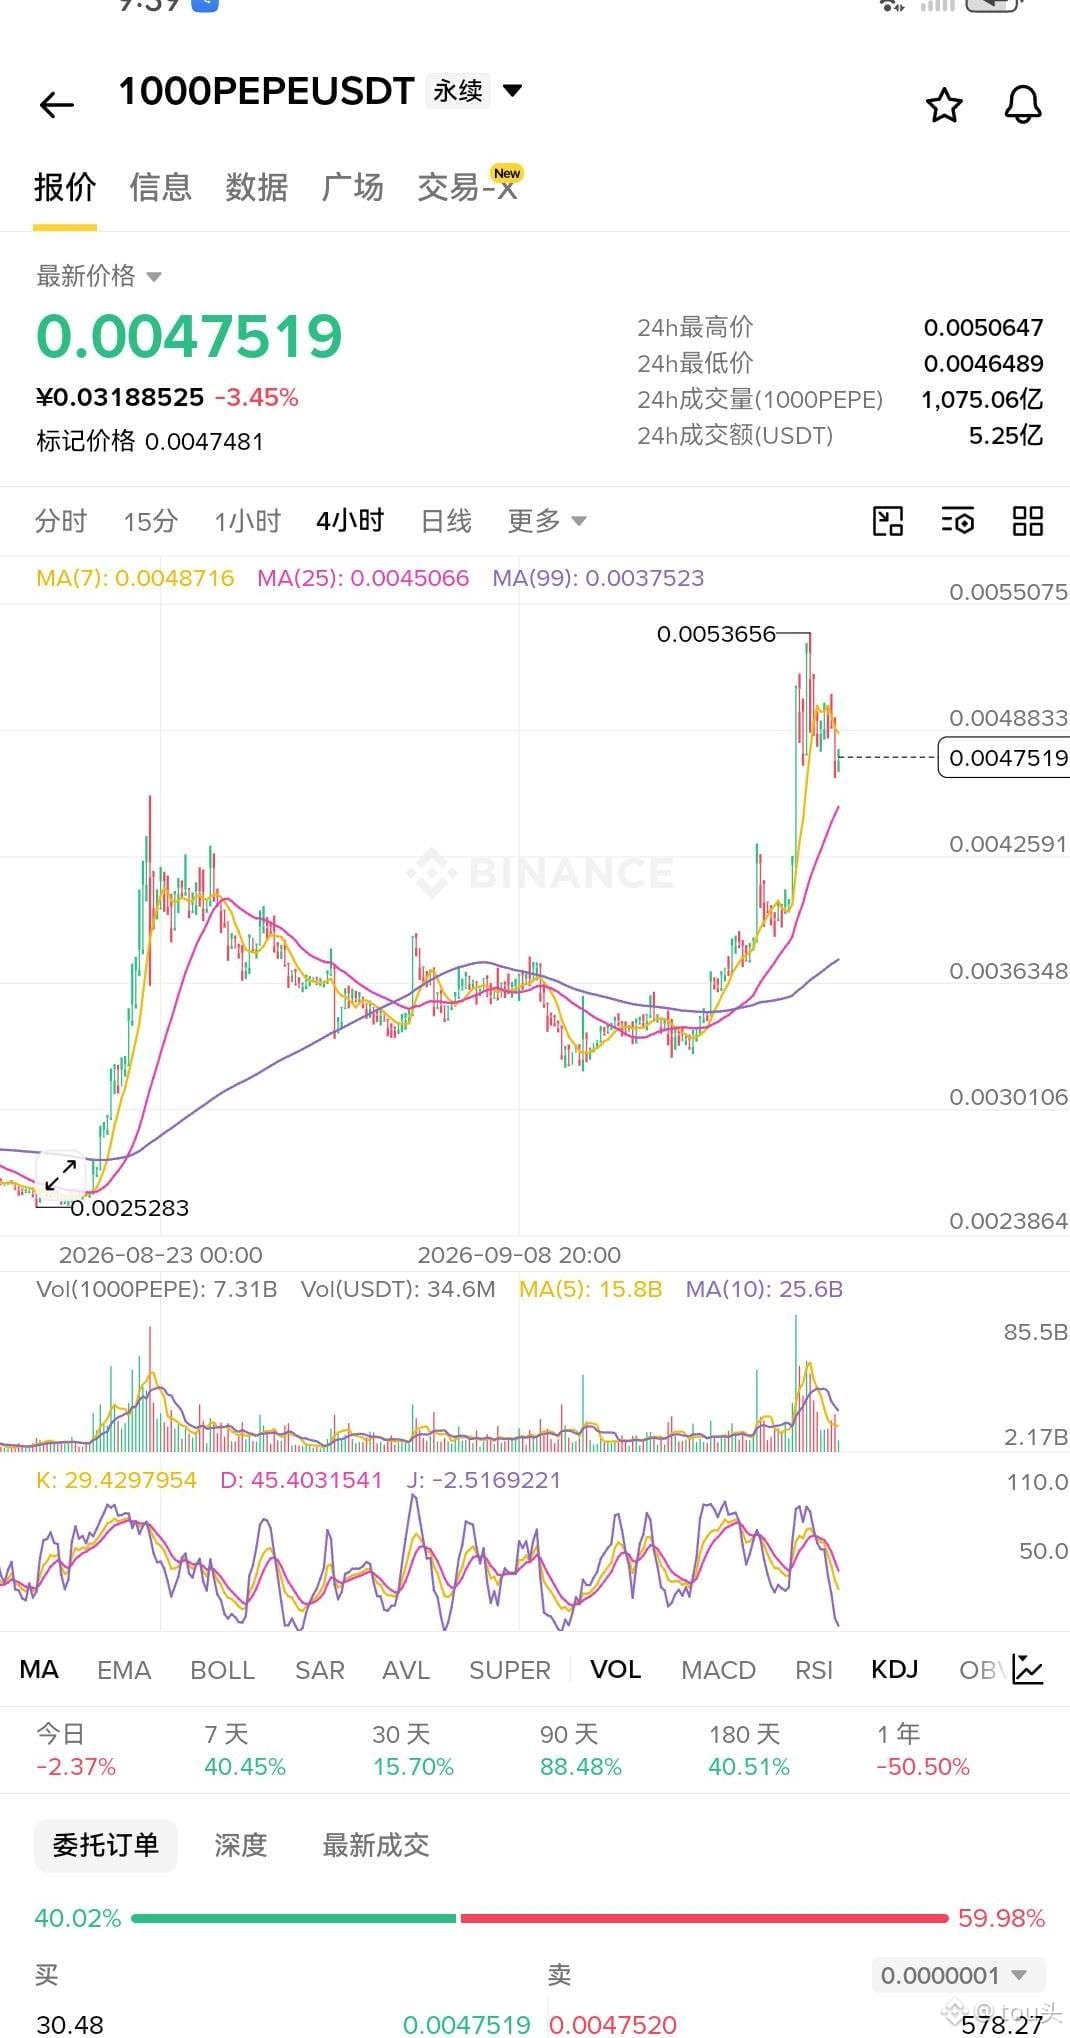
I really can’t understand this. The bid on this order book is so thick it’s like a wall, yet the price keeps sliding down. The gap between buy and sell is only minuscule—so is this called “supporting the market”? No, this is staged performance. With so many fewer big-holder accounts, their positions are actually piling higher instead—aren’t they just waiting to harvest? Believe them and your money is gone.
I really can’t understand this. The bid on this order book is so thick it’s like a wall, yet the price keeps sliding down. The gap between buy and sell is only minuscule—so is this called “supporting the market”? No, this is staged performance. With so many fewer big-holder accounts, their positions are actually piling higher instead—aren’t they just waiting to harvest? Believe them and your money is gone.
17
·
--
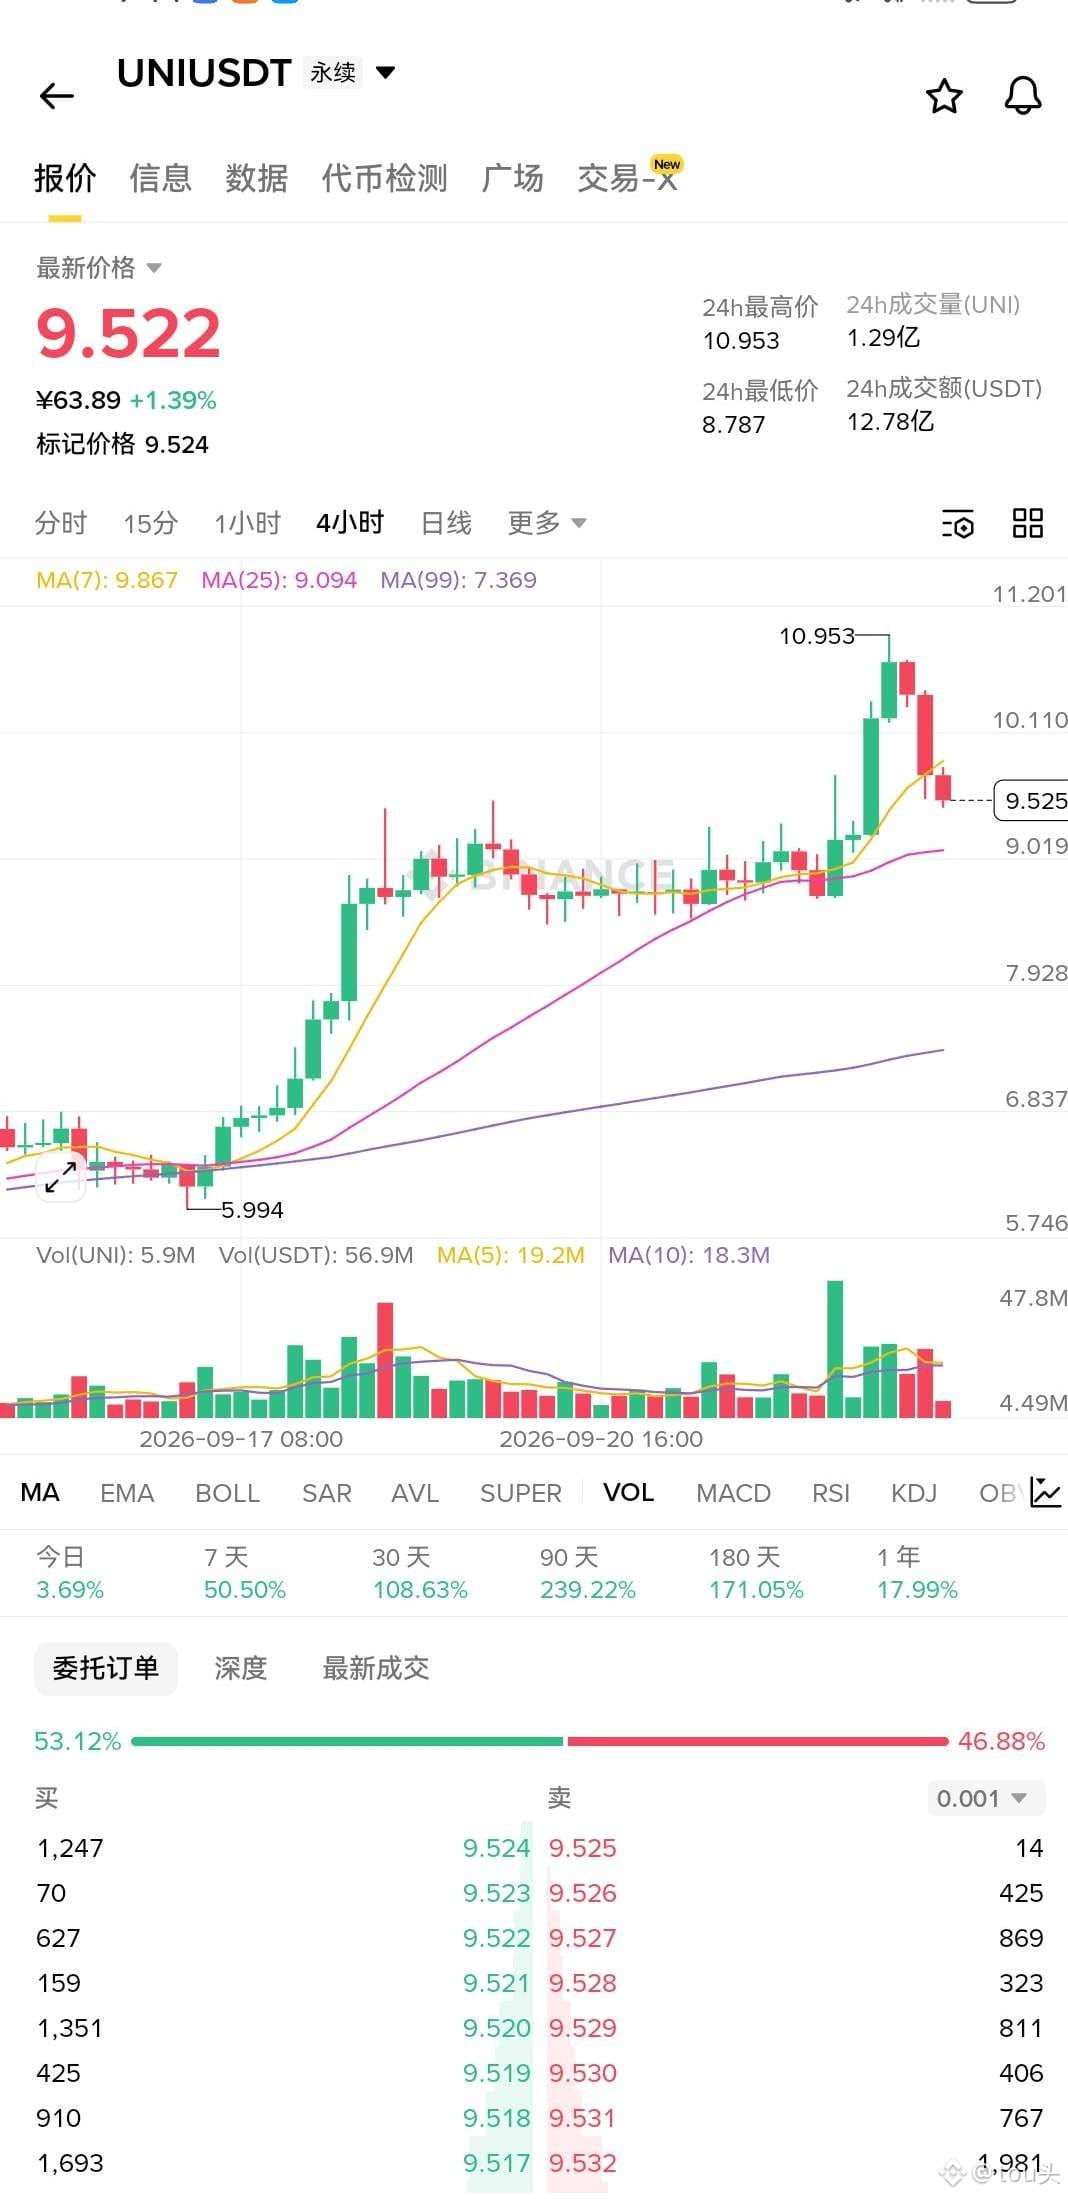
Uh, the UNI price over here just pulled back from a recent high—yet at the same time, the perpetual open interest has jumped nearly 40%. How is this a retreat? Someone is using the dip to furiously load up inventory from behind. Over the four-hour horizon, the direction is still pointing up: of the six candlesticks, four are bullish. The quadrant already displays a clear sign of strong long momentum. On the one-hour chart, those six bearish candles were just a scare tactic—fake moves to spook people. In the large accounts, the long position ratio is almost 70%, and over the past seven hours they’ve kept adding. These folks aren’t here to sightsee; they’re here to stock up. With this setup, you can see it with the naked eye: the more vicious the pullback washout, the faster the next wave of the train will run. When the shorts think they’ve got it, if this move finishes washing out the shorts, the price will still jump higher for another leg.
Uh, the UNI price over here just pulled back from a recent high—yet at the same time, the perpetual open interest has jumped nearly 40%. How is this a retreat? Someone is using the dip to furiously load up inventory from behind. Over the four-hour horizon, the direction is still pointing up: of the six candlesticks, four are bullish. The quadrant already displays a clear sign of strong long momentum. On the one-hour chart, those six bearish candles were just a scare tactic—fake moves to spook people. In the large accounts, the long position ratio is almost 70%, and over the past seven hours they’ve kept adding. These folks aren’t here to sightsee; they’re here to stock up. With this setup, you can see it with the naked eye: the more vicious the pullback washout, the faster the next wave of the train will run. When the shorts think they’ve got it, if this move finishes washing out the shorts, the price will still jump higher for another leg.
·
--
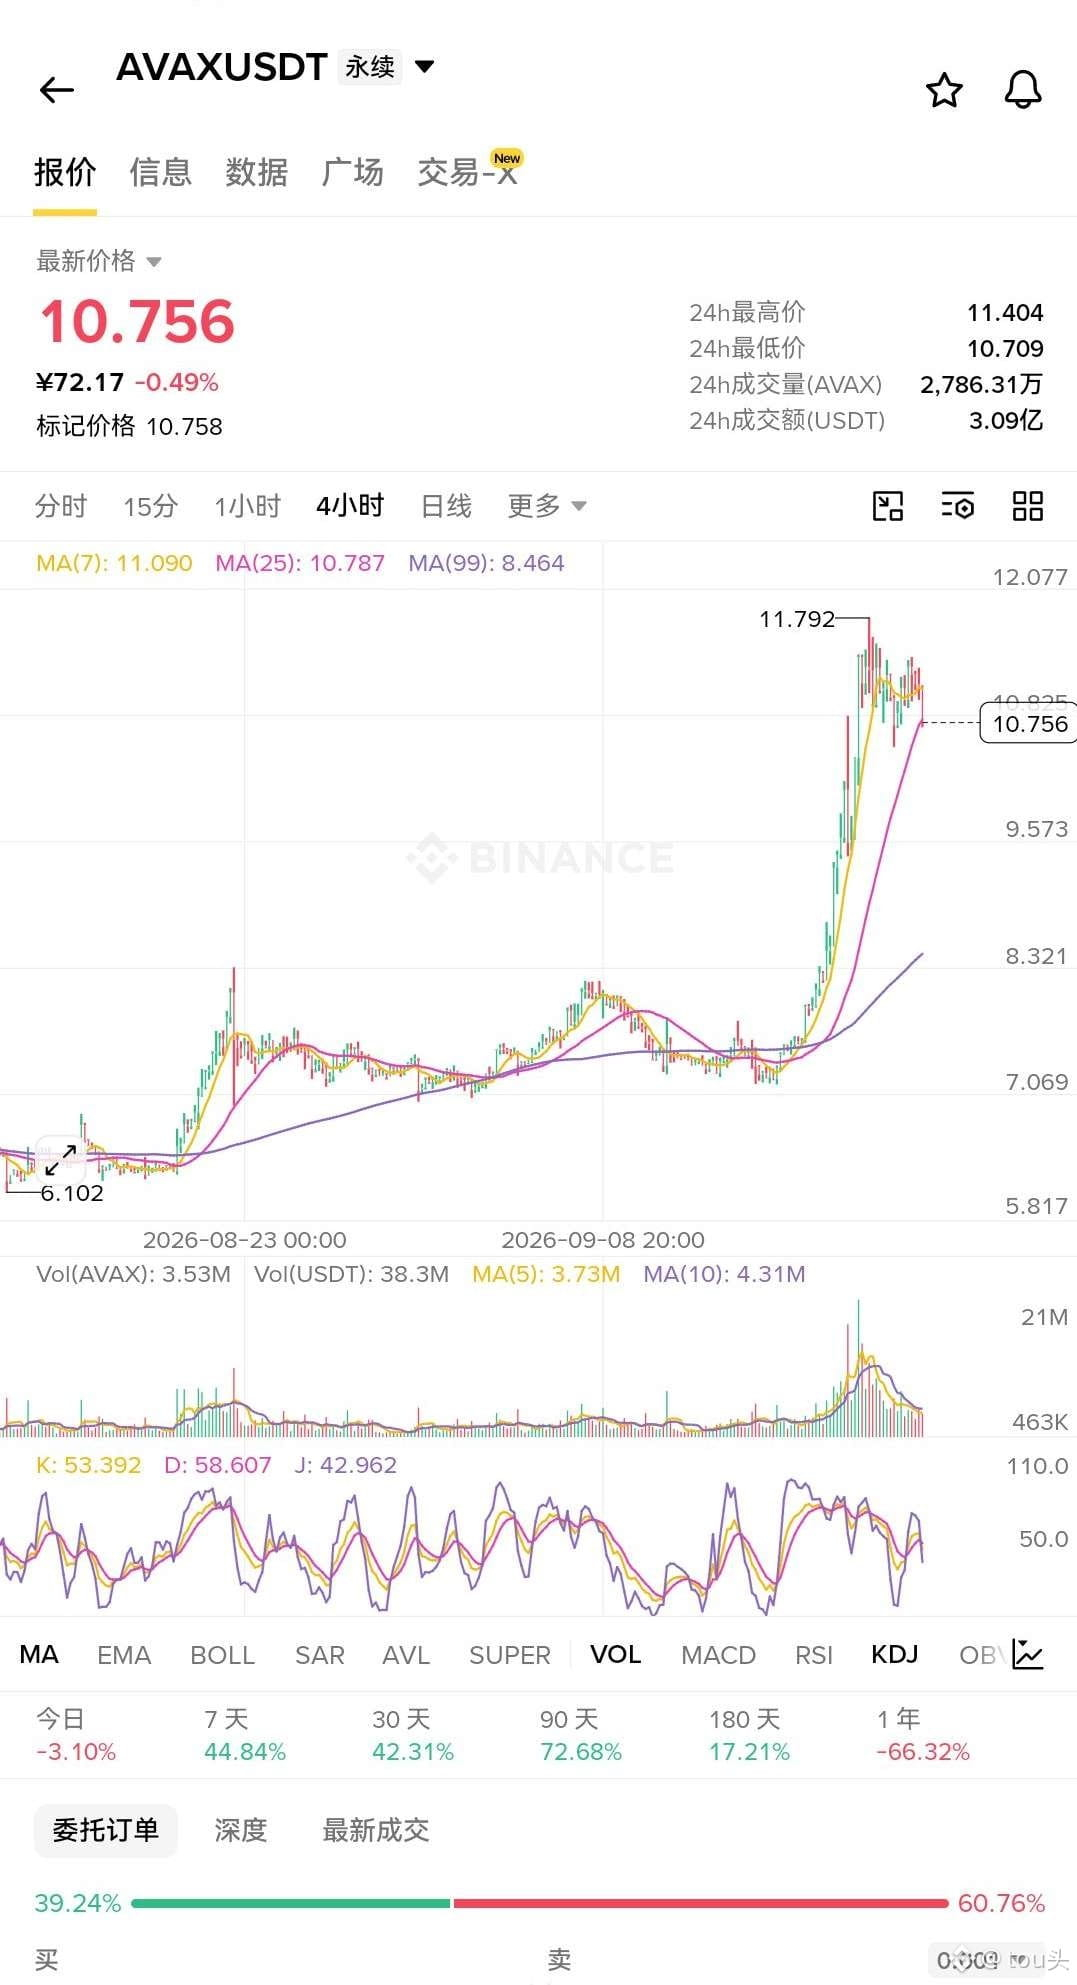
$AVAX The fee rate is still positive, yet the price has been smashed down by nearly four points within an hour. All the longs’ money is stuck in their positions and can’t get out. In the spot market, there’s a net outflow of 160,000 in the last 15 minutes; sell volume is actively being pushed down while buy volume is being suppressed. This isn’t a washout/pullback—it’s funds using the fee rate as a cover to escape. At the current price of 10.75, go short directly. First target: 9.43. If it breaks through, then look at 9.00. Stop loss: 11.50. The structure has already turned into accelerating downside—so what are you waiting for a rebound?
$AVAX The fee rate is still positive, yet the price has been smashed down by nearly four points within an hour. All the longs’ money is stuck in their positions and can’t get out. In the spot market, there’s a net outflow of 160,000 in the last 15 minutes; sell volume is actively being pushed down while buy volume is being suppressed. This isn’t a washout/pullback—it’s funds using the fee rate as a cover to escape. At the current price of 10.75, go short directly. First target: 9.43. If it breaks through, then look at 9.00. Stop loss: 11.50. The structure has already turned into accelerating downside—so what are you waiting for a rebound?
24
·
--
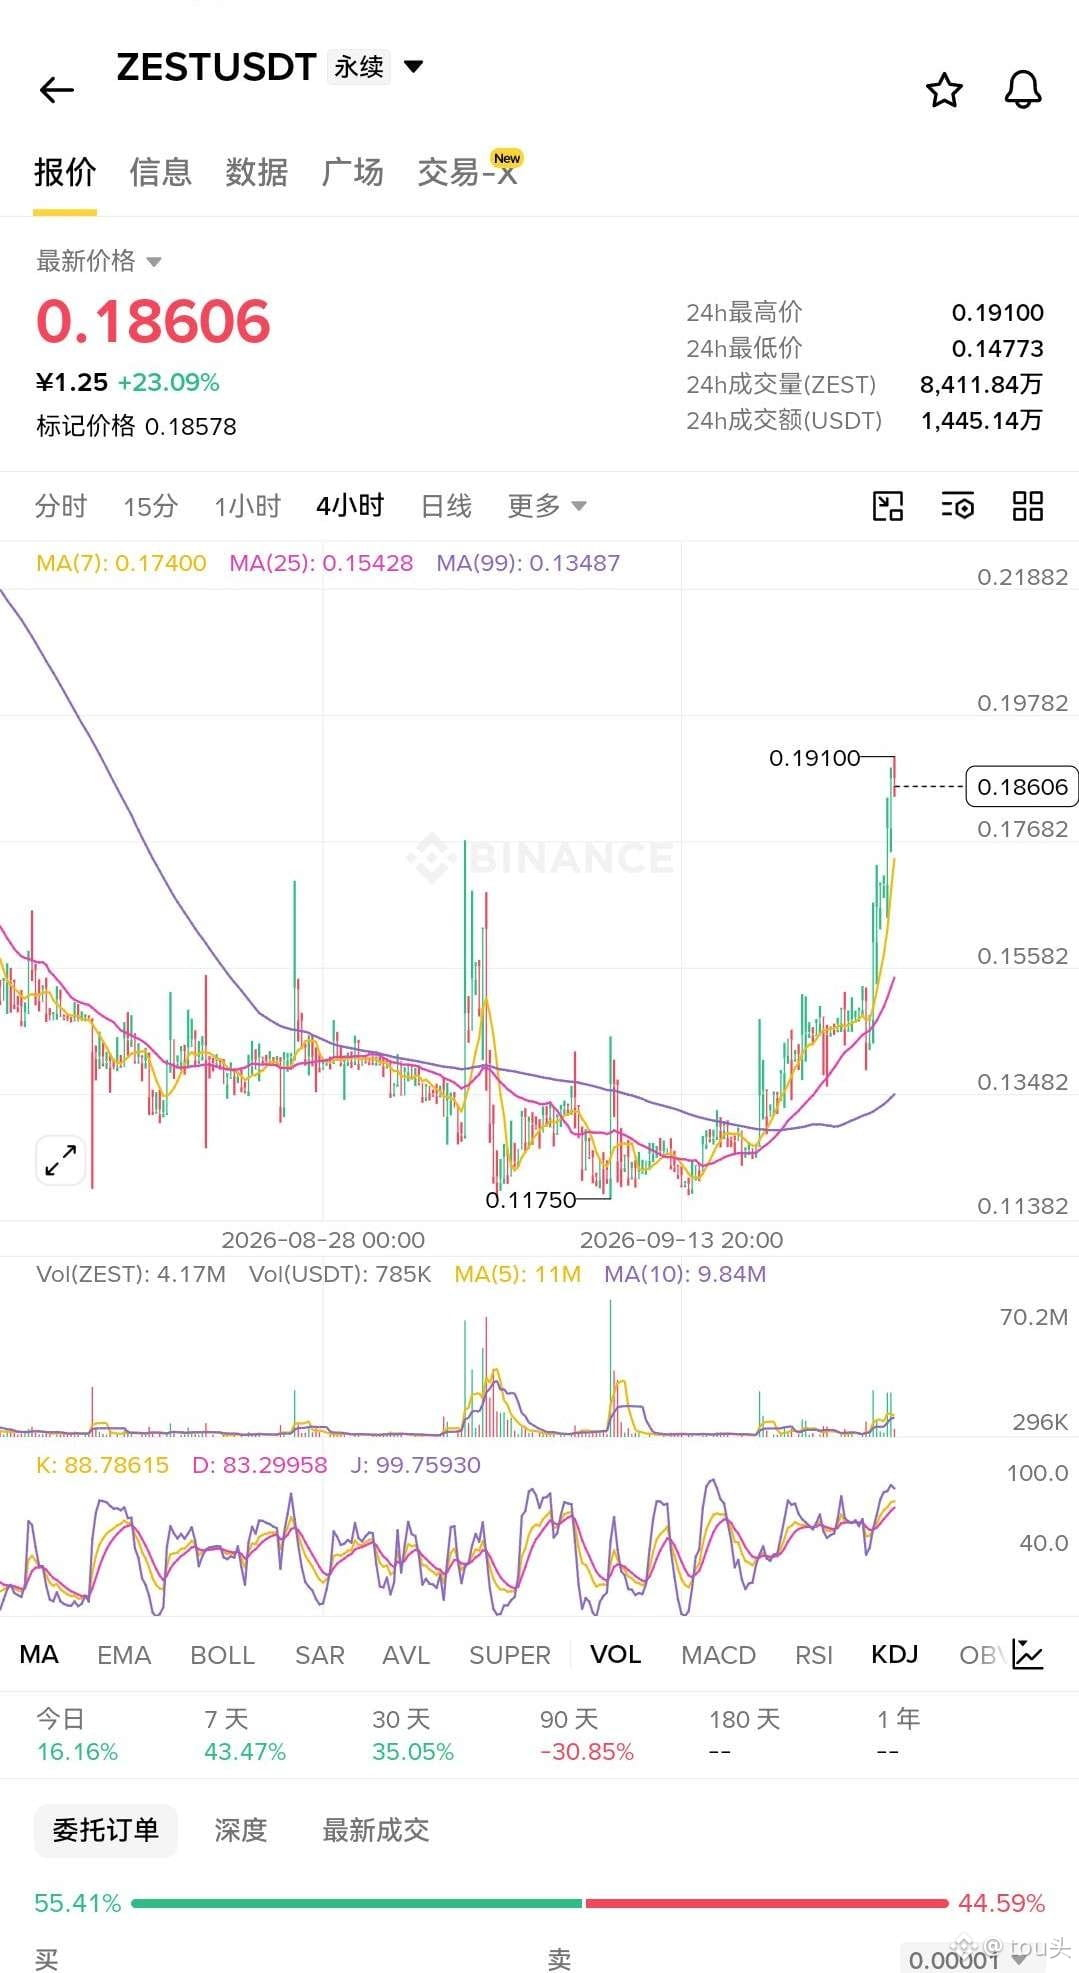
ZEST Over on the big-holder side, the long positions are already approaching 62%. In the past seven hours, they’ve continued adding by more than half a percent—these people aren’t here to sightsee; they’re here to stock up. The global accounts’ long/short ratio has also pushed beyond 1.5. The price action is still grinding near the higher range of the phase, and you can’t even find a single four-hour bearish candle. If you’re still hesitating at a time like this, when the market finally lifts, you’ll only be able to chase the price higher.
ZEST Over on the big-holder side, the long positions are already approaching 62%. In the past seven hours, they’ve continued adding by more than half a percent—these people aren’t here to sightsee; they’re here to stock up. The global accounts’ long/short ratio has also pushed beyond 1.5. The price action is still grinding near the higher range of the phase, and you can’t even find a single four-hour bearish candle. If you’re still hesitating at a time like this, when the market finally lifts, you’ll only be able to chase the price higher.
30
·
--
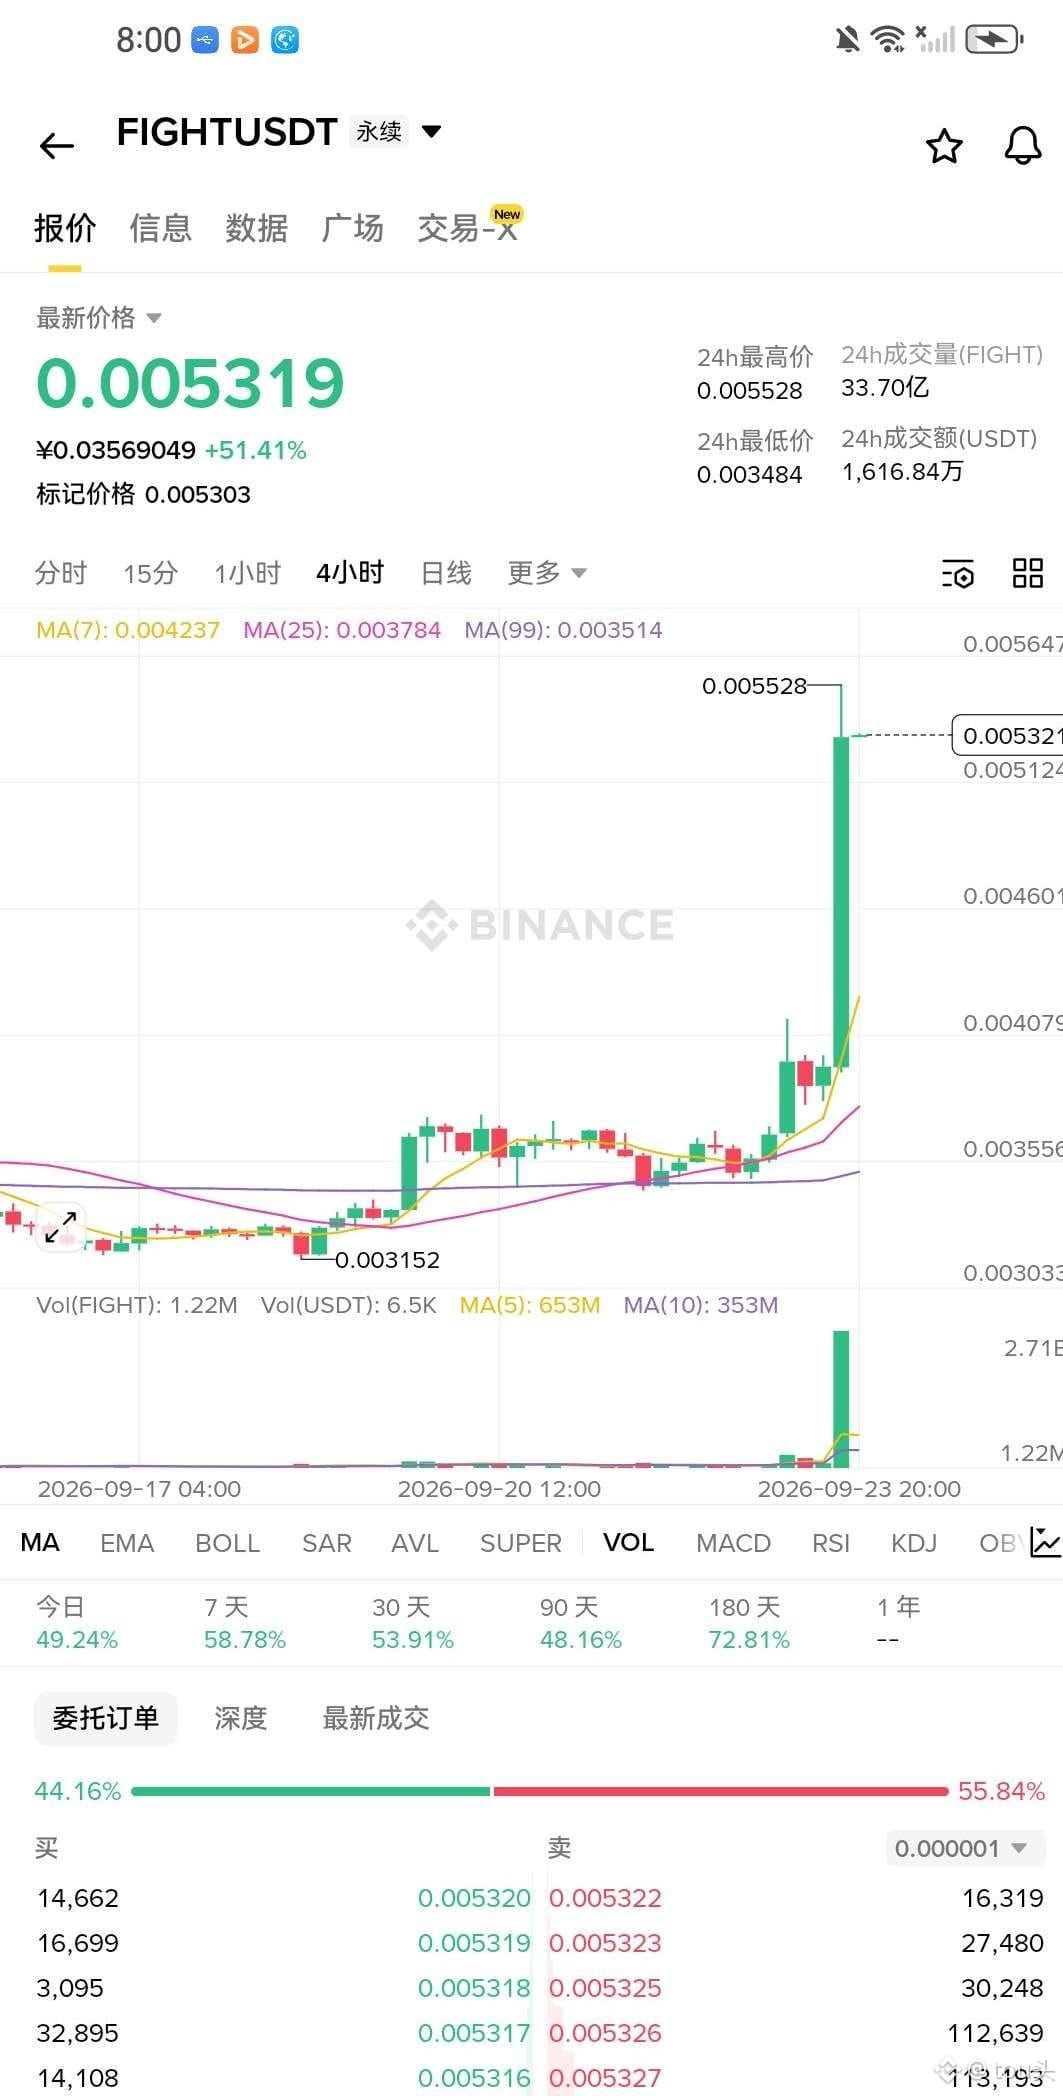
FIGHT This move isn’t a rebound—it's money adding to positions in plain sight. The open-interest (perpetual holdings) jumped by nearly 20% in one go. Price is pressing upward right along the stage’s highs, while the open-interest/price quadrant directly displays a bullish position—strong buying strength. Out of the last six four-hour candles, none are bearish red; the acceleration is still positive. The trend direction is perfectly aligned with the money flow—this is the standard posture for continuation of the rally. Don’t wait for a pullback. In a strong trend, pullbacks are like digging pits for the shorts; hold with the trend to take the profit.
FIGHT This move isn’t a rebound—it's money adding to positions in plain sight. The open-interest (perpetual holdings) jumped by nearly 20% in one go. Price is pressing upward right along the stage’s highs, while the open-interest/price quadrant directly displays a bullish position—strong buying strength. Out of the last six four-hour candles, none are bearish red; the acceleration is still positive. The trend direction is perfectly aligned with the money flow—this is the standard posture for continuation of the rally. Don’t wait for a pullback. In a strong trend, pullbacks are like digging pits for the shorts; hold with the trend to take the profit.
79
·
--
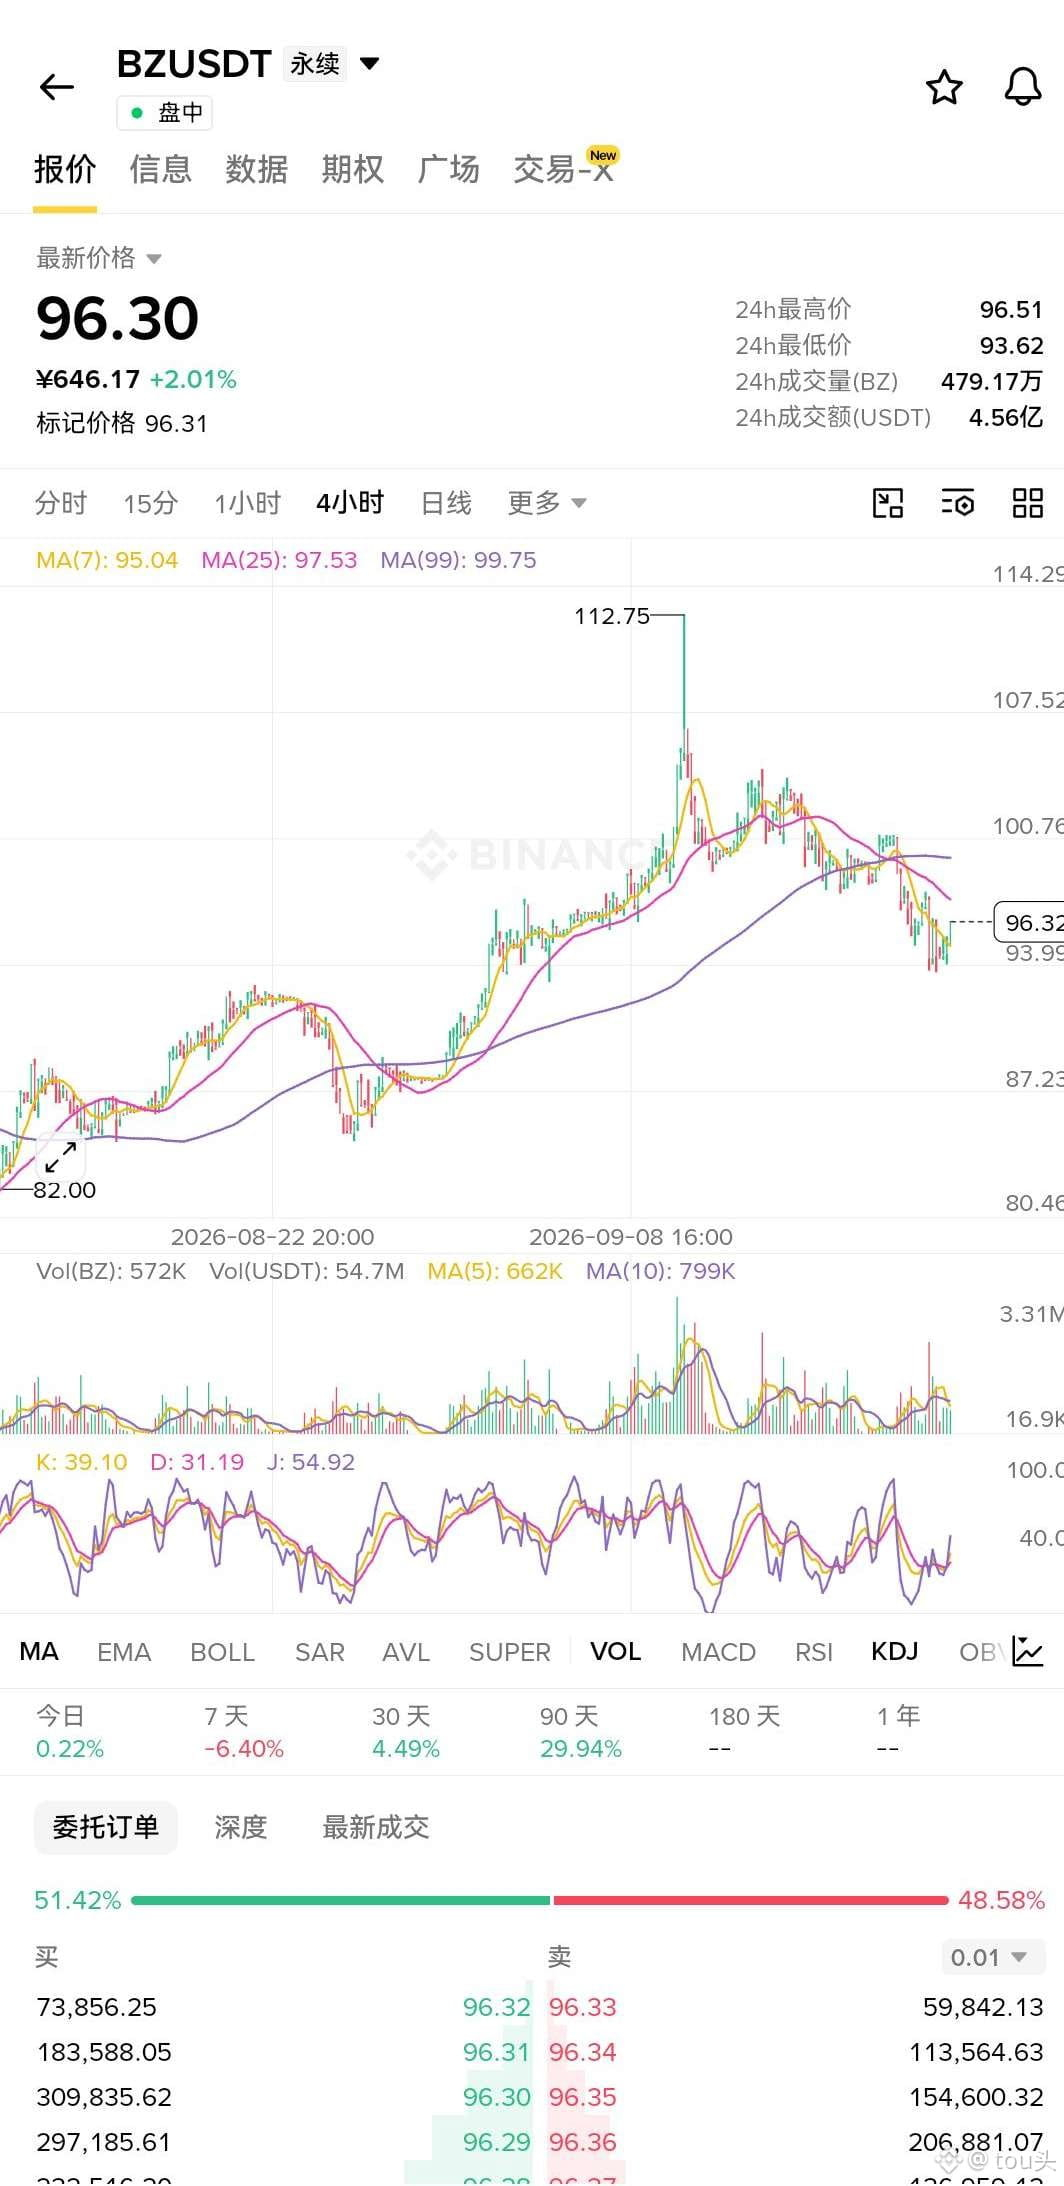
Prices grind upward along the moving averages. In the four-hour chart the trend is steadily pointing up—at a time like this, who still dares to stand in a short position? Open interest continues to expand: over the past seven days, it’s already up more than half a percent. The proportion of active buy orders is over half, and buy volume is pushing down sell volume—this isn’t a range to lure and run; it’s capital genuinely crowding into the long side. This price action squeezes me so tightly I can hardly breathe. The shorts are still there, stubbornly adding to their positions with hard-headed bravado. You add a yard, longs take a step in return—that’s simply using your face to catch punches. In the spot order book, the spread between buy and sell is as thin as paper; if you smash it down, everything gets swallowed immediately. With a market like this, if you don’t go in with the trend, then wait until the shorts get squeezed and blown up before chasing?
Prices grind upward along the moving averages. In the four-hour chart the trend is steadily pointing up—at a time like this, who still dares to stand in a short position? Open interest continues to expand: over the past seven days, it’s already up more than half a percent. The proportion of active buy orders is over half, and buy volume is pushing down sell volume—this isn’t a range to lure and run; it’s capital genuinely crowding into the long side. This price action squeezes me so tightly I can hardly breathe. The shorts are still there, stubbornly adding to their positions with hard-headed bravado. You add a yard, longs take a step in return—that’s simply using your face to catch punches. In the spot order book, the spread between buy and sell is as thin as paper; if you smash it down, everything gets swallowed immediately. With a market like this, if you don’t go in with the trend, then wait until the shorts get squeezed and blown up before chasing?
9
·
--
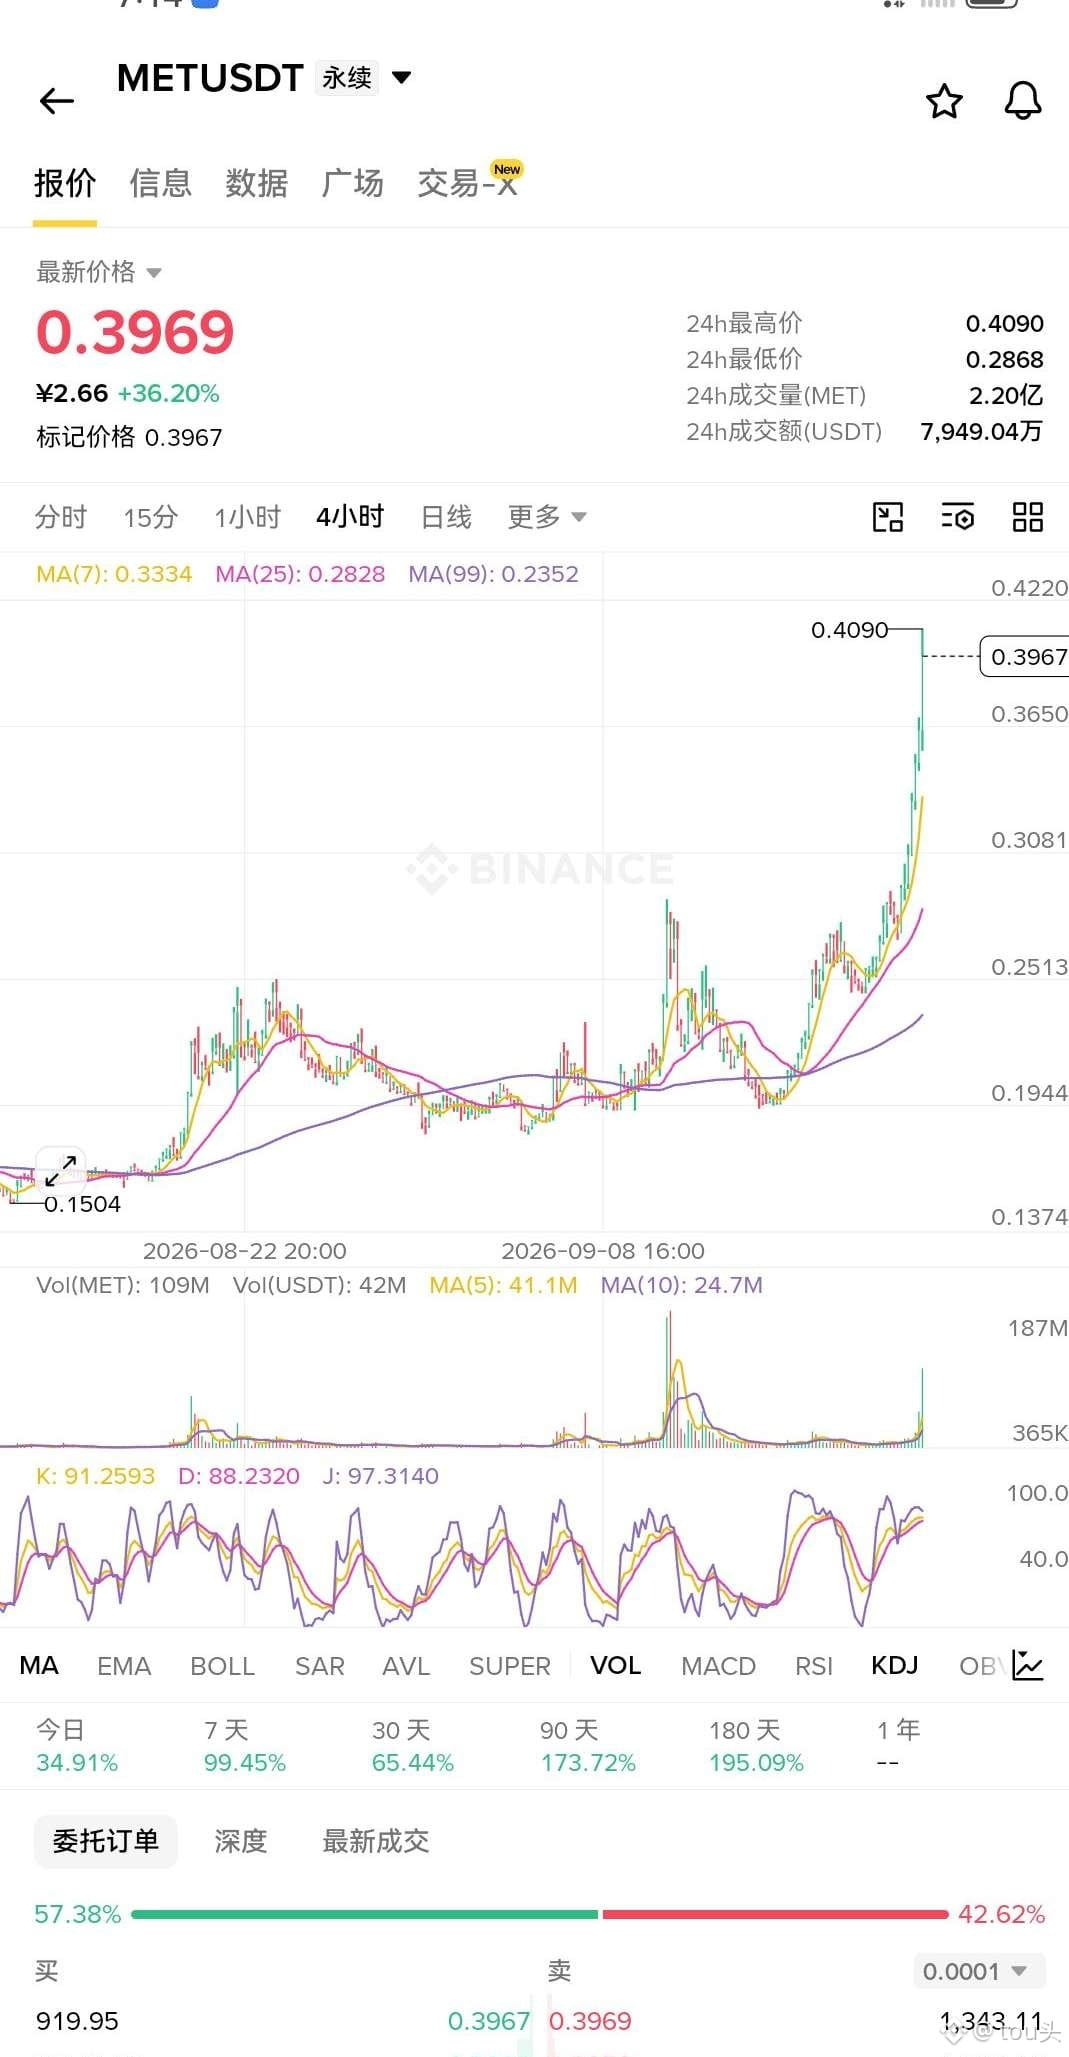
MET The pull-up speed is still rising, licking higher. Four hours of six consecutive days are all substantial red candles. In the short term, the acceleration slope has already tipped upward, leaving no breathing room for the shorts. In the spot order book, buy one is pressing and sell one is capped—depth is more than double compared with before. In the past three hours, capital has been continuously strong for twelve consecutive candles with not a single one turning negative; big orders are steadily being bought up. This kind of market where the higher it goes, the more people scramble for it—only one ending: keep pushing higher, 🈳!
MET The pull-up speed is still rising, licking higher. Four hours of six consecutive days are all substantial red candles. In the short term, the acceleration slope has already tipped upward, leaving no breathing room for the shorts. In the spot order book, buy one is pressing and sell one is capped—depth is more than double compared with before. In the past three hours, capital has been continuously strong for twelve consecutive candles with not a single one turning negative; big orders are steadily being bought up. This kind of market where the higher it goes, the more people scramble for it—only one ending: keep pushing higher, 🈳!
40
·
--
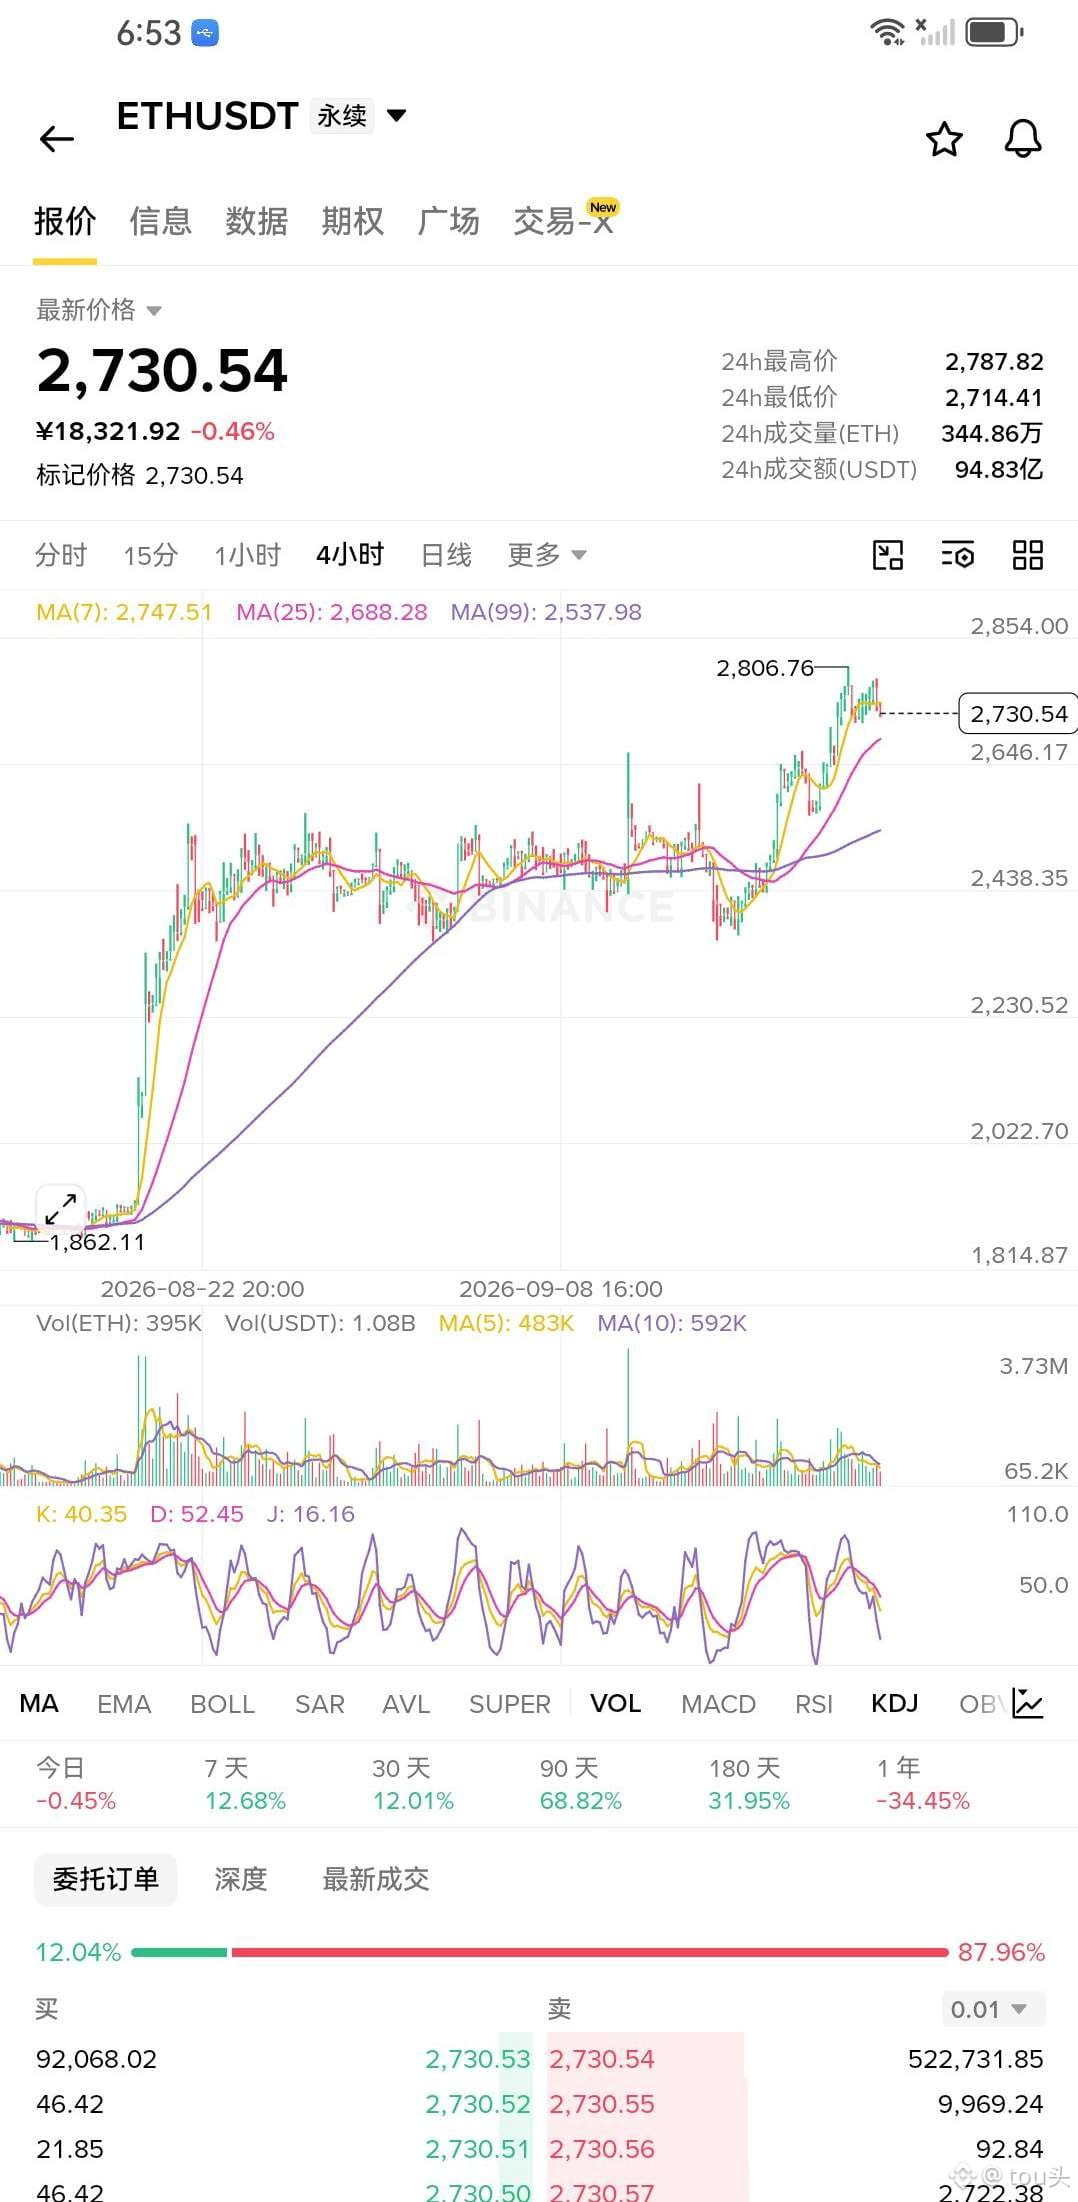
Some people are still shouting that ETH is a dip to buy. I’m too lazy to hear any more: six consecutive bearish candles in an hour, the price sliding steadily below the moving average, and not even a decent rebound. What are they still waiting for? Perpetual open interest shrank by more than 10% in a day, and the Four Quadrants directly shows a “bulls surrender” card—this isn’t a washout; someone has pulled back, with positions contracting rather than piling up. There may indeed be some bidders on the order book—active buy orders account for more than 60%—but the price just can’t lift. The more they buy, the more it falls. This is “buy pressure propping it up,” not “funds entering.” And don’t even mention that the leverage borrowing ratio crashed by more than 40% within 12 hours. People who borrowed money to go long are already paying it back and running. On-chain leverage is already something nobody dares to hold. This price action looks like a spring compressed for too long—when it releases, it snaps downward. Anyone still standing at the sidelines waiting to catch the rebound will ultimately find that they’re picking up a blade that hasn’t hit the ground yet. Before the knife lands, the hand is gone first.
Some people are still shouting that ETH is a dip to buy. I’m too lazy to hear any more: six consecutive bearish candles in an hour, the price sliding steadily below the moving average, and not even a decent rebound. What are they still waiting for? Perpetual open interest shrank by more than 10% in a day, and the Four Quadrants directly shows a “bulls surrender” card—this isn’t a washout; someone has pulled back, with positions contracting rather than piling up. There may indeed be some bidders on the order book—active buy orders account for more than 60%—but the price just can’t lift. The more they buy, the more it falls. This is “buy pressure propping it up,” not “funds entering.” And don’t even mention that the leverage borrowing ratio crashed by more than 40% within 12 hours. People who borrowed money to go long are already paying it back and running. On-chain leverage is already something nobody dares to hold. This price action looks like a spring compressed for too long—when it releases, it snaps downward. Anyone still standing at the sidelines waiting to catch the rebound will ultimately find that they’re picking up a blade that hasn’t hit the ground yet. Before the knife lands, the hand is gone first.
6
·
--
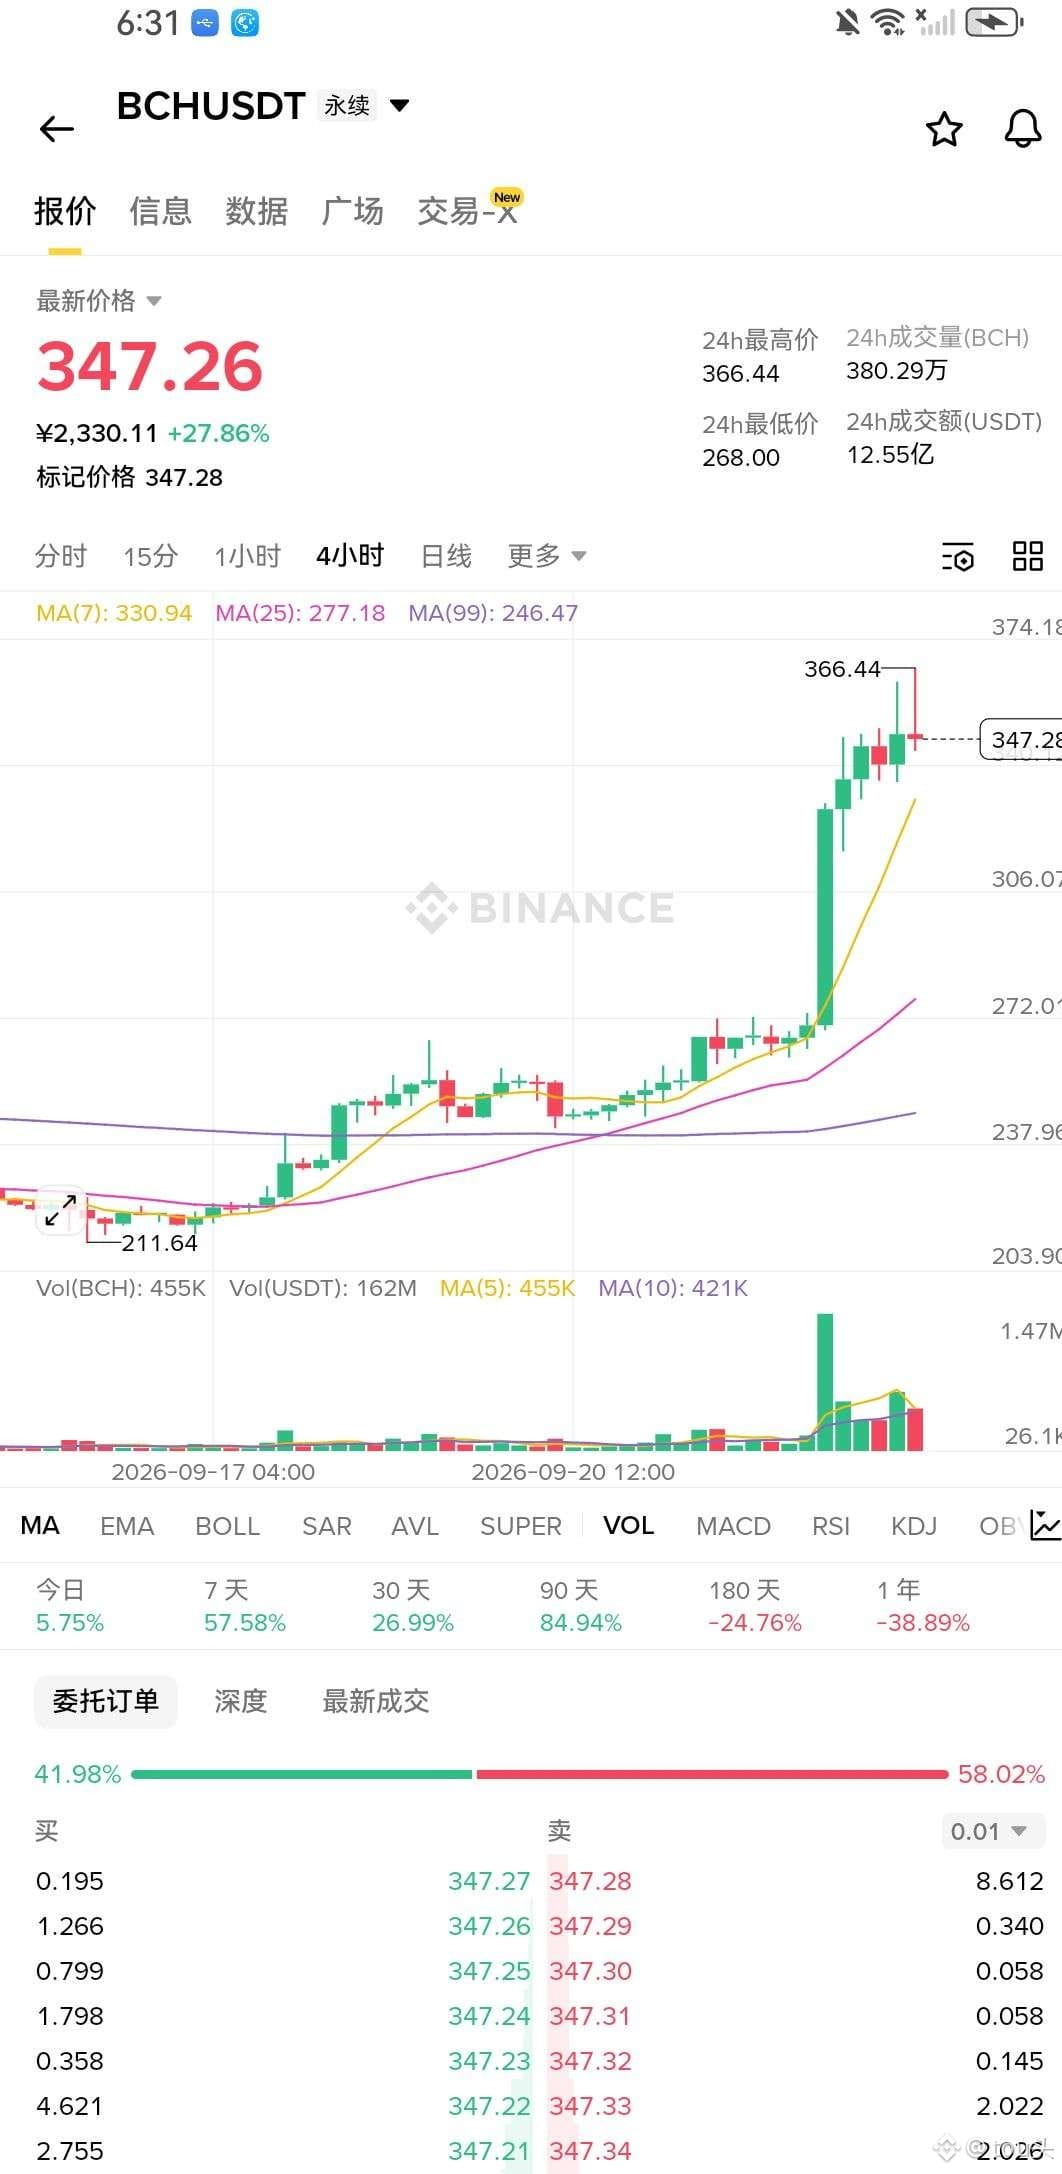
The price has just retreated a notch from its recent high, yet at the same time, perpetual open interest has surged by over 60%. Over the last three days, the gain is already more than 36%—this isn’t a withdrawal. It’s money taking advantage of the pullback to stuff more luggage into the carriage. Spot net inflows over the past three hours have been ramped up continuously; the last twelve candles have all been net inflows. Big orders haven’t exited—if anything, they’re using the dip to pick up inventory. Funding rates are still sitting at low levels, and longs have no need to pay an overpriced “toll” to pass. The large-holder accounts’ long ratio is nearing 70%. These people aren’t here to do charity. The shorts are still treating this tiny red candle as a life preserver. I can only say: wiping your shoes on the tracks—headlights are basically in your face, and you’re still thinking about which shoe polish to buy.
The price has just retreated a notch from its recent high, yet at the same time, perpetual open interest has surged by over 60%. Over the last three days, the gain is already more than 36%—this isn’t a withdrawal. It’s money taking advantage of the pullback to stuff more luggage into the carriage. Spot net inflows over the past three hours have been ramped up continuously; the last twelve candles have all been net inflows. Big orders haven’t exited—if anything, they’re using the dip to pick up inventory. Funding rates are still sitting at low levels, and longs have no need to pay an overpriced “toll” to pass. The large-holder accounts’ long ratio is nearing 70%. These people aren’t here to do charity. The shorts are still treating this tiny red candle as a life preserver. I can only say: wiping your shoes on the tracks—headlights are basically in your face, and you’re still thinking about which shoe polish to buy.
133
·
--
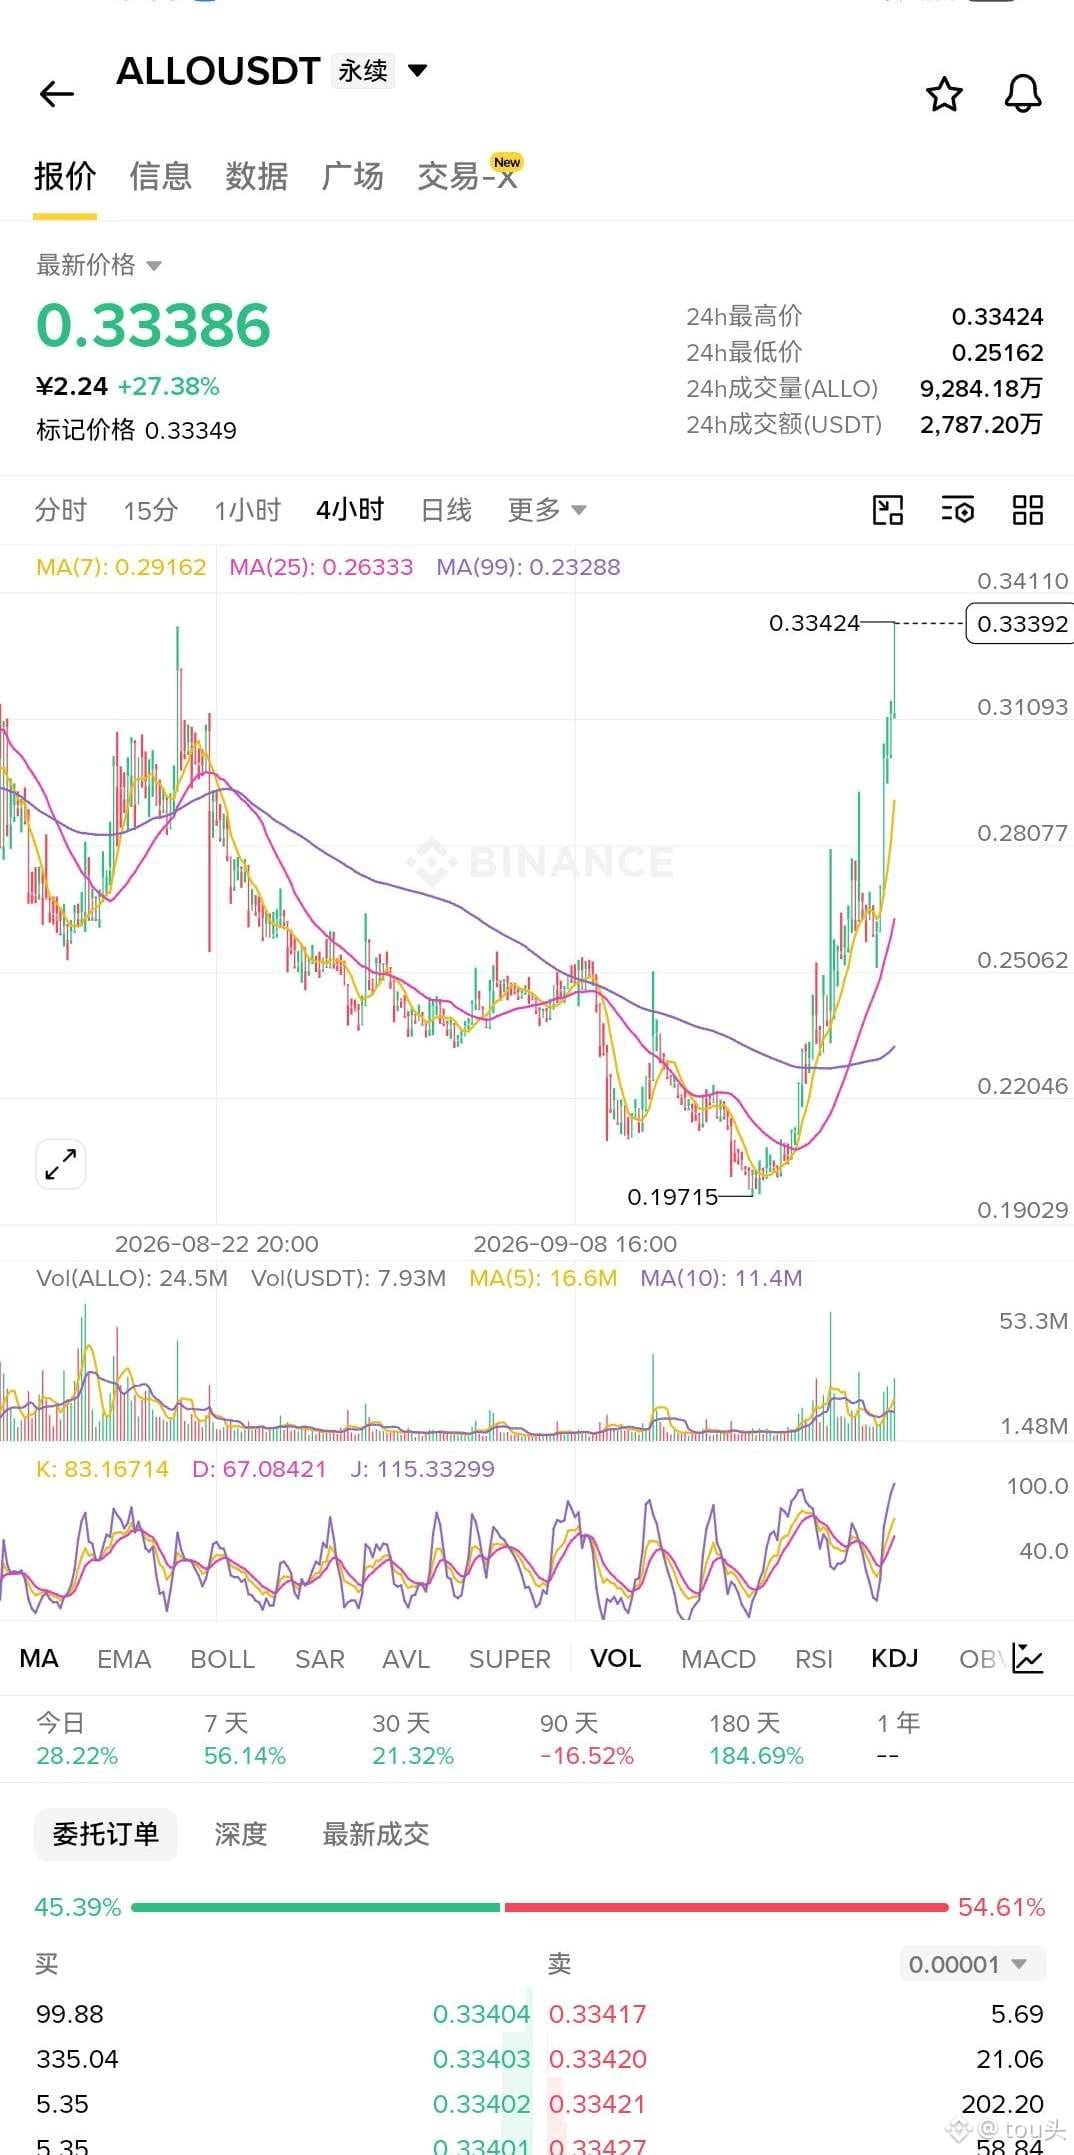
ALLO This wave isn’t a rebound—it's money openly switching hands. The perpetual holdings volume expanded by over 10% in a single day; the price is pressing upward right along the new stage highs. Volume and price move in sync—this is the real footprint of long-side adding. In the spot order book, the buy-sell spread is extremely small. Every moving average is beneath the price. The four-hour chart has been closing positive in a row, and the trend shows no sign of stopping. Shorts are waiting for a pullback? I don’t see even a chance for a retest—this little flame doesn’t give any.
ALLO This wave isn’t a rebound—it's money openly switching hands. The perpetual holdings volume expanded by over 10% in a single day; the price is pressing upward right along the new stage highs. Volume and price move in sync—this is the real footprint of long-side adding. In the spot order book, the buy-sell spread is extremely small. Every moving average is beneath the price. The four-hour chart has been closing positive in a row, and the trend shows no sign of stopping. Shorts are waiting for a pullback? I don’t see even a chance for a retest—this little flame doesn’t give any.
18
·
--
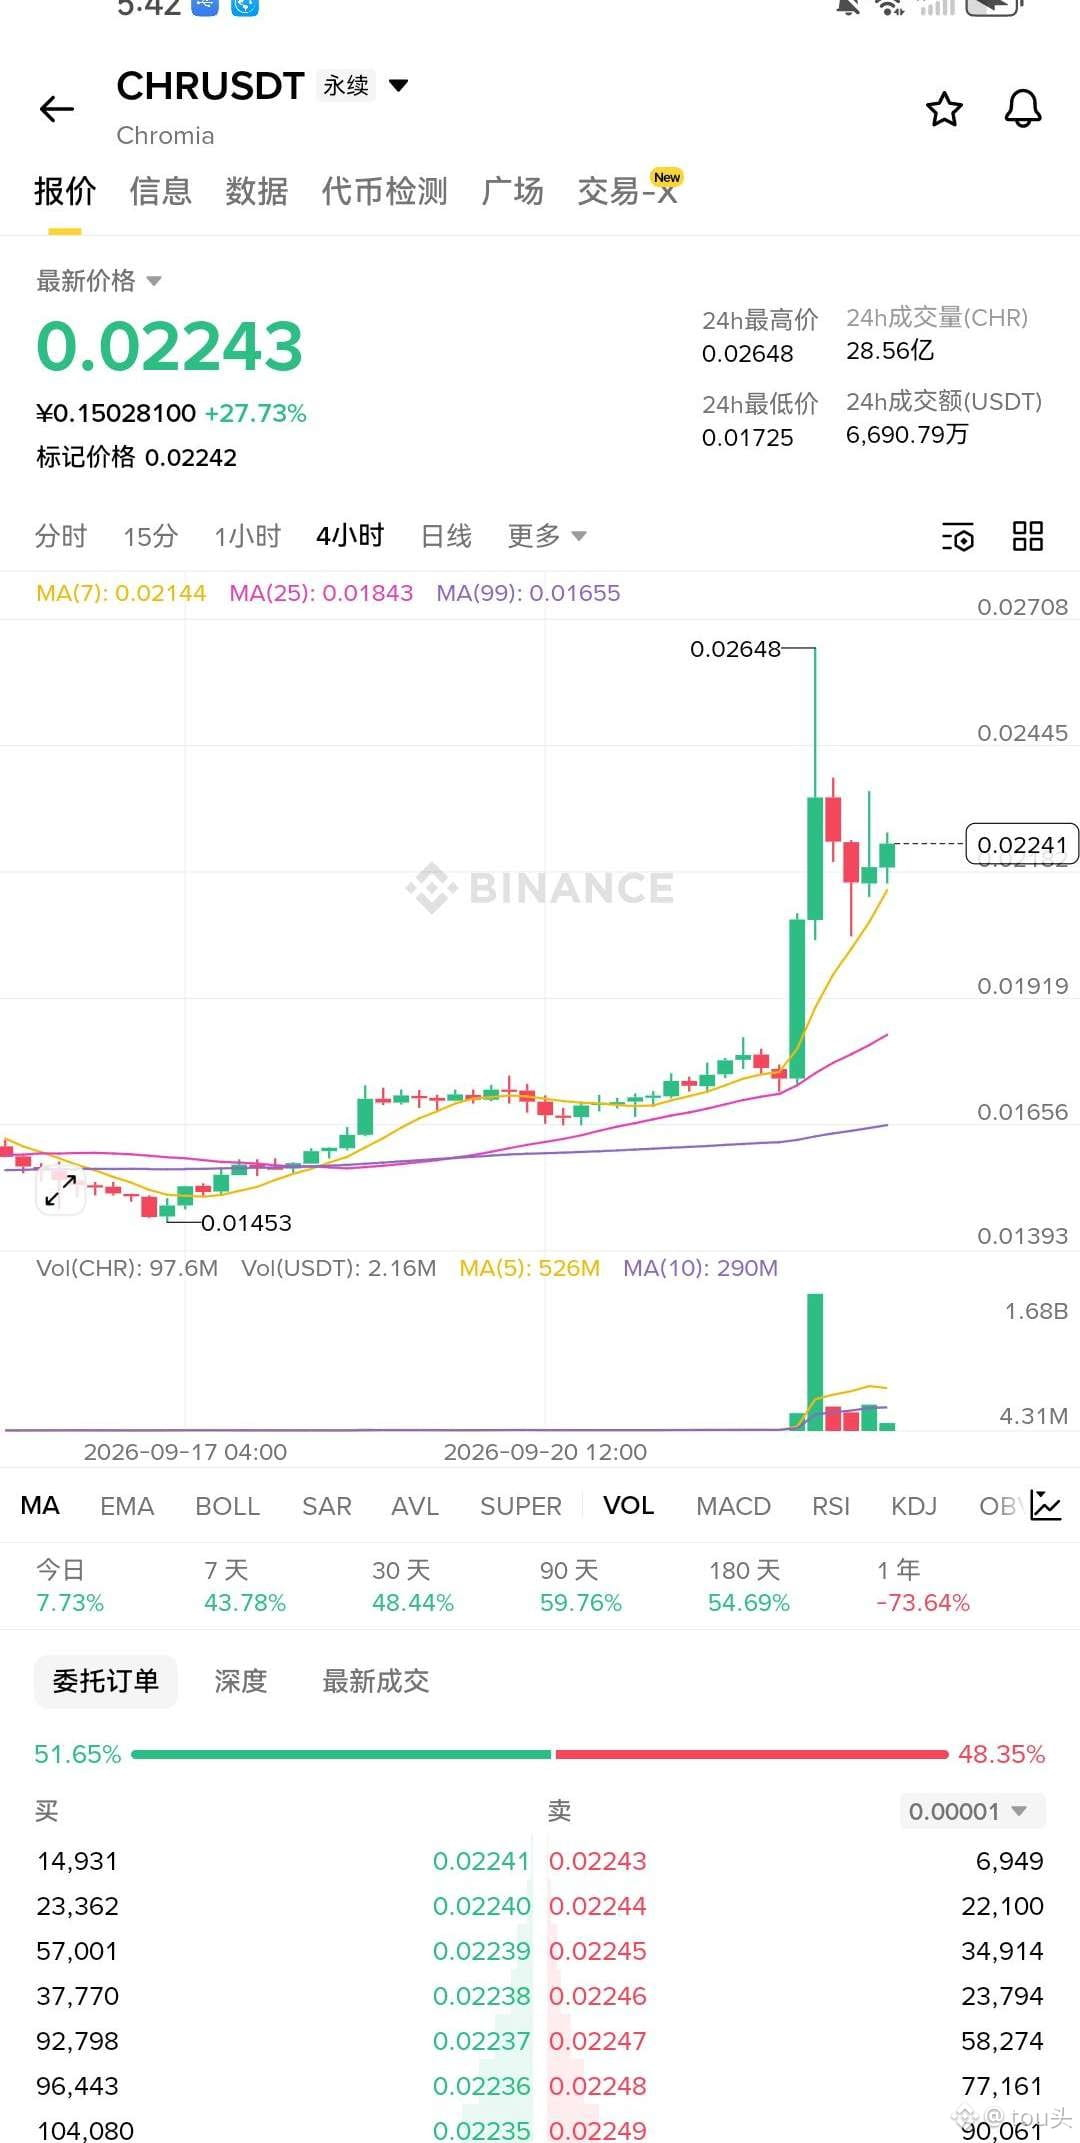
#CHR funds have already voted with their feet——the spot market has seen net inflows of over 180 million in the past three hours, and not a single candle in twelve straight K-lines has been negative. Big orders have been buying the entire time, while retail investors are still hesitating—what are you waiting for? The price is only pulling back slightly from a high point within the phase; the moving averages are all below your feet, and the bullish alignment is clear. In a situation like this, if you don’t move in with the trend, when will you? Don’t wait until the rocket actually takes off to think about buying a ticket.
#CHR funds have already voted with their feet——the spot market has seen net inflows of over 180 million in the past three hours, and not a single candle in twelve straight K-lines has been negative. Big orders have been buying the entire time, while retail investors are still hesitating—what are you waiting for? The price is only pulling back slightly from a high point within the phase; the moving averages are all below your feet, and the bullish alignment is clear. In a situation like this, if you don’t move in with the trend, when will you? Don’t wait until the rocket actually takes off to think about buying a ticket.
44
·
--
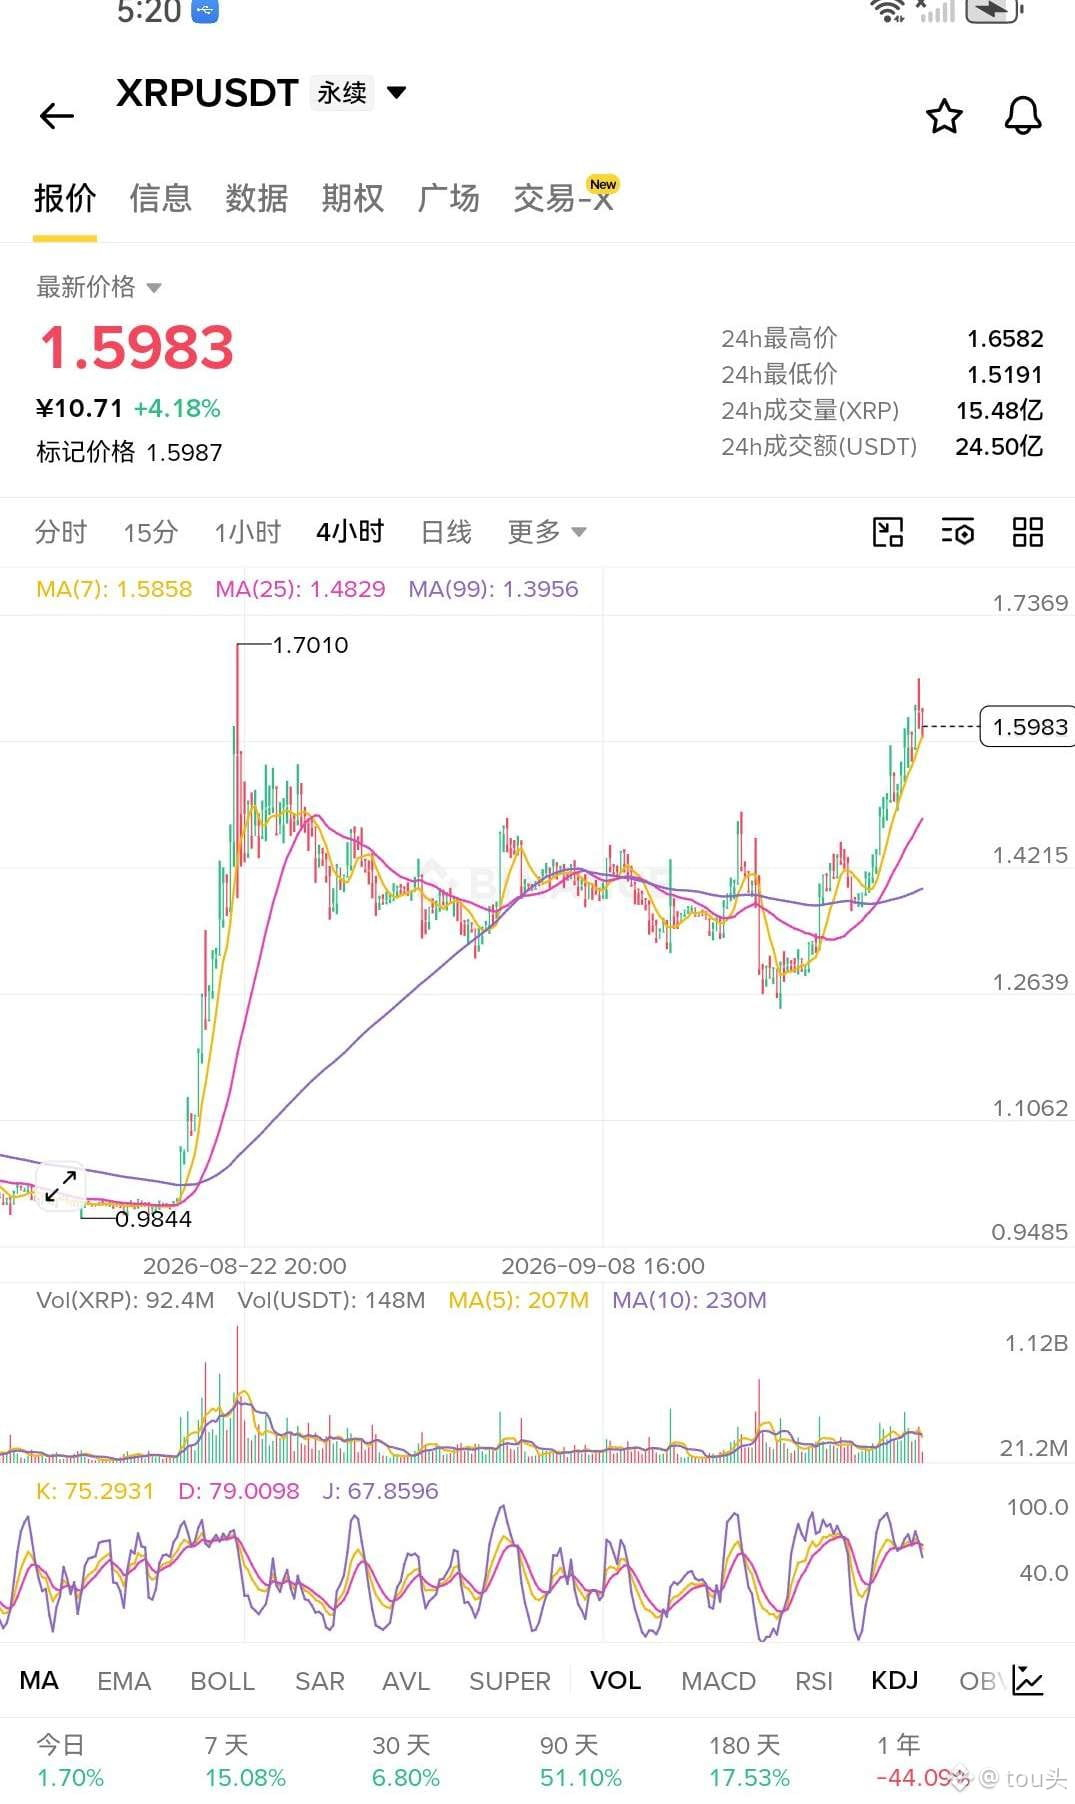
Now you still dare to stand on the XRP side as a short—I'm truly impressed by their nerve. The price surged toward the stage high and then pulled back, but the dip isn't that deep; meanwhile, open interest in perpetual contracts is still trending upward. Even when shorts add more, they can’t suppress the longs taking the bids—this market clearly looks like a pullback that’s flushing out traders, not the end of the trend. Look at spot next: over the past three hours, net inflows have stayed consistently in the green. Even though large orders have seen some outflows, it hasn’t disrupted the overall rhythm of continuous capital entering. On the leveraged lending side, it’s actually decreasing, which suggests the bulls aren’t getting addicted to buying and borrowing money to force through. The chips are cleaner than you think. I can’t say for sure about the long term, but at this position, the shorts are basically delivering ammunition to the longs.
Now you still dare to stand on the XRP side as a short—I'm truly impressed by their nerve. The price surged toward the stage high and then pulled back, but the dip isn't that deep; meanwhile, open interest in perpetual contracts is still trending upward. Even when shorts add more, they can’t suppress the longs taking the bids—this market clearly looks like a pullback that’s flushing out traders, not the end of the trend. Look at spot next: over the past three hours, net inflows have stayed consistently in the green. Even though large orders have seen some outflows, it hasn’t disrupted the overall rhythm of continuous capital entering. On the leveraged lending side, it’s actually decreasing, which suggests the bulls aren’t getting addicted to buying and borrowing money to force through. The chips are cleaner than you think. I can’t say for sure about the long term, but at this position, the shorts are basically delivering ammunition to the longs.
59
·
--
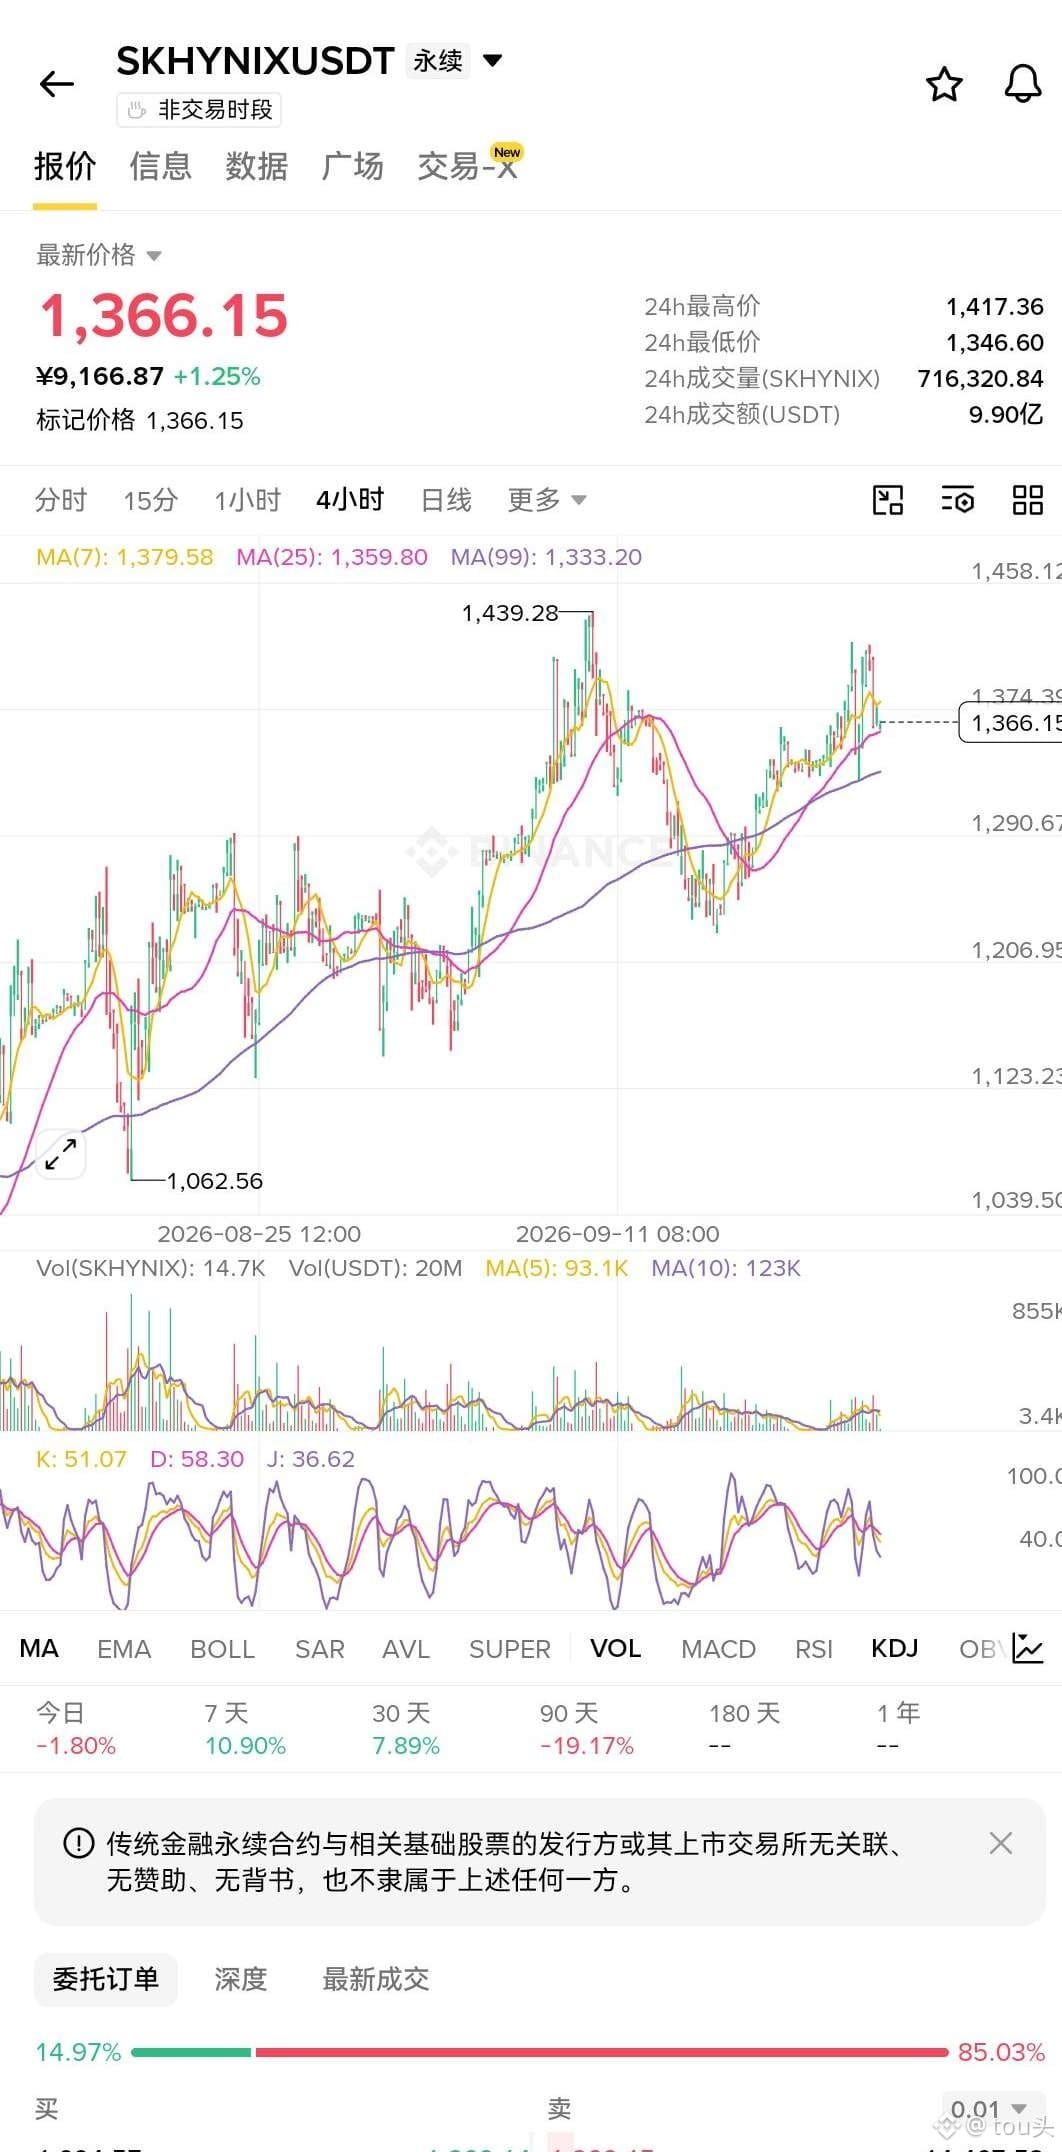
This market screen was slapped right in my face—so there really are people bold enough to stand short in this spot? They proactively bought and took up 60% of the book; the buy volume is nearly 1.6 times the sell volume. New positions are still following in as they come—money is voting with its feet, not its mouth. Over on the large-player side, the long positions are almost 80%; in just seven hours they expanded another 15%. These people haven’t fled—they’re adding to their bets. The price is hovering just below the moving average, but the four-hour trend direction hasn’t broken. Pullbacks are just an opportunity to get on board, not something meant to help you short. What are the shorts waiting for a deep drop for? What they’ll get is only a slow grind upward, step by step.
This market screen was slapped right in my face—so there really are people bold enough to stand short in this spot? They proactively bought and took up 60% of the book; the buy volume is nearly 1.6 times the sell volume. New positions are still following in as they come—money is voting with its feet, not its mouth. Over on the large-player side, the long positions are almost 80%; in just seven hours they expanded another 15%. These people haven’t fled—they’re adding to their bets. The price is hovering just below the moving average, but the four-hour trend direction hasn’t broken. Pullbacks are just an opportunity to get on board, not something meant to help you short. What are the shorts waiting for a deep drop for? What they’ll get is only a slow grind upward, step by step.
·
--
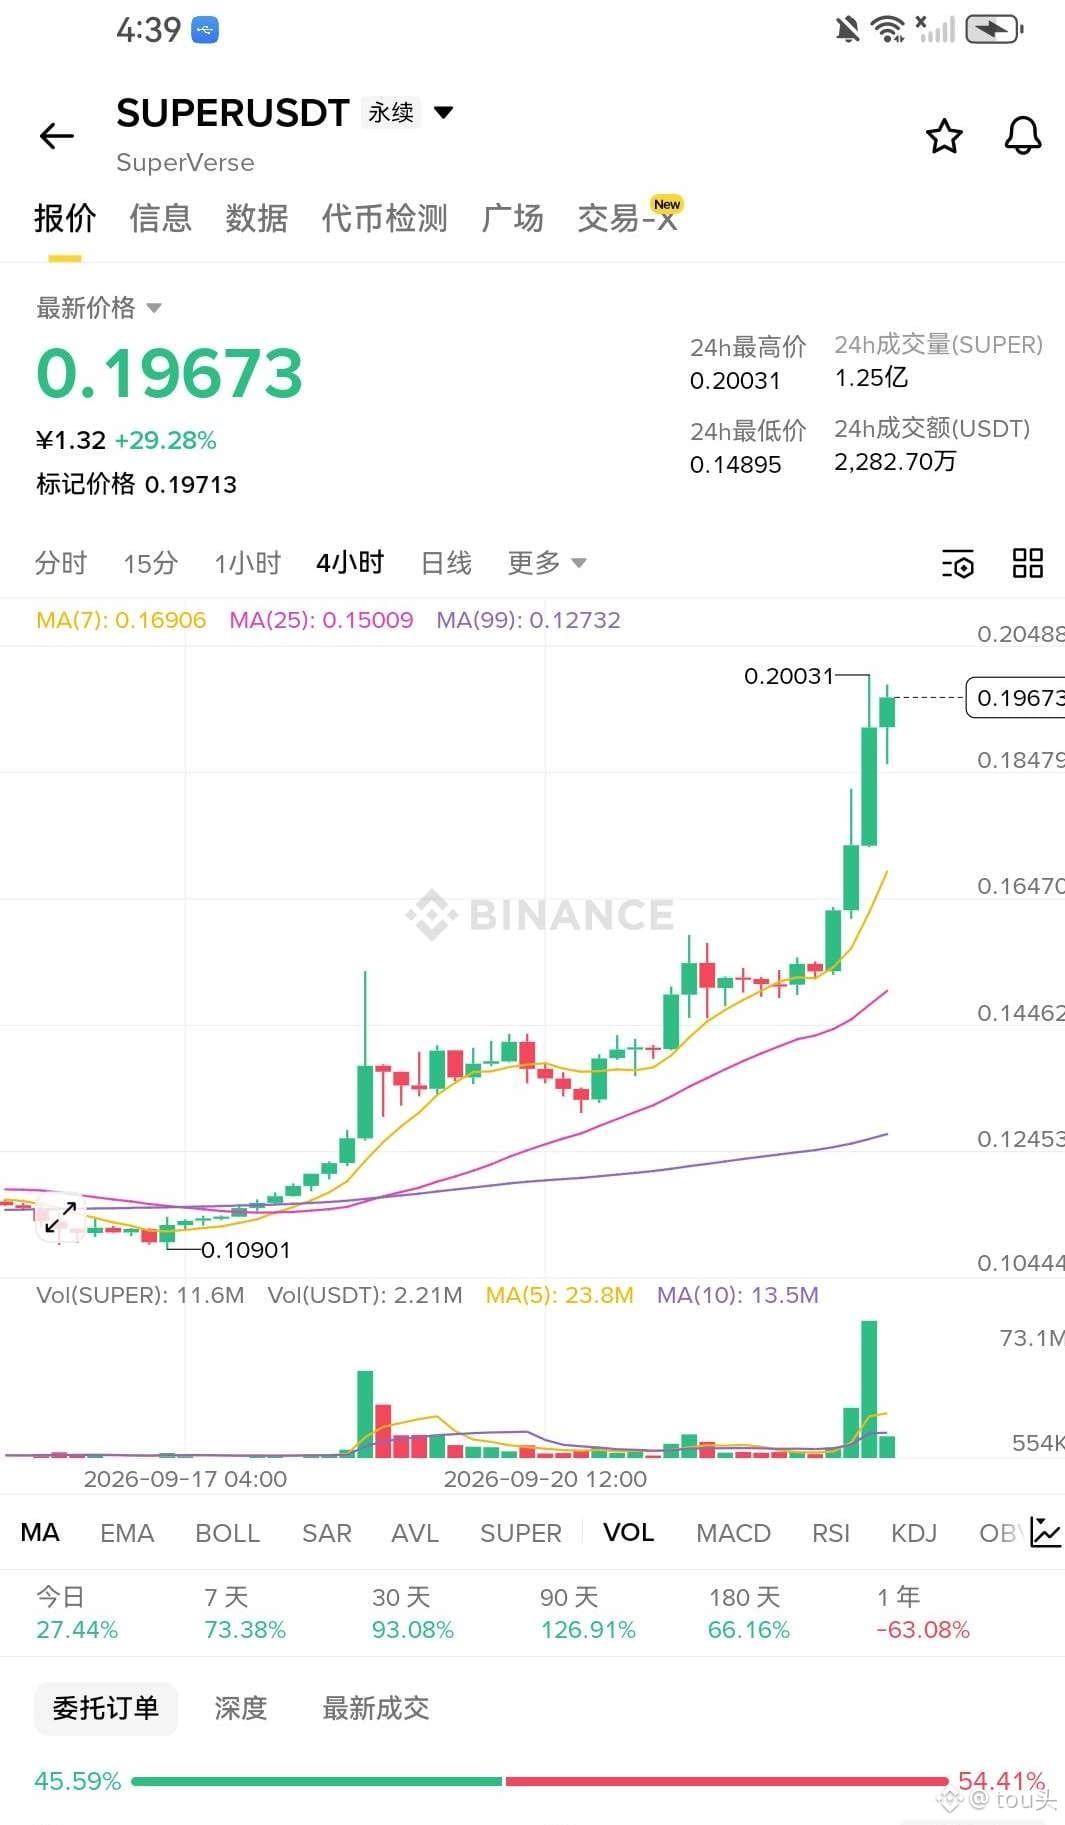
SUPER order book buy orders are incredibly thick—depth ratios have been doubling quickly. Large orders’ buy/sell share is pushing above 60%. In the short term, net inflow from large orders is nearly 200,000. When you dump it, what you hit is all buyers ready to take it. Spot capital has had a net inflow of over 7 million in nearly three hours, and none of the twelve “pillars” is down. Large orders have been steadily bought up all the way. This buying is as tight as a fortress—don’t wait for a pullback; a pullback is just a way to hand out shares to those who miss the move.
SUPER order book buy orders are incredibly thick—depth ratios have been doubling quickly. Large orders’ buy/sell share is pushing above 60%. In the short term, net inflow from large orders is nearly 200,000. When you dump it, what you hit is all buyers ready to take it. Spot capital has had a net inflow of over 7 million in nearly three hours, and none of the twelve “pillars” is down. Large orders have been steadily bought up all the way. This buying is as tight as a fortress—don’t wait for a pullback; a pullback is just a way to hand out shares to those who miss the move.
44
·
--
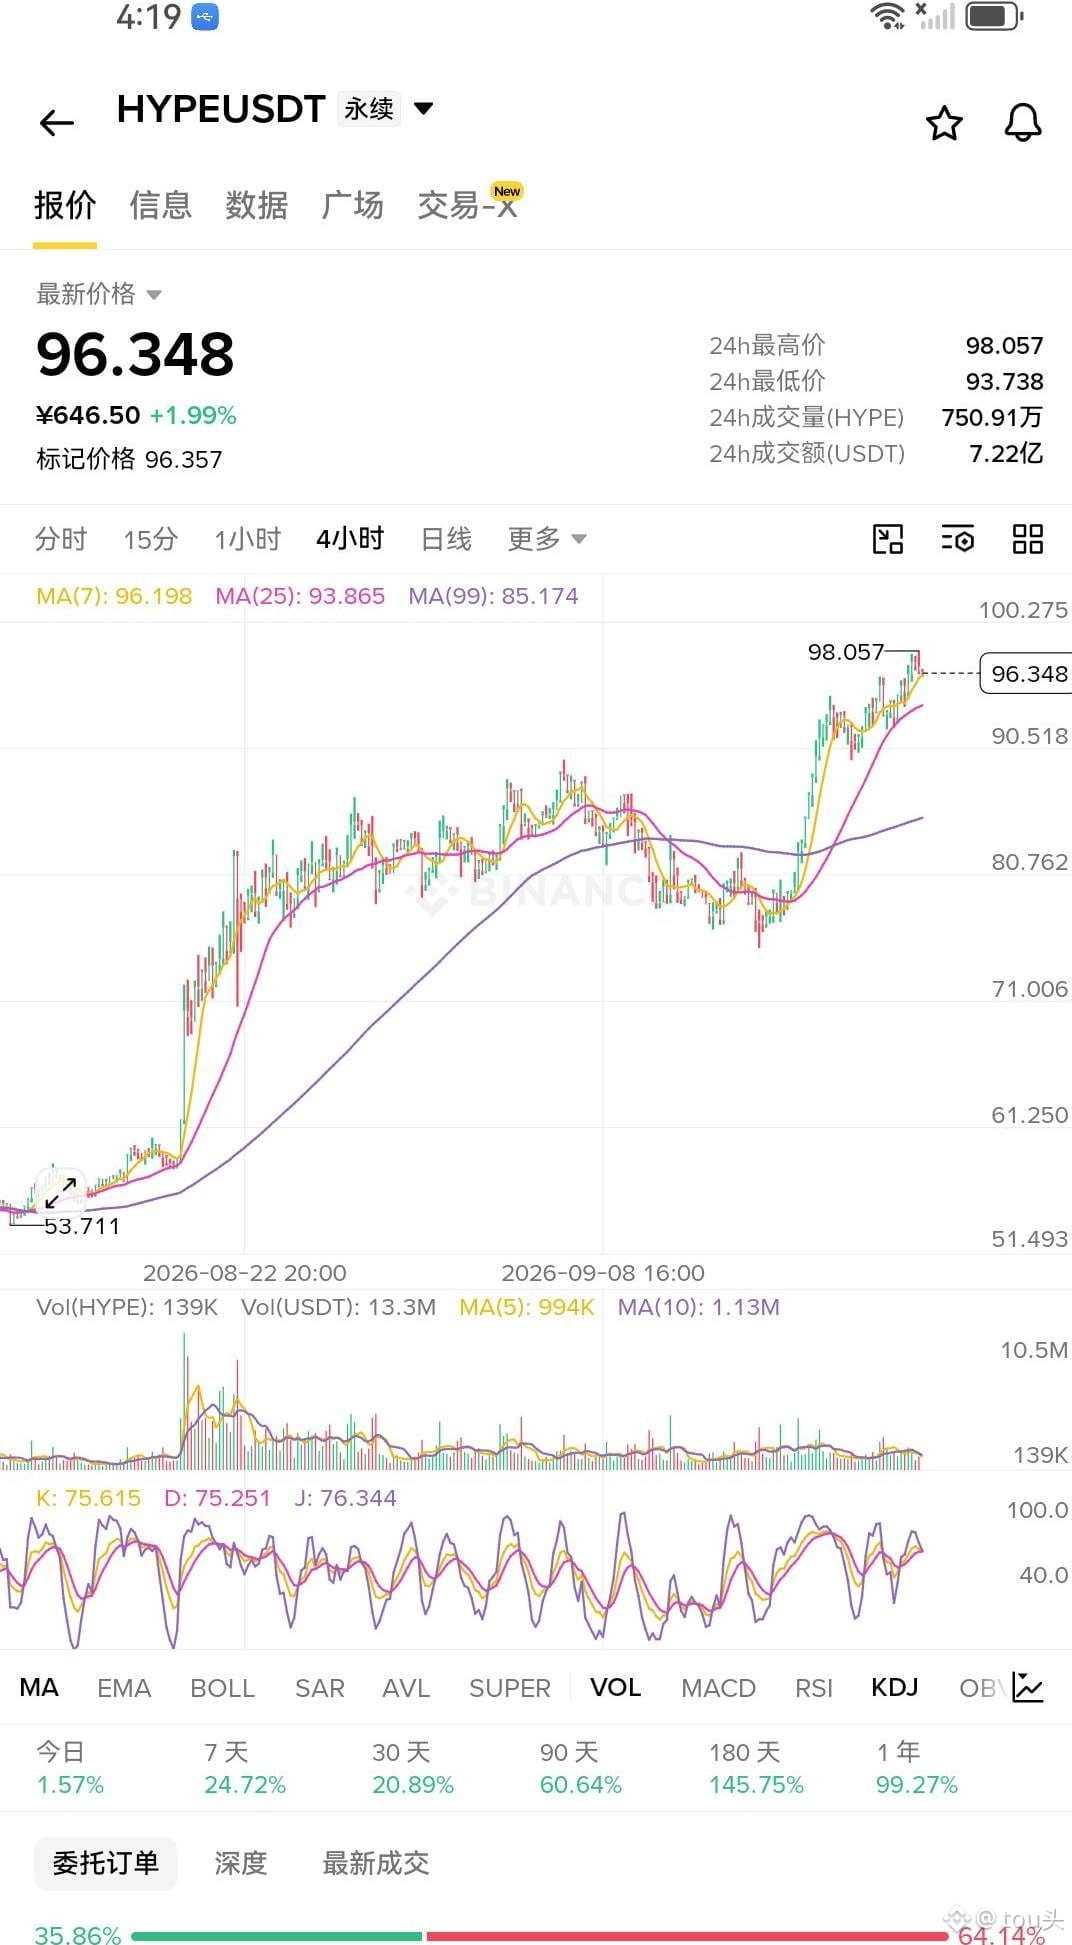
#HYPE Buy orders have already started accelerating into the market. The taker (buyer) share is 53%, and the成交 increase over 7 hours is 23.65%—this isn’t consolidation; it’s funds stacking up for the long side. Price is consolidating just below the 98.06 prior high; the structure hasn’t broken at all. The 4-hour period has six consecutive bullish sessions supporting it, and both spot and futures are moving up together. A pullback is your chance to get on board. Enter directly around 96.3. First target: 100.5. If it holds, then look for 103. Place the stop loss at 92.1; if it breaks down, the structure is broken—don’t get hung up. Don’t wait for it to break out before you chase higher; otherwise there won’t be any profit to take.
#HYPE Buy orders have already started accelerating into the market. The taker (buyer) share is 53%, and the成交 increase over 7 hours is 23.65%—this isn’t consolidation; it’s funds stacking up for the long side. Price is consolidating just below the 98.06 prior high; the structure hasn’t broken at all. The 4-hour period has six consecutive bullish sessions supporting it, and both spot and futures are moving up together. A pullback is your chance to get on board. Enter directly around 96.3. First target: 100.5. If it holds, then look for 103. Place the stop loss at 92.1; if it breaks down, the structure is broken—don’t get hung up. Don’t wait for it to break out before you chase higher; otherwise there won’t be any profit to take.
59
·
--
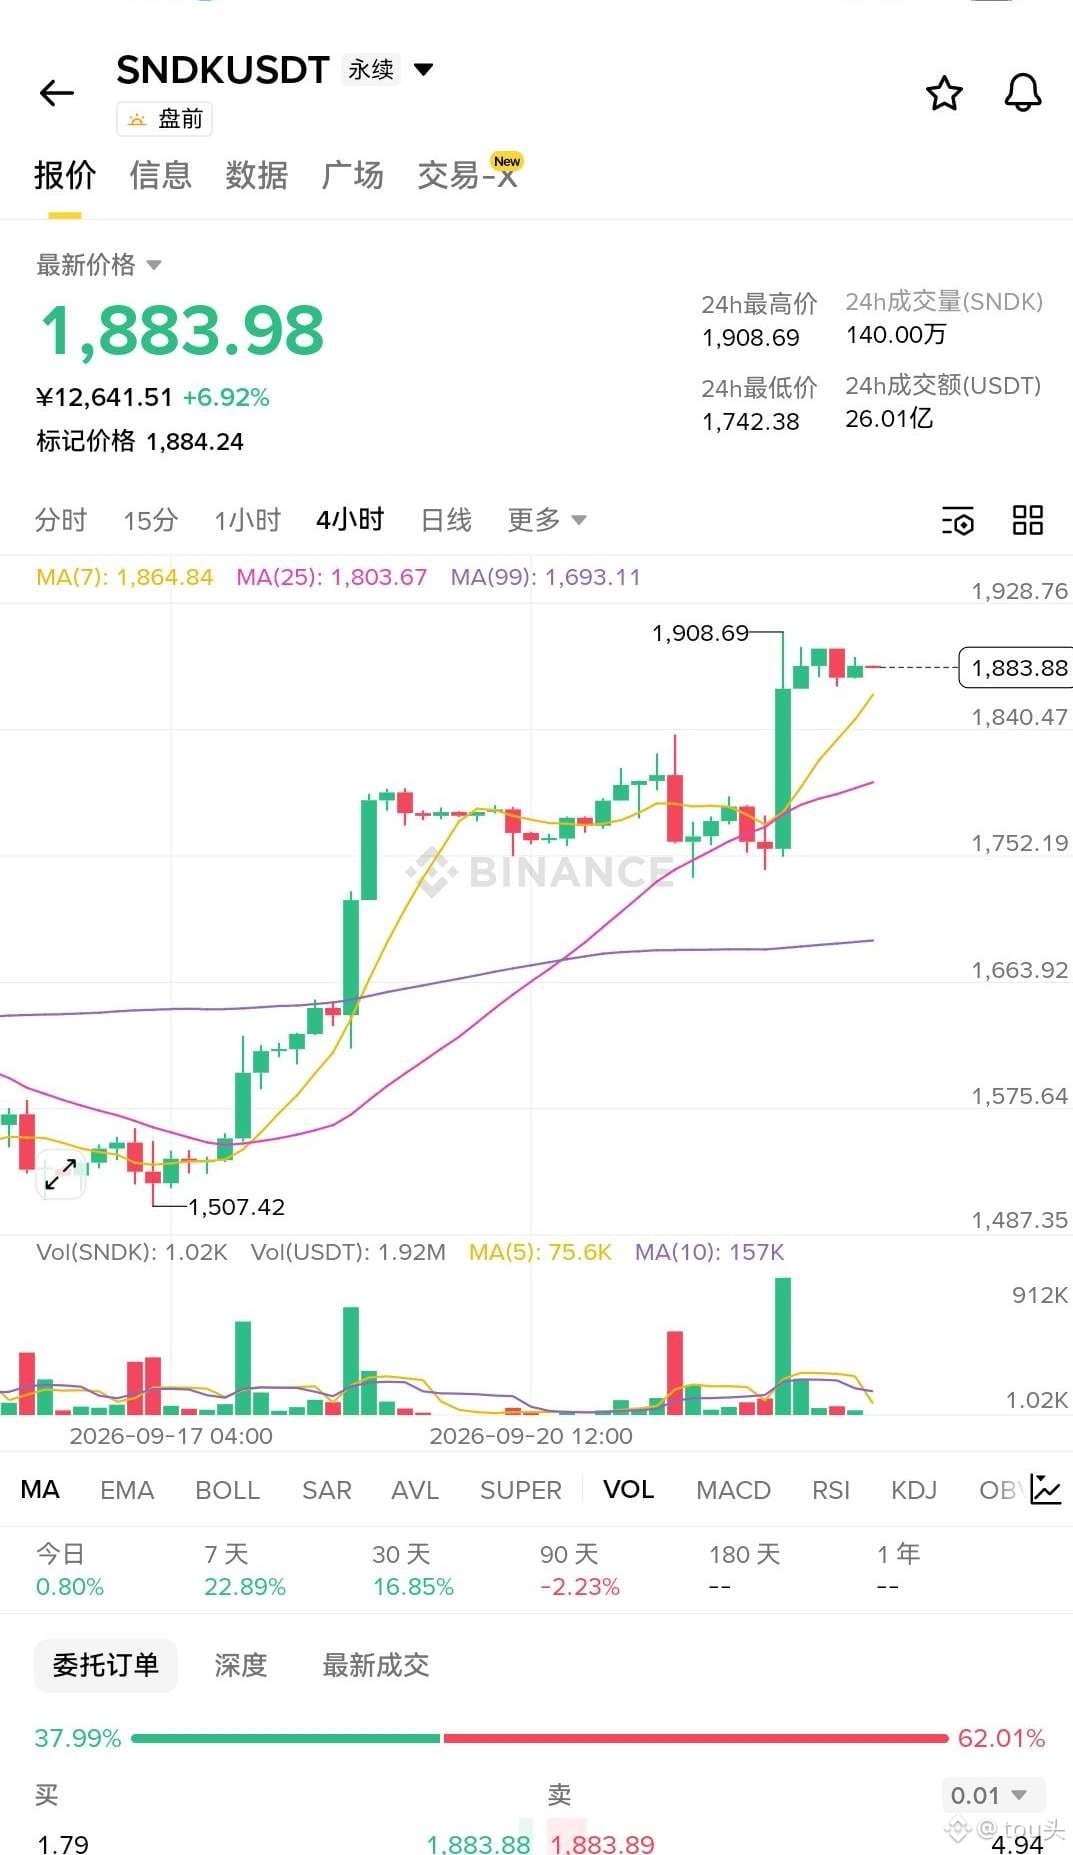
SNDK This order book is as obvious as it gets—it's basically a rigged show. Prices are inching up while buy-side order share is below 40% for four straight days; sell orders directly crush through it. The long-versus-short situation is so grim that the bulls are all just waiting to become bag holders—their capital is simply hoping others will pick up the tab. The position size doesn’t look crushed; that’s because the operator hasn’t dumped all the inventory yet. Not a single spot big order has come in—it's being propped up with nothing but air to lure retail traders. The dog operator has clearly set higher prices to hook the longs; once the leveraged positions are piled up enough, it’ll be a waterfall liquidation. Smart money has already been撤ing (leaving). Don’t get lucky—enter at this price and you’re basically handing over a year-end bonus. If you go short, just wait for that explosive bearish candle to hit.
SNDK This order book is as obvious as it gets—it's basically a rigged show. Prices are inching up while buy-side order share is below 40% for four straight days; sell orders directly crush through it. The long-versus-short situation is so grim that the bulls are all just waiting to become bag holders—their capital is simply hoping others will pick up the tab. The position size doesn’t look crushed; that’s because the operator hasn’t dumped all the inventory yet. Not a single spot big order has come in—it's being propped up with nothing but air to lure retail traders. The dog operator has clearly set higher prices to hook the longs; once the leveraged positions are piled up enough, it’ll be a waterfall liquidation. Smart money has already been撤ing (leaving). Don’t get lucky—enter at this price and you’re basically handing over a year-end bonus. If you go short, just wait for that explosive bearish candle to hit.
37
·
--
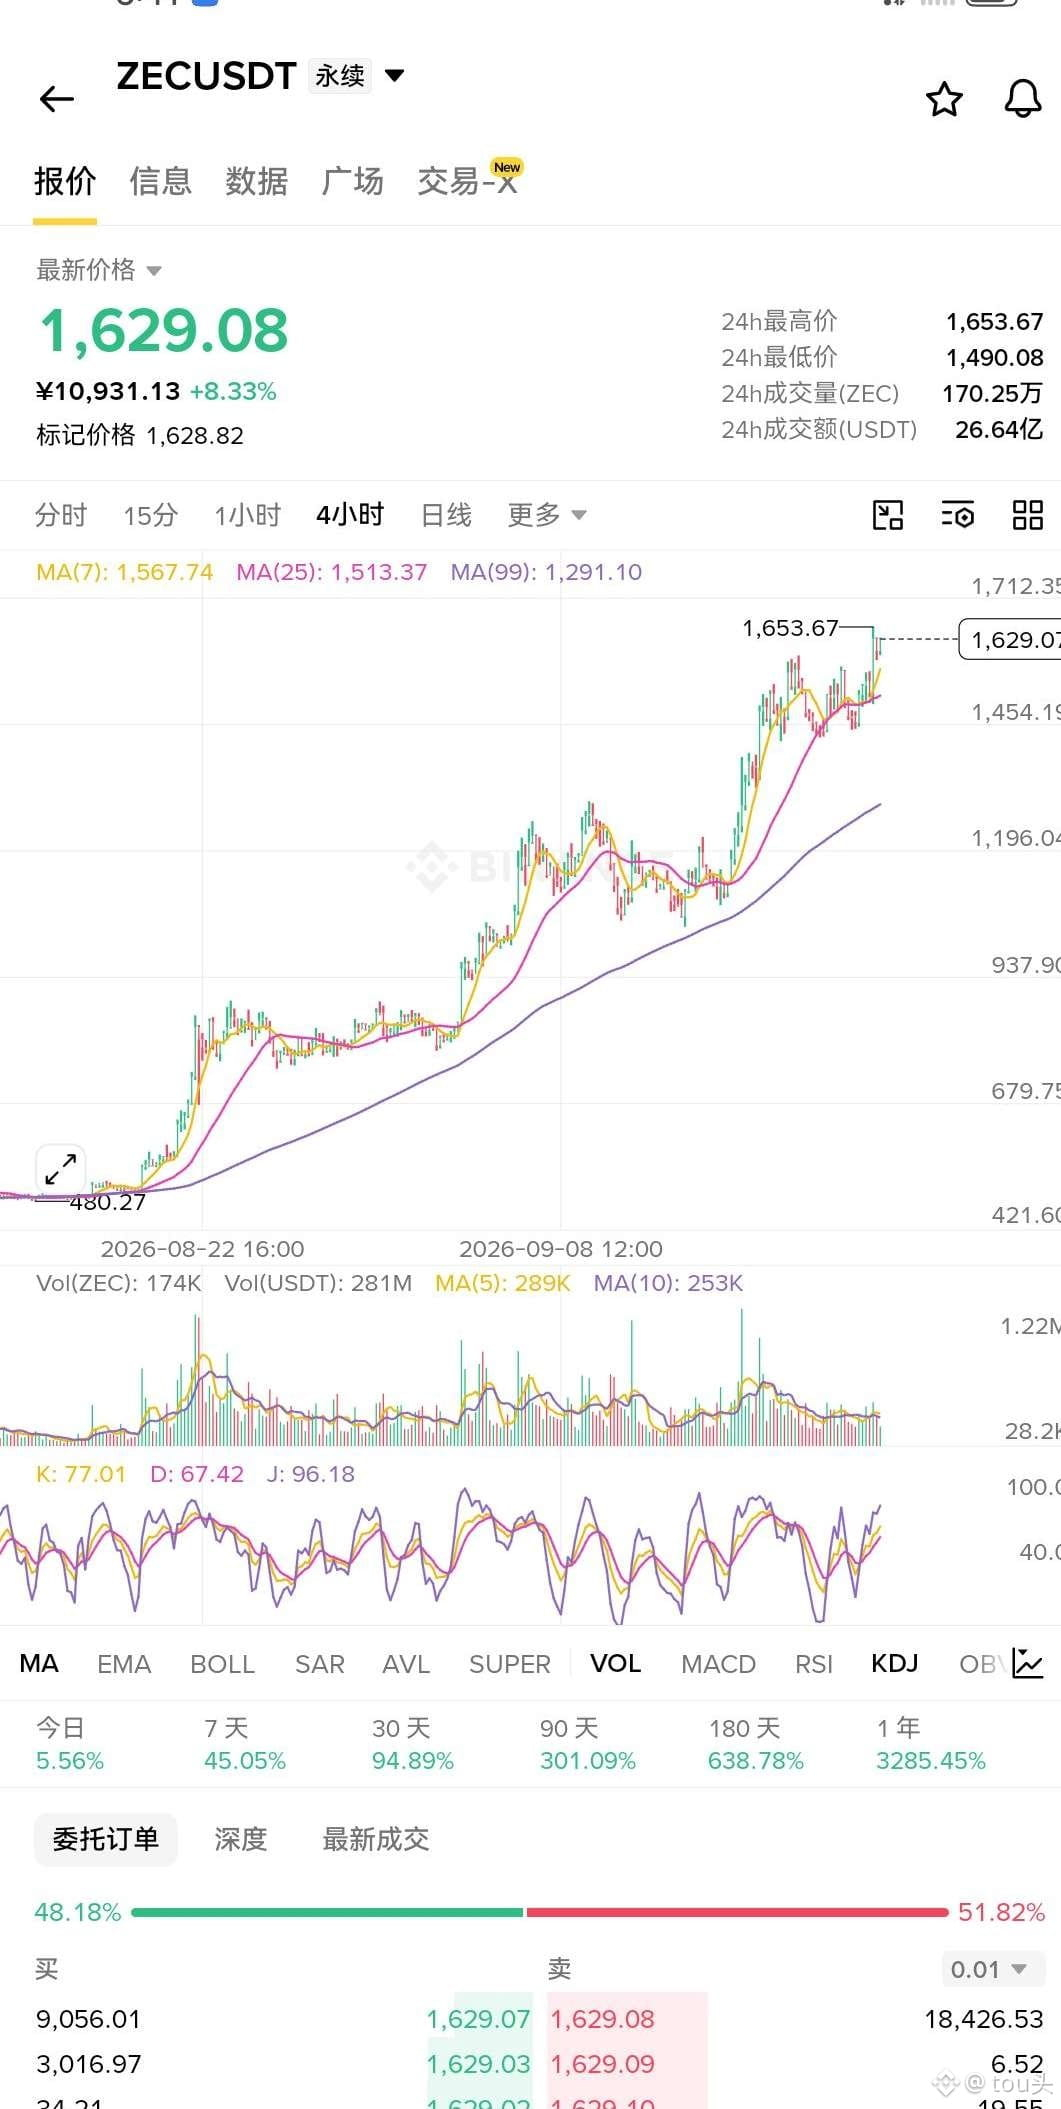
When the price was being pushed upward, the open interest expanded by nearly two tenths in a single day, and the leverage lending ratio surged by more than eighty percent—bulls are borrowing money to add positions, not just talking. All the moving averages are below your feet, and out of seven K-lines there is only one green—this spark just can’t be put out. The bears still hold on to the low from two weeks ago as their belief; I don’t blame them. After all, when you see the price crawl out of the pit, no one wants to believe otherwise. But this market has me gasping for breath. New positions are still charging in, and the spot large orders haven’t been withdrawn—who else would stand on the other side, waiting to get crushed?
When the price was being pushed upward, the open interest expanded by nearly two tenths in a single day, and the leverage lending ratio surged by more than eighty percent—bulls are borrowing money to add positions, not just talking. All the moving averages are below your feet, and out of seven K-lines there is only one green—this spark just can’t be put out. The bears still hold on to the low from two weeks ago as their belief; I don’t blame them. After all, when you see the price crawl out of the pit, no one wants to believe otherwise. But this market has me gasping for breath. New positions are still charging in, and the spot large orders haven’t been withdrawn—who else would stand on the other side, waiting to get crushed?
324
·
--
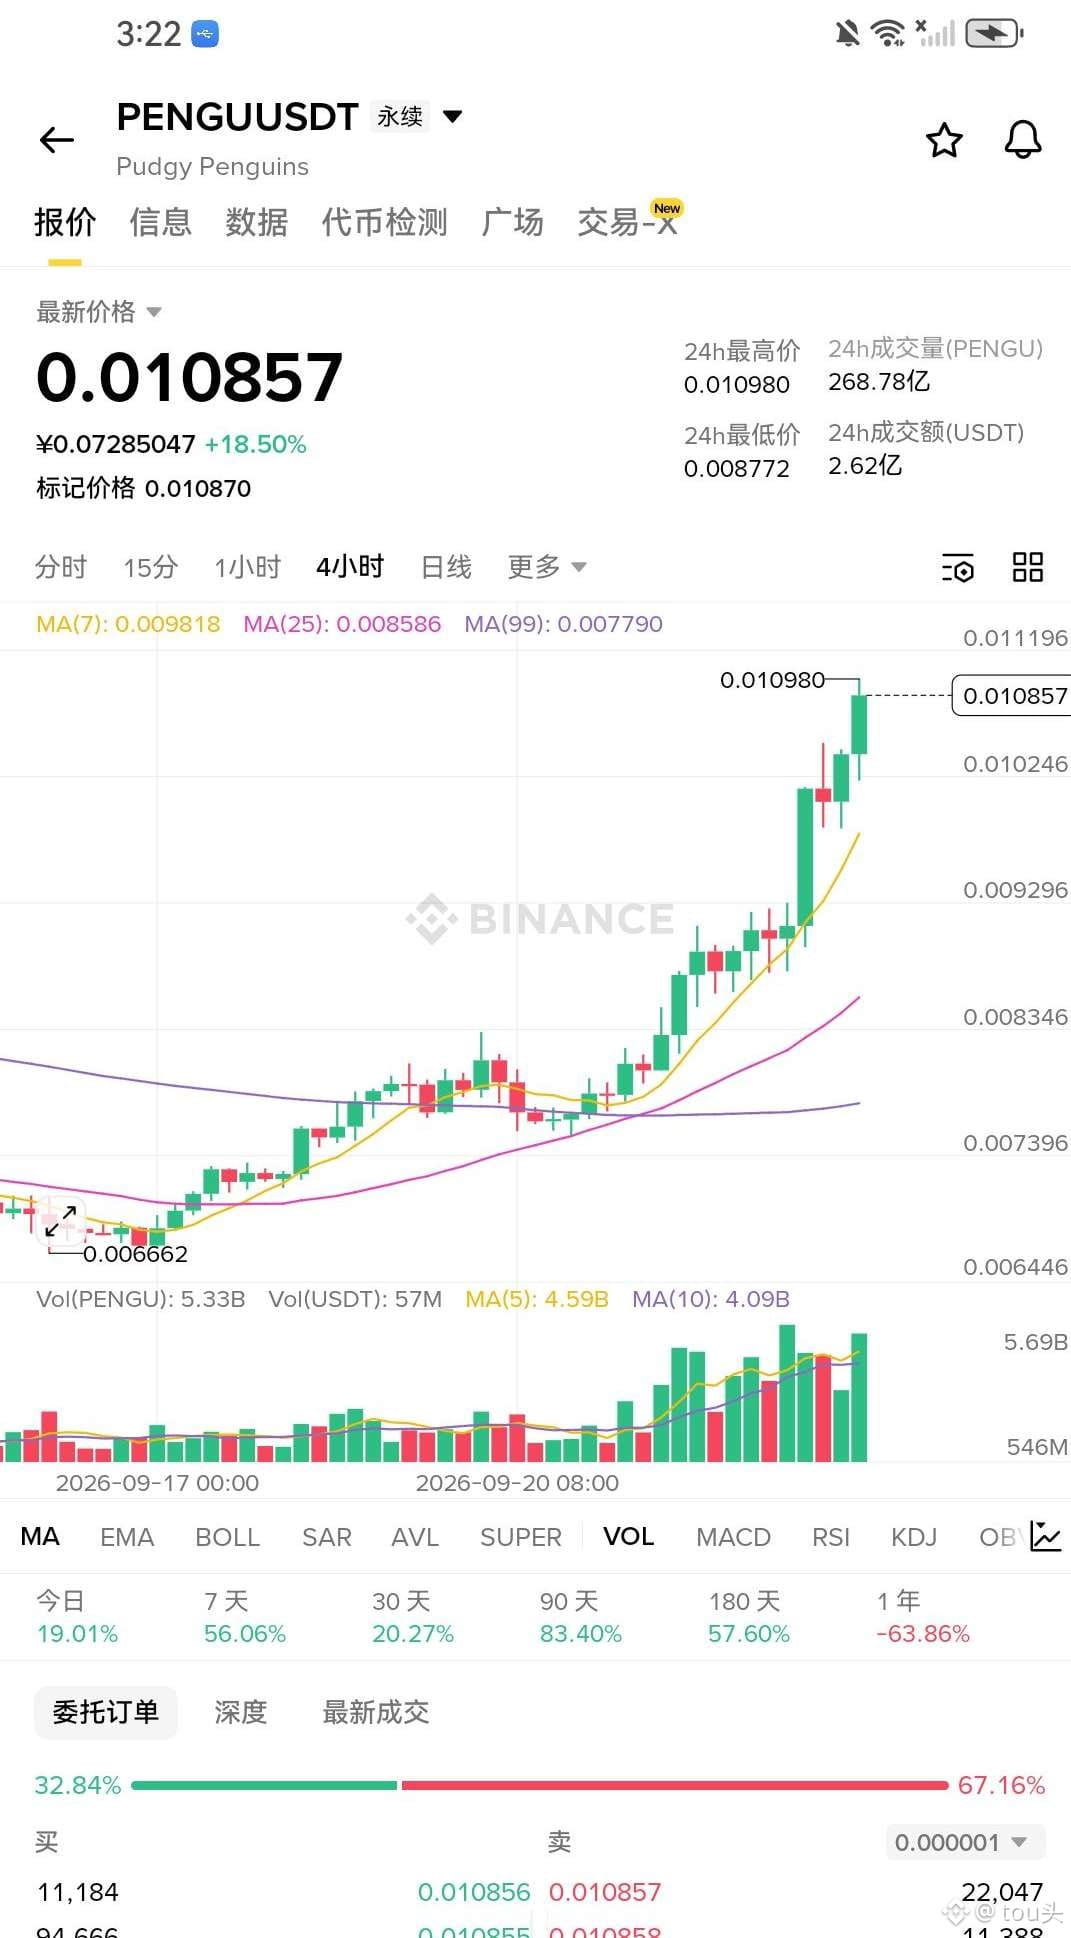
PENGU spot capital: net inflow of 5.6 billion yuan in 3 hours. There have been 12 consecutive K-lines with all positive inflows. The big orders were疯狂 buying 339 million yuan across 5 K-lines—this is what “money voting” looks like. The price has already broken above the previous high of 0.0109. It surged 6% in 4 hours and 19% in 24 hours. The funds moving in is only just getting started. Go straight to 0.0105. First target: 0.01098. Second target: 0.01146. Stop-loss: exit if it falls below 0.0099. This kind of visible growth curve, when mapped to PENGU, is solid support.
PENGU spot capital: net inflow of 5.6 billion yuan in 3 hours. There have been 12 consecutive K-lines with all positive inflows. The big orders were疯狂 buying 339 million yuan across 5 K-lines—this is what “money voting” looks like. The price has already broken above the previous high of 0.0109. It surged 6% in 4 hours and 19% in 24 hours. The funds moving in is only just getting started. Go straight to 0.0105. First target: 0.01098. Second target: 0.01146. Stop-loss: exit if it falls below 0.0099. This kind of visible growth curve, when mapped to PENGU, is solid support.
82
·
--
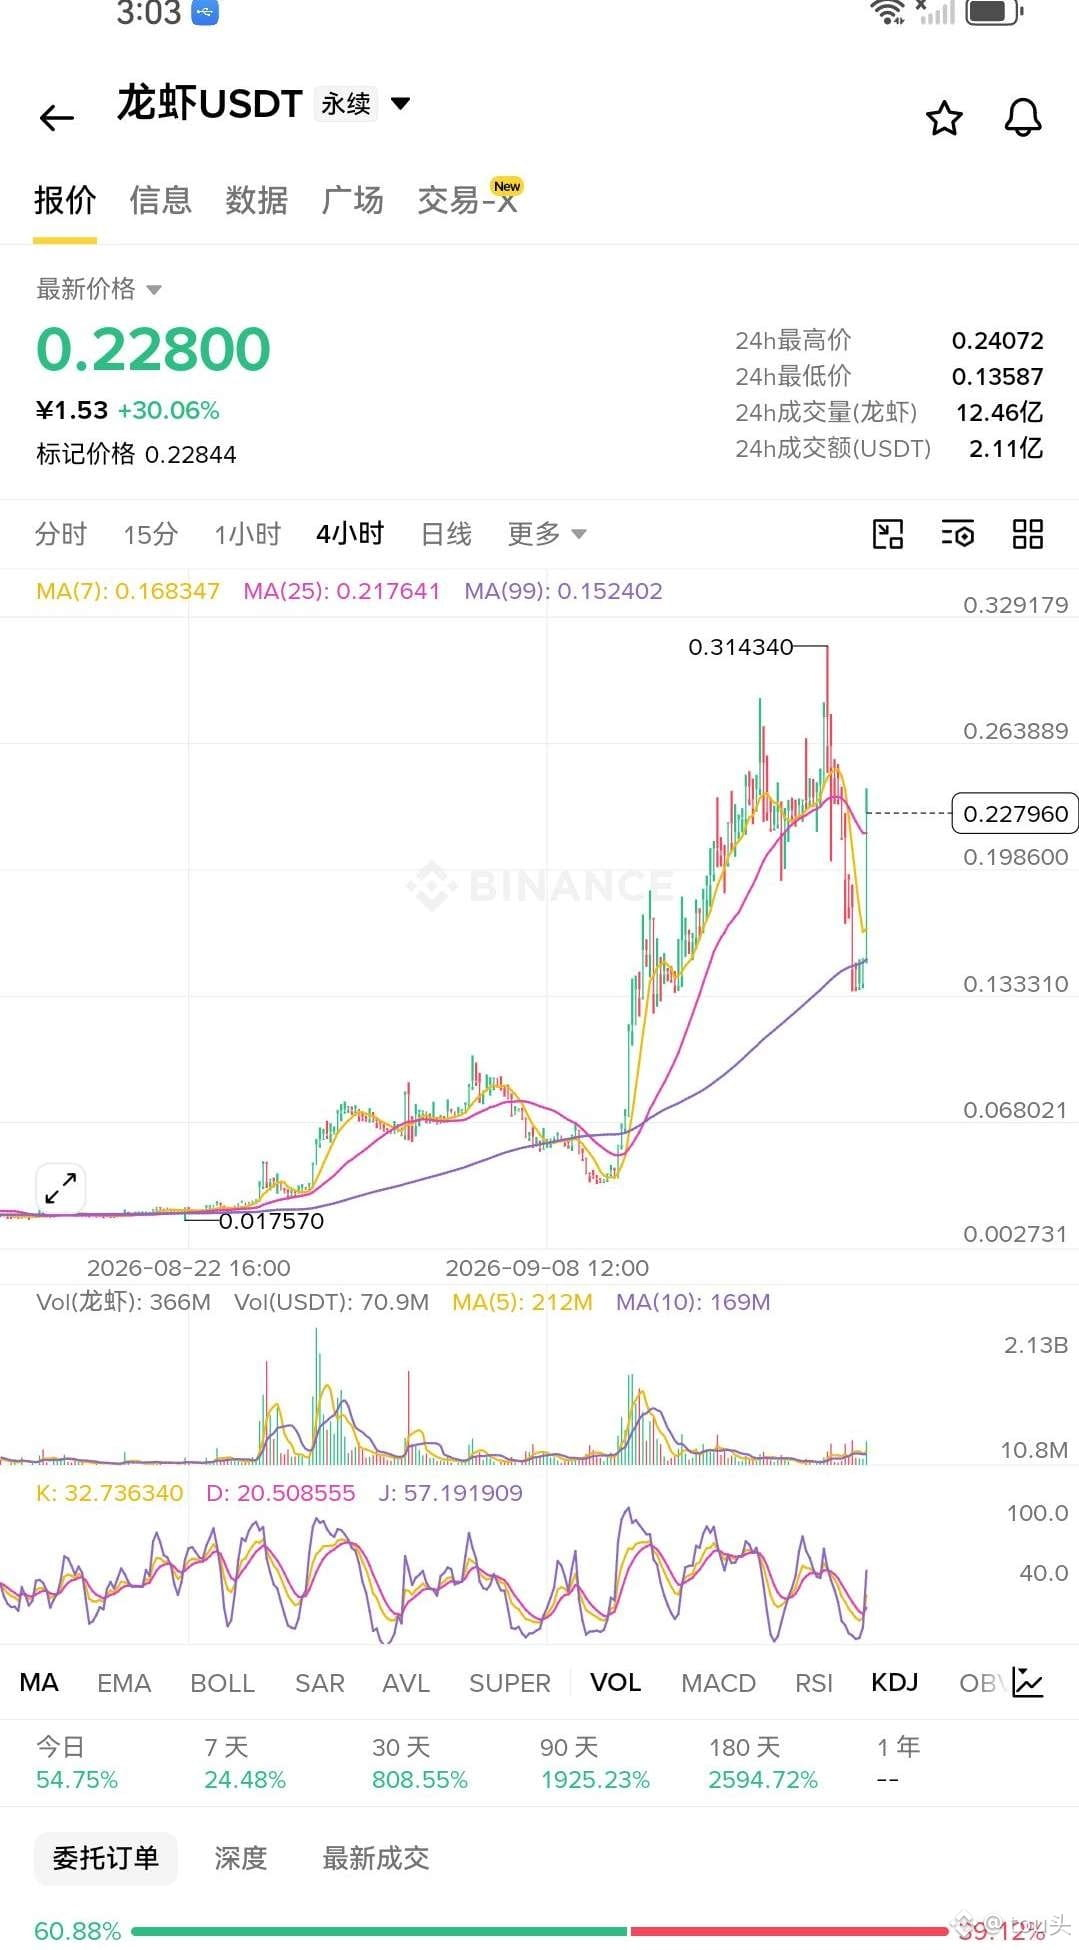
Lobsters: Big money holders have boosted their long positions to nearly 70%, yet the account still only has just over 40% long exposure. Retail investors are rushing, while the big players are pushing it up—this is the standard “lure-you-in” play. Open interest is being cut down by nearly 40% in a single day, but the price is still surging upward. It’s pure life-or-death gambling. Brothers, set your stop-loss before entering—this trade can’t be taken.
Lobsters: Big money holders have boosted their long positions to nearly 70%, yet the account still only has just over 40% long exposure. Retail investors are rushing, while the big players are pushing it up—this is the standard “lure-you-in” play. Open interest is being cut down by nearly 40% in a single day, but the price is still surging upward. It’s pure life-or-death gambling. Brothers, set your stop-loss before entering—this trade can’t be taken.
77
·
--
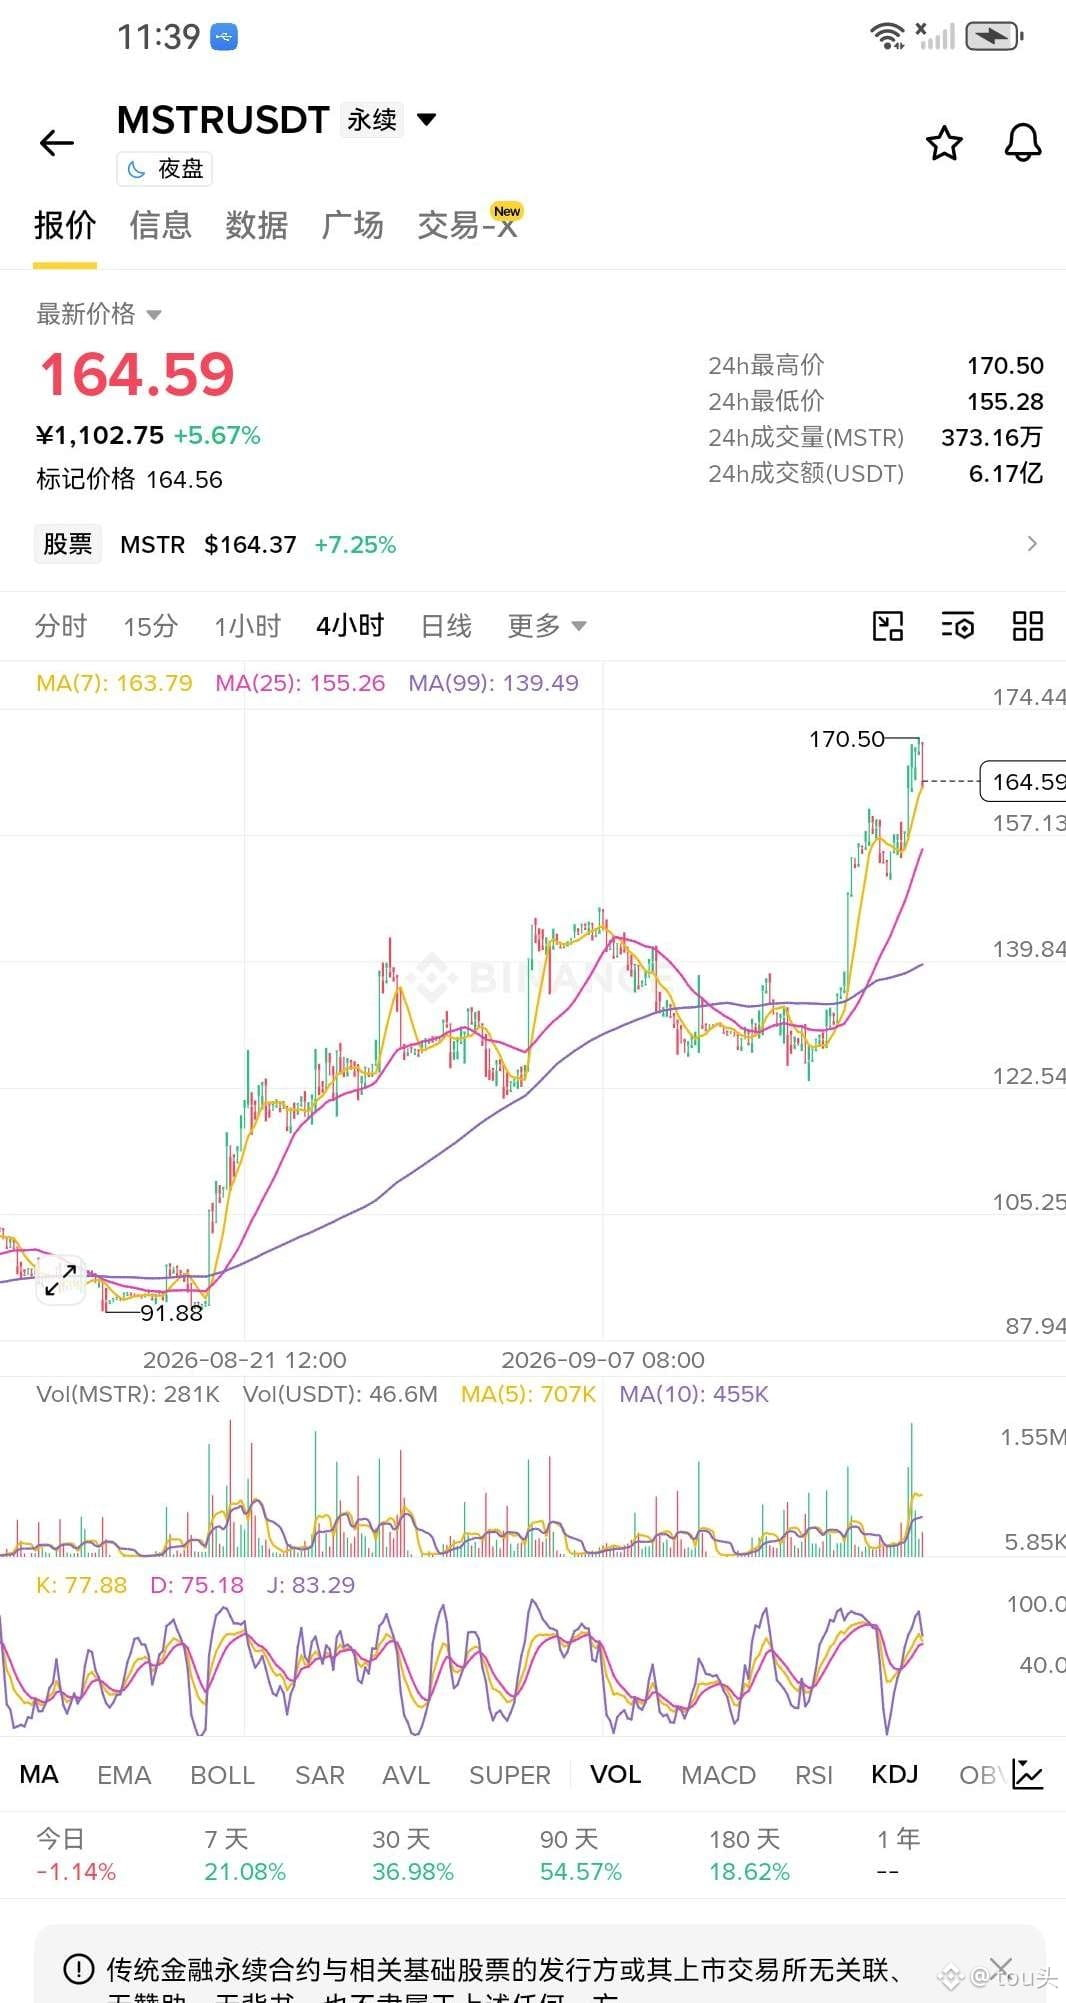
MSTR funding rate is still lying around at 0.006%, haven’t even touched the 8-hour average of 0.011%. The longs basically haven’t even gotten onto the train. This pullback to 164.5 is basically a freebie. The 4-hour structure shows five bullish candles and one bearish candle—can’t break through. The daily chart is also on the long side. If you’ve followed in, hold it. Entry at 164.5: first target 171. Once it’s pulled up and holds steady, look for 178. Stop loss at 157.5. If it breaks, admit defeat and exit; if not, hold all the way to the end. Go long!
MSTR funding rate is still lying around at 0.006%, haven’t even touched the 8-hour average of 0.011%. The longs basically haven’t even gotten onto the train. This pullback to 164.5 is basically a freebie. The 4-hour structure shows five bullish candles and one bearish candle—can’t break through. The daily chart is also on the long side. If you’ve followed in, hold it. Entry at 164.5: first target 171. Once it’s pulled up and holds steady, look for 178. Stop loss at 157.5. If it breaks, admit defeat and exit; if not, hold all the way to the end. Go long!
45
Log in to explore more content
Join global crypto users on Binance Square
⚡️ Get latest and useful information about crypto.
💬 Trusted by the world’s largest crypto exchange.
👍 Discover real insights from verified creators.
Email / Phone number
Trending Topics
AIStocksWhatNext
704,470 views
5,258 Discussing
Share & Win Traffic Reward in our Trending Hashtag Campaign
✨Topic: What Other Investment Opportunities Remain as AI Stocks Keep Rising?
👉How to Join:
Publish a short post or article with hashtag #AIStocksWhatNext
Share whether you’re bullish or bearish, and post your AI stock holdings or trade — using the trade widget may improve your eligibility.
You can also strengthen your post by sharing data or charts, and avoiding AI-generated images.
✍️Create content based on the below angles:
- Nvidia says chip sales will double next year, and top AI companies keep hitting record revenue, the compute spend behind it is just as staggering. Is AI demand really taking off? And how long can it last? AI stocks are up across the board. Is this a real breakout, or just a short-term bounce?
- Industry leaders are calling to slow down AI development, while Trump plans to build an “AI Force”, claiming AI could account for 25% of U.S. GDP in the future. Whose side are you on? Will state-level backing be a long-term win for AI stocks?
- Are you buying AI stocks? Share your AI-related trade/holdings with our trade sharing widget.
⏰Campaign Period:
- 2026-09-22 7:00 - 2026-09-24 4:00 UTC
🎁Reward:
- Qualified posts that comply with the above guidelines and contain more than 100 words will be reviewed and may receive a random traffic boost of 500 to 3,000 views. You will receive a notification from your feed secretary if your post is selected.
- Get a chance to have your article featured on Binance Square Official
Need ideas for your post? Visit the topic page #AIStocksWhatNext or the Square Guide on How to Post for Better Reach.
Binance Square Official
·519 Likes
·1.4M views
21SharesLaunchesEuropesFirstZcashETP
18,650 views
646 Discussing
CardanoJoinsX402PaymentStandard
12,699 views
487 Discussing