

Zkur Wielu
85 Posts

Zkur Wielu
tylko jajka
13 Following
157 Followers
168 Liked
Posts
All
Quotes
PINNED

Hafiz waqas Yafoor
·
--
$1000PEPE Breaking News
Elon musk Support Pepe 📈
0.025 only 2 days bye strong ✈️✈️✈️💪💰💪💰
Elon musk Support Pepe 📈
0.025 only 2 days bye strong ✈️✈️✈️💪💰💪💰


Maciel Camara
·
--
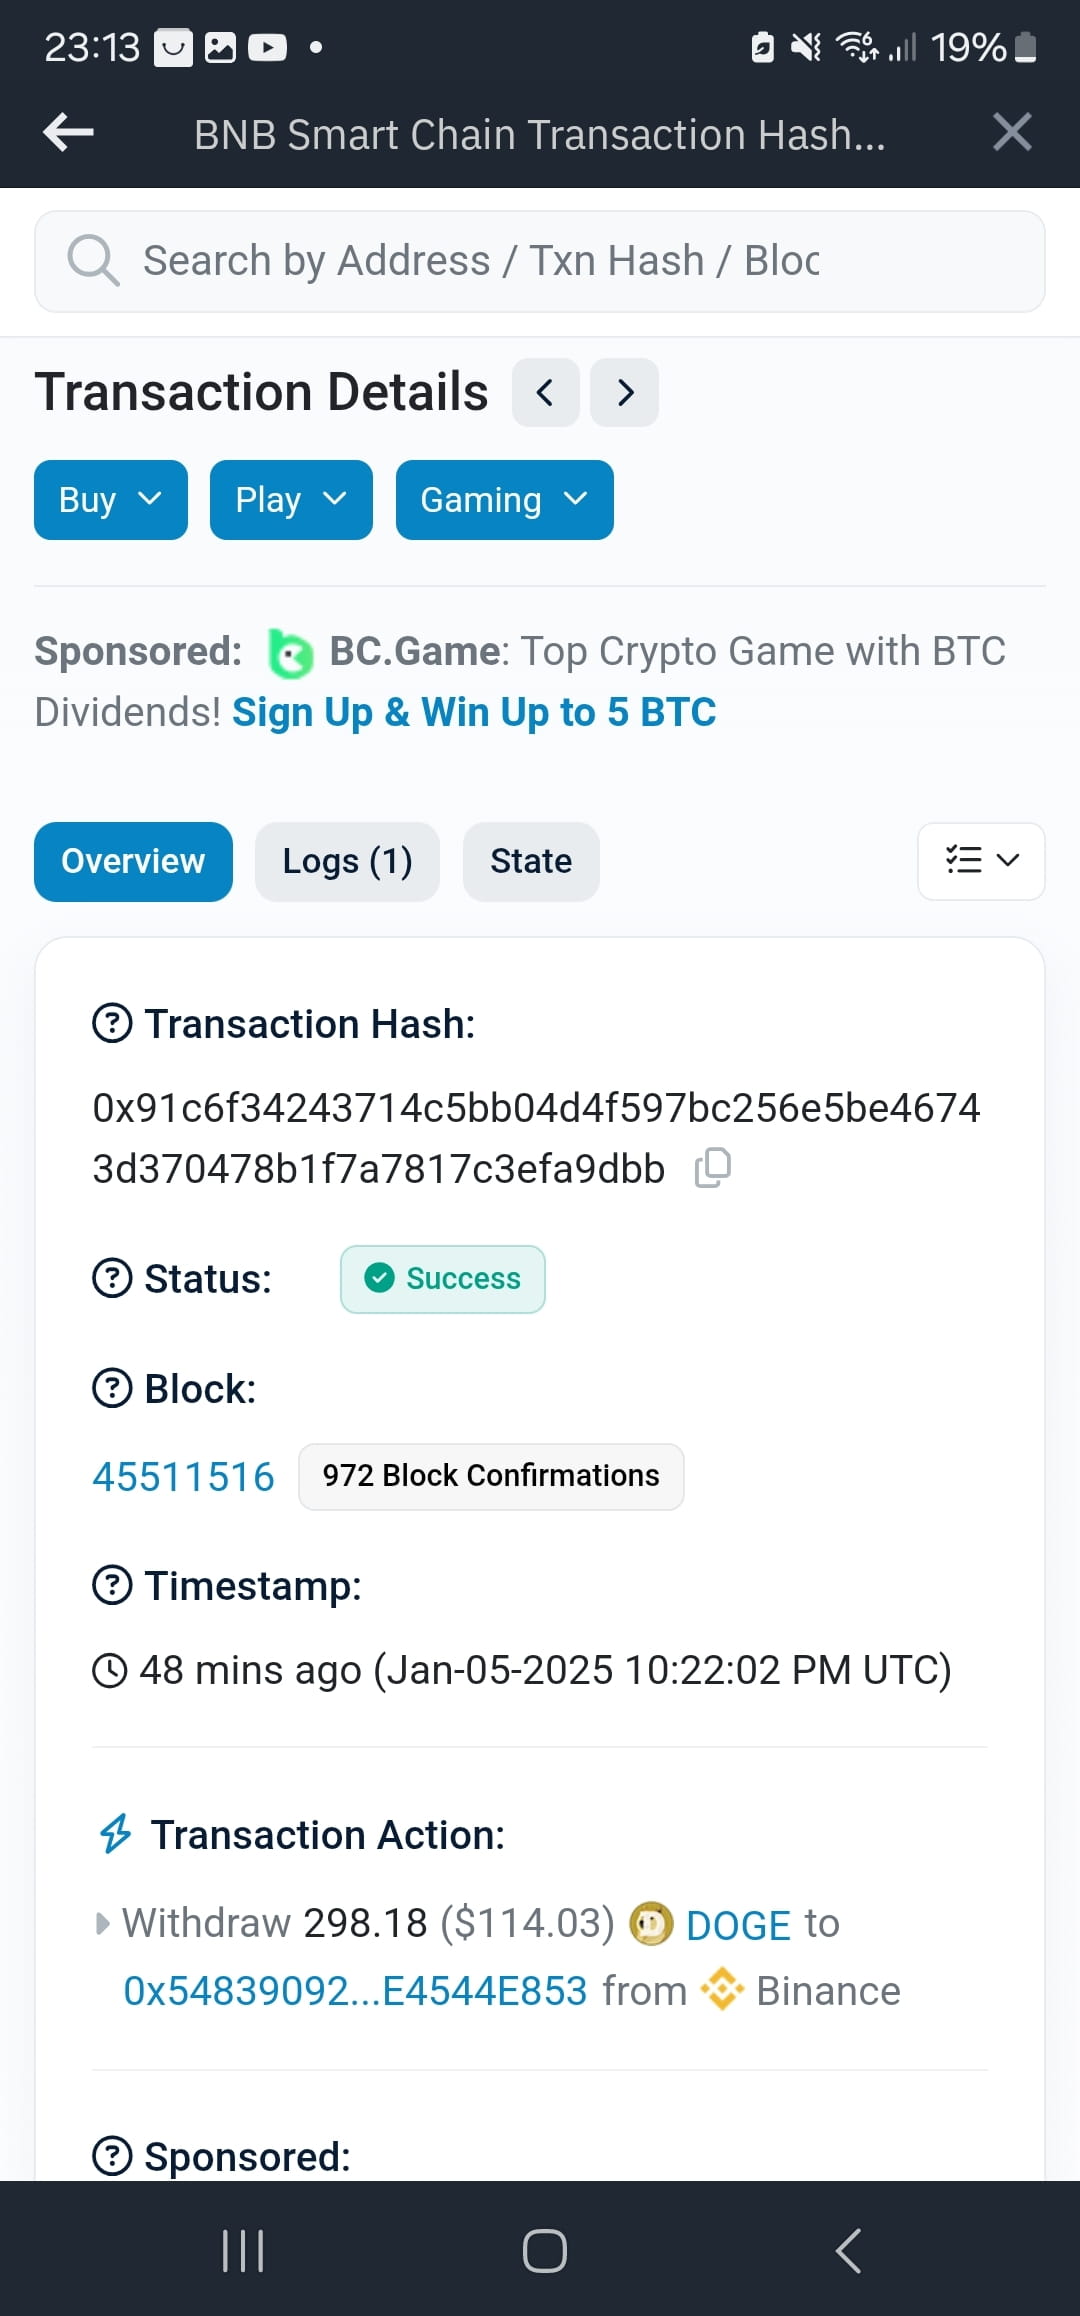
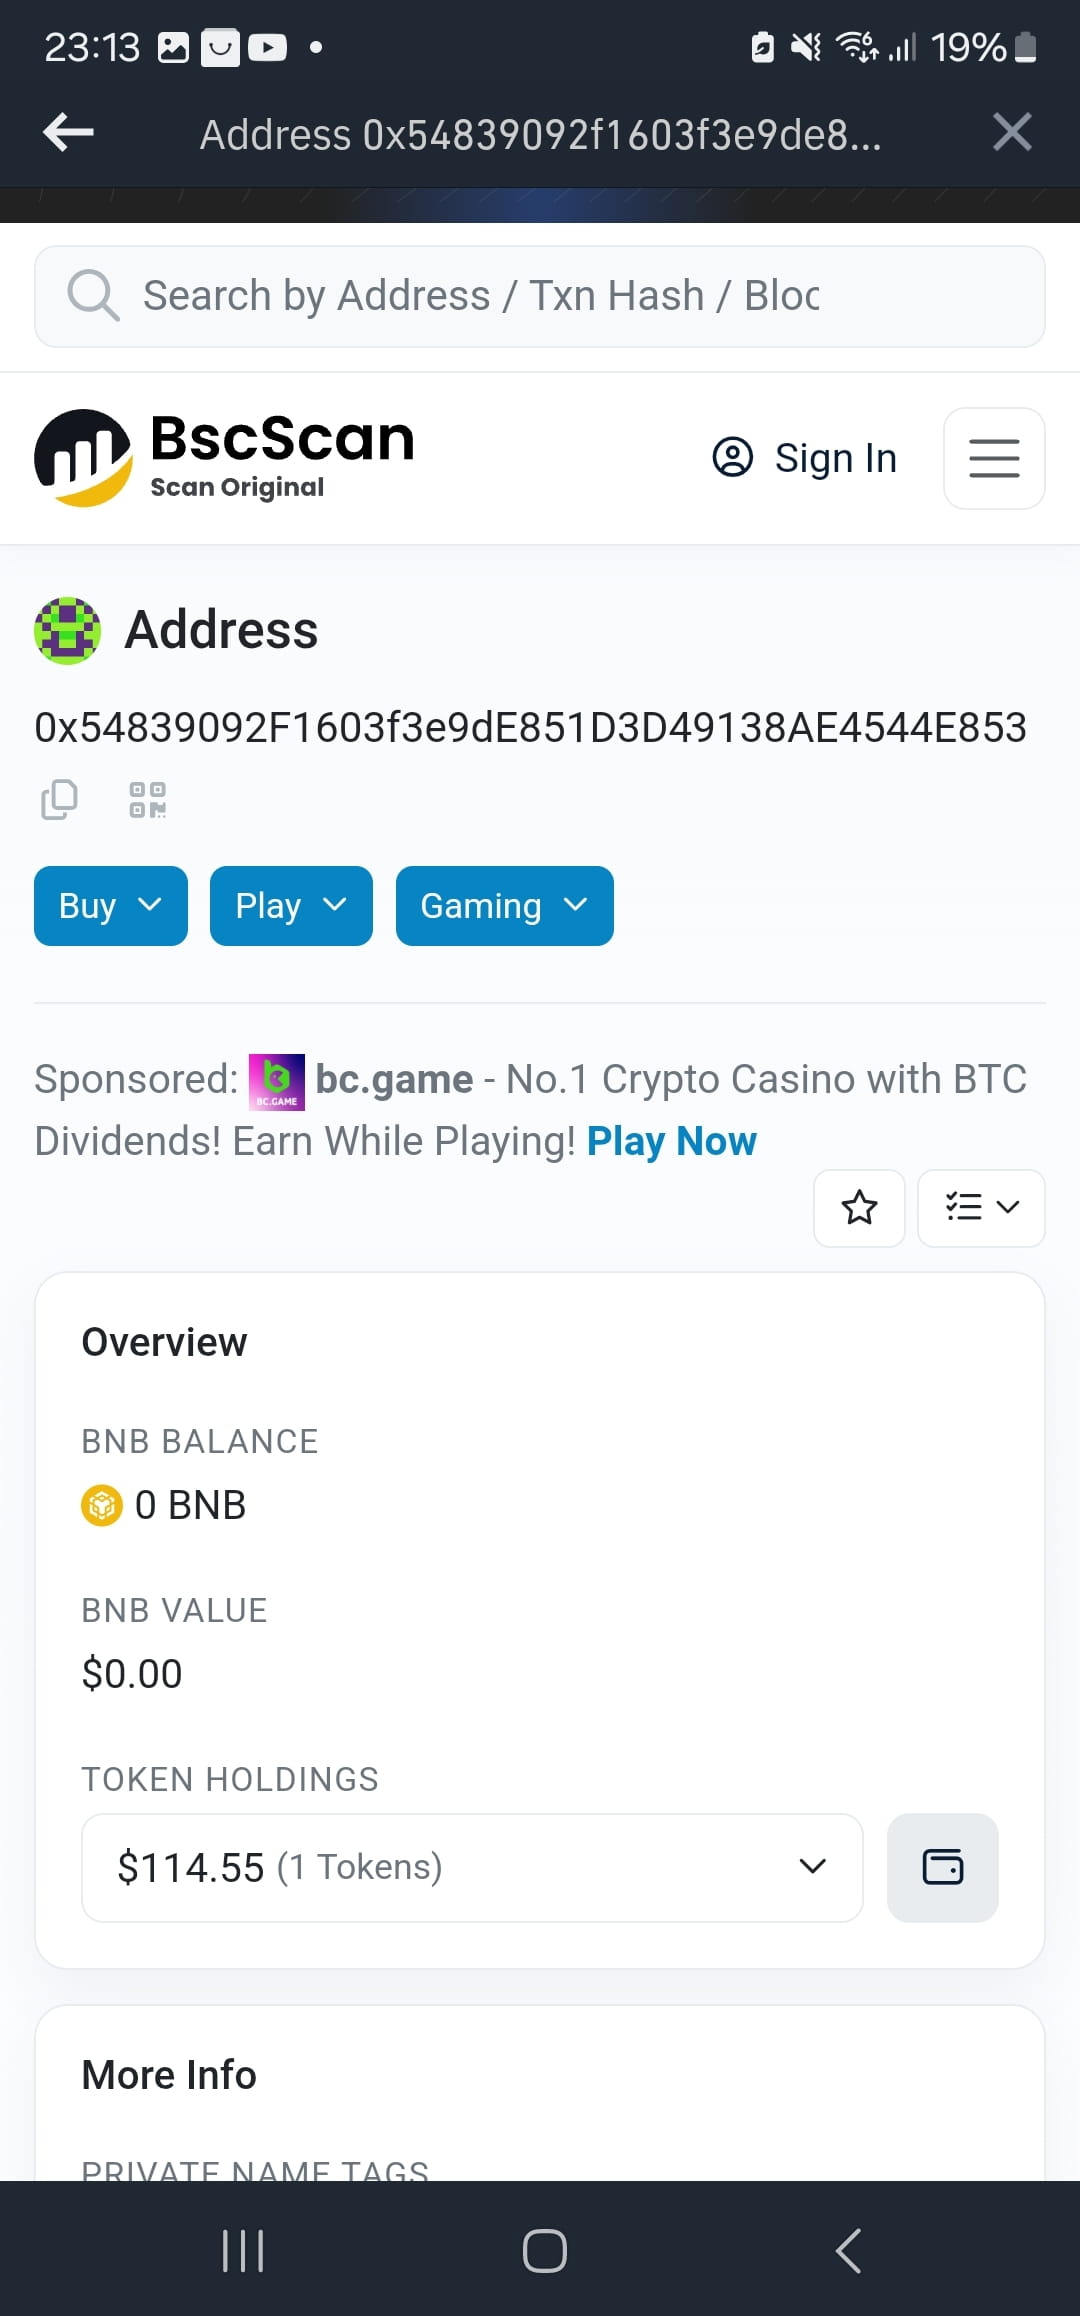
I made a wrong transfer, can I find this account or contact this person?

BtcBoss777
·
--
It seems to me that nothing will grow. You are telling people to buy and lose

_NoS_86
·
--
achieved?


Pan Daniel
·
--
It's gotten old really bad xDD
Gaurav rapper
·
--
I don't have money guys but if anyone have than please invest in #Shibalnu #PEPE #Dogecoin #doge⚡ after getting profit share me 20 percent because i will tell you every where to invest and earn 10x amount so follow me for more

Gidget Toothacre lYwl
·
--
it's going downhill for now

Angelita Astrologo SJUp
·
--
I think it means that a bunch of hens is going to rise...


Crypto4light
·
--
Bearish$PEPE : Local Targets Analysis
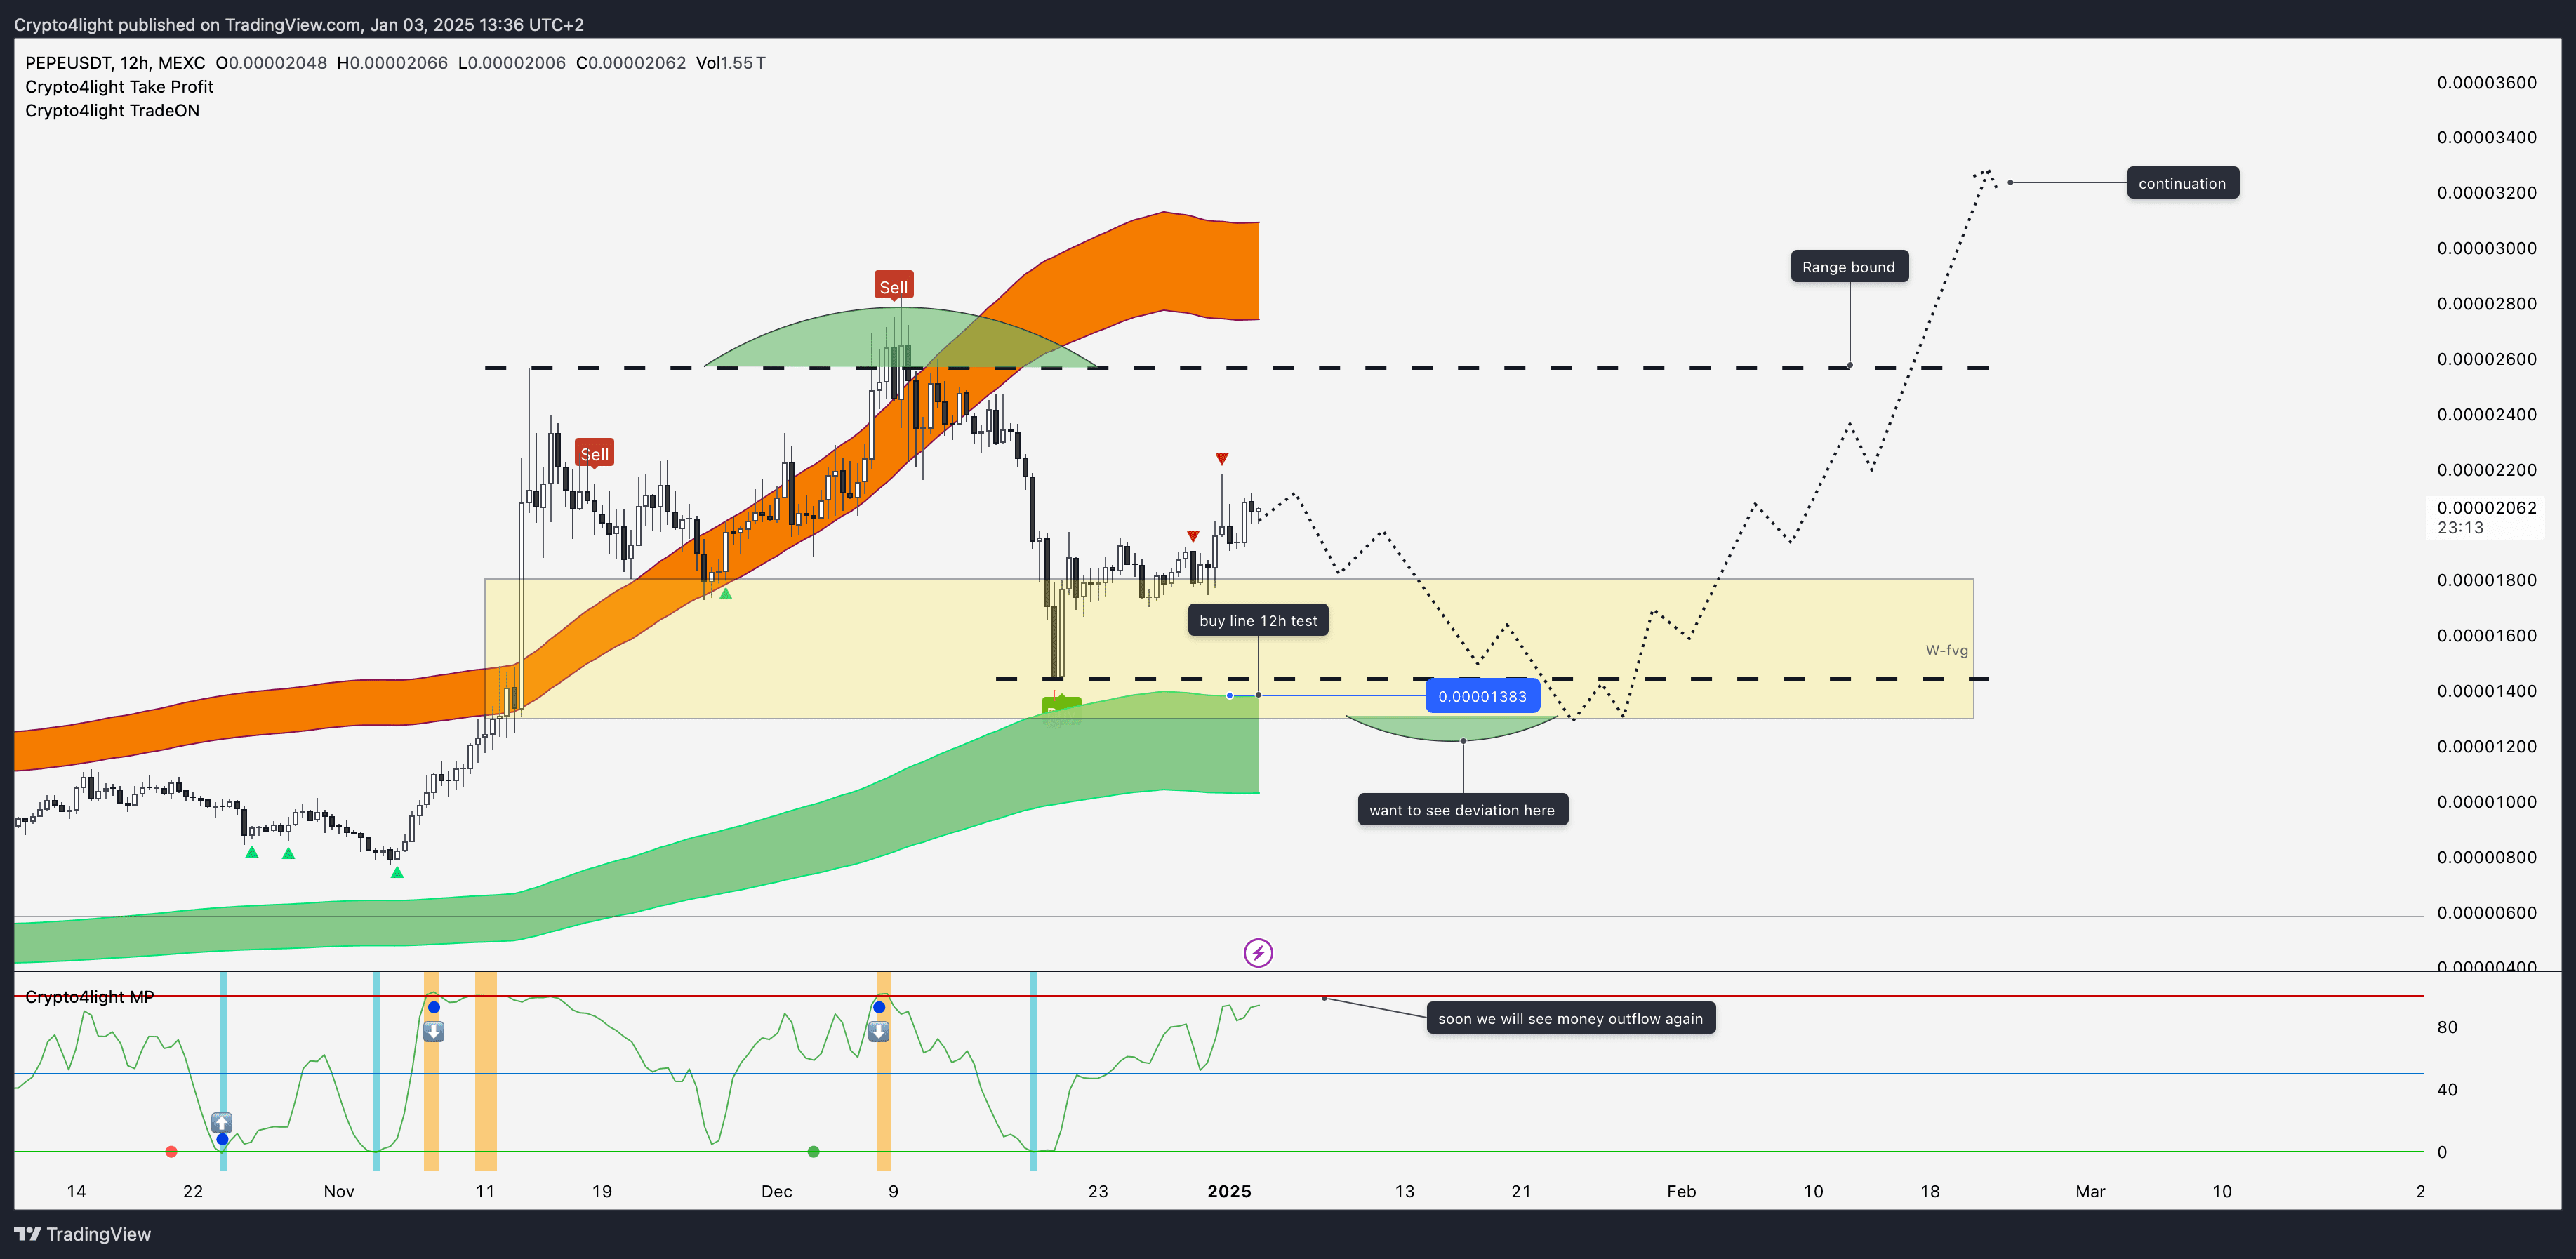
Sooner or later, PEPE will conclude its uptrend and transition into a bearish trend. However, it’s too early to discuss that scenario now. I anticipate another upward impulse in the spring of 2025.
Current Situation
12-Hour Chart:
The market is trading within a sideways range.
A top and deviation above the range have already formed; it would be ideal to see a deviation below this range as well.
I’ve outlined a potential direction for the price movement.
I’m awaiting a test of the Buy Line from my Take Profit indicator.
Additionally, there was a buy signal generated on December 20th.
I expect to see a money outflow in the near future.
Sooner or later, PEPE will conclude its uptrend and transition into a bearish trend. However, it’s too early to discuss that scenario now. I anticipate another upward impulse in the spring of 2025.
Current Situation
12-Hour Chart:
The market is trading within a sideways range.
A top and deviation above the range have already formed; it would be ideal to see a deviation below this range as well.
I’ve outlined a potential direction for the price movement.
I’m awaiting a test of the Buy Line from my Take Profit indicator.
Additionally, there was a buy signal generated on December 20th.
I expect to see a money outflow in the near future.
Log in to explore more content