
mfa41
362 Posts

mfa41
Report
Block User
106 Following
163 Followers
158 Liked
Posts
All
Quotes
PINNED
·
--
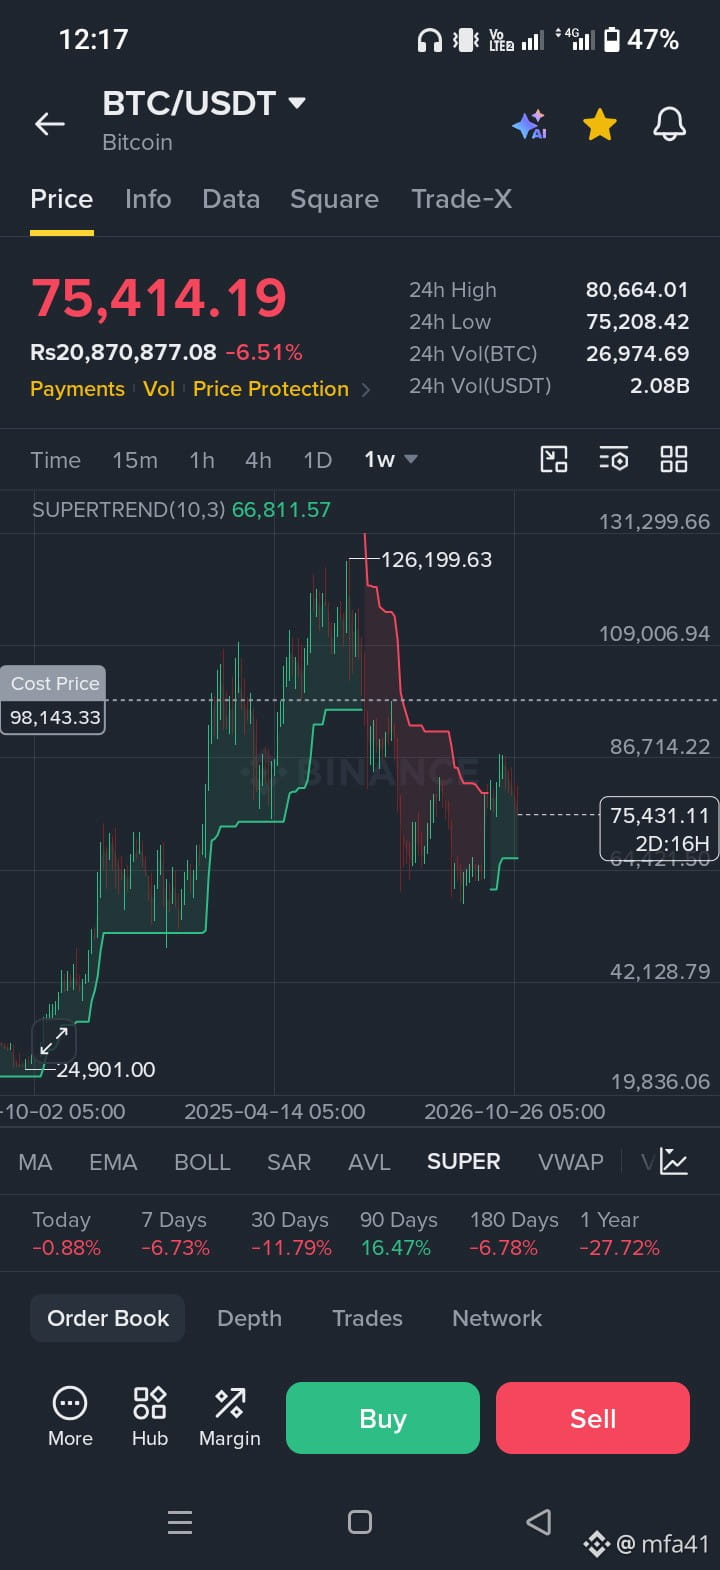
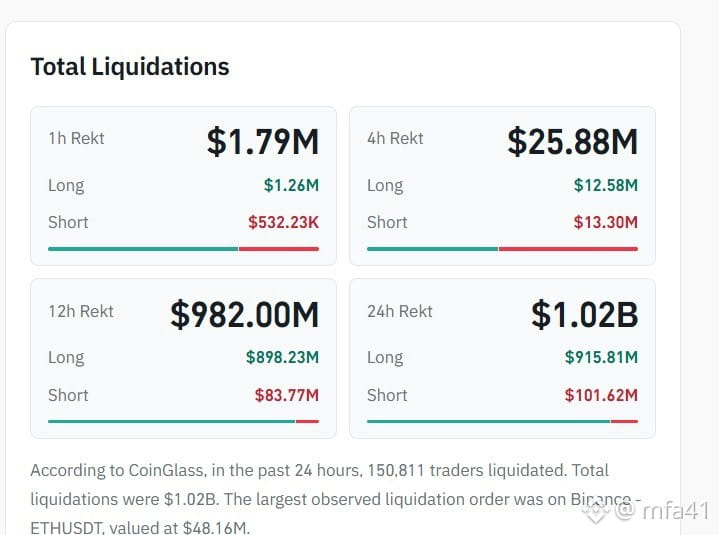
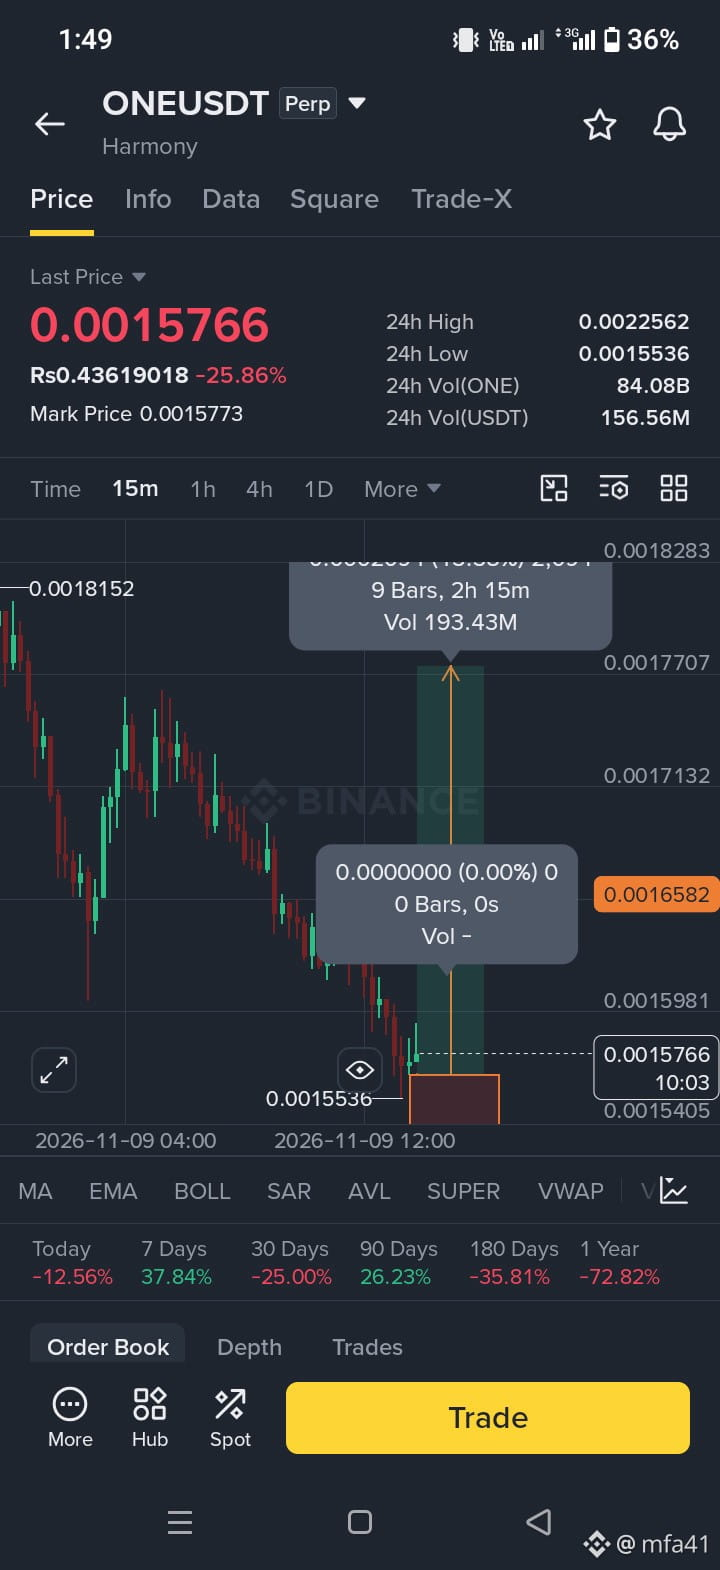
bloom dumb crazy to the point . $13k BTC analysis fundamental ,fear, Market , structure ,pridect , reality ,
just accept it bro/sis
#btc
bloom dumb crazy to the point . $13k BTC analysis fundamental ,fear, Market , structure ,pridect , reality ,
just accept it bro/sis
#btc
just accept it bro/sis
#btc
36

·
--
Bullish
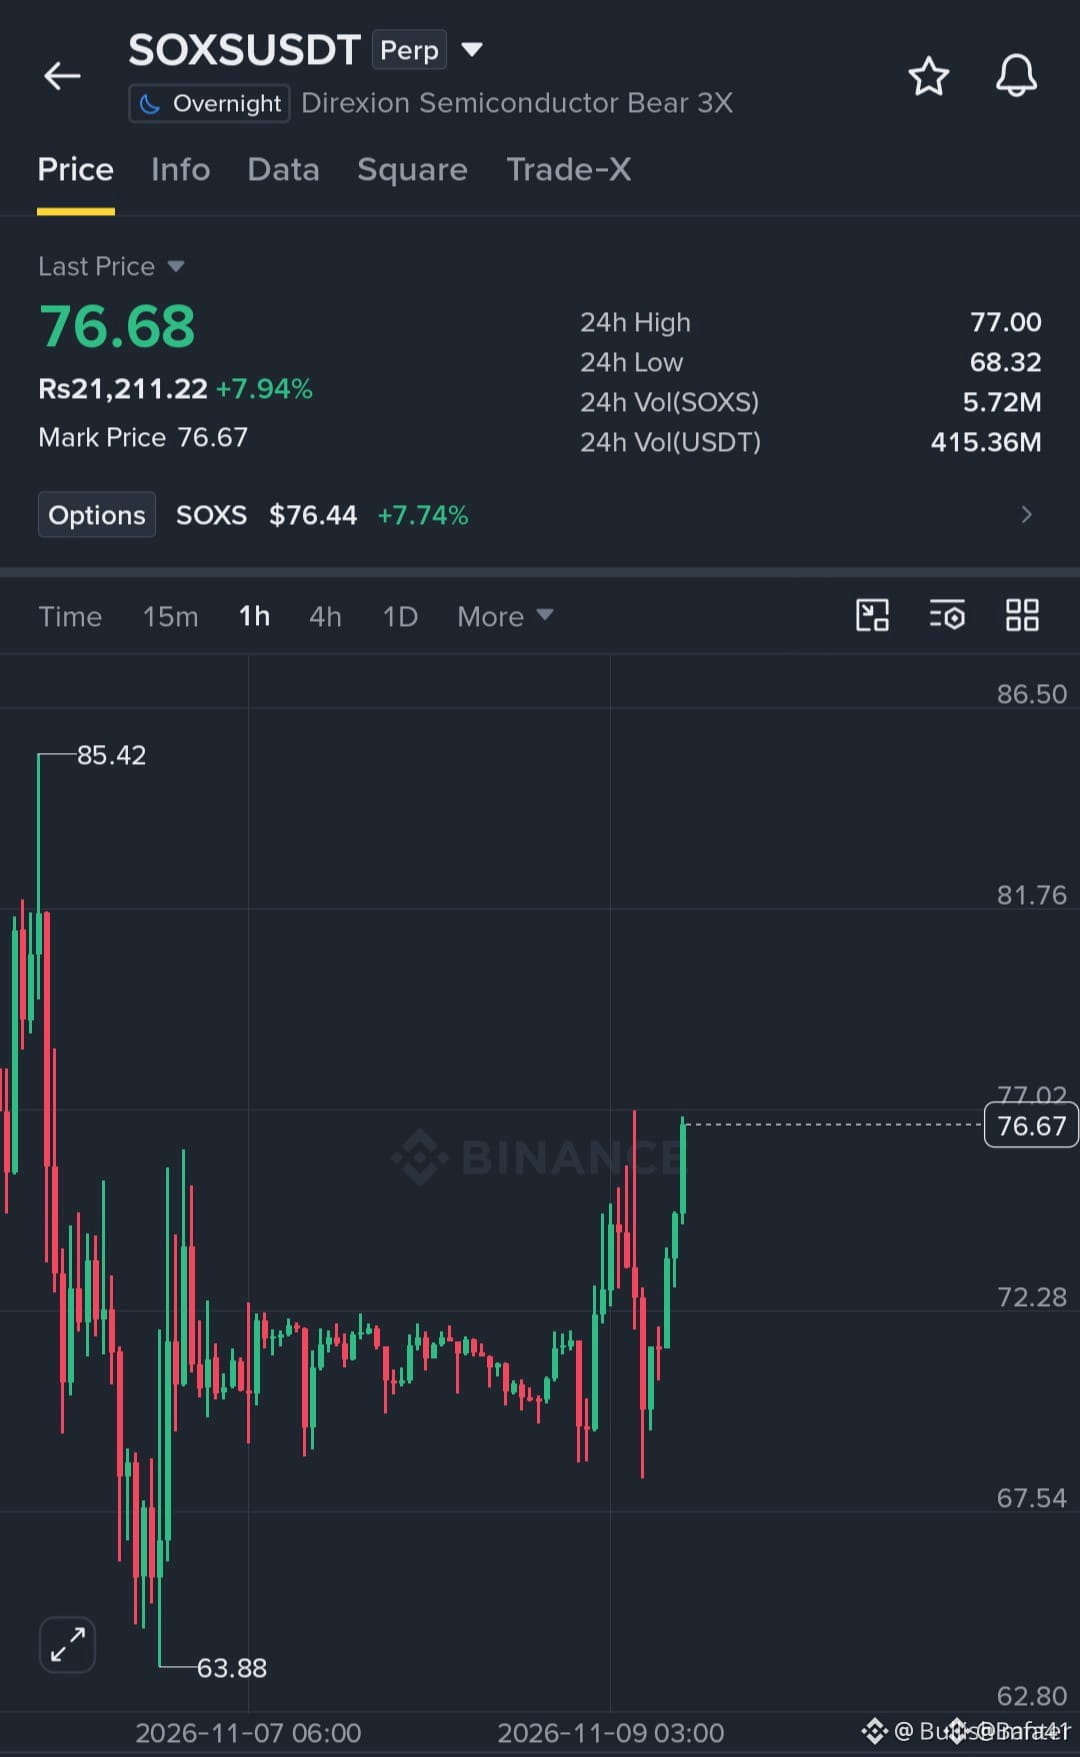
$SOXS SURGES 8% ... IS 80 THE NEXT TARGET
SOXS is showing strong bullish momentum, climbing nearly 8% as buyers push the price toward the key 77 resistance zone.
After recovering from 68.32, the chart is showing a strong rebound with renewed buying pressure.
A clean breakout above 77 could open the door toward 80–82, while 85.42 remains a major resistance level.
Key Support: 72.30–74.00
Immediate Resistance: 77.00
Next Targets: 80.00 | 82.00 | 85.42
As long as buyers defend the recent recovery zone, the bullish momentum could continue.
Will SOXS break 77 and trigger another powerful rally, or will sellers step in again?
#SOXS
$SOXS SURGES 8% ... IS 80 THE NEXT TARGET
SOXS is showing strong bullish momentum, climbing nearly 8% as buyers push the price toward the key 77 resistance zone.
After recovering from 68.32, the chart is showing a strong rebound with renewed buying pressure.
A clean breakout above 77 could open the door toward 80–82, while 85.42 remains a major resistance level.
Key Support: 72.30–74.00
Immediate Resistance: 77.00
Next Targets: 80.00 | 82.00 | 85.42
As long as buyers defend the recent recovery zone, the bullish momentum could continue.
Will SOXS break 77 and trigger another powerful rally, or will sellers step in again?
#SOXS
SOXS is showing strong bullish momentum, climbing nearly 8% as buyers push the price toward the key 77 resistance zone.
After recovering from 68.32, the chart is showing a strong rebound with renewed buying pressure.
A clean breakout above 77 could open the door toward 80–82, while 85.42 remains a major resistance level.
Key Support: 72.30–74.00
Immediate Resistance: 77.00
Next Targets: 80.00 | 82.00 | 85.42
As long as buyers defend the recent recovery zone, the bullish momentum could continue.
Will SOXS break 77 and trigger another powerful rally, or will sellers step in again?
#SOXS
1
74
·
--
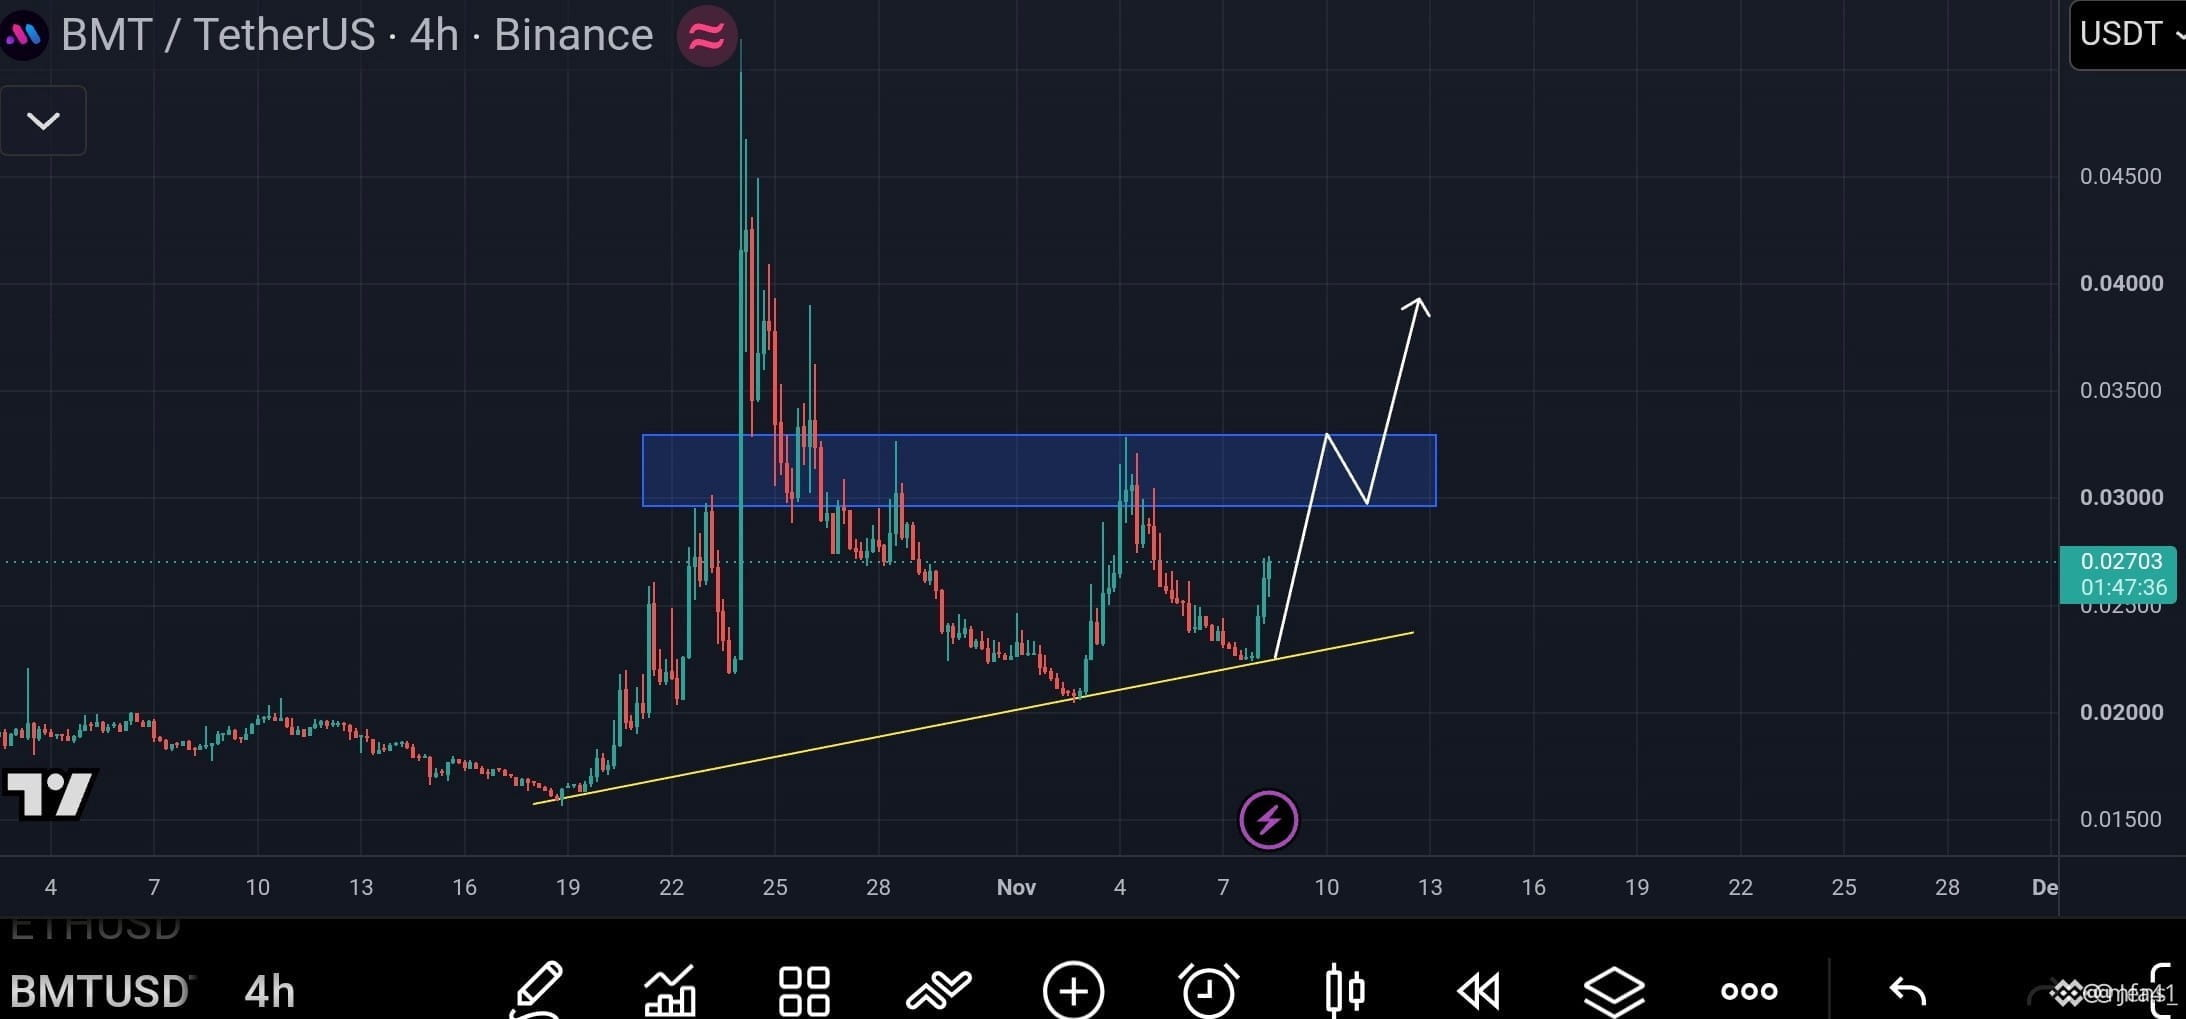
$BMT is bouncing from rising support near $0.022 and trading around $0.027 on this chart.
Next test is the $0.030 to $0.033 resistance zone. A breakout and successful retest could open a move toward $0.040.
My view: bounce looks encouraging, but buyers still need to clear resistance. Losing $0.022 would weaken this setup.
#BMT #crypto #Binance
$BMT is bouncing from rising support near $0.022 and trading around $0.027 on this chart.
Next test is the $0.030 to $0.033 resistance zone. A breakout and successful retest could open a move toward $0.040.
My view: bounce looks encouraging, but buyers still need to clear resistance. Losing $0.022 would weaken this setup.
#BMT #crypto #Binance
Next test is the $0.030 to $0.033 resistance zone. A breakout and successful retest could open a move toward $0.040.
My view: bounce looks encouraging, but buyers still need to clear resistance. Losing $0.022 would weaken this setup.
#BMT #crypto #Binance
44
·
--
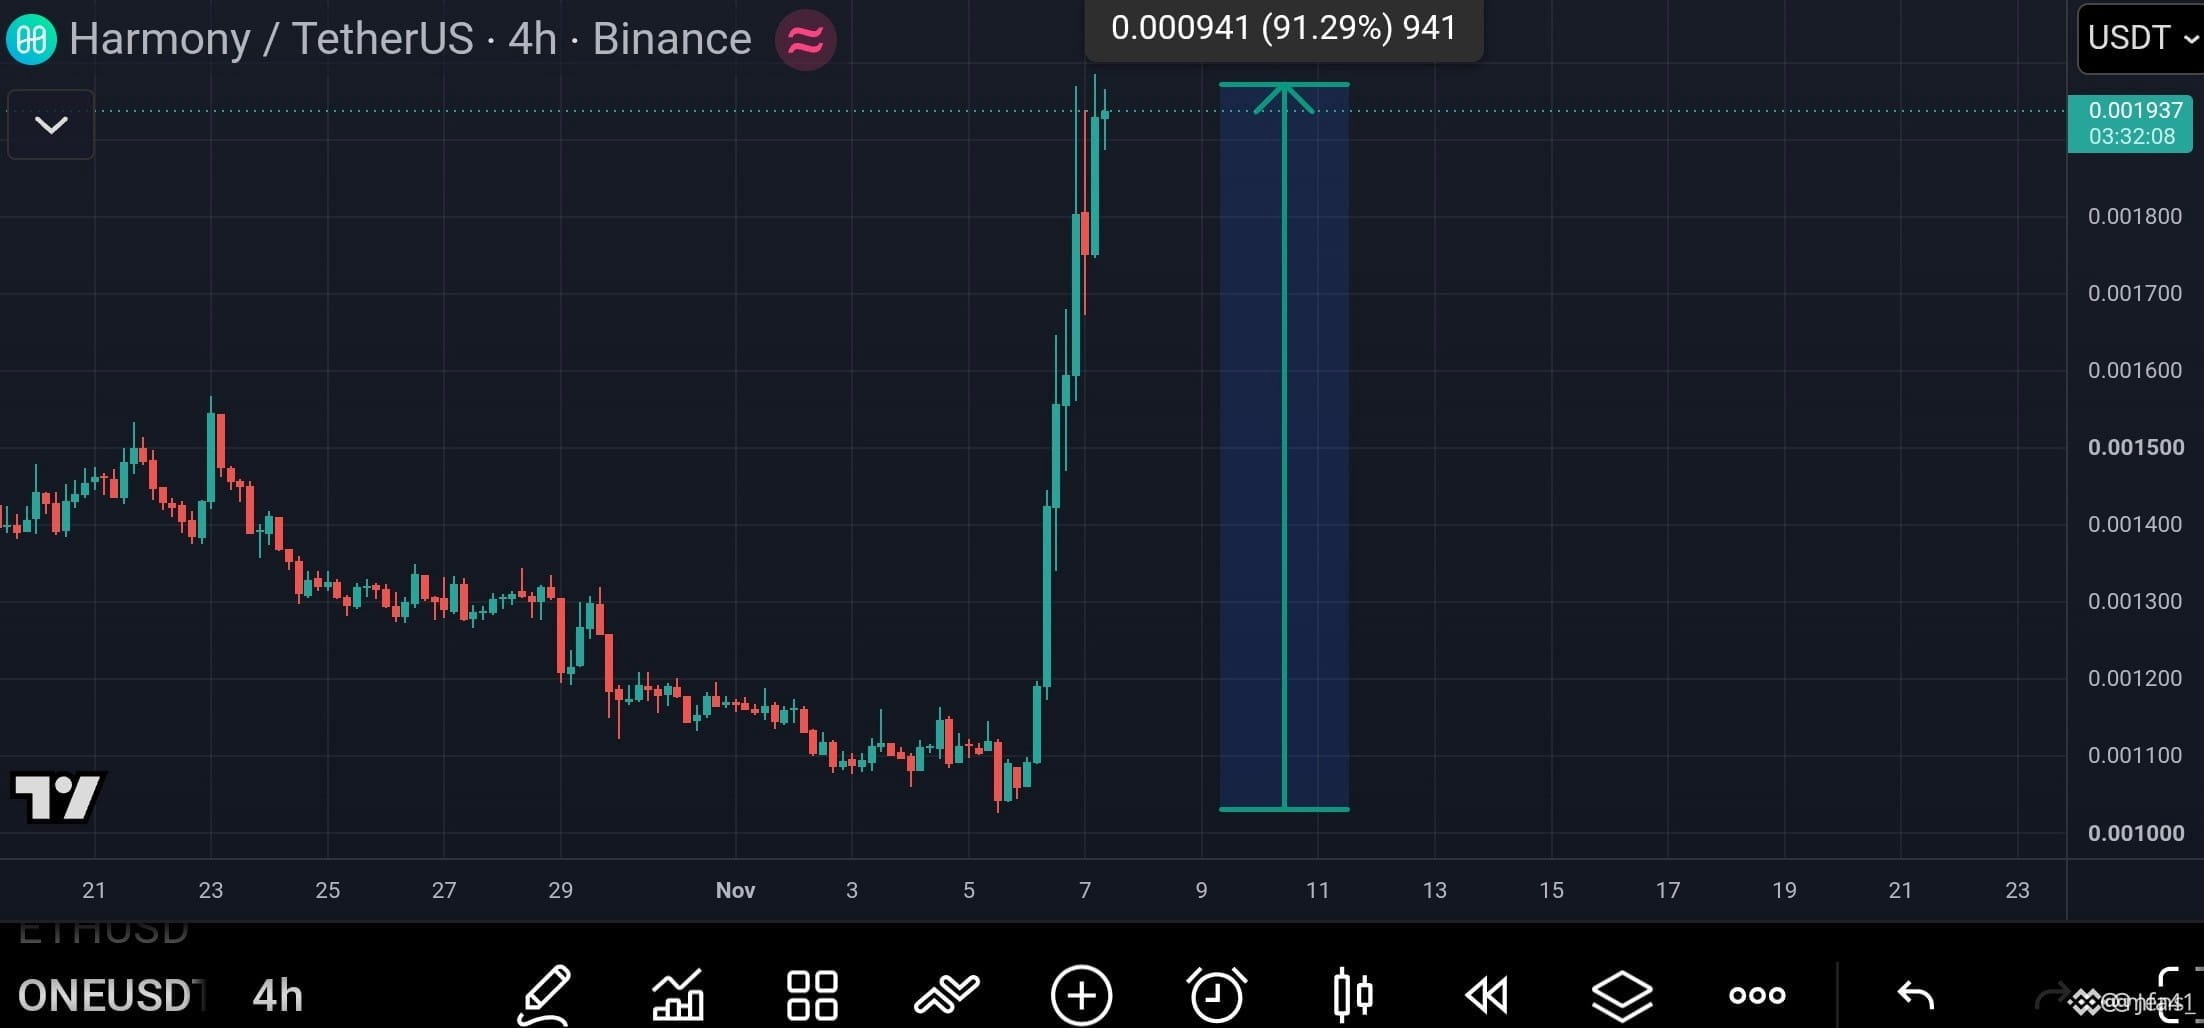
$ONE has surged from around $0.00103 to $0.00194 on this chart, with $0.0020 now the key test.
I’m watching $0.00175–$0.00180 for support. Holding this zone could support another push, while losing it could bring $0.00160 into focus.
My view: strong momentum, but I’d wait for a stable retest before chasing these candles.
#one #crypto #Binance
$ONE has surged from around $0.00103 to $0.00194 on this chart, with $0.0020 now the key test.
I’m watching $0.00175–$0.00180 for support. Holding this zone could support another push, while losing it could bring $0.00160 into focus.
My view: strong momentum, but I’d wait for a stable retest before chasing these candles.
#one #crypto #Binance
I’m watching $0.00175–$0.00180 for support. Holding this zone could support another push, while losing it could bring $0.00160 into focus.
My view: strong momentum, but I’d wait for a stable retest before chasing these candles.
#one #crypto #Binance
68
·
--
BUY WATCH – AERO/USDT
💰 Entry Zone: 0.588 – 0.593
🎯 Targets:
TP1: 0.600
TP2: 0.610
TP3: 0.620
TP4: 0.630
🛑 Stop Loss: 0.5645
BUY WATCH – AERO/USDT
💰 Entry Zone: 0.588 – 0.593
🎯 Targets:
TP1: 0.600
TP2: 0.610
TP3: 0.620
TP4: 0.630
🛑 Stop Loss: 0.5645
💰 Entry Zone: 0.588 – 0.593
🎯 Targets:
TP1: 0.600
TP2: 0.610
TP3: 0.620
TP4: 0.630
🛑 Stop Loss: 0.5645
28
·
--
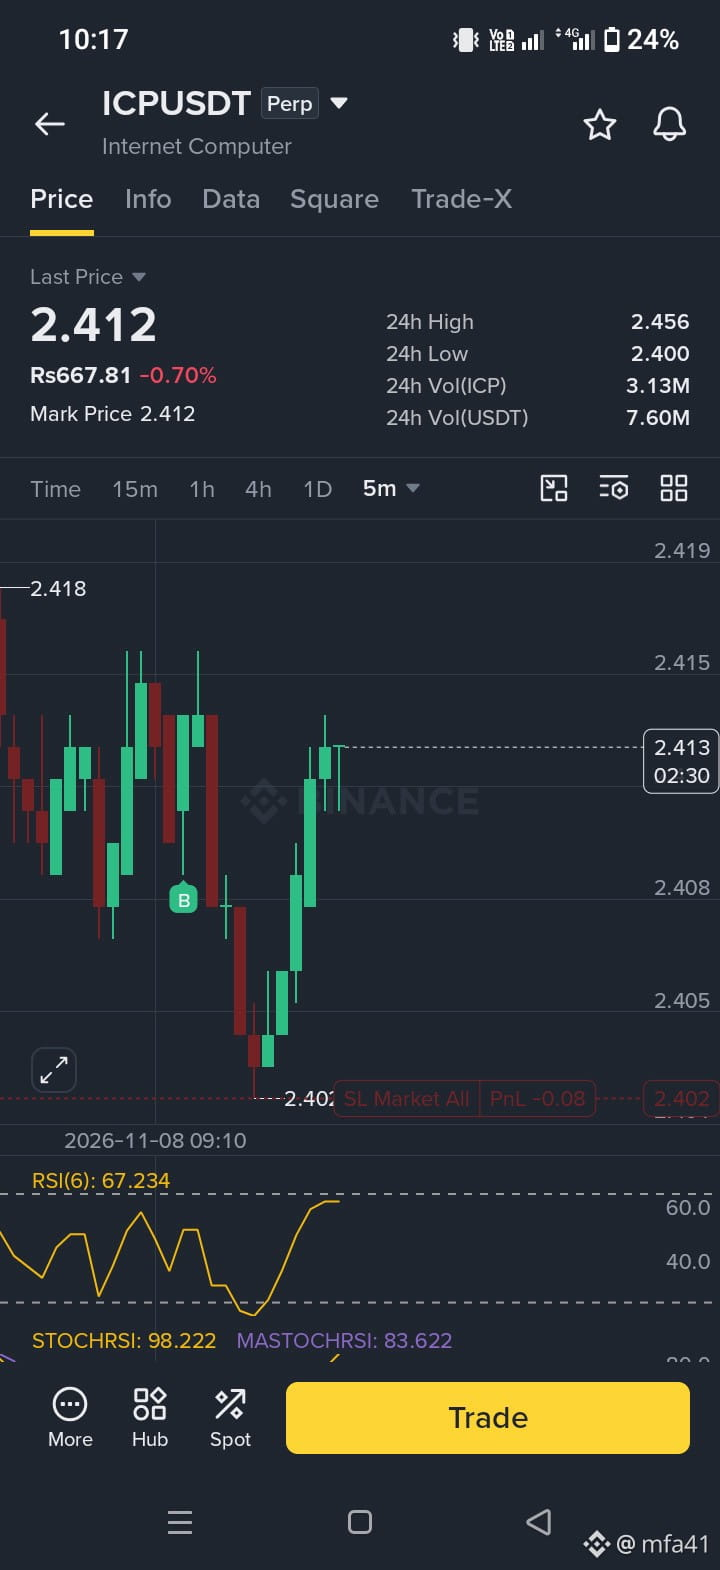
how is that possible .🤔 actually i.put the stop loss right 2.402 and market actually goes down on the point . Blood river .
the one thing that i learned. no matter what ever is done you just follow and very strict to stand with your plan .there is no way
#ICP
it's my training trades
how is that possible .🤔 actually i.put the stop loss right 2.402 and market actually goes down on the point . Blood river .
the one thing that i learned. no matter what ever is done you just follow and very strict to stand with your plan .there is no way
#ICP
it's my training trades
the one thing that i learned. no matter what ever is done you just follow and very strict to stand with your plan .there is no way
#ICP
it's my training trades
291
·
--
_*strategy:*_
1. Wait for price to test 76,200–76,500.
2. Look for bearish rejection.
3. Confirm with volume and RSI.
4. Enter short only after confirmation.
5. Book partial profits at TP1 and move SL to breakeven.
Bias is Bearish
_*strategy:*_
1. Wait for price to test 76,200–76,500.
2. Look for bearish rejection.
3. Confirm with volume and RSI.
4. Enter short only after confirmation.
5. Book partial profits at TP1 and move SL to breakeven.
Bias is Bearish
1. Wait for price to test 76,200–76,500.
2. Look for bearish rejection.
3. Confirm with volume and RSI.
4. Enter short only after confirmation.
5. Book partial profits at TP1 and move SL to breakeven.
Bias is Bearish
6
·
--
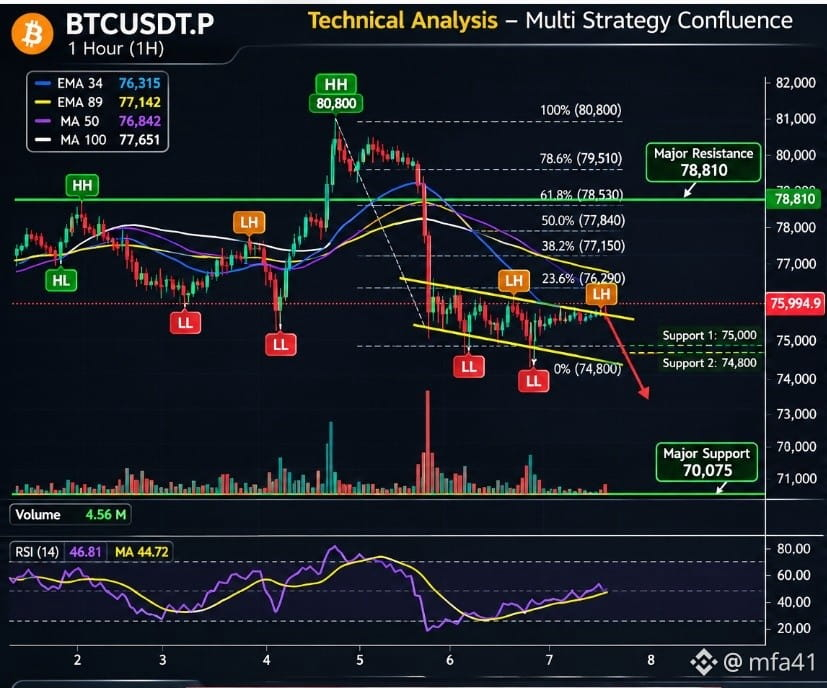
*BTCUSDT.P – Complete Multi-Strategy Technical Analysis*
1) Dow Theory – Market Structure : Bearish
2) Support & Resistance: 78,810:Strong resistance
Support 1 75,000 Local support
Support 2 74,800 Previous swing low
Major support 70,075 Major downside
3)Trendline & Channel :A rejection from channel resistance could provide a short opportunity.
4) RSI : Neutral to Weak Bearish
5)Volume Analysis: Large selling volume appeared during the major breakdown
*BTC is showing lower highs, lower lows and consolidation inside a descending channel.*
*BTCUSDT.P – Complete Multi-Strategy Technical Analysis*
1) Dow Theory – Market Structure : Bearish
2) Support & Resistance: 78,810:Strong resistance
Support 1 75,000 Local support
Support 2 74,800 Previous swing low
Major support 70,075 Major downside
3)Trendline & Channel :A rejection from channel resistance could provide a short opportunity.
4) RSI : Neutral to Weak Bearish
5)Volume Analysis: Large selling volume appeared during the major breakdown
*BTC is showing lower highs, lower lows and consolidation inside a descending channel.*
1) Dow Theory – Market Structure : Bearish
2) Support & Resistance: 78,810:Strong resistance
Support 1 75,000 Local support
Support 2 74,800 Previous swing low
Major support 70,075 Major downside
3)Trendline & Channel :A rejection from channel resistance could provide a short opportunity.
4) RSI : Neutral to Weak Bearish
5)Volume Analysis: Large selling volume appeared during the major breakdown
*BTC is showing lower highs, lower lows and consolidation inside a descending channel.*
24
·
--
Coins To be analyse as per your votes
BTC ✅
ETH
XRP
QNT ✅
SOL
ZEC
HYPE
GOLD
SILVER
LINK
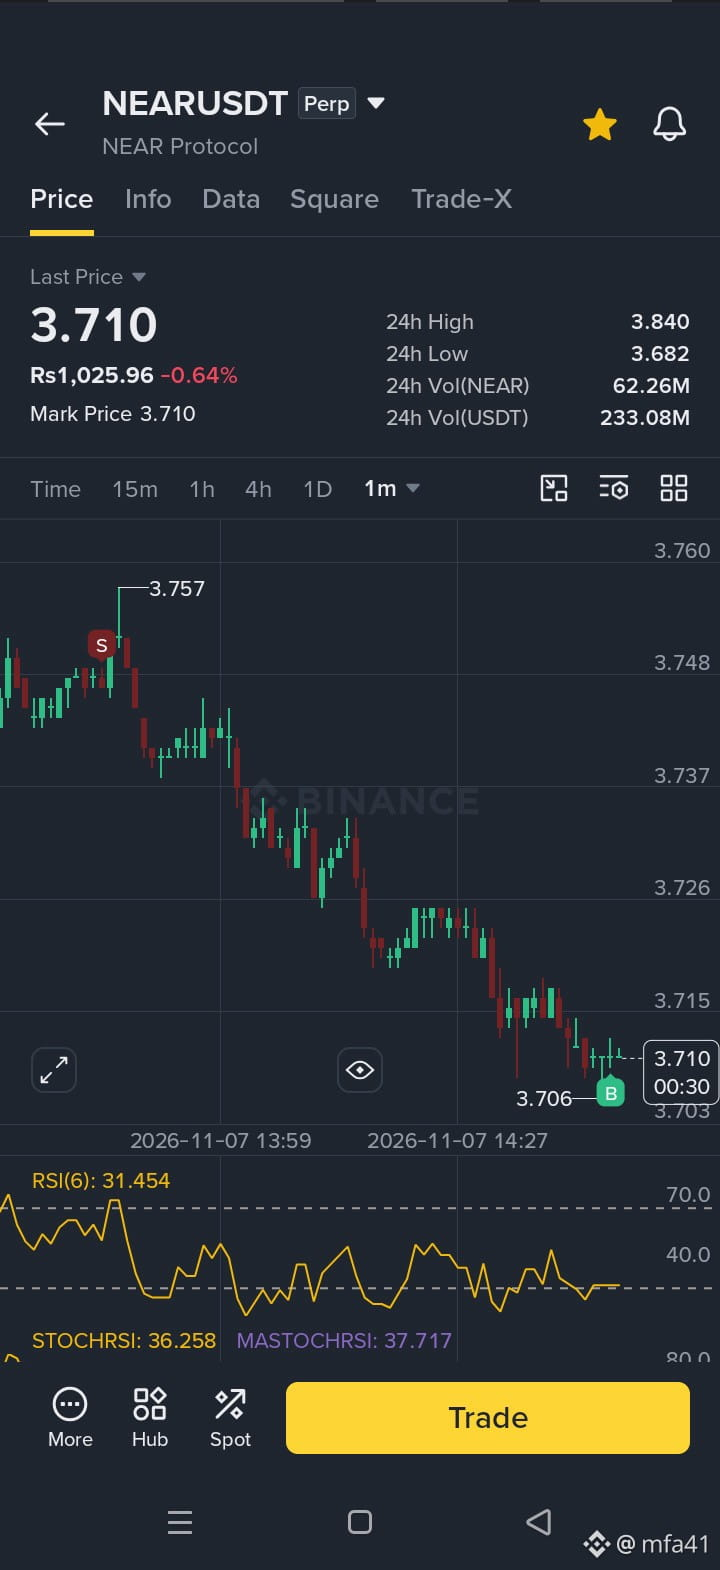
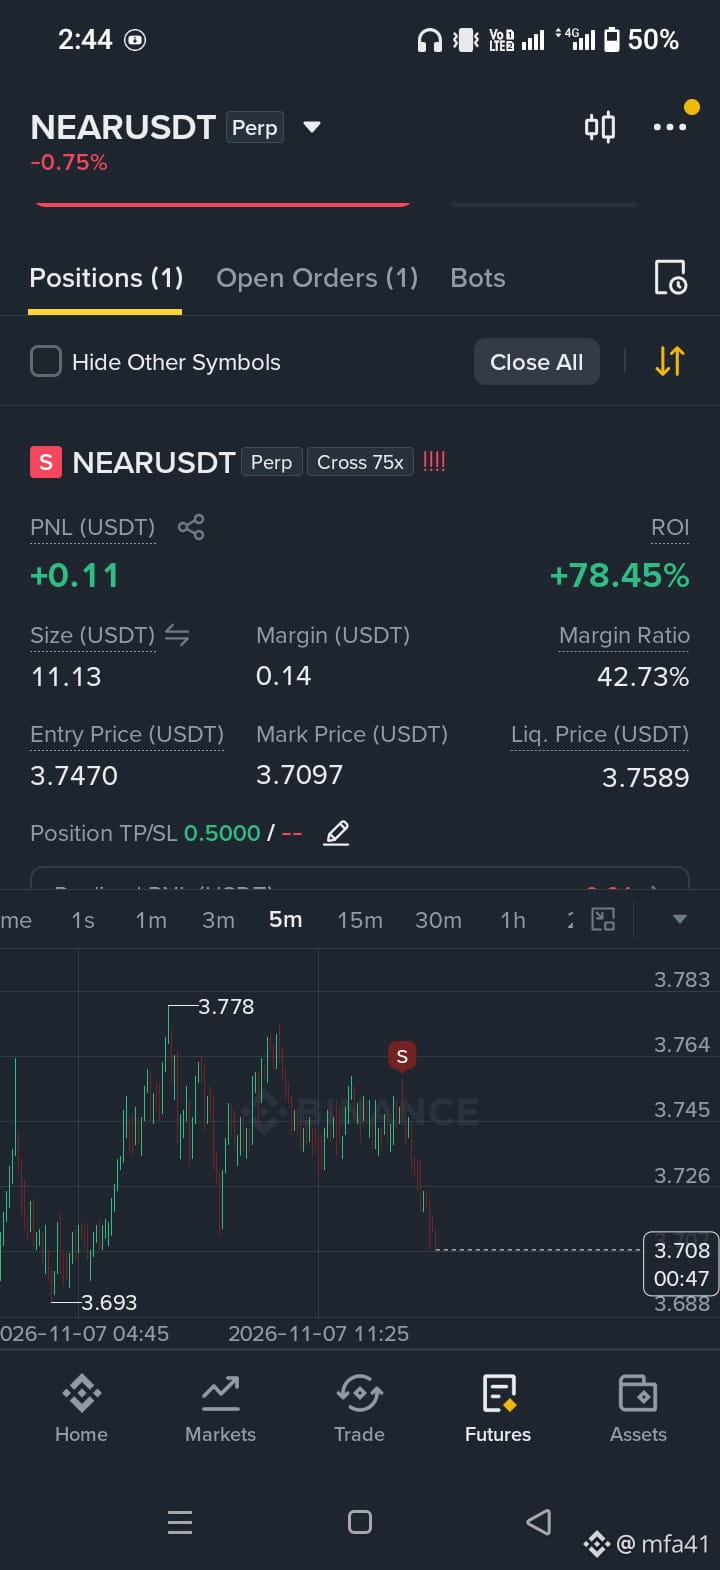
NEAR
LAB
TAO
UNI
INJ
KAS
HBAR
SUI
DOT
OP
WLD
WILFI
AKE
AVAX
RIVER
LTC
ONDO
CYBER
AIN
LYN
ONE
Coins To be analyse as per your votes
BTC ✅
ETH
XRP
QNT ✅
SOL
ZEC
HYPE
GOLD
SILVER
LINK
NEAR
LAB
TAO
UNI
INJ
KAS
HBAR
SUI
DOT
OP
WLD
WILFI
AKE
AVAX
RIVER
LTC
ONDO
CYBER
AIN
LYN
ONE
BTC ✅
ETH
XRP
QNT ✅
SOL
ZEC
HYPE
GOLD
SILVER
LINK
NEAR
LAB
TAO
UNI
INJ
KAS
HBAR
SUI
DOT
OP
WLD
WILFI
AKE
AVAX
RIVER
LTC
ONDO
CYBER
AIN
LYN
ONE
392
·
--
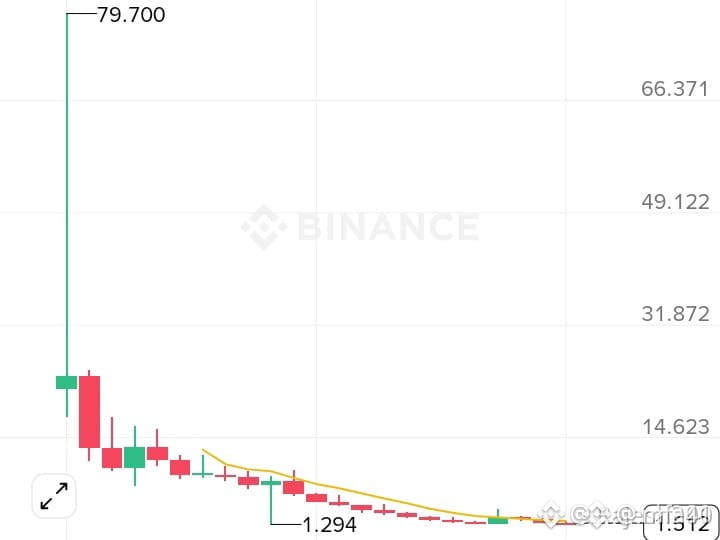
$79.70 is far, first need to hold $5! $TRUMP -6.88% today, chart looks weak. What do you think about $NEAR +6% today? 👀
$79.70 is far, first need to hold $5! $TRUMP -6.88% today, chart looks weak. What do you think about $NEAR +6% today? 👀
67
·
--
The crypto world and trading market are real and profitable, but there’s no such thing as “$5 every 5 or 10 minutes with no capital and guaranteed.” These headlines attract only beginners, while the truth is that profits require learning, risk management, and a clear strategy—not just pressing buttons. Awareness before trading is your true capital. 🧠 Protecting beginners from illusions is our first step toward becoming professionals.
The crypto world and trading market are real and profitable, but there’s no such thing as “$5 every 5 or 10 minutes with no capital and guaranteed.” These headlines attract only beginners, while the truth is that profits require learning, risk management, and a clear strategy—not just pressing buttons. Awareness before trading is your true capital. 🧠 Protecting beginners from illusions is our first step toward becoming professionals.
93
·
--
🚨 *ETH/USDT LONG SIGNAL* 🚨
📉 *Position:* LONG
⚡ *Leverage:* 75X
💰 *Entry Zone:* *2210$ – 2160$*
🎯 *Take Profit Targets:*
✅ *TP1:* 2240$
✅ *TP2:* 2280$
✅ *TP3:* 2320$
🚀 *Final TP:* 2360$
🛑 *Stop Loss:* *2098$*
⚠️ *Risk Management:*
Secure profit on each TP & move *SL to Break Even (BE)* after TP1.
🔥 *High Probability Setup — Follow Entry Zone Properly*
🚨 *ETH/USDT LONG SIGNAL* 🚨
📉 *Position:* LONG
⚡ *Leverage:* 75X
💰 *Entry Zone:* *2210$ – 2160$*
🎯 *Take Profit Targets:*
✅ *TP1:* 2240$
✅ *TP2:* 2280$
✅ *TP3:* 2320$
🚀 *Final TP:* 2360$
🛑 *Stop Loss:* *2098$*
⚠️ *Risk Management:*
Secure profit on each TP & move *SL to Break Even (BE)* after TP1.
🔥 *High Probability Setup — Follow Entry Zone Properly*
📉 *Position:* LONG
⚡ *Leverage:* 75X
💰 *Entry Zone:* *2210$ – 2160$*
🎯 *Take Profit Targets:*
✅ *TP1:* 2240$
✅ *TP2:* 2280$
✅ *TP3:* 2320$
🚀 *Final TP:* 2360$
🛑 *Stop Loss:* *2098$*
⚠️ *Risk Management:*
Secure profit on each TP & move *SL to Break Even (BE)* after TP1.
🔥 *High Probability Setup — Follow Entry Zone Properly*
3
·
--
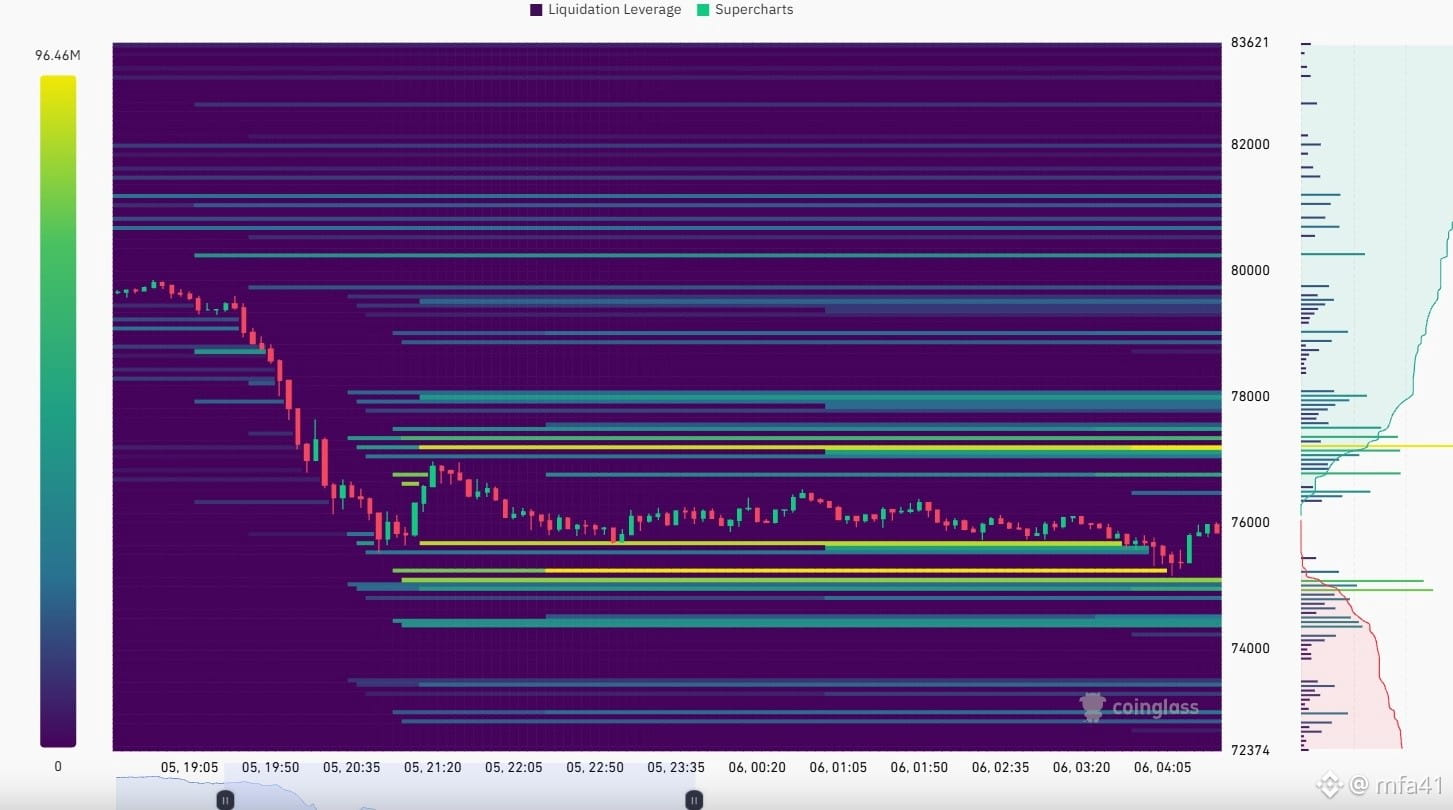
BTC Liquidation Heatmap Analysis – 6 November 2026
Liquidity map levels
$79,500 – $80,000
Upper liquidity
Additional liquidity cluster.
$76,800 – $77,200
Major upper cluster
Bright yellow liquidity zone. Potential upside liquidity target.
$75,000 – $75,300
Major lower cluster
Strong liquidity below current price.
$74,500 – $74,800
Lower liquidity
BTC Liquidation Heatmap Analysis – 6 November 2026
Liquidity map levels
$79,500 – $80,000
Upper liquidity
Additional liquidity cluster.
$76,800 – $77,200
Major upper cluster
Bright yellow liquidity zone. Potential upside liquidity target.
$75,000 – $75,300
Major lower cluster
Strong liquidity below current price.
$74,500 – $74,800
Lower liquidity
Liquidity map levels
$79,500 – $80,000
Upper liquidity
Additional liquidity cluster.
$76,800 – $77,200
Major upper cluster
Bright yellow liquidity zone. Potential upside liquidity target.
$75,000 – $75,300
Major lower cluster
Strong liquidity below current price.
$74,500 – $74,800
Lower liquidity
6
Log in to explore more content
Join global crypto users on Binance Square
⚡️ Get latest and useful information about crypto.
💬 Trusted by the world’s largest crypto exchange.
👍 Discover real insights from verified creators.
Email / Phone number
Trending Topics
NvidiaInvestigatesAfterHuang’sAffairApology
128,859 views
1,360 Discussing
Nvidia Board Opens Probe Into Whether Huang Was Target of Foreign Intelligence Effort
Binance News
·17 Likes
·50.9k views
BitcoinFiveWeeklyLosses
160,269 views
1,837 Discussing
AIChipSlumpNasdaq
83,045 views
1,143 Discussing