

冷酷高飞
406 Posts

冷酷高飞
Report
Block User
分享个人见解,仅供参考,做个冷酷的印钞机。🈚🖕印钞
Open Trade
High-Frequency Trader
3 Years
22 Following
22 Followers
89 Liked
Posts
Portfolio
All
Quotes
·
--
Unusual move: $ESPORTS 5 minutes +5.55%, at 0.01314.
It’s only a real rise when volume picks up.
Unusual move: $ESPORTS 5 minutes +5.55%, at 0.01314.
It’s only a real rise when volume picks up.
It’s only a real rise when volume picks up.
263
·
--
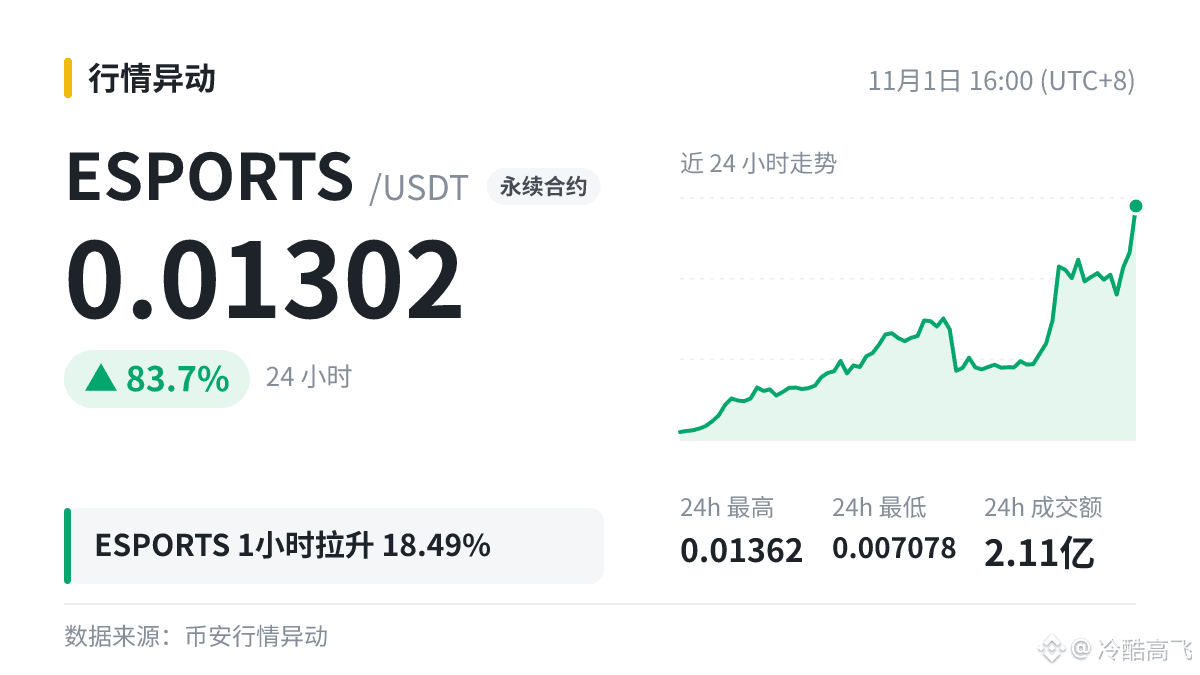
$ESPORTS 1 hours: up 18.49%, current price 0.01302, 24h range 0.007078 ~ 0.01362.
After a sharp move, the market usually enters a period of consolidation. The form of consolidation determines which direction the next move takes.
$ESPORTS 1 hours: up 18.49%, current price 0.01302, 24h range 0.007078 ~ 0.01362.
After a sharp move, the market usually enters a period of consolidation. The form of consolidation determines which direction the next move takes.
After a sharp move, the market usually enters a period of consolidation. The form of consolidation determines which direction the next move takes.
158
·
--
Price Level Notes | $JCT Breaks Through the 0.005 Threshold
Holding above the level for a while indicates that selling pressure is light—a much stronger sign than briefly breaking through and then falling back.
Price Level Notes | $JCT Breaks Through the 0.005 Threshold
Holding above the level for a while indicates that selling pressure is light—a much stronger sign than briefly breaking through and then falling back.
Holding above the level for a while indicates that selling pressure is light—a much stronger sign than briefly breaking through and then falling back.
86
·
--
$SOL The market-wide account long/short ratio is 3.1 (75.6% long / 24.4% short), compared with 3.09 an hour ago.
Let’s use this figure to talk about the market-wide account long/short ratio.
This data comes from Binance’s official futures statistics. It counts accounts and is updated every 5 minutes.
The long/short ratio only covers futures positions; spot buying and selling aren’t included, so any conclusions drawn about the entire market should be taken with a grain of salt.
It’s more reliable to look for confirmation across multiple indicators than to rely on just one, but even a collection of signals can’t provide a definitive conclusion.
$SOL The market-wide account long/short ratio is 3.1 (75.6% long / 24.4% short), compared with 3.09 an hour ago.
Let’s use this figure to talk about the market-wide account long/short ratio.
This data comes from Binance’s official futures statistics. It counts accounts and is updated every 5 minutes.
The long/short ratio only covers futures positions; spot buying and selling aren’t included, so any conclusions drawn about the entire market should be taken with a grain of salt.
It’s more reliable to look for confirmation across multiple indicators than to rely on just one, but even a collection of signals can’t provide a definitive conclusion.
Let’s use this figure to talk about the market-wide account long/short ratio.
This data comes from Binance’s official futures statistics. It counts accounts and is updated every 5 minutes.
The long/short ratio only covers futures positions; spot buying and selling aren’t included, so any conclusions drawn about the entire market should be taken with a grain of salt.
It’s more reliable to look for confirmation across multiple indicators than to rely on just one, but even a collection of signals can’t provide a definitive conclusion.
55
·
--
$SOPH Funding rate dropped to -0.113%
Shorts pay the funding fee, at an annualized rate of about 248%. Current price: 0.00142, down 36.04% over 24h.
Holding an oversized position through losses is the most common cause of liquidation. Like if you agree; if not, share your thoughts in the comments.
$SOPH Funding rate dropped to -0.113%
Shorts pay the funding fee, at an annualized rate of about 248%. Current price: 0.00142, down 36.04% over 24h.
Holding an oversized position through losses is the most common cause of liquidation. Like if you agree; if not, share your thoughts in the comments.
Shorts pay the funding fee, at an annualized rate of about 248%. Current price: 0.00142, down 36.04% over 24h.
Holding an oversized position through losses is the most common cause of liquidation. Like if you agree; if not, share your thoughts in the comments.
61
·
--
#币安神算子 Binance Oracle, huge free rewards—get started, don't miss out, daily check-in
#币安神算子 Binance Oracle, huge free rewards—get started, don't miss out, daily check-in

1
·
--
Trending plaza buzzword: “Assistance”
Popular content: 3 posts|Participants: 3+|Related views: 79,000
The most-mentioned coin in the discussion is $BNB , currently priced at 704.4 (24h +0.4%).
Trending plaza buzzword: “Assistance”
Popular content: 3 posts|Participants: 3+|Related views: 79,000
The most-mentioned coin in the discussion is $BNB , currently priced at 704.4 (24h +0.4%).
Popular content: 3 posts|Participants: 3+|Related views: 79,000
The most-mentioned coin in the discussion is $BNB , currently priced at 704.4 (24h +0.4%).
33
·
--
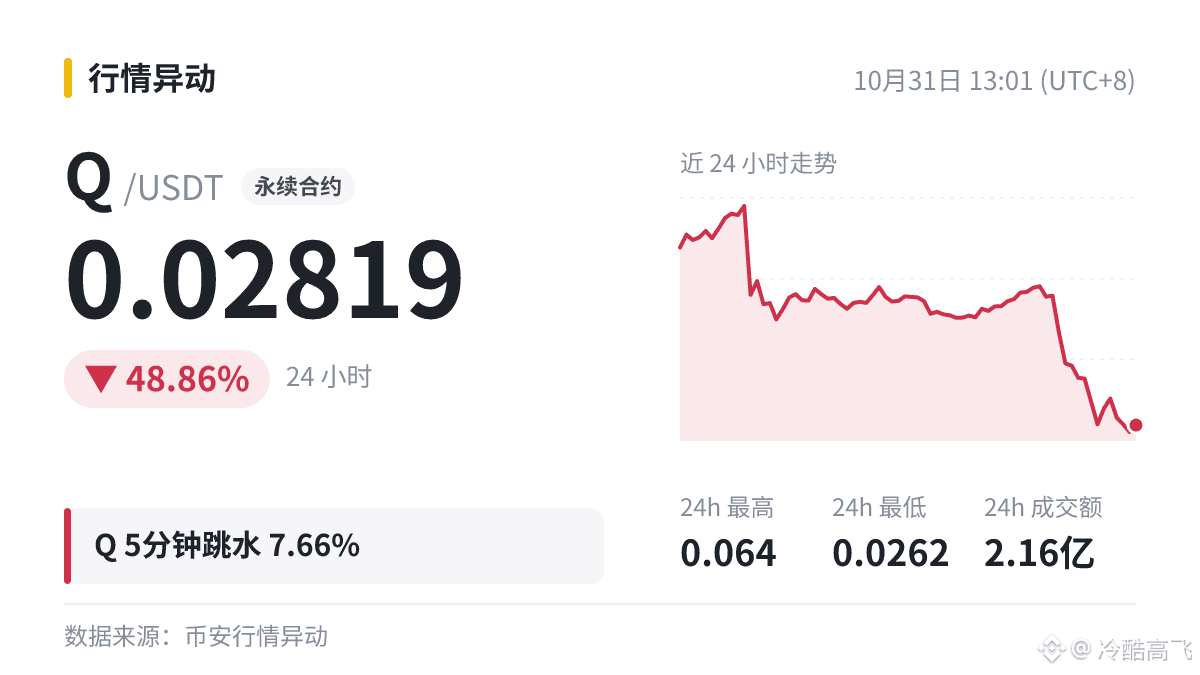
$Q 5 minutes -7.66%|1h -6.44%|24h -48.86%
Price 0.02819, 24h low 0.0262
In a weak market, the most important thing to watch is whether trading volume is shrinking.
#Q
$Q 5 minutes -7.66%|1h -6.44%|24h -48.86%
Price 0.02819, 24h low 0.0262
In a weak market, the most important thing to watch is whether trading volume is shrinking.
#Q
Price 0.02819, 24h low 0.0262
In a weak market, the most important thing to watch is whether trading volume is shrinking.
#Q
25
·
--
$AIN 5 minutes +3.19%, current price 0.2681. If you’re itching to chase, ask yourself three questions first:
① It still hasn’t broken above the 24h high of 0.2783—is the risk/reward still worth it?
② It’s already up +80.34% in 24h, and there are plenty of short-term holders. Can you stomach a pullback?
③ Do you have an exit plan?
Only make a move once you have answers to all three. If you haven’t thought it through, it’s better to let it pass.
A rapid rise doesn’t mean it can keep going; a healthy pace matters more.
$AIN 5 minutes +3.19%, current price 0.2681. If you’re itching to chase, ask yourself three questions first:
① It still hasn’t broken above the 24h high of 0.2783—is the risk/reward still worth it?
② It’s already up +80.34% in 24h, and there are plenty of short-term holders. Can you stomach a pullback?
③ Do you have an exit plan?
Only make a move once you have answers to all three. If you haven’t thought it through, it’s better to let it pass.
A rapid rise doesn’t mean it can keep going; a healthy pace matters more.
① It still hasn’t broken above the 24h high of 0.2783—is the risk/reward still worth it?
② It’s already up +80.34% in 24h, and there are plenty of short-term holders. Can you stomach a pullback?
③ Do you have an exit plan?
Only make a move once you have answers to all three. If you haven’t thought it through, it’s better to let it pass.
A rapid rise doesn’t mean it can keep going; a healthy pace matters more.
39
·
--
Volume–price relationship watch|$AIN
A one-year high + trading value 2.6 times the daily average technically counts as a “high-volume breakout.”
A new high on strong volume is more credible than one on shrinking volume, but an excessive surge in volume could also mean existing holders are using the opportunity to exit. Watch the next few days: can trading stay above the daily average, or will it quickly fall back?
Volume and price moving in sync only indicate probabilities—they don’t provide an answer.
Volume–price relationship watch|$AIN
A one-year high + trading value 2.6 times the daily average technically counts as a “high-volume breakout.”
A new high on strong volume is more credible than one on shrinking volume, but an excessive surge in volume could also mean existing holders are using the opportunity to exit. Watch the next few days: can trading stay above the daily average, or will it quickly fall back?
Volume and price moving in sync only indicate probabilities—they don’t provide an answer.
A one-year high + trading value 2.6 times the daily average technically counts as a “high-volume breakout.”
A new high on strong volume is more credible than one on shrinking volume, but an excessive surge in volume could also mean existing holders are using the opportunity to exit. Watch the next few days: can trading stay above the daily average, or will it quickly fall back?
Volume and price moving in sync only indicate probabilities—they don’t provide an answer.
61
·
--
$LUNA discussion snapshot:
Popular forum post: Personal opinion (10k+ views)
Sentiment: bearish
Keywords: bear market, hacked
$LUNA now 0.0403 (24h +6.9%)
$LUNA discussion snapshot:
Popular forum post: Personal opinion (10k+ views)
Sentiment: bearish
Keywords: bear market, hacked
$LUNA now 0.0403 (24h +6.9%)
Popular forum post: Personal opinion (10k+ views)
Sentiment: bearish
Keywords: bear market, hacked
$LUNA now 0.0403 (24h +6.9%)
105
·
--
#币安神算子 Binance's crypto oracle—claim big rewards for free! Get started now, don't miss out. Check in daily.
#币安神算子 Binance's crypto oracle—claim big rewards for free! Get started now, don't miss out. Check in daily.

3
·
--
$BTC Wait for an opportunity
$BTC Wait for an opportunity
冷酷高飞
·
--
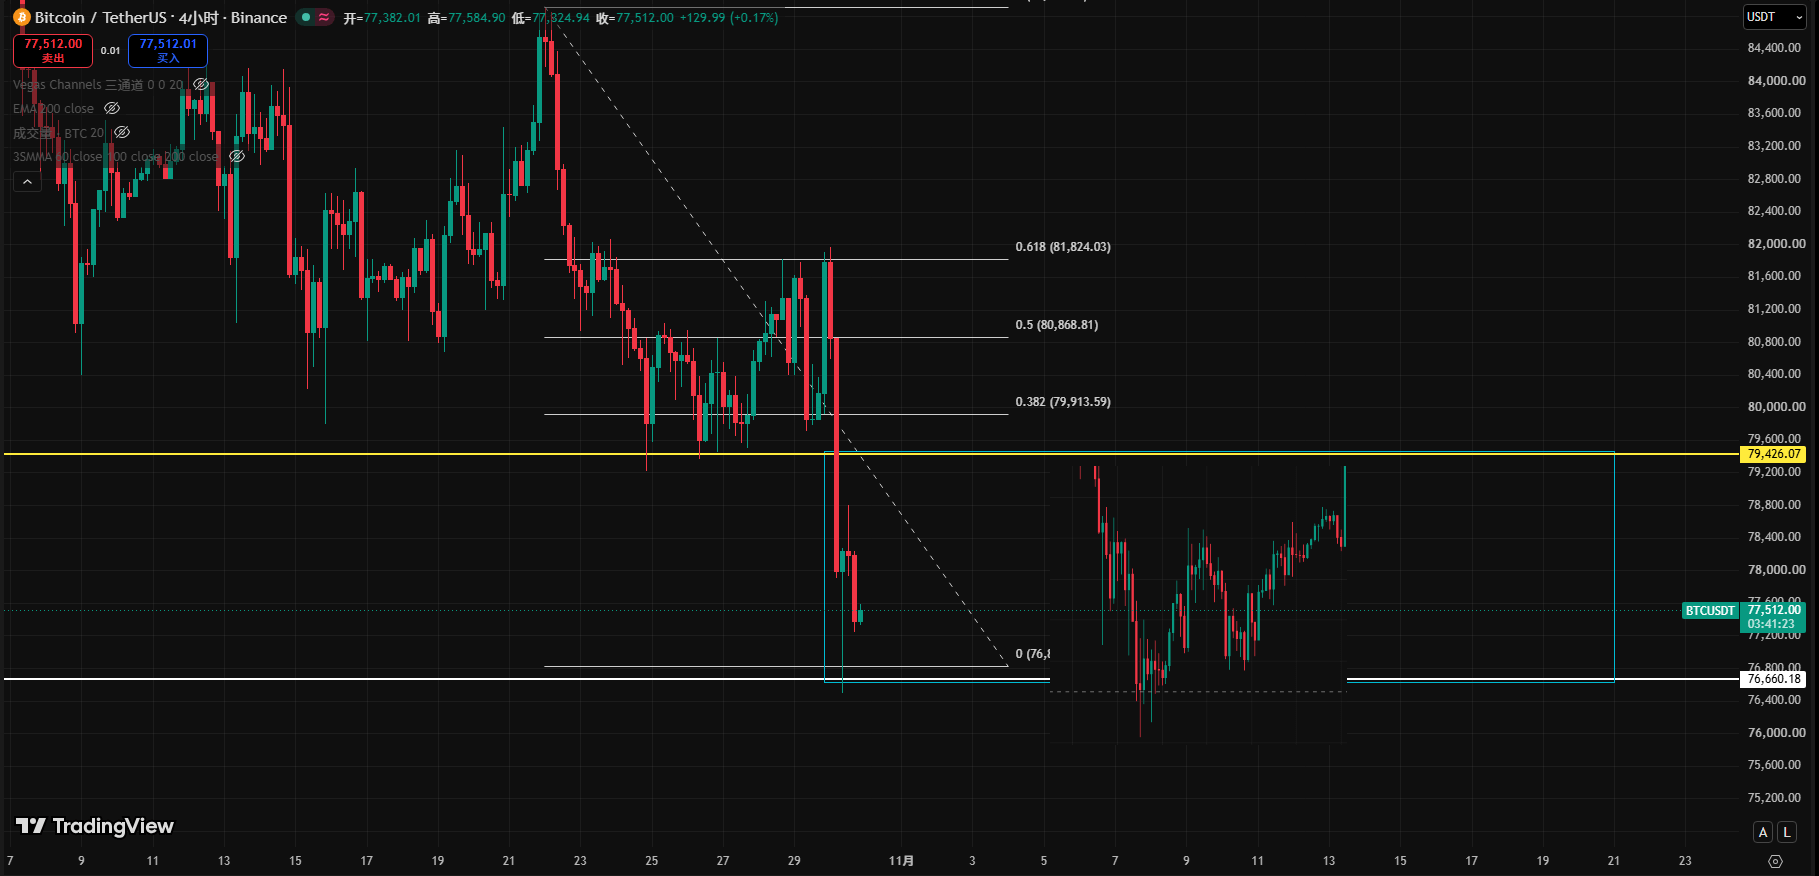
Bullish$BTC Will history repeat itself? The Binance hack caused a drop of only 5%—if this isn’t the start of a bull market, what is?
14
·
--
Bullish
$BTC Will history repeat itself? The Binance hack caused a drop of only 5%—if this isn’t the start of a bull market, what is?
{future}(BTCUSDT)
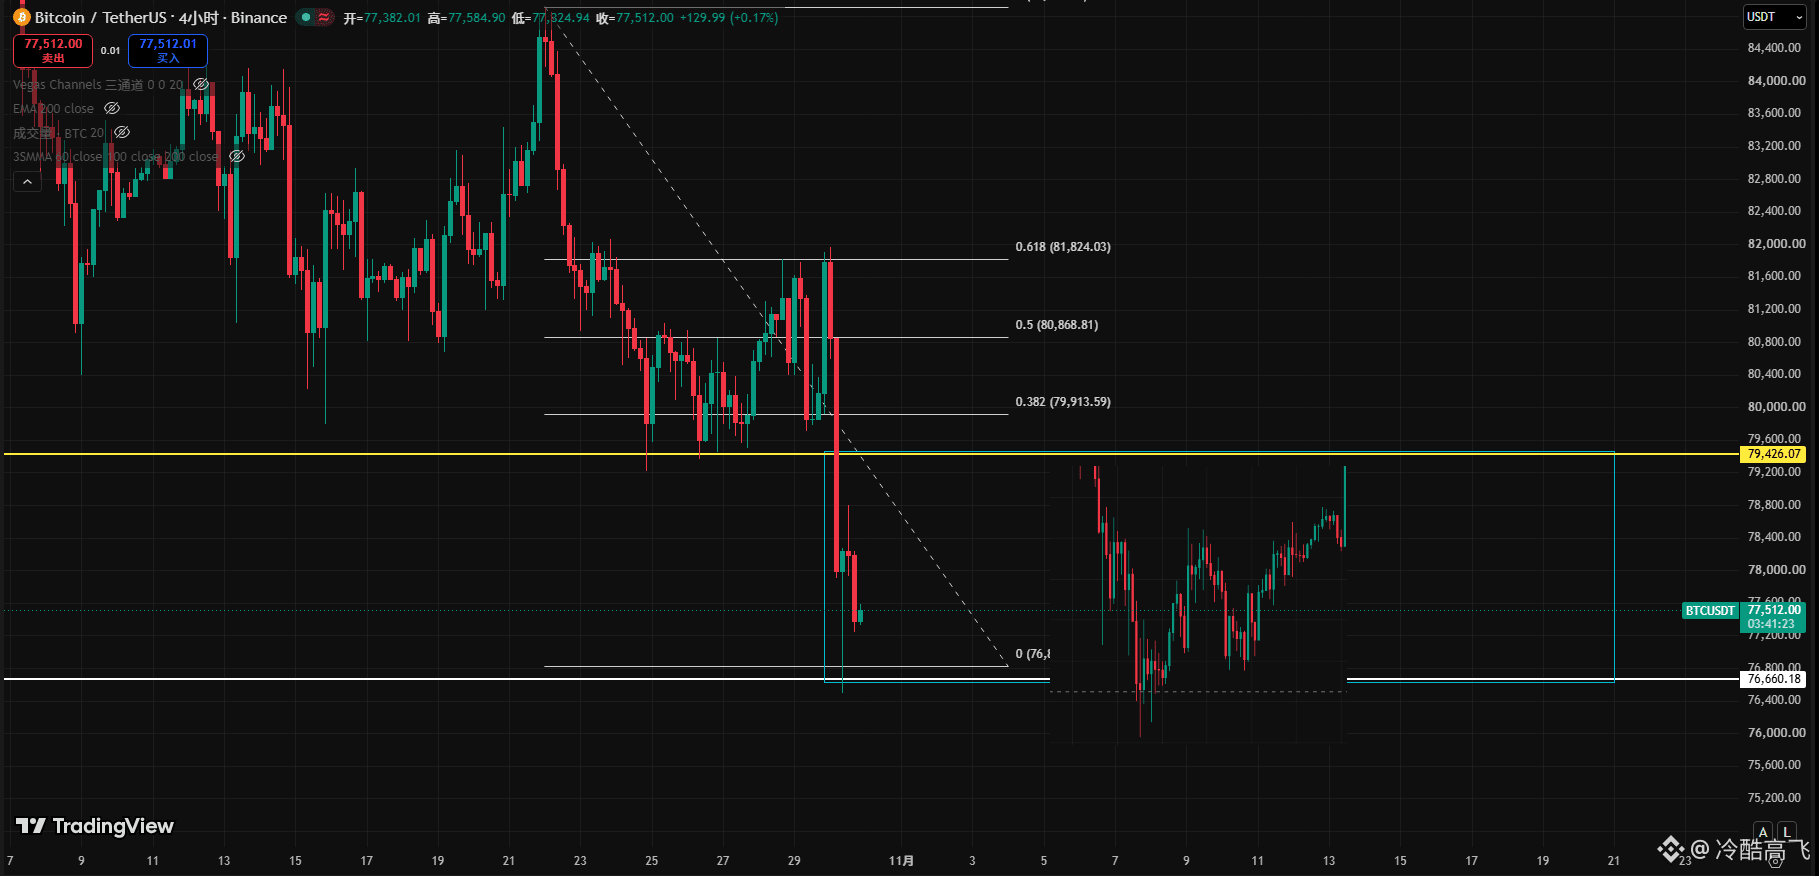
$BTC Will history repeat itself? The Binance hack caused a drop of only 5%—if this isn’t the start of a bull market, what is?
1
7
·
--
Fun fact: Today’s Binance hack is the biggest robbery in human history. The losses currently amount to as much as $6.1 billion.
Even more interesting: In a bear market, you’d expect a drop of at least 10%–20%, but so far it’s only down 5%.
Over the same period, Google is down 10% and Intel is down 25%. Tech stocks are getting hammered, while crypto seems to be holding up a little better.
And today’s options max pain is 78,000. What a coincidence.
Fun fact: Today’s Binance hack is the biggest robbery in human history. The losses currently amount to as much as $6.1 billion.
Even more interesting: In a bear market, you’d expect a drop of at least 10%–20%, but so far it’s only down 5%.
Over the same period, Google is down 10% and Intel is down 25%. Tech stocks are getting hammered, while crypto seems to be holding up a little better.
And today’s options max pain is 78,000. What a coincidence.
Even more interesting: In a bear market, you’d expect a drop of at least 10%–20%, but so far it’s only down 5%.
Over the same period, Google is down 10% and Intel is down 25%. Tech stocks are getting hammered, while crypto seems to be holding up a little better.
And today’s options max pain is 78,000. What a coincidence.
GOOGUS-0.86%
8
·
--
$Q |1 hour -23.83%|0.04691
The first rebound after a drop is the most critical: a weak rebound means buying pressure is still weak; recovering most of the losses is a sign of finding a floor.
#Q
$Q |1 hour -23.83%|0.04691
The first rebound after a drop is the most critical: a weak rebound means buying pressure is still weak; recovering most of the losses is a sign of finding a floor.
#Q
The first rebound after a drop is the most critical: a weak rebound means buying pressure is still weak; recovering most of the losses is a sign of finding a floor.
#Q
32
·
--
The numbers speak for themselves: $Q 5 minutes -7.55%, current price 0.05672; 24h range 0.03518 ~ 0.064.
The price is still within the 24h range, with some distance left to the low.
Do you have this?
The numbers speak for themselves: $Q 5 minutes -7.55%, current price 0.05672; 24h range 0.03518 ~ 0.064.
The price is still within the 24h range, with some distance left to the low.
Do you have this?
The price is still within the 24h range, with some distance left to the low.
Do you have this?
31
·
--
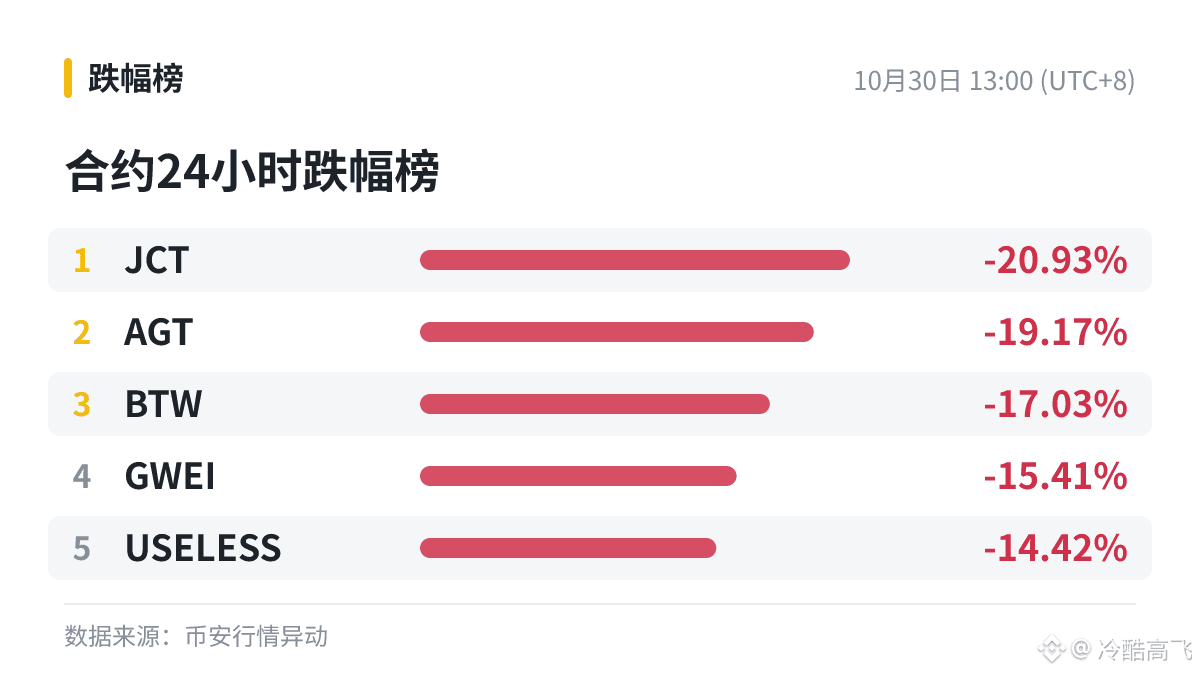
Now | Top 5 biggest 24-hour decliners in futures: biggest drop $JCT -20.93%
1) $JCT -20.93%
2) $AGT -19.17%
3) $BTW -17.03%
4) GWEI -15.41%
5) USELESS -14.42%
Now | Top 5 biggest 24-hour decliners in futures: biggest drop $JCT -20.93%
1) $JCT -20.93%
2) $AGT -19.17%
3) $BTW -17.03%
4) GWEI -15.41%
5) USELESS -14.42%
1) $JCT -20.93%
2) $AGT -19.17%
3) $BTW -17.03%
4) GWEI -15.41%
5) USELESS -14.42%
45
·
--
A trending post on the plaza right now about $Q : tens of thousands of views, 11 comments, sentiment is bearish.
$Q current price: 0.04582 (24h -30.99%).
A trending post on the plaza right now about $Q : tens of thousands of views, 11 comments, sentiment is bearish.
$Q current price: 0.04582 (24h -30.99%).
$Q current price: 0.04582 (24h -30.99%).
64
Log in to explore more content
Join global crypto users on Binance Square
⚡️ Get latest and useful information about crypto.
💬 Trusted by the world’s largest crypto exchange.
👍 Discover real insights from verified creators.
Email / Phone number
Trending Topics
BinanceProcesses$4.65BWithdrawals
913 views
28 Discussing
Binance Processes $4.65 Billion in Withdrawals After Reopening, Net Outflow of $3.64 Billion Equals 2.1% of Its $171 Billion in Assets
Binance News
·15 Likes
·4.6k views
WithdrawalsBack: 15 networks live
3,312 views
82 Discussing
BinanceUpdatesProofofReservesAddresses
71,471 views
1,173 Discussing