

江晨论币
310 Posts

江晨论币
Report
Block User
公众蚝(江晨论币)盘面机会稍纵即逝,与其独自踩坑试错,不如紧跟趋势节奏。
4 Following
1.0K+ Followers
853 Liked
Posts
PINNED

·
--
10.27 Morning BTC and ETH Market Analysis
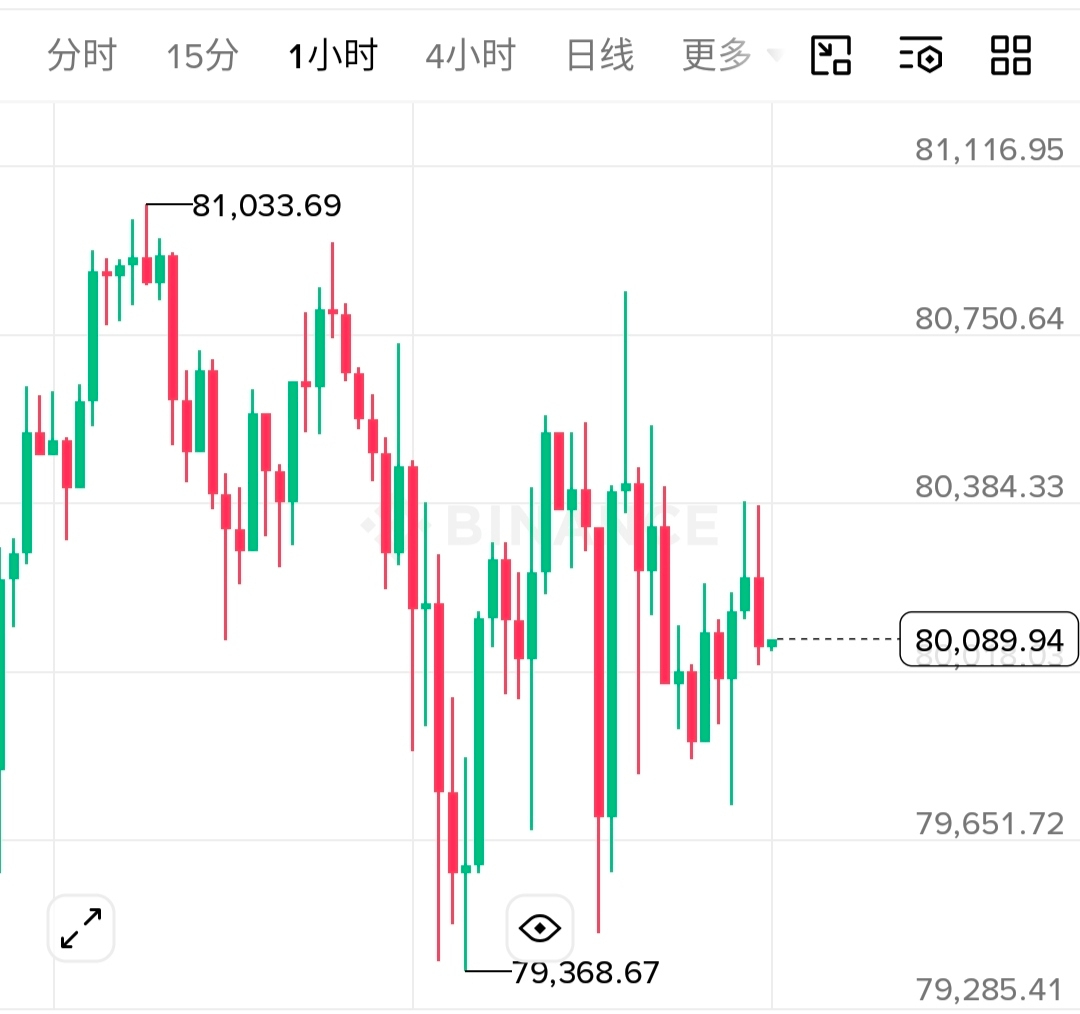
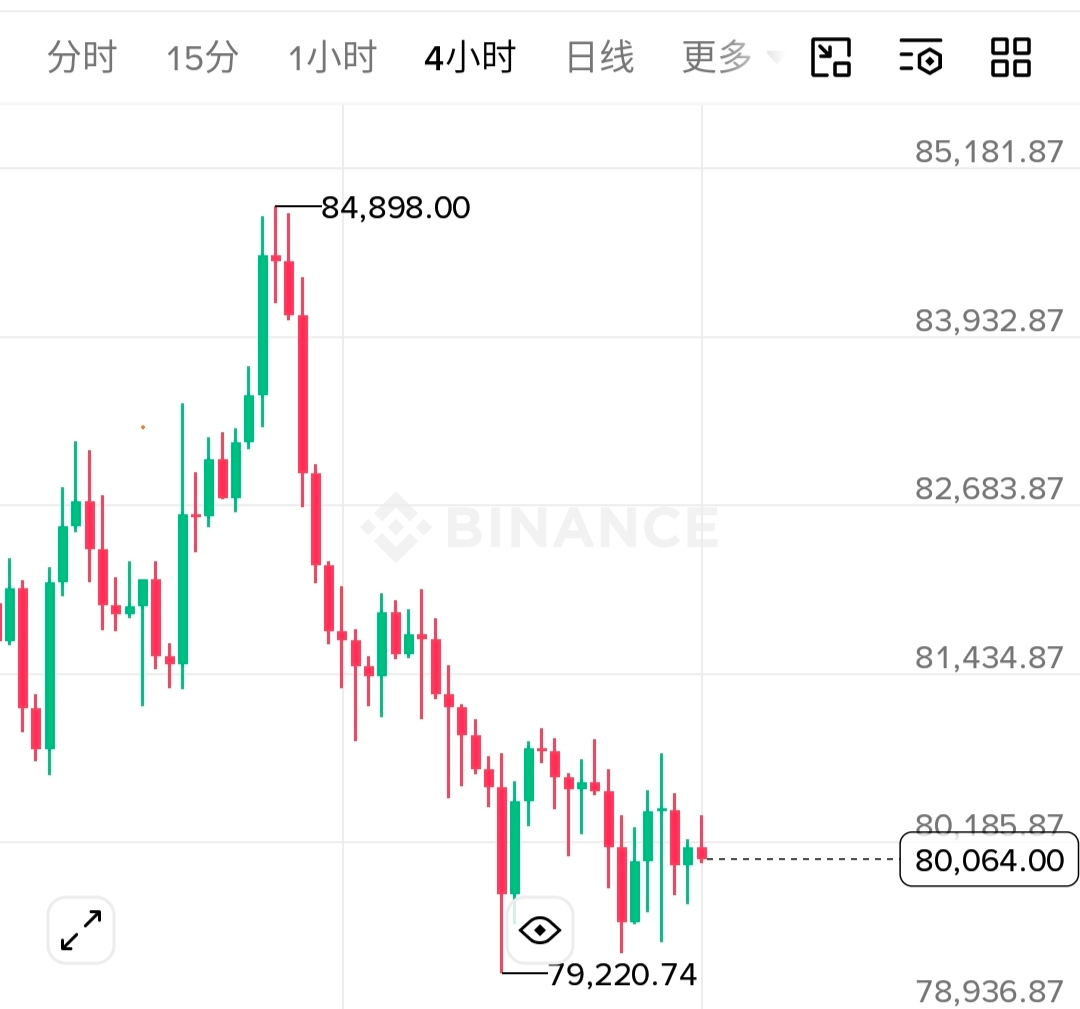
The market is currently moving sideways in a fairly tight range. After BTC bottomed near 79,220 earlier, it did not continue weakening. Instead, it steadied and entered a tug-of-war with the bears within the broad 80,000–81,000 range.
On the 4-hour chart, the market found fairly solid support after dropping to around 79,220, then rebounded. Although it encountered resistance and pulled back when testing around 81,097, the overall price level has not continued to move lower.
Looking at the 1-hour chart, recent candlesticks have frequently shown long upper and lower wicks, with bullish and bearish candles alternating. This indicates significant disagreement between buyers and sellers within the local range, with insufficient momentum for a one-way breakout. The market remains caught in a repeated tug-of-war.
Taking both time frames into account, the current price is hovering around 80,336, above the midpoint of the range. Overall, the market is mainly consolidating, but in the contest between buyers and sellers, the bulls are defending key support levels more actively. The market is showing a choppy but slightly bullish pattern.
BTC: Go long around 80,000, with a target of 81,000
ETH: Go long around 2,300, with a target of 2350$BTC $ETH $ZEC
1
33
·
--
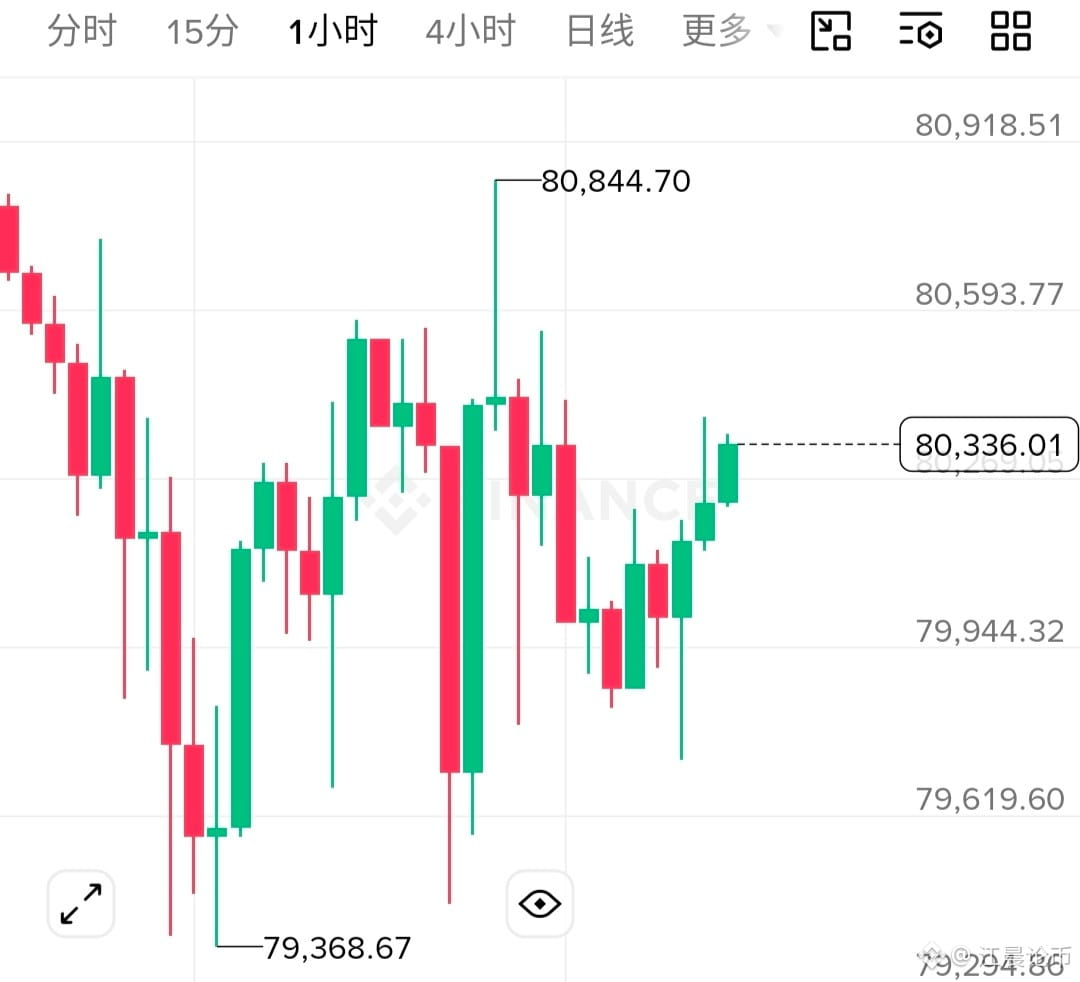
Bitcoin is currently showing a classic wide-ranging pattern. After falling to find support near 79368, the price rebounded and then moved up to test the area around 80844, where it met resistance and pulled back. For now, the price is confined to a range of nearly 1,500 points.
Recent candlestick patterns show frequent upper and lower wicks, with bullish and bearish candles alternating. This indicates a clear tug-of-war between buyers and sellers within the range, with little momentum for a breakout in either direction. Bitcoin is currently trading slightly above the midpoint of the range, with roughly equal room to move up or down.
This is a typical range-bound market. Consider selling near the top and buying near the bottom of the range, or wait patiently for a confirmed breakout at either boundary. $BTC $ZEC $ETH #Anthropic滚动12个月营收增长约1200%
1
49
·
--
10.26 Morning BTC and ETH Analysis
Good Monday morning, everyone! The market has been pretty frustrating over the past two days. After Bitcoin dipped to 79,178, it hasn’t managed a decent rebound and has just been bouncing around between 80,000 and 81,000. Resistance above is like a brick wall; the price has tested it several times without holding. Now it’s aggressively testing the 80,000 level again.
Looking at the current chart, the broader downtrend is pretty clear. For now, we’re in a sideways consolidation phase within a continuing downtrend. The daily chart has closed lower for several sessions, with each high lower than the last, making the weakness obvious. Unless we see consecutive strong bullish candles, this correction will likely have further room to extend downward. The decline on the 4-hour chart has been steady, and each rebound has topped out lower. With support at 80,200 broken, the path lower has opened up. On the 1-hour chart, a small M-shaped double top has formed near the lows, with the neckline at 80,000. If the price breaks below it decisively and fails to reclaim it on a rebound, it will likely retest the previous low.
For trading, price is now too close to the previous low, so don’t stubbornly chase shorts. It may be better to wait for a rebound and look to short near resistance. If the market doesn’t even offer a rebound and breaks straight through the previous low, you can follow the move.
Bitcoin: Look to short a rebound into the 81,000 area if it meets resistance; targets: 79,100 → 78,800.
Ethereum: Look to short a rebound into the 2,330–2,355 area if it meets resistance; targets: 2,281 → 2,220$BTC $ZEC $ETH #股票财报季
1
96
·
--
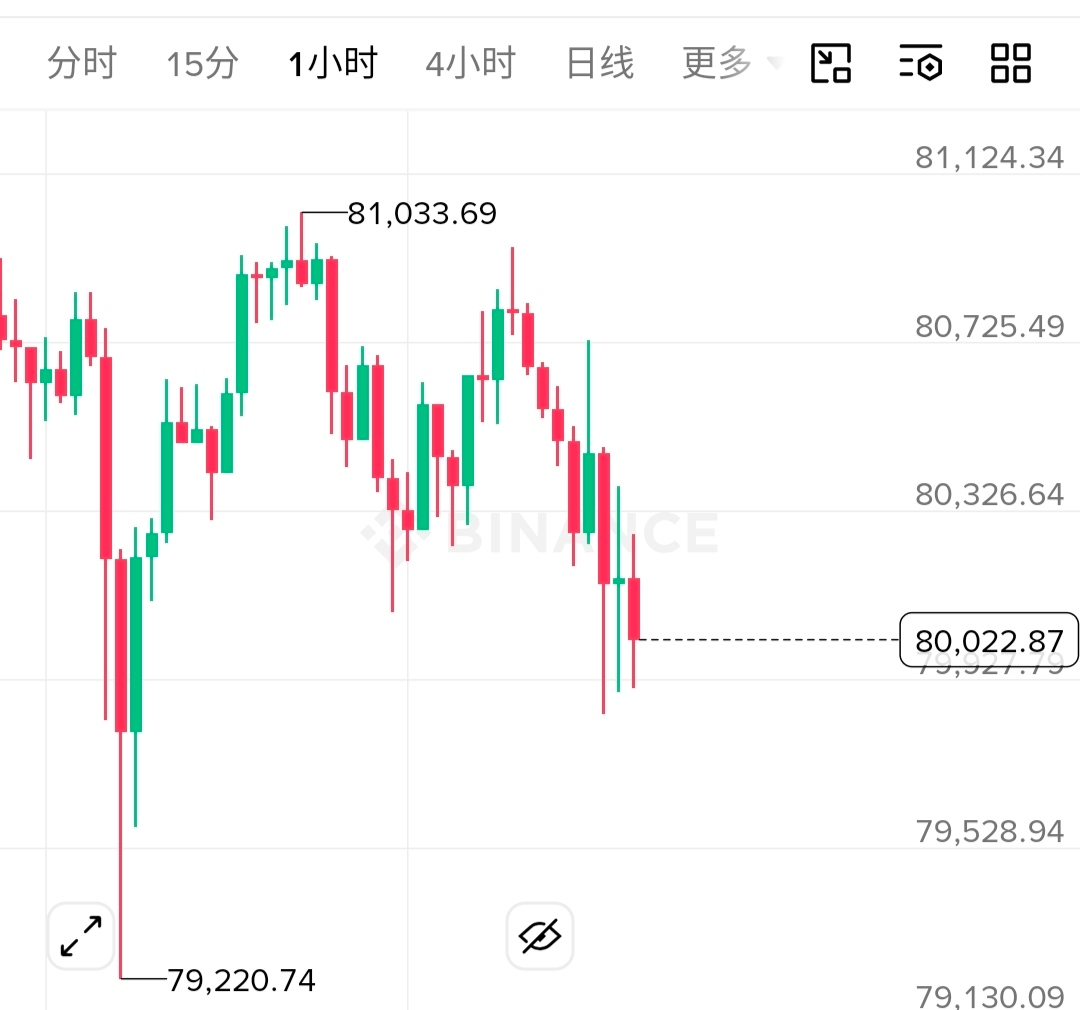
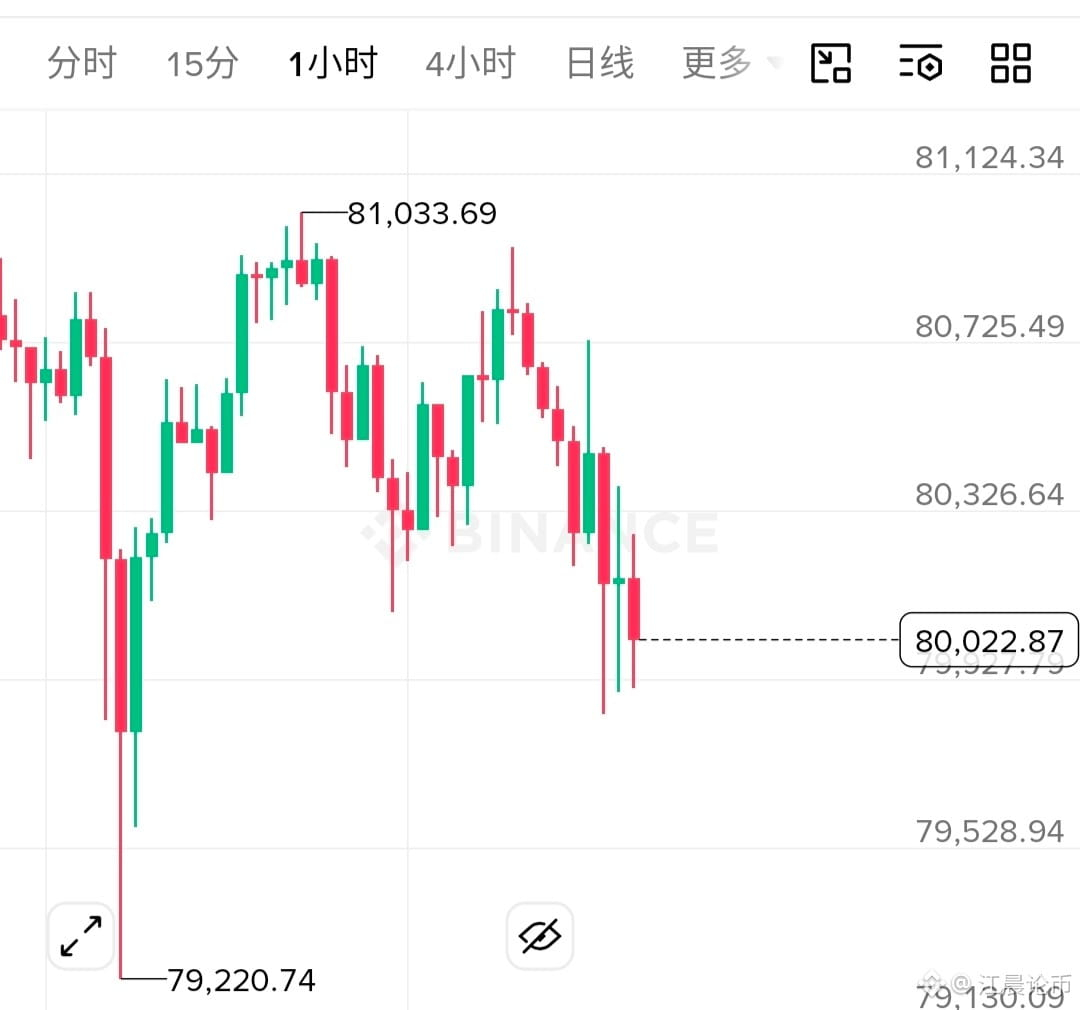
The current market structure is actually quite clear. After falling from the previous high of 81033, the bullish structure was broken, and the market moved into a standard downward-sloping consolidation channel. The long lower wick at 79220 flushed out a wave of longs below. The price is now around 80022, right at the key psychological threshold of 80,000. The 80300–80700 range above forms a strong short-term resistance zone. Momentum behind the current rebound is clearly insufficient, and the bearish alignment continues to weigh on the market.
There is currently a major split between bulls and bears across the market. You could wait for another test of support near 79000, or consider following the trend if the price can truly hold above the resistance level.$BTC $ZEC $ETH #Electrum修复4.8.3前版本高危漏洞
There is currently a major split between bulls and bears across the market. You could wait for another test of support near 79000, or consider following the trend if the price can truly hold above the resistance level.$BTC $ZEC $ETH #Electrum修复4.8.3前版本高危漏洞
1
134
·
--
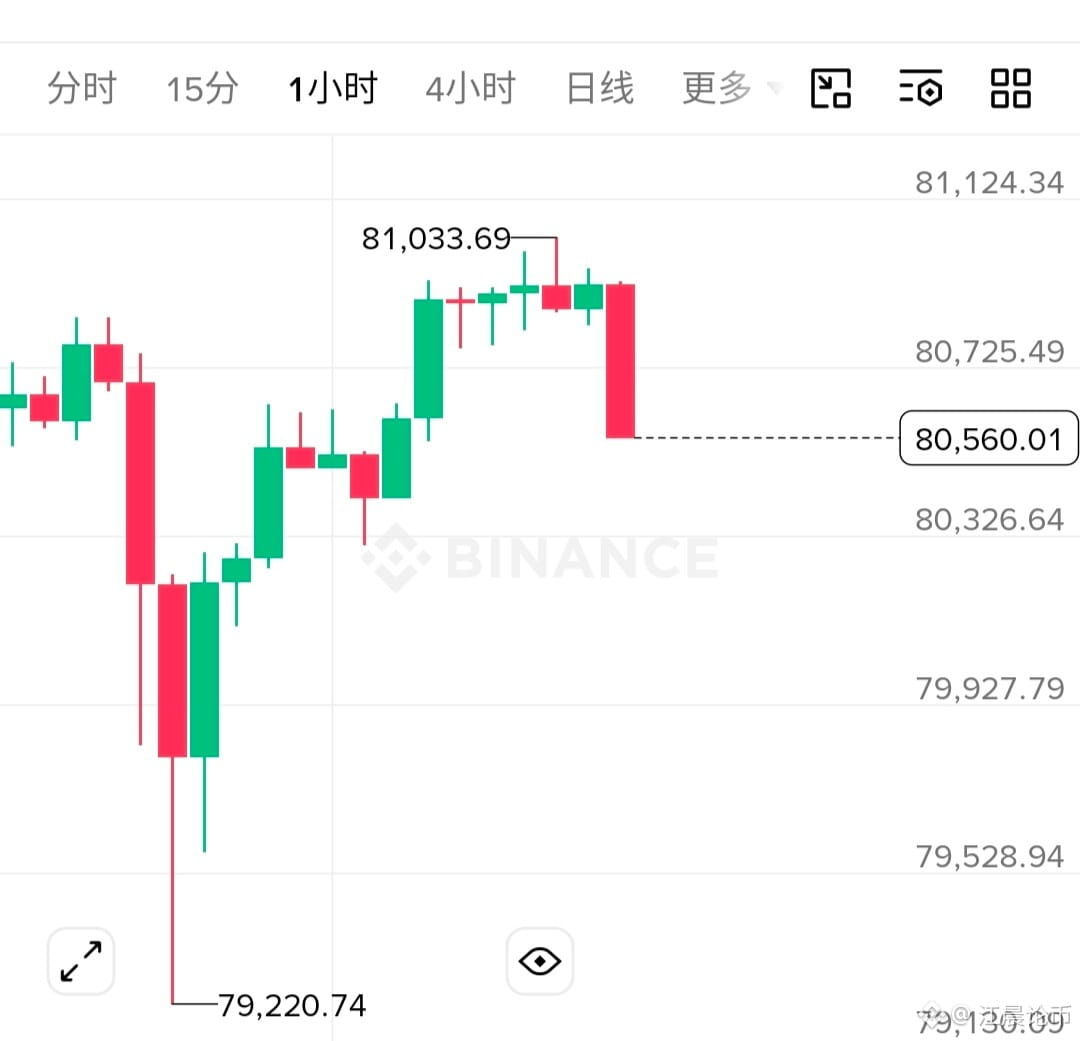
Yesterday, after hitting a low around 7920, the market staged a strong rebound. On the 1-hour chart, bulls posted several consecutive green candles and pushed the price all the way up to a high of 81033. However, the price clearly failed to hold after rising, and was pushed back down near 80560. It closed with a large bearish candle, giving back most of the earlier gains, which shows that selling pressure overhead remains quite strong. For support below, the key level is still around 79200, near the low marked by yesterday’s long lower wick. This bearish candle has now sent the price straight back to the middle of the range, so the short-term outlook is a choppy shakeout amid intense tussling between bulls and bears.
In the short term, keep an eye on the 80000 round-number level and support around 79200. If the price holds at these levels, you could try a small position to catch a rebound. To the upside, watch whether the price can test the 81000 resistance again. $BTC $ETH $ZEC #股票财报季
In the short term, keep an eye on the 80000 round-number level and support around 79200. If the price holds at these levels, you could try a small position to catch a rebound. To the upside, watch whether the price can test the 81000 resistance again. $BTC $ETH $ZEC #股票财报季
1
129
·
--
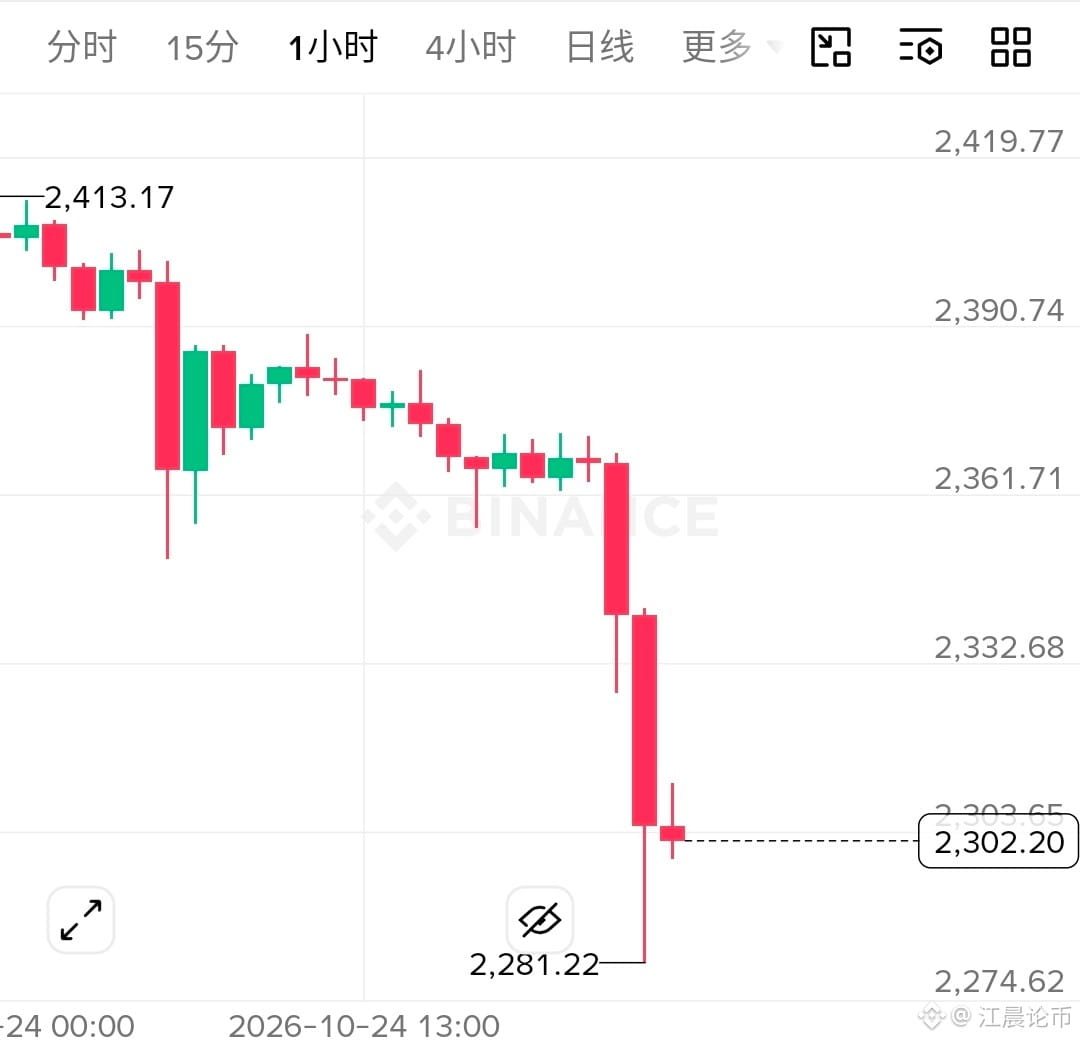
ETH's 1-hour chart has been brutal. After sliding steadily from 2413, I thought support might form around 2360, but two straight bearish candles sliced right through it, with a sharp wick down to 2281. It's now barely catching its breath around 2302, and the previous consolidation range has been completely smashed. This extreme sell-off is essentially a cascade of liquidations triggered by leveraged positions. Put simply, the earlier sideways trading was a bull trap: after luring in long positions, once a key level broke, stop-loss orders and forced liquidations flooded in all at once, leaving the market in a one-way long squeeze with virtually no resistance.
Now the question is whether the 2280–2300 range can hold and bring selling volume down. If it breaks decisively, there could be further downside; even if there's a rebound, it's most likely to be just a technical correction.$BTC $ZEC $ETH #股票财报季
Now the question is whether the 2280–2300 range can hold and bring selling volume down. If it breaks decisively, there could be further downside; even if there's a rebound, it's most likely to be just a technical correction.$BTC $ZEC $ETH #股票财报季
1
72
·
--
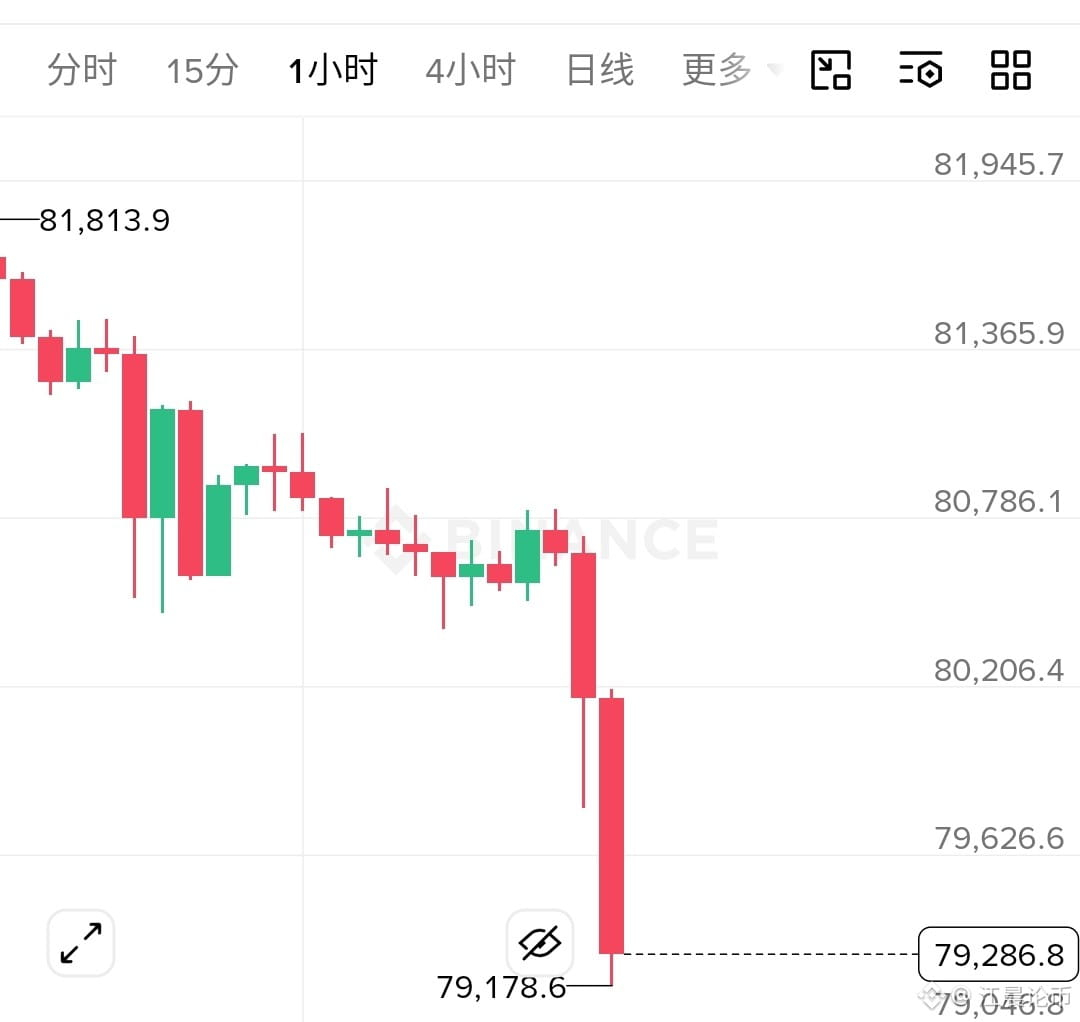
Another black swan event? A cascade of blows on the 1-hour chart has smashed straight through the bulls’ psychological support.
The 1-hour market has just experienced an extremely sharp shakeout. What began as a choppy decline eventually turned into panic selling. Two massive bearish candles broke straight through support around 80,200, with the low wick reaching 79,178.
This one-way plunge, with virtually no resistance, shows that the short-term balance between bulls and bears has been completely shattered. Market sentiment shifted in an instant from hesitation and indecision to extreme panic, as stop-loss orders and liquidation orders poured out all at once.
The key now is to watch whether the round-number level of 79,000 can provide effective support and stability. If it fails to hold, there will be more room for the market to fall. Even if a rebound occurs, it will most likely be a technical recovery after being oversold. In the short term, the market needs time to absorb this huge bearish candle. The best approach is to watch more and trade less, waiting for a clear signal from the right side of the chart before making any decisions. $BTC $ZEC $ETH
1
94
·
--
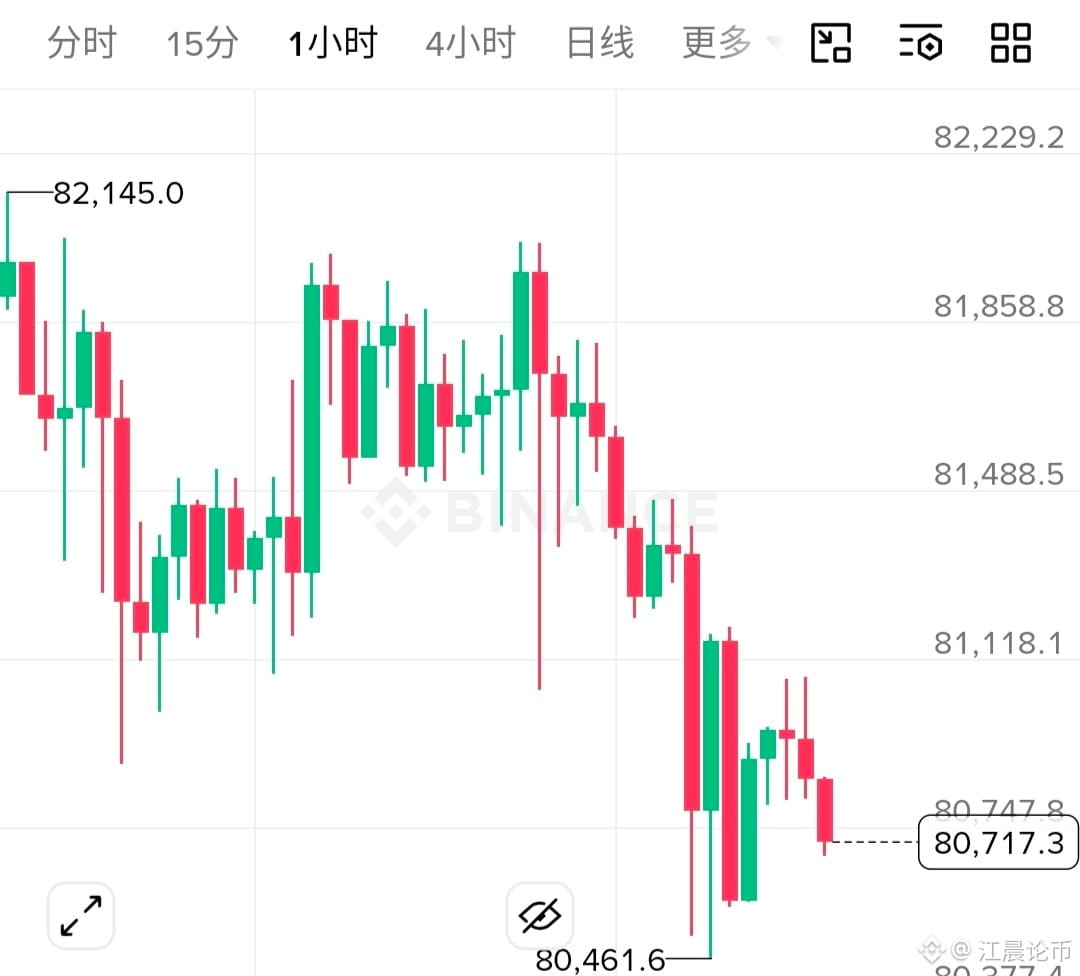
Bitcoin is still moving through a slow downward drift, but the current price has once again approached the previous low. Looking at the chart structure, a technical rebound often follows repeated tests of lower levels. The candlestick chart shows that after dipping to a low of 80,461, the price quickly bounced back, leaving a relatively long lower wick. This indicates clear buying support near the psychological 80,000 level. Meanwhile, the price is currently right around the lower Bollinger Band, which is providing support for now. The key thing to watch next is whether the price can rely on this support to stage a corrective rebound toward the middle Bollinger Band. $BTC $ETH $ZEC #币安神算子 #股票财报季
Bitcoin is still moving through a slow downward drift, but the current price has once again approached the previous low. Looking at the chart structure, a technical rebound often follows repeated tests of lower levels. The candlestick chart shows that after dipping to a low of 80,461, the price quickly bounced back, leaving a relatively long lower wick. This indicates clear buying support near the psychological 80,000 level. Meanwhile, the price is currently right around the lower Bollinger Band, which is providing support for now. The key thing to watch next is whether the price can rely on this support to stage a corrective rebound toward the middle Bollinger Band. $BTC $ETH $ZEC #币安神算子 #股票财报季
1
145
·
--
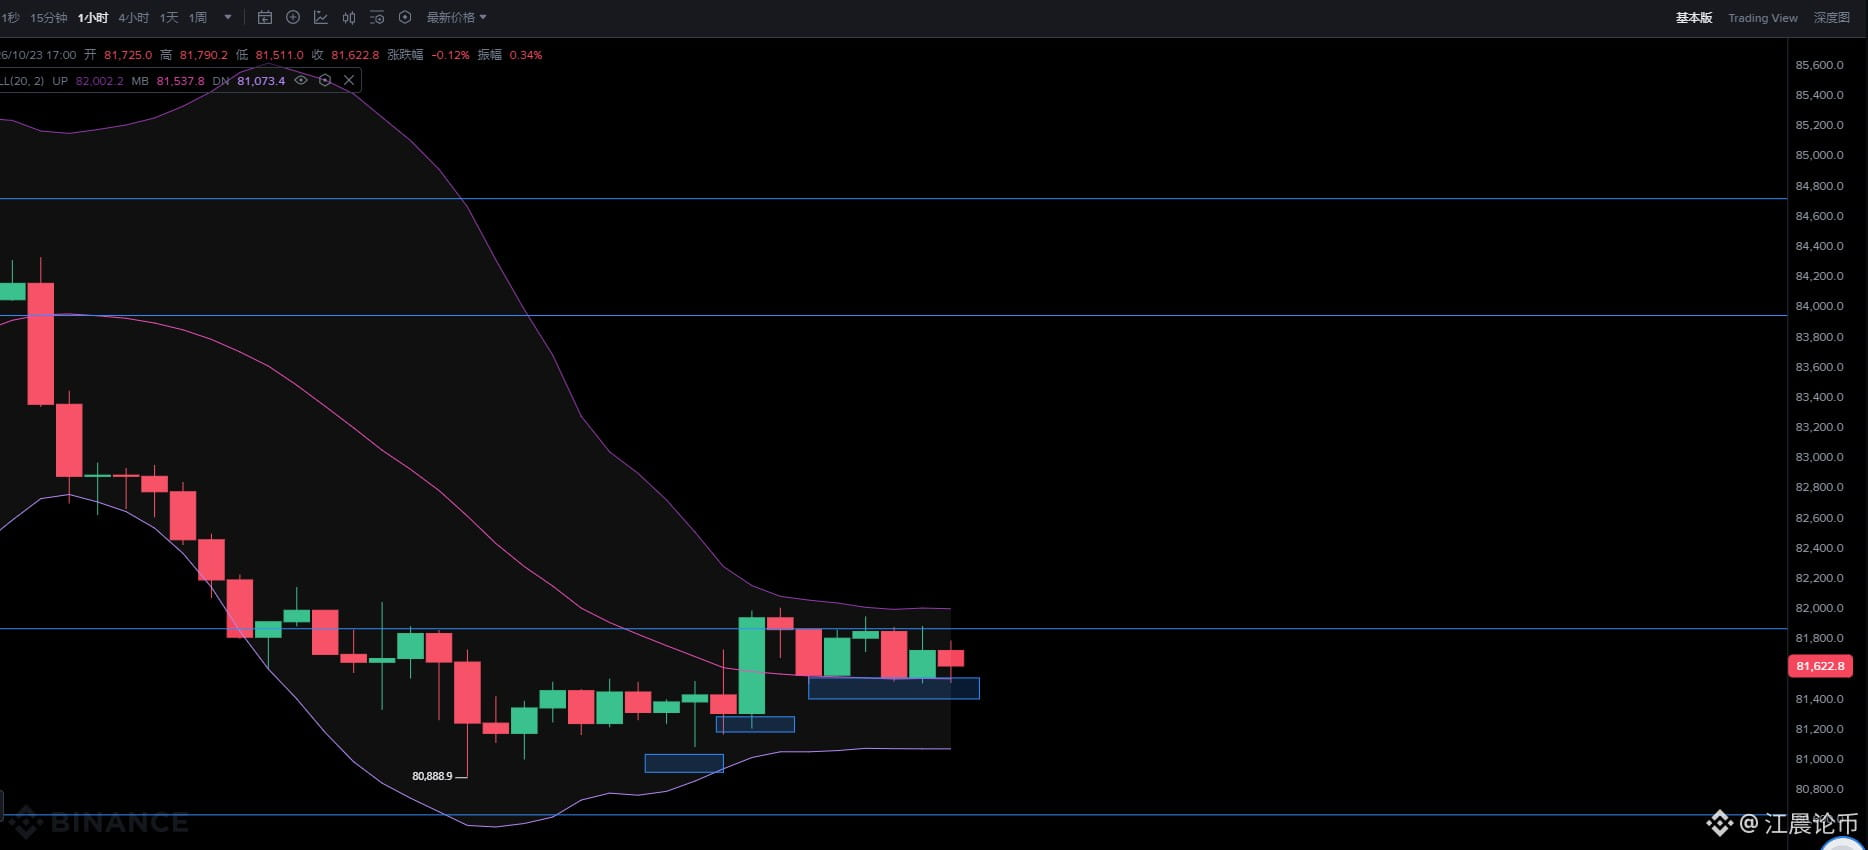
Bitcoin is currently in a typical high-level consolidation phase. After bottoming at 80,888 earlier, it surged sharply but failed to sustain its upward momentum and is now stuck in a narrow range. The current price is around 81,622, with buyers and sellers repeatedly battling it out as the market consolidates profit-taking.
Technically, the Bollinger Bands are showing a classic pattern. The price is currently trading between the middle band at 81,537 and the upper band at 82,002, in a strong zone, with the middle band acting as dynamic short-term support. The chart shows major support in the 81,200–81,400 range below, while 82,000–82,200 is a dense resistance zone from earlier. The Bollinger Bands are now narrowing; the longer the consolidation lasts, the closer a major move may be. Avoid blindly chasing rises or selling into declines near the end of the consolidation. The strategy is to watch more and trade less, waiting for a breakout signal. If the price breaks above 82,200 resistance on strong volume, consider following the trend. If it pulls back, pay close attention to the 81,200–81,400 support zone; if it stabilizes, consider a small long position. If it breaks below the middle-band support, beware of a second test of the lows.$BTC $ETH $ZEC
Technically, the Bollinger Bands are showing a classic pattern. The price is currently trading between the middle band at 81,537 and the upper band at 82,002, in a strong zone, with the middle band acting as dynamic short-term support. The chart shows major support in the 81,200–81,400 range below, while 82,000–82,200 is a dense resistance zone from earlier. The Bollinger Bands are now narrowing; the longer the consolidation lasts, the closer a major move may be. Avoid blindly chasing rises or selling into declines near the end of the consolidation. The strategy is to watch more and trade less, waiting for a breakout signal. If the price breaks above 82,200 resistance on strong volume, consider following the trend. If it pulls back, pay close attention to the 81,200–81,400 support zone; if it stabilizes, consider a small long position. If it breaks below the middle-band support, beware of a second test of the lows.$BTC $ETH $ZEC
1
19
·
--
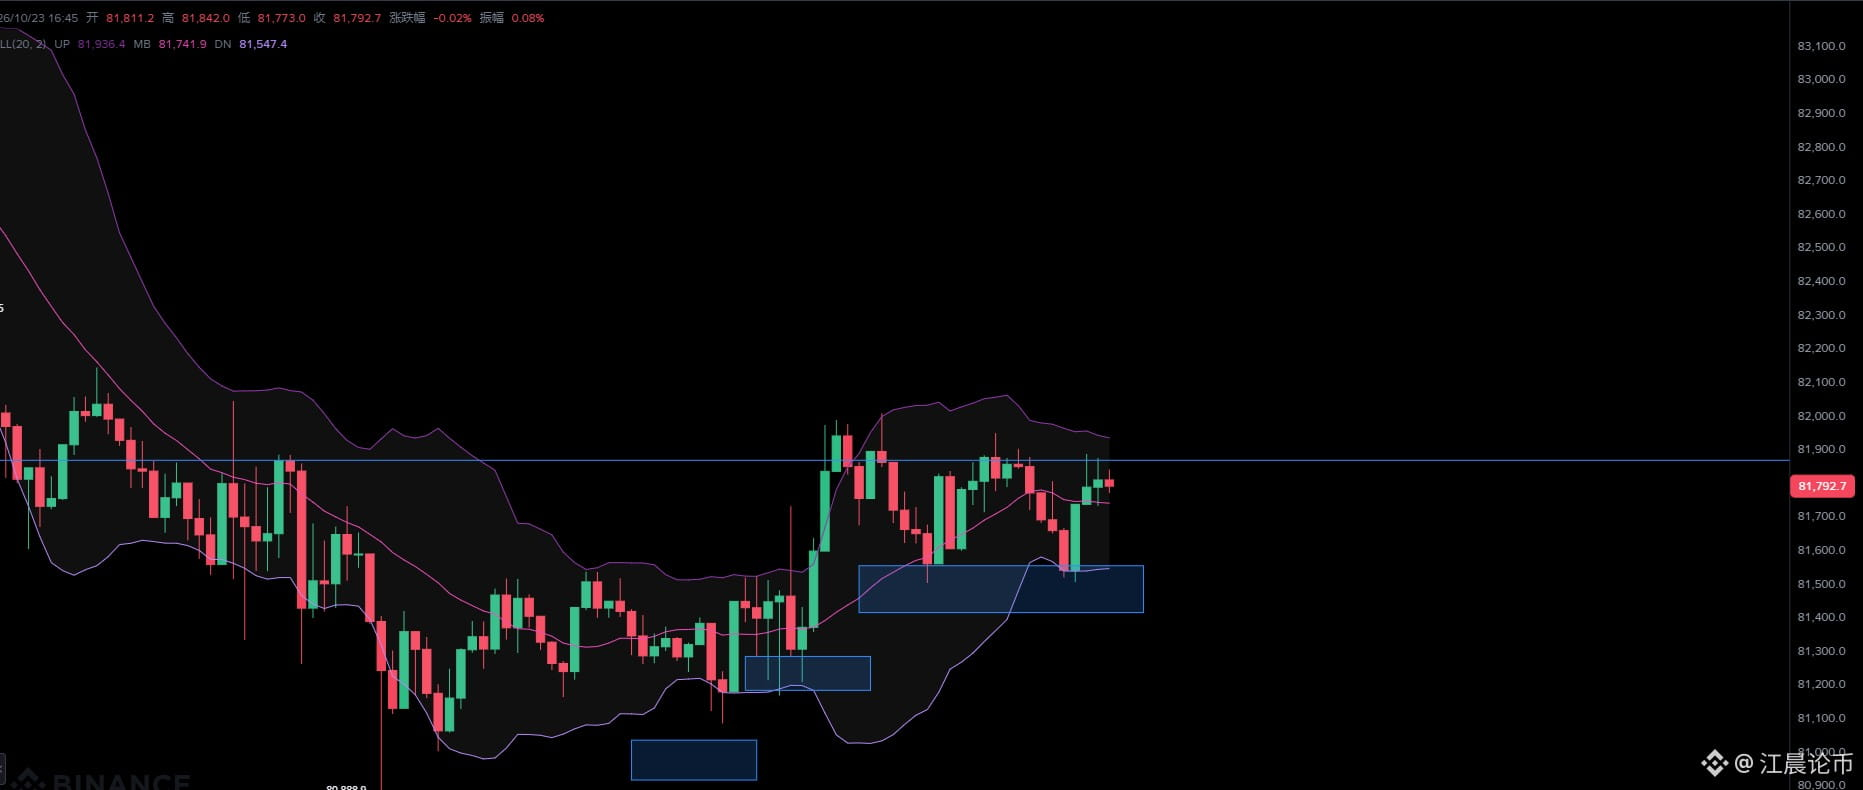
Short-term traders are most vulnerable to getting whipsawed when they chase rallies and sell into dips. Take a look at Bitcoin’s current short-term trend: the market is showing a clear sign of strength, with lows steadily moving higher. Each pullback is finding support at a progressively higher level.
Since the short-term base is gradually rising, the strategy for the near term is becoming clearer. At this point, blindly opening short positions is clearly not a good idea. It may be better to wait for a pullback to the support zone below and look for an opportunity there. Looking upward, around 81,900 is a key resistance level. For now, be patient, manage your position size, and always use a stop-loss. There’s no rush to act before the direction becomes clear. $BTC $ETH $ZEC #股票财报季
Since the short-term base is gradually rising, the strategy for the near term is becoming clearer. At this point, blindly opening short positions is clearly not a good idea. It may be better to wait for a pullback to the support zone below and look for an opportunity there. Looking upward, around 81,900 is a key resistance level. For now, be patient, manage your position size, and always use a stop-loss. There’s no rush to act before the direction becomes clear. $BTC $ETH $ZEC #股票财报季
1
12
·
--
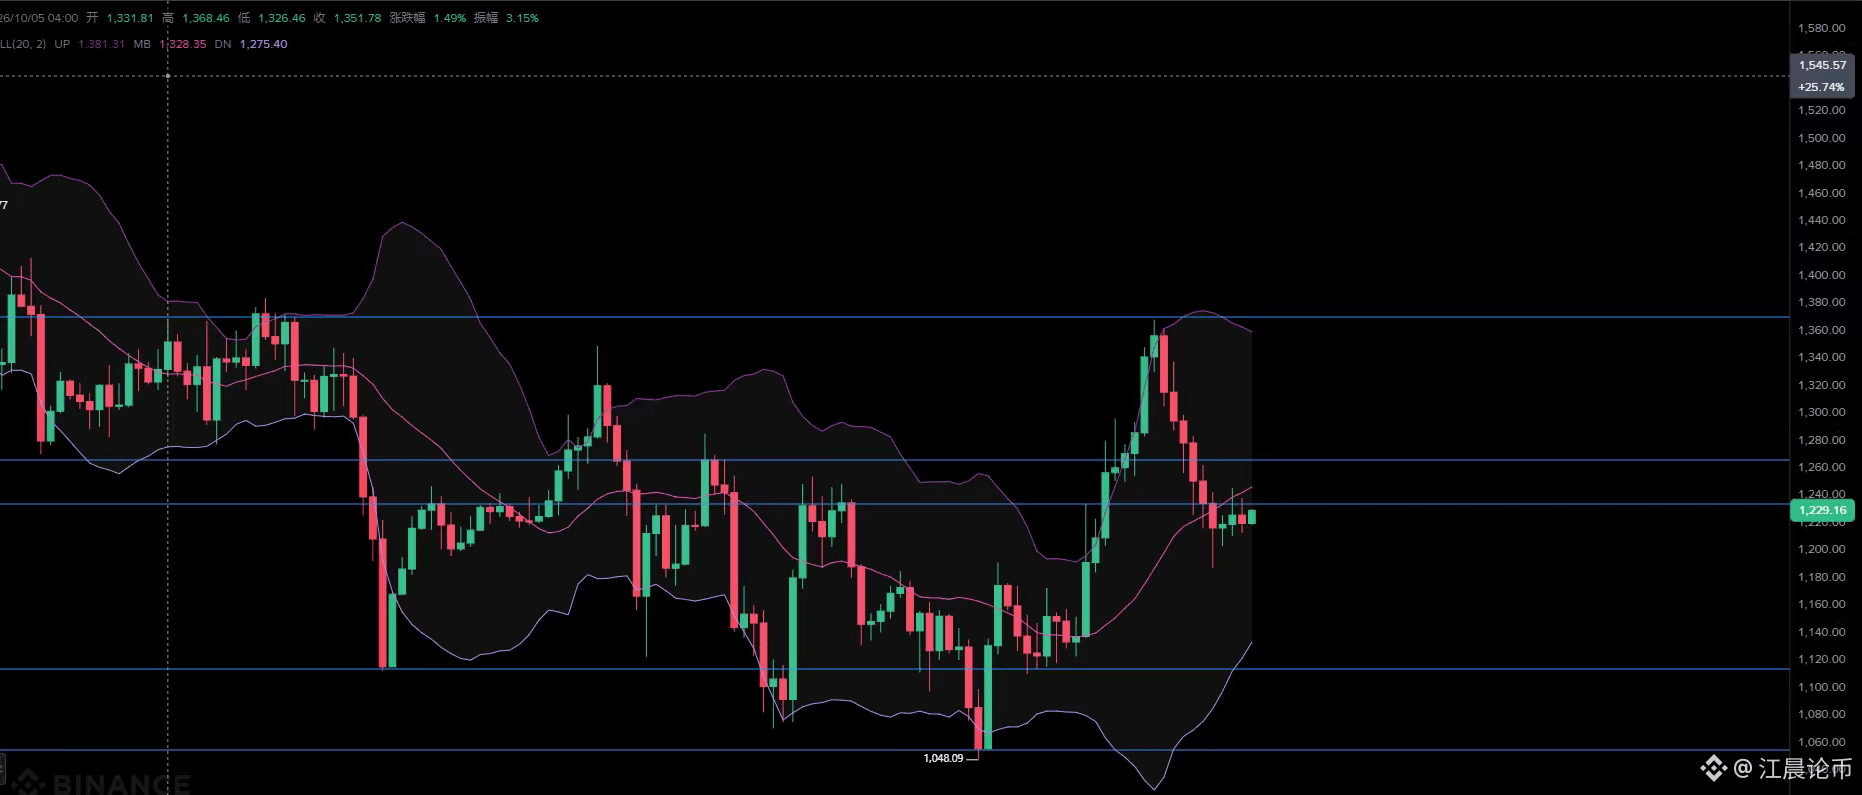
The bullish catalysts are all out in the open, and whales holding tens of millions of dollars are still standing firm—yet ZEC’s price has already caved. It plunged from 1,368 to 1,229, wiping out all of its gains of more than 40 points in one go. The worst hit are the leveraged longs who entered around 1,260, now all neatly stranded halfway up the mountain. After breaking below the Bollinger middle band at 1,328, price couldn’t find support at the lower band either, at 1,275. The chart has now printed a small doji. All we can say is that bulls and bears have begun clashing head-on around 1,229, and the market has hit the brakes hard—but a trend reversal is still a long way off. The first hurdle overhead is reclaiming 1,275: if price can’t get back above it, any bounce is just a paper tiger. 1,328 is the real line in the sand between bulls and bears; failing to break through makes everything else pointless. Below, keep a close eye on the daily close at 1,229. If it holds, there’s still room for a prolonged tussle; if it closes below, the next levels to watch are 1,170–1,160, with 1,050—the previous low—as the extreme downside target. $BTC $ETH $ZEC
The bullish catalysts are all out in the open, and whales holding tens of millions of dollars are still standing firm—yet ZEC’s price has already caved. It plunged from 1,368 to 1,229, wiping out all of its gains of more than 40 points in one go. The worst hit are the leveraged longs who entered around 1,260, now all neatly stranded halfway up the mountain. After breaking below the Bollinger middle band at 1,328, price couldn’t find support at the lower band either, at 1,275. The chart has now printed a small doji. All we can say is that bulls and bears have begun clashing head-on around 1,229, and the market has hit the brakes hard—but a trend reversal is still a long way off. The first hurdle overhead is reclaiming 1,275: if price can’t get back above it, any bounce is just a paper tiger. 1,328 is the real line in the sand between bulls and bears; failing to break through makes everything else pointless. Below, keep a close eye on the daily close at 1,229. If it holds, there’s still room for a prolonged tussle; if it closes below, the next levels to watch are 1,170–1,160, with 1,050—the previous low—as the extreme downside target. $BTC $ETH $ZEC
1
98
·
--
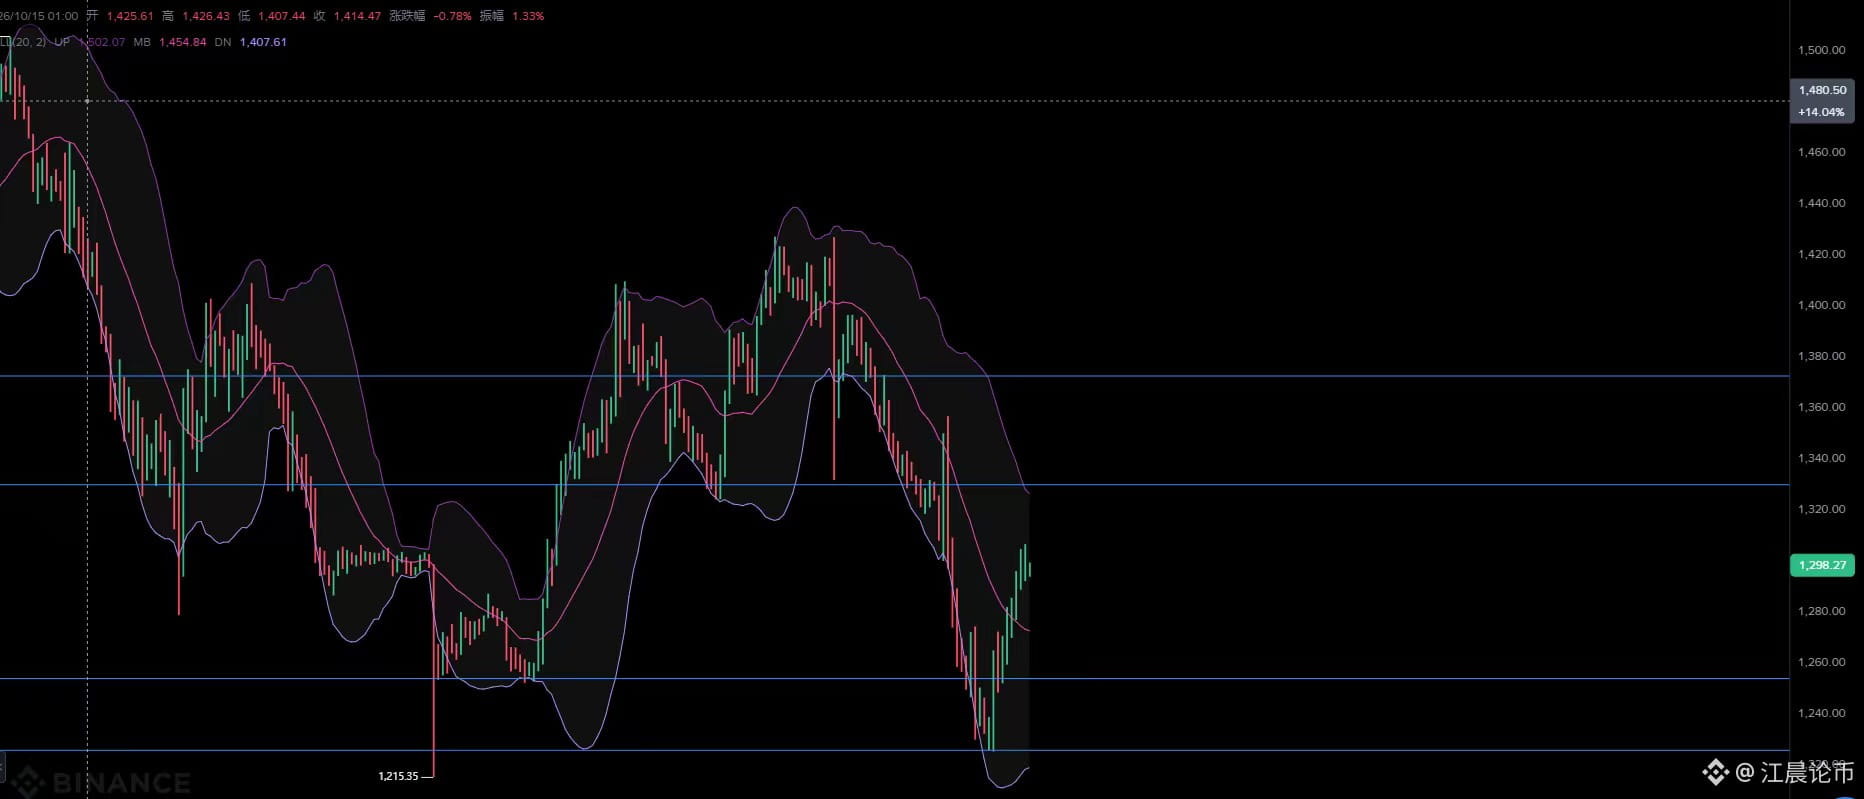
SanDisk’s rebound has been stronger than expected. Since finding support after a long lower wick at the 1215 low, the price has posted several consecutive bullish candles and climbed in a choppy uptrend. It has now moved up to around 1298, with clear short-term bullish momentum. Looking at the Bollinger Bands, after previously falling below the lower band, the price is now accelerating back toward the middle band. The sustained rally shows that buying support near the bottom is holding up well, as bulls actively repair the previous sharp sell-off. Market sentiment has also improved markedly from earlier levels. However, the higher the price climbs, the heavier the overhead selling pressure from trapped holders becomes. The 1330–1340 area is the next key hurdle: the Bollinger middle band overlaps with a previous high-volume trading zone here, making it a major near-term resistance area. The outcome of the battle here will directly determine the nature of this move: a decisive breakout on strong volume that holds above this zone could turn the rebound into a trend reversal and open up further upside; a rejection and pullback would likely bring the price back into a range, or even lead to a second test of the lows.
The short-term uptrend is smooth, but chasing the price higher is not advisable as it approaches key resistance. It is better to patiently wait for a directional move around 1330–1340 and follow only after confirmation, which offers a better risk-reward profile. $BTC $ETH $SNDK #股票财报季
The short-term uptrend is smooth, but chasing the price higher is not advisable as it approaches key resistance. It is better to patiently wait for a directional move around 1330–1340 and follow only after confirmation, which offers a better risk-reward profile. $BTC $ETH $SNDK #股票财报季
1
15
·
--
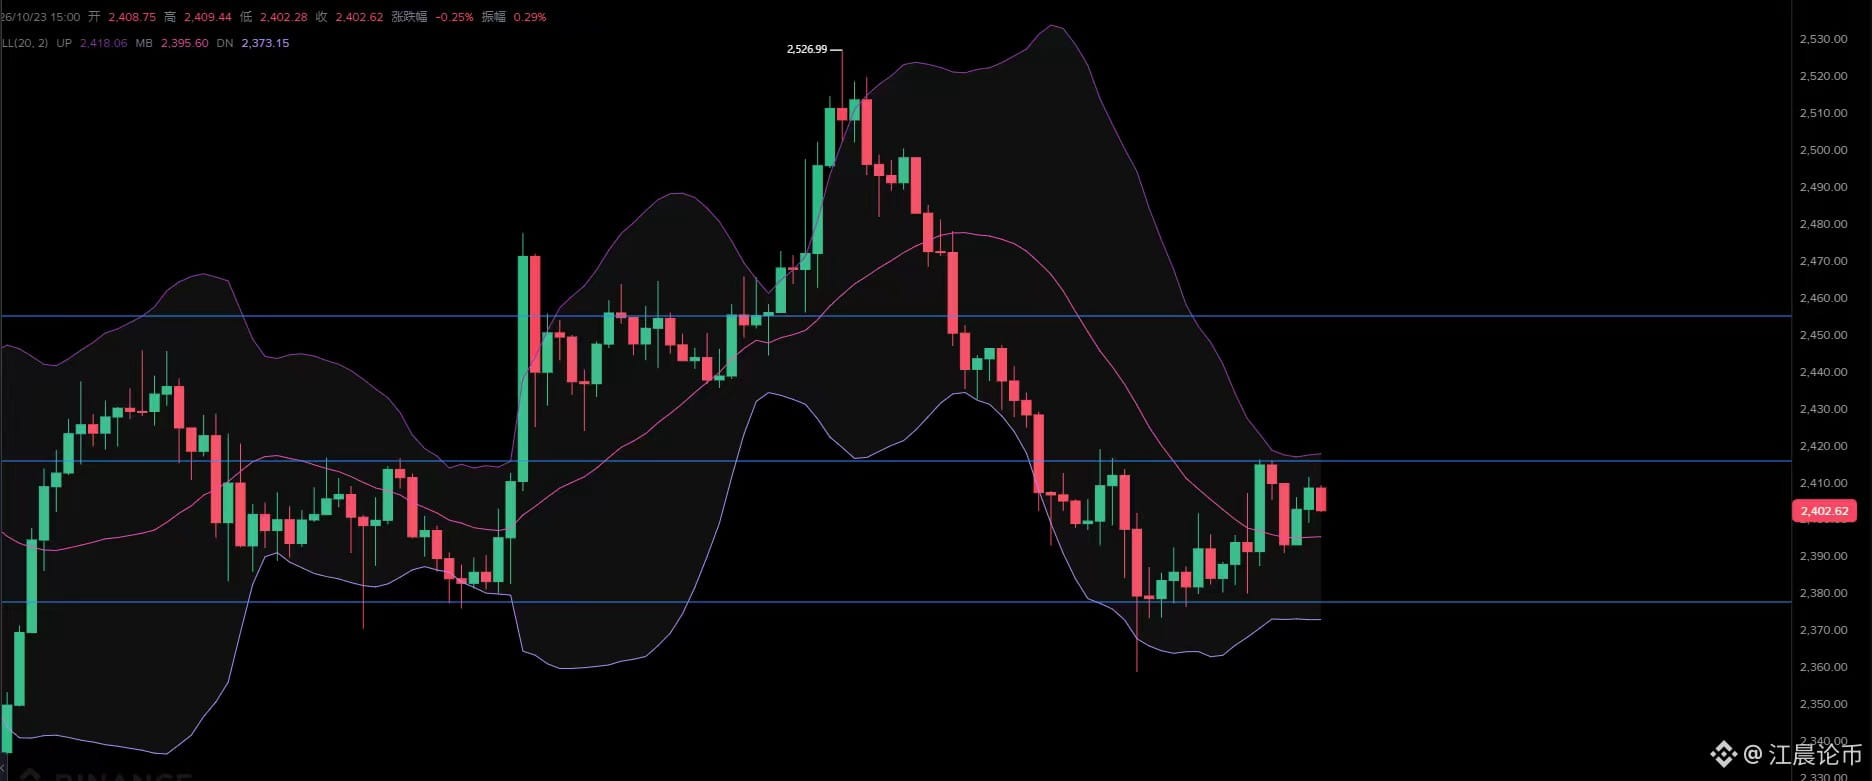
The sell-off from 2526 to 2359 directly damaged ETH’s short-term bullish structure on the 1-hour chart. A series of solid bearish candles left bulls almost no room for a rebound. The market was completely dominated by bears, making this a classic one-way decline.
After plunging to 2359, the market entered a delicate phase of tug-of-war. The long lower wick at the bottom suggests that buyers were actively stepping in at that level. The price then began an oversold rebound and is now fluctuating around 2401. This is a technical recovery after a sharp drop. Although the decline has temporarily halted, there is heavy overhead supply, so the rebound’s staying power remains to be seen.
The market’s next move hinges on two key levels. The first resistance is around 2424. Only if the price can hold above this level with strong volume will it have a chance to test the major resistance zone around 2461. The key support remains 2359: as long as this low holds, the short-term outlook is range-bound consolidation and recovery. If it breaks, the door will be wide open for further downside.$BTC $ZEC $ETH #股票财报季
1
11
·
--
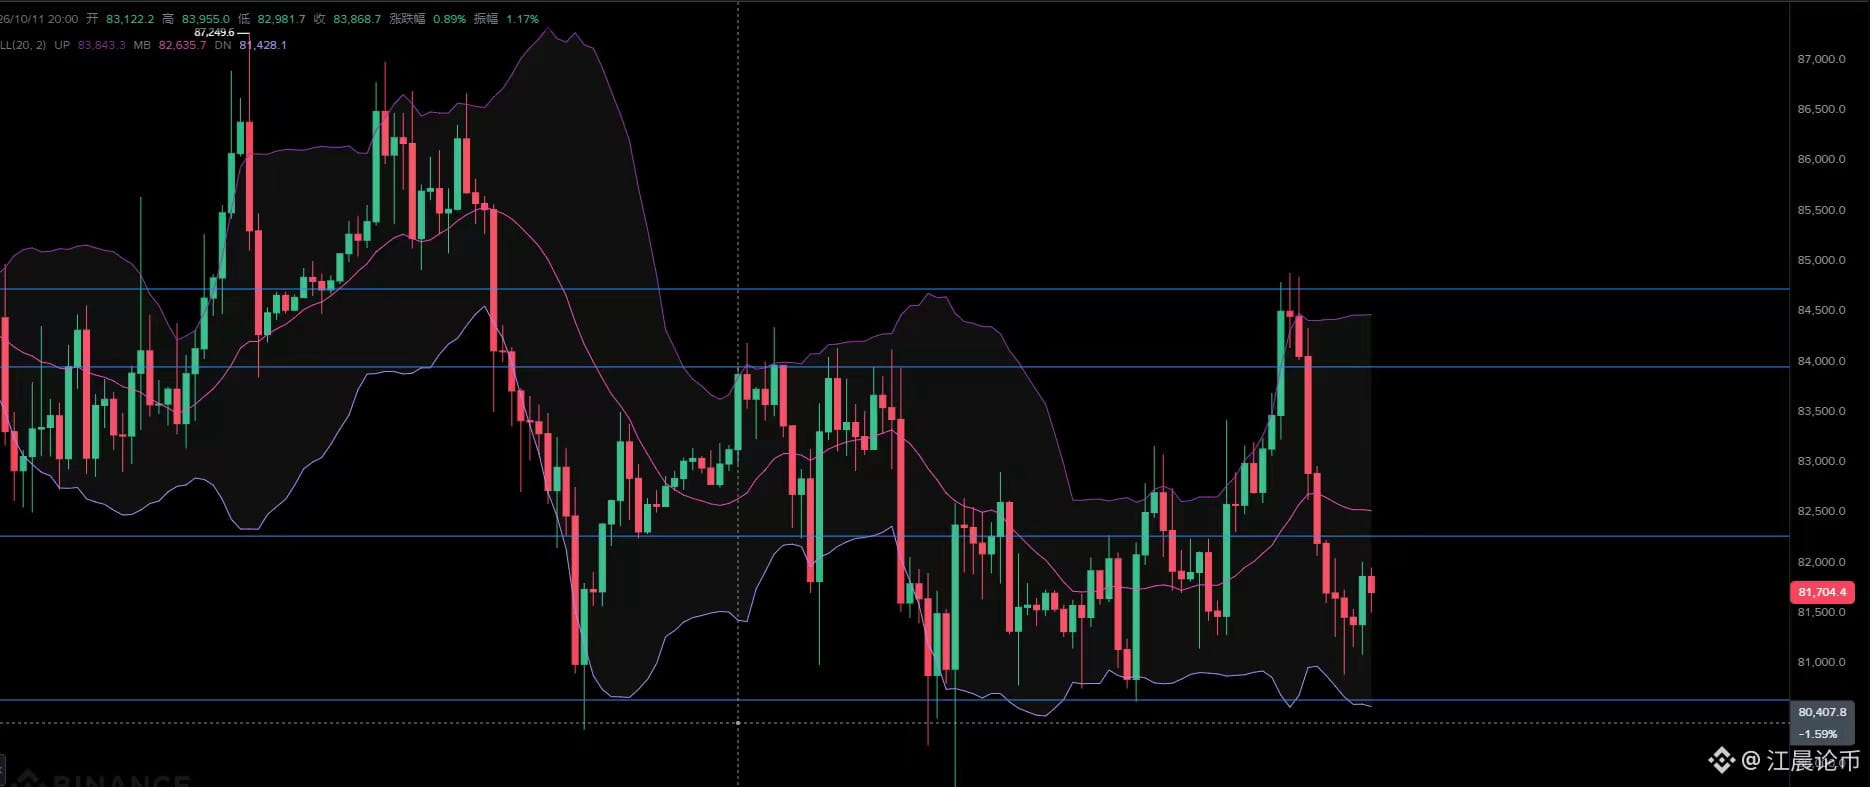
Where the market goes next really comes down to two key levels. On the way up, the previous consolidation zone after the sharp drop, around 82327 to 83254, is full of trapped buyers. If the rebound can’t even reach this area, the weak trend will be confirmed, and a second test of the lows is highly likely. On the way down, 80684 is the short-term make-or-break level. If the candle body breaks below it, the downside will be wide open.
Bitcoin’s 4-hour chart has been quite volatile. The bulls pushed the price all the way up to 84898, but a long upper wick at the top was immediately followed by a large bearish candle, abruptly interrupting the uptrend. Profit-taking at higher levels came pouring in, creating heavy selling pressure and instantly reversing the bullish trend. The subsequent plunge was particularly sharp. Several consecutive bearish candles gave the bulls almost no chance to catch their breath, with the bears firmly in control. However, it’s worth noting that when the price fell to around the previous low of 80684, the candle formed a pronounced long lower wick. This shows that buyers are still stepping in at this level. The price is currently moving sideways weakly around 81743, in a period of consolidation and recovery after the sharp drop.
The outlook from here is fairly clear: just keep an eye on the two ranges above and below. First, watch 82327 to 83254 above—the previous zone where buyers were trapped during the sharp drop. If the rebound is capped in this area, a second test of the lows is highly likely. The key support line below remains 80684$BTC $ETH $ZEC #股票财报季
1
21
·
--
That wraps up this week. So what’s the outlook for next week? The key is to keep an eye on these things:
Oct. 27–28 Fed meeting: Markets broadly expect the Fed to hold steady. The real key is the tone of Powell’s remarks afterward. A hawkish tone (rates staying higher for longer) would weigh on risk assets; a dovish tone (rate-cut expectations warming up again) could send BTC bouncing ahead of the pack. Don’t just watch the decision—the wording is what will trigger the market move.
Oct. 31 PCE price index (the Fed’s most closely watched inflation gauge): A hotter-than-expected reading could revive the narrative of stubborn inflation, weighing on BTC; a cooler reading could ease pressure to tighten and boost risk appetite. This is the second “bombshell” right after the Fed meeting. With the two events so close together, volatility could compound.
Geopolitical developments (a persistent source of disruption): Trump has publicly accused Iran of fabricating attacks to drive up oil prices, as the energy standoff and information war heat up. Oil prices are sensitive, inflation expectations are sensitive, and the Fed’s policy path is sensitive—while sentiment around BTC is fragile. Any surprise sanctions, military exercises, or reports of attacks could instantly trigger a flight-to-safety sell-off or a sharp rally.
On-chain fund flows (a hidden barometer): Continued net outflows from spot Bitcoin ETFs suggest institutions are sitting on the sidelines, making the 81,000 support level difficult to hold; a return to net inflows would suggest smart money is buying back in, giving BTC the momentum to break above the previous highs of 84,000–85,000. $BTC $ETH $ZEC #股票财报季 #币安神算子

1
46
·
--
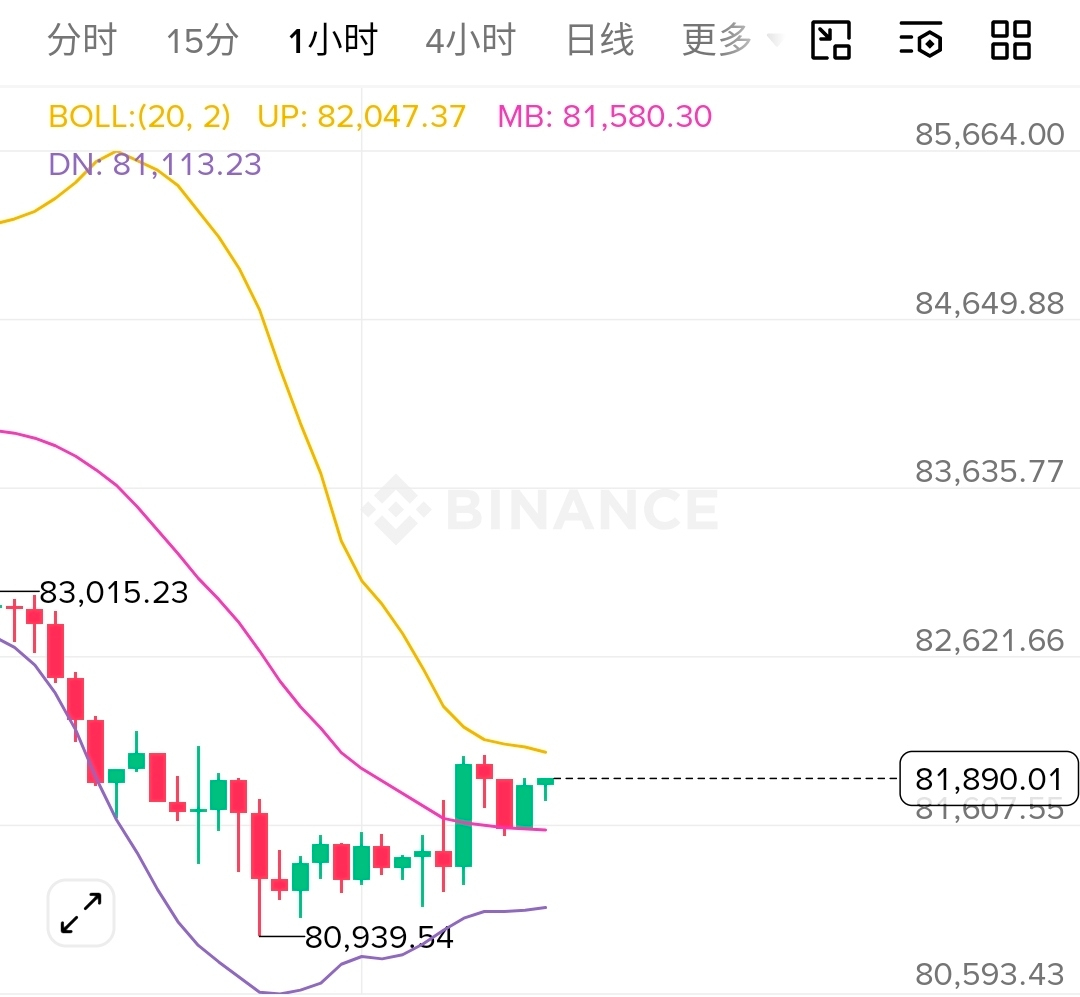
On the 1-hour chart, I currently lean bullish. The sharp drop early this morning to a low of 80939 was quickly followed by a long lower wick and a rebound. This is a classic bear trap and shakeout, suggesting that bearish momentum has faded in the short term. The price is now holding steady around 81873, with bulls gradually pushing it higher.
The lower Bollinger Band, near 81095, is providing strong short-term support. After the early-morning spike touched this level, the price quickly recovered. It has now moved decisively above the middle band at 81589, which is beginning to flatten after sloping downward. The market is entering a consolidation phase and building momentum. Although the upper band near 82082 is currently acting as resistance, the overall structure remains bullish. As long as the price stays above the middle band, bulls could attempt an upward breakout at any time.$BTC $ETH $ZEC #股票财报季 #币安神算子
The lower Bollinger Band, near 81095, is providing strong short-term support. After the early-morning spike touched this level, the price quickly recovered. It has now moved decisively above the middle band at 81589, which is beginning to flatten after sloping downward. The market is entering a consolidation phase and building momentum. Although the upper band near 82082 is currently acting as resistance, the overall structure remains bullish. As long as the price stays above the middle band, bulls could attempt an upward breakout at any time.$BTC $ETH $ZEC #股票财报季 #币安神算子
1
51
·
--
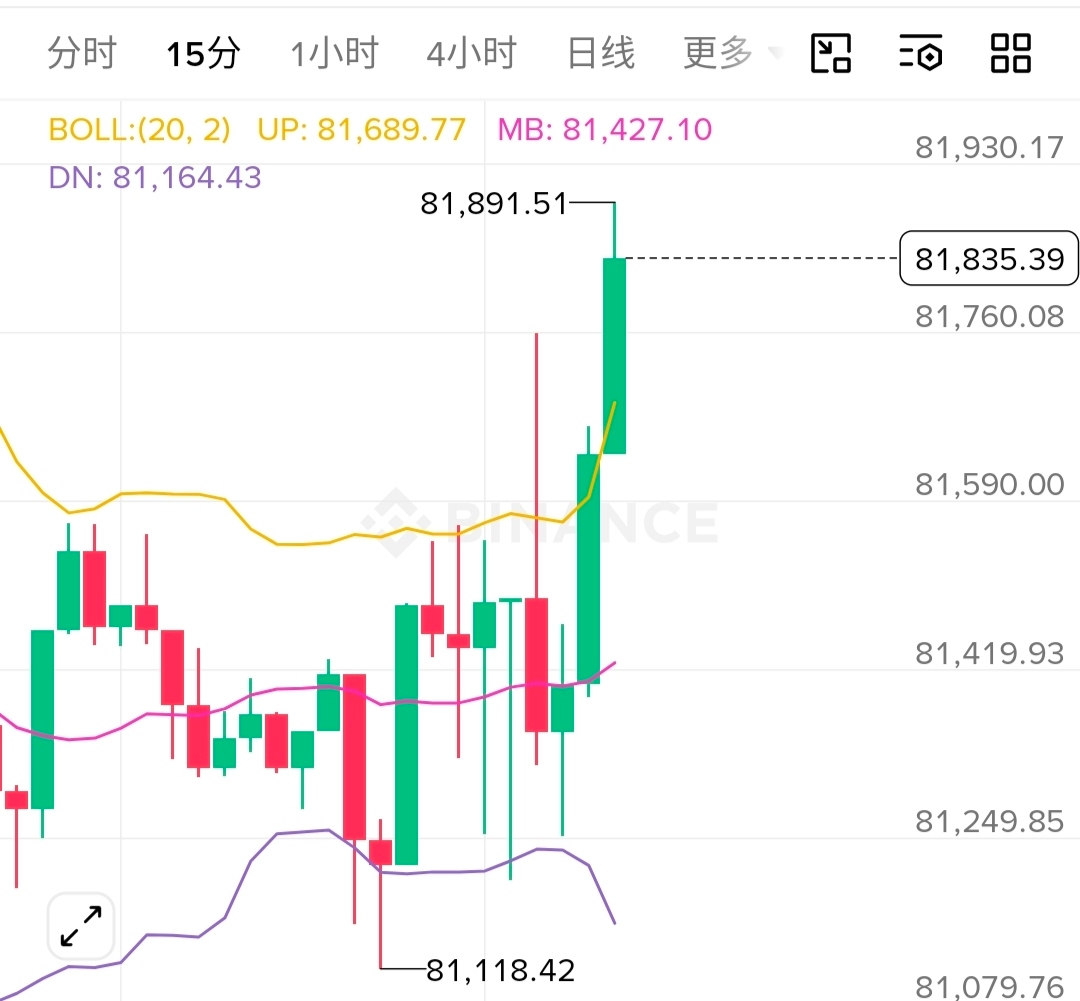
Looking at the current 15-minute chart, the price action has finally found its footing after dipping to around 81118. The latest few candlesticks show some willingness to push higher, especially one solid bullish candle that surged upward and broke out of the earlier back-and-forth consolidation. The current candle has reached—and even pierced—the upper band, indicating that short-term bullish momentum is being released in force. Meanwhile, the middle and lower bands are also starting to turn upward, suggesting that support at the bottom is gradually moving higher and the chart’s center of gravity is rising.
Since the chart is making an attempt to move higher, the outlook remains range-bound with an upward bias. However, keep in mind that after a sharp one-way rally like this, there is often a technical pullback to test support around the middle band. Wait for a clear sign that the pullback has stabilized before deciding what to do.$BTC $ETH $ZEC #股票财报季 #币安神算子
Since the chart is making an attempt to move higher, the outlook remains range-bound with an upward bias. However, keep in mind that after a sharp one-way rally like this, there is often a technical pullback to test support around the middle band. Wait for a clear sign that the pullback has stabilized before deciding what to do.$BTC $ETH $ZEC #股票财报季 #币安神算子
1
64
·
--
10.23 Morning Bitcoin and Ethereum Market Analysis:
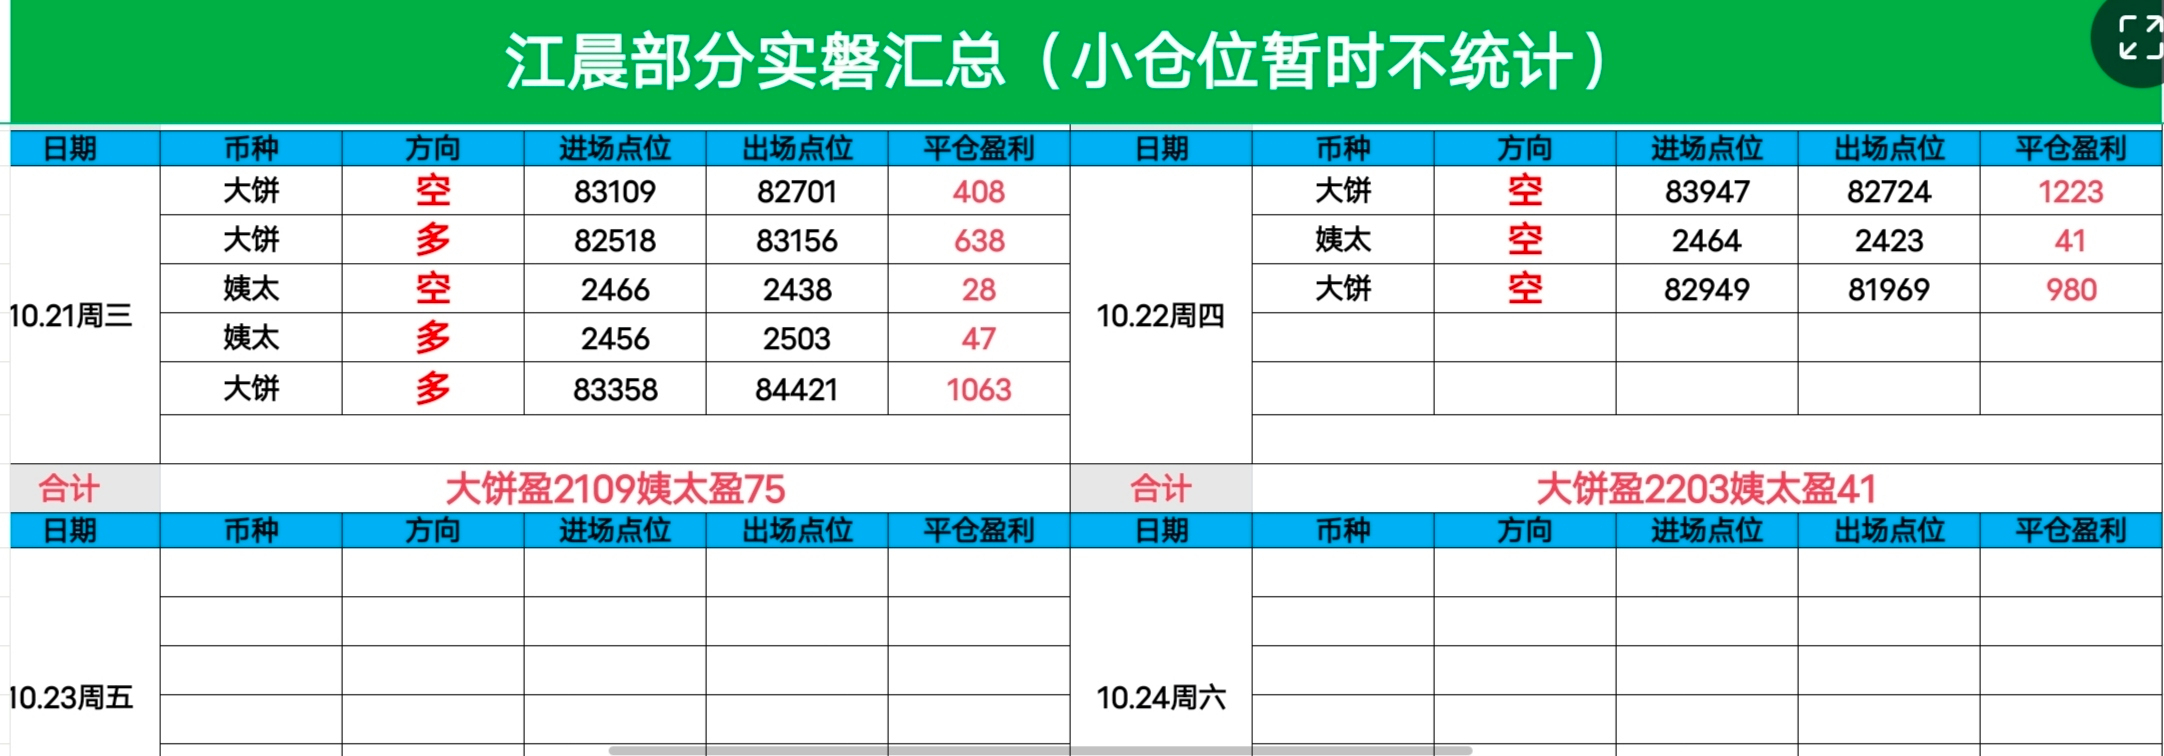
I’m sure everyone saw yesterday’s market action. We once again read the overall trend accurately. We remained firmly bearish throughout the day and entered Bitcoin trades in two batches. The first entry was at 83947, securing a gain of 1223 points. We added to the position at 82949 for the second entry, which has now gained 980 points. Ethereum also gained 41 points. Trading is always about patiently following the trend, not blindly betting on a one-way move. Respecting the market is the key to lasting in this game.
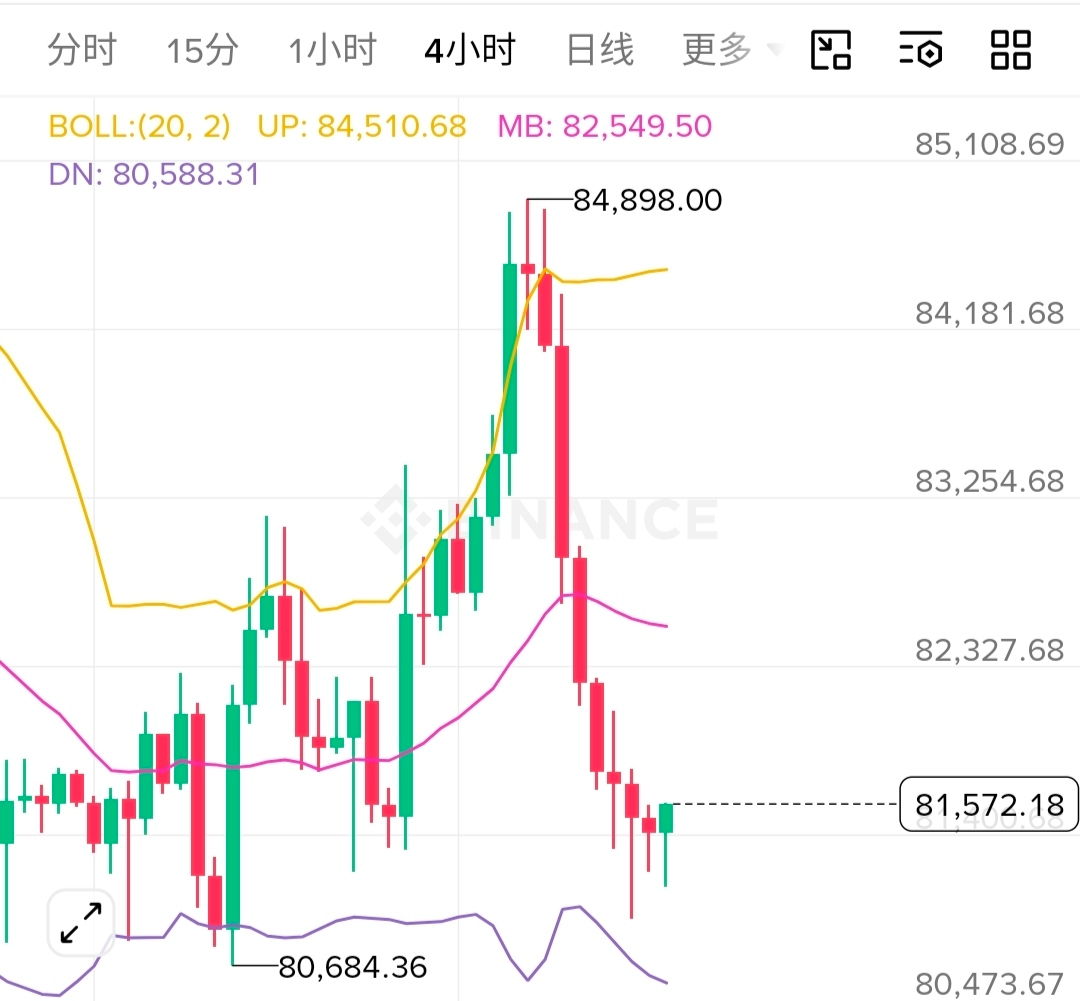
Let’s look at the four-hour chart. After Bitcoin surged to around 84898, it was hit by extremely aggressive selling. A huge bearish candle directly broke through the previously strong upward structure and pierced several short-term support levels, with the price falling as low as the lower Bollinger Band. However, on closer inspection, after this sharp drop the market did not continue into an extreme one-way selloff. Instead, it formed a small bullish candle at the lows, and the market entered a typical consolidation and recovery phase. The price is currently hovering around 81572. The lower Bollinger Band around 80500 has provided clear support, and the lows have begun to edge up gradually. Overall, this can be viewed as a consolidation phase with an upward bias.
Since the market is showing a consolidation phase with an upward bias, we should avoid blindly chasing shorts. The current range’s lower support is relatively firm, so it would be more appropriate to wait for a pullback before going long. In the short term, keep an eye on support around 81000 to 81200 and look for opportunities to enter long positions at lower prices. Above, the first level to watch is resistance near the middle Bollinger Band around 82500. If this consolidation gradually pushes the middle band higher, the market may then have the momentum to move up and fill the gap. $BTC $ETH $ZEC #股票财报季 #币安神算子


1
71
·
--
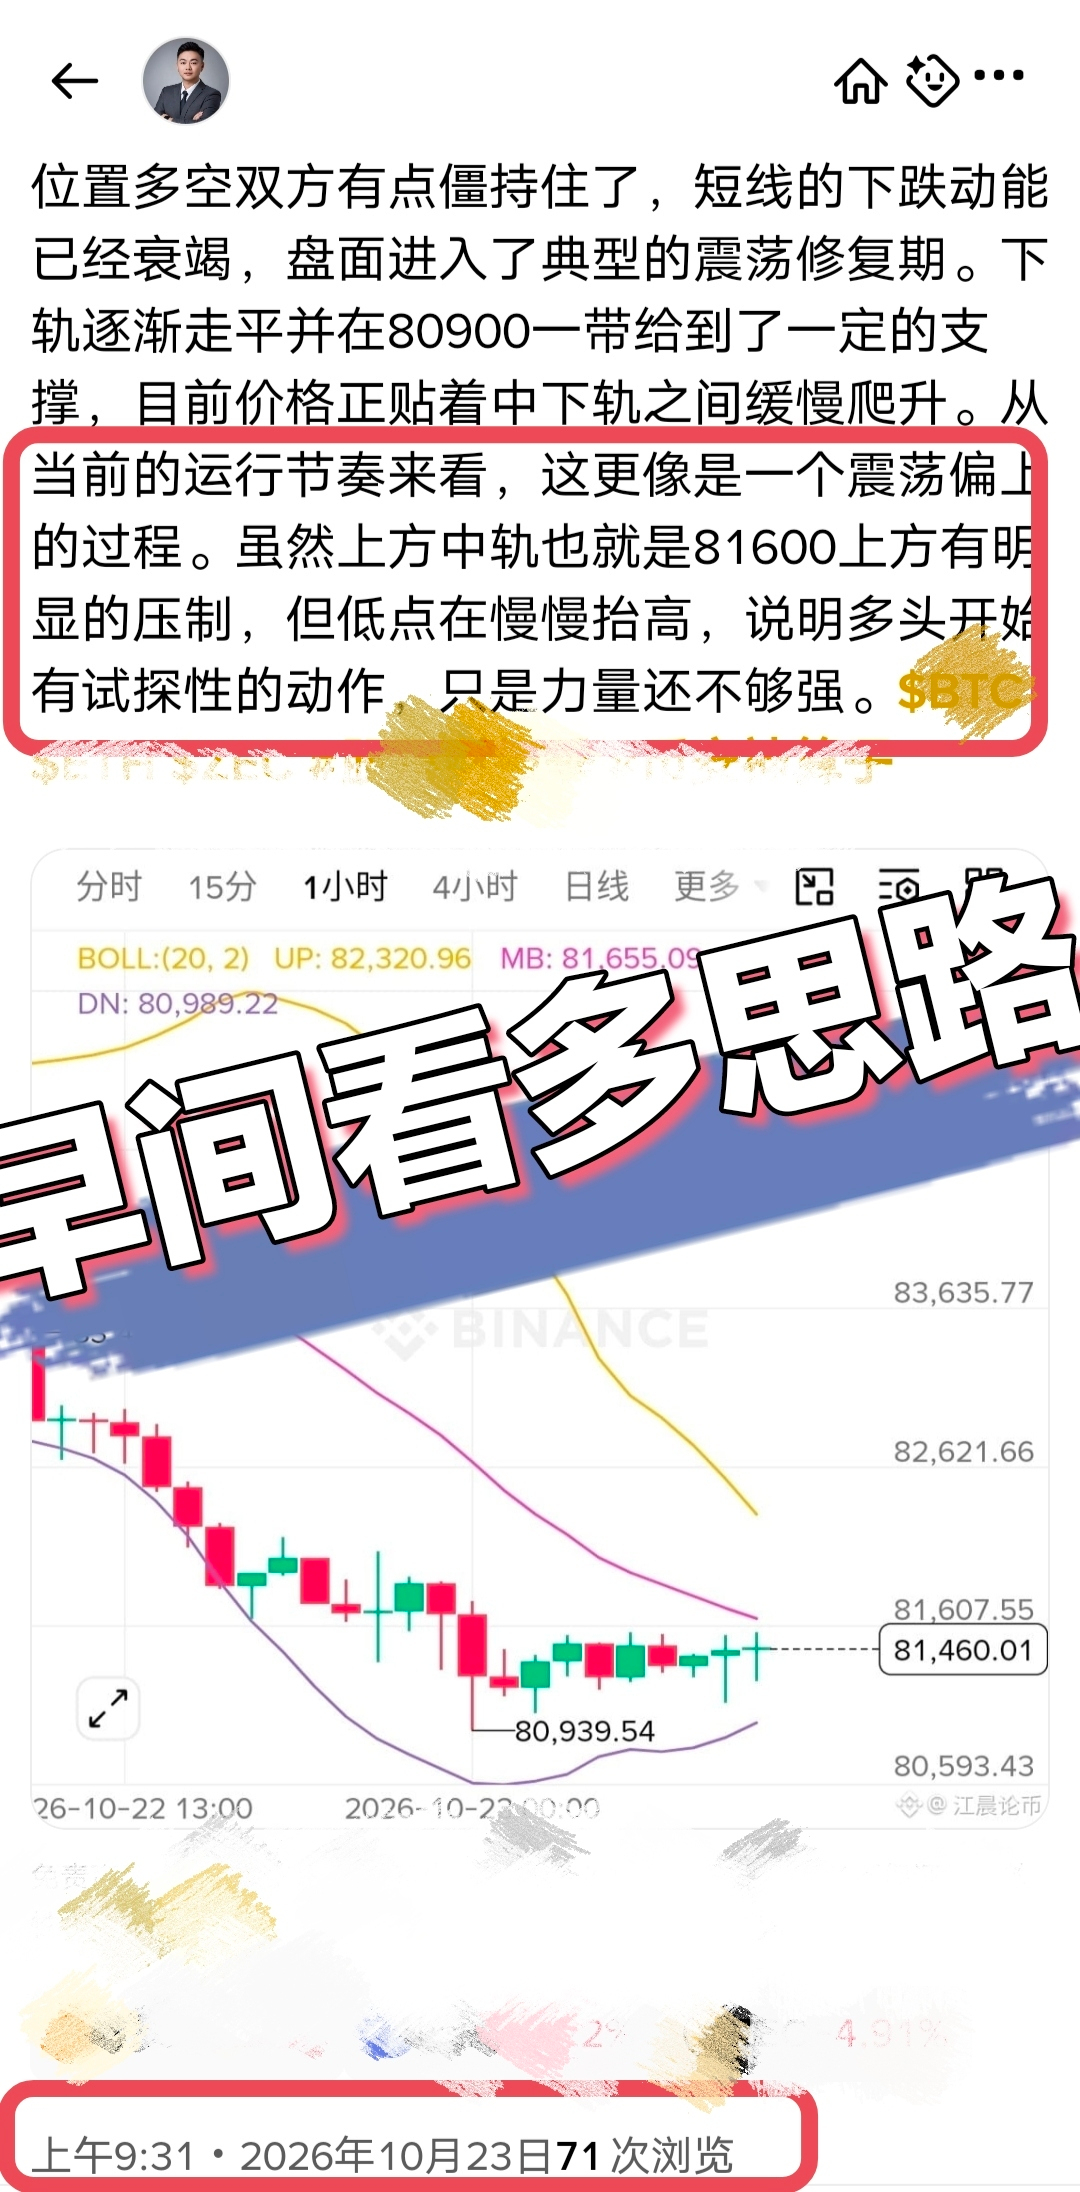
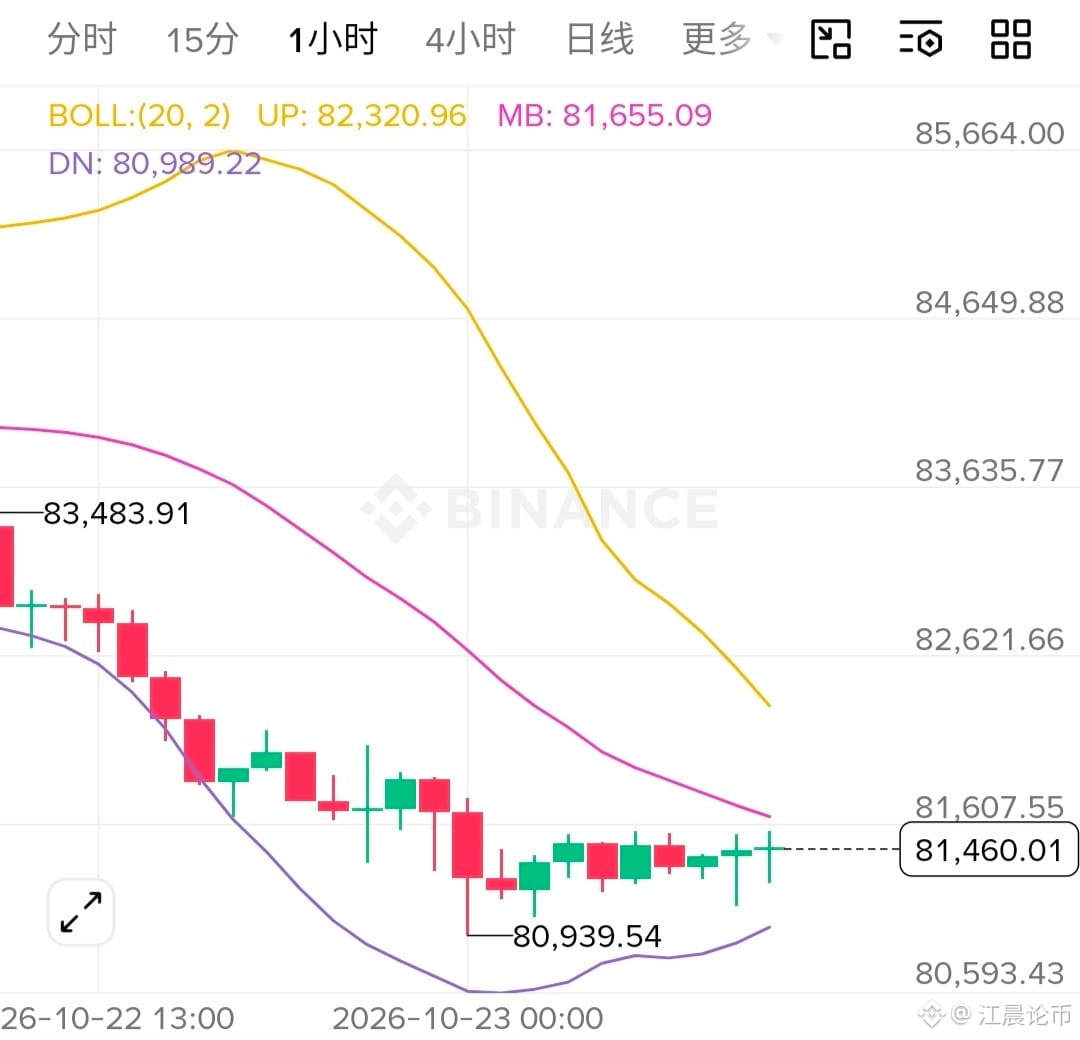
Good morning, everyone. Let’s take a look at the market: After Bitcoin dropped to around 80,900, it began to lose momentum. The past few candlesticks have been indecisive, alternating between red and green with relatively small bodies and wicks on both ends. This suggests that buyers and sellers are at a bit of a standoff here, and that short-term downward momentum has run out of steam. The market has entered a typical period of consolidation and recovery. The lower band is gradually flattening out and has provided some support around 80,900. The price is currently creeping upward along the area between the middle and lower bands. Judging by the current price action, this looks more like a choppy move with an upward bias. Although there is clear resistance above the middle band, around 81,600, the lows are gradually rising, suggesting that buyers are starting to test the waters, though their strength is still limited. $BTC $ETH $ZEC #股票财报季 #币安神算子
Good morning, everyone. Let’s take a look at the market: After Bitcoin dropped to around 80,900, it began to lose momentum. The past few candlesticks have been indecisive, alternating between red and green with relatively small bodies and wicks on both ends. This suggests that buyers and sellers are at a bit of a standoff here, and that short-term downward momentum has run out of steam. The market has entered a typical period of consolidation and recovery. The lower band is gradually flattening out and has provided some support around 80,900. The price is currently creeping upward along the area between the middle and lower bands. Judging by the current price action, this looks more like a choppy move with an upward bias. Although there is clear resistance above the middle band, around 81,600, the lows are gradually rising, suggesting that buyers are starting to test the waters, though their strength is still limited. $BTC $ETH $ZEC #股票财报季 #币安神算子
1
96
Log in to explore more content
Join global crypto users on Binance Square
⚡️ Get latest and useful information about crypto.
💬 Trusted by the world’s largest crypto exchange.
👍 Discover real insights from verified creators.
Email / Phone number