
罗llllr
630 Posts

罗llllr
Report
Block User
Open Trade
High-Frequency Trader
1.9 Years
25 Following
57 Followers
33 Liked
Posts
Portfolio
All
Quotes
·
--
See translation
指标笔记|$EVAA |跌破 1.65 关口
先说定义:关口一带通常挂着不少止损单,价格一旦穿过关口,这些止损被集中触发,波动常常会突然放大。
常见读法:不少人会把关口当作风险管理的参照:在它哪一侧拿单、止损放在什么位置,比起预测方向更实用。
别在波动最快的那一下追单,先等价格收稳再去看。
指标笔记|$EVAA |跌破 1.65 关口
先说定义:关口一带通常挂着不少止损单,价格一旦穿过关口,这些止损被集中触发,波动常常会突然放大。
常见读法:不少人会把关口当作风险管理的参照:在它哪一侧拿单、止损放在什么位置,比起预测方向更实用。
别在波动最快的那一下追单,先等价格收稳再去看。
先说定义:关口一带通常挂着不少止损单,价格一旦穿过关口,这些止损被集中触发,波动常常会突然放大。
常见读法:不少人会把关口当作风险管理的参照:在它哪一侧拿单、止损放在什么位置,比起预测方向更实用。
别在波动最快的那一下追单,先等价格收稳再去看。
27
·
--
Chart notes|$WLD |5 consecutive down days|cumulative -19.94%
First, the definitions: a bullish candlestick is one where the closing price is higher than the opening price, while a bearish candlestick is one where the closing price is lower; consecutive bullish candles means bullish candles have formed for several days in a row.
A common way to read this: some people compare daily and weekly charts. When the broader trend aligns, a run of same-colored daily candles is often more likely to persist for a while; when they point in opposite directions, be more cautious.
Indicators can fail, so don’t skip the stop-loss: deciding in advance what to do if your judgment is wrong matters more than guessing correctly.
Chart notes|$WLD |5 consecutive down days|cumulative -19.94%
First, the definitions: a bullish candlestick is one where the closing price is higher than the opening price, while a bearish candlestick is one where the closing price is lower; consecutive bullish candles means bullish candles have formed for several days in a row.
A common way to read this: some people compare daily and weekly charts. When the broader trend aligns, a run of same-colored daily candles is often more likely to persist for a while; when they point in opposite directions, be more cautious.
Indicators can fail, so don’t skip the stop-loss: deciding in advance what to do if your judgment is wrong matters more than guessing correctly.
First, the definitions: a bullish candlestick is one where the closing price is higher than the opening price, while a bearish candlestick is one where the closing price is lower; consecutive bullish candles means bullish candles have formed for several days in a row.
A common way to read this: some people compare daily and weekly charts. When the broader trend aligns, a run of same-colored daily candles is often more likely to persist for a while; when they point in opposite directions, be more cautious.
Indicators can fail, so don’t skip the stop-loss: deciding in advance what to do if your judgment is wrong matters more than guessing correctly.
27
·
--
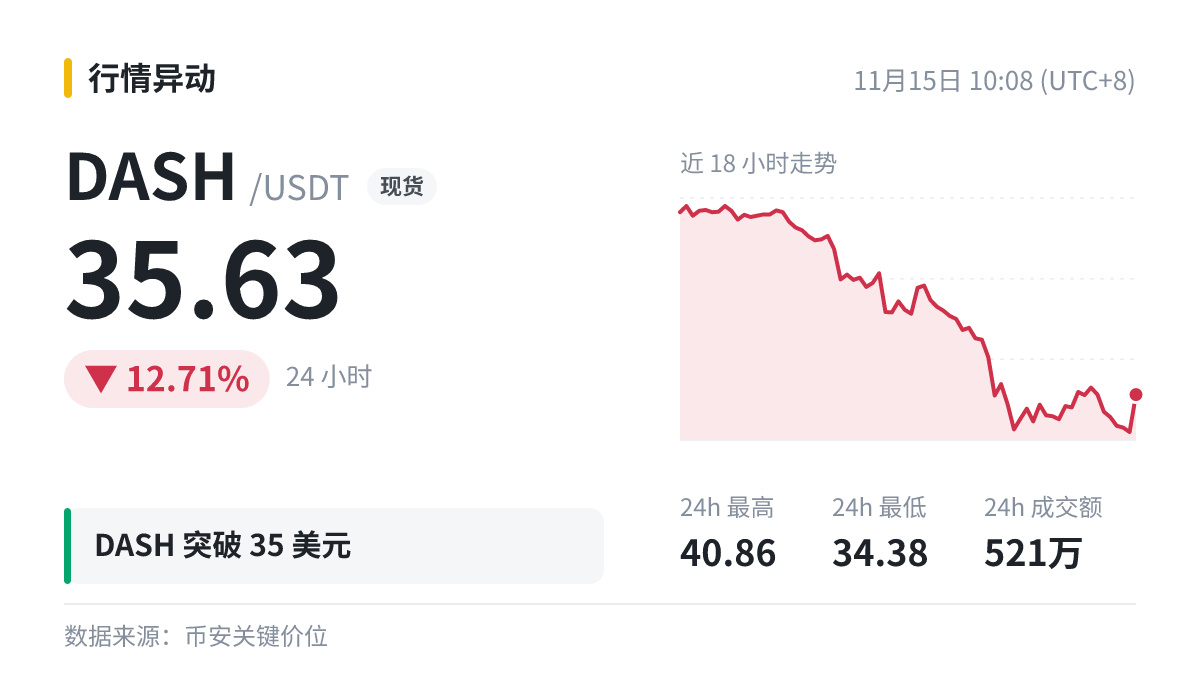
📐 Latest data: $DASH |Breaking through the 35 threshold
· Definition: A support level is a price range where the price has repeatedly found a floor while falling. A resistance level is a price range that the price has repeatedly struggled to rise above.
· How to read it: When the price returns to a level after several days, people who entered the market around that level earlier may sell to break even or add to their positions, so trading activity often picks up.
Indicators can fail, but risk management should never be skipped: planning in advance what to do if your judgment is wrong matters more than guessing correctly.
#DASH
📐 Latest data: $DASH |Breaking through the 35 threshold
· Definition: A support level is a price range where the price has repeatedly found a floor while falling. A resistance level is a price range that the price has repeatedly struggled to rise above.
· How to read it: When the price returns to a level after several days, people who entered the market around that level earlier may sell to break even or add to their positions, so trading activity often picks up.
Indicators can fail, but risk management should never be skipped: planning in advance what to do if your judgment is wrong matters more than guessing correctly.
#DASH
· Definition: A support level is a price range where the price has repeatedly found a floor while falling. A resistance level is a price range that the price has repeatedly struggled to rise above.
· How to read it: When the price returns to a level after several days, people who entered the market around that level earlier may sell to break even or add to their positions, so trading activity often picks up.
Indicators can fail, but risk management should never be skipped: planning in advance what to do if your judgment is wrong matters more than guessing correctly.
#DASH
42
·
--
See translation
📊 $ETH 大额爆仓数据
› 方向:多单
› 金额:111万美元
› 价格:1713.87
› 24h:-10.75%
多头杠杆在出清。关注一下,行情及时同步。
📊 $ETH 大额爆仓数据
› 方向:多单
› 金额:111万美元
› 价格:1713.87
› 24h:-10.75%
多头杠杆在出清。关注一下,行情及时同步。
› 方向:多单
› 金额:111万美元
› 价格:1713.87
› 24h:-10.75%
多头杠杆在出清。关注一下,行情及时同步。
48
·
--
See translation
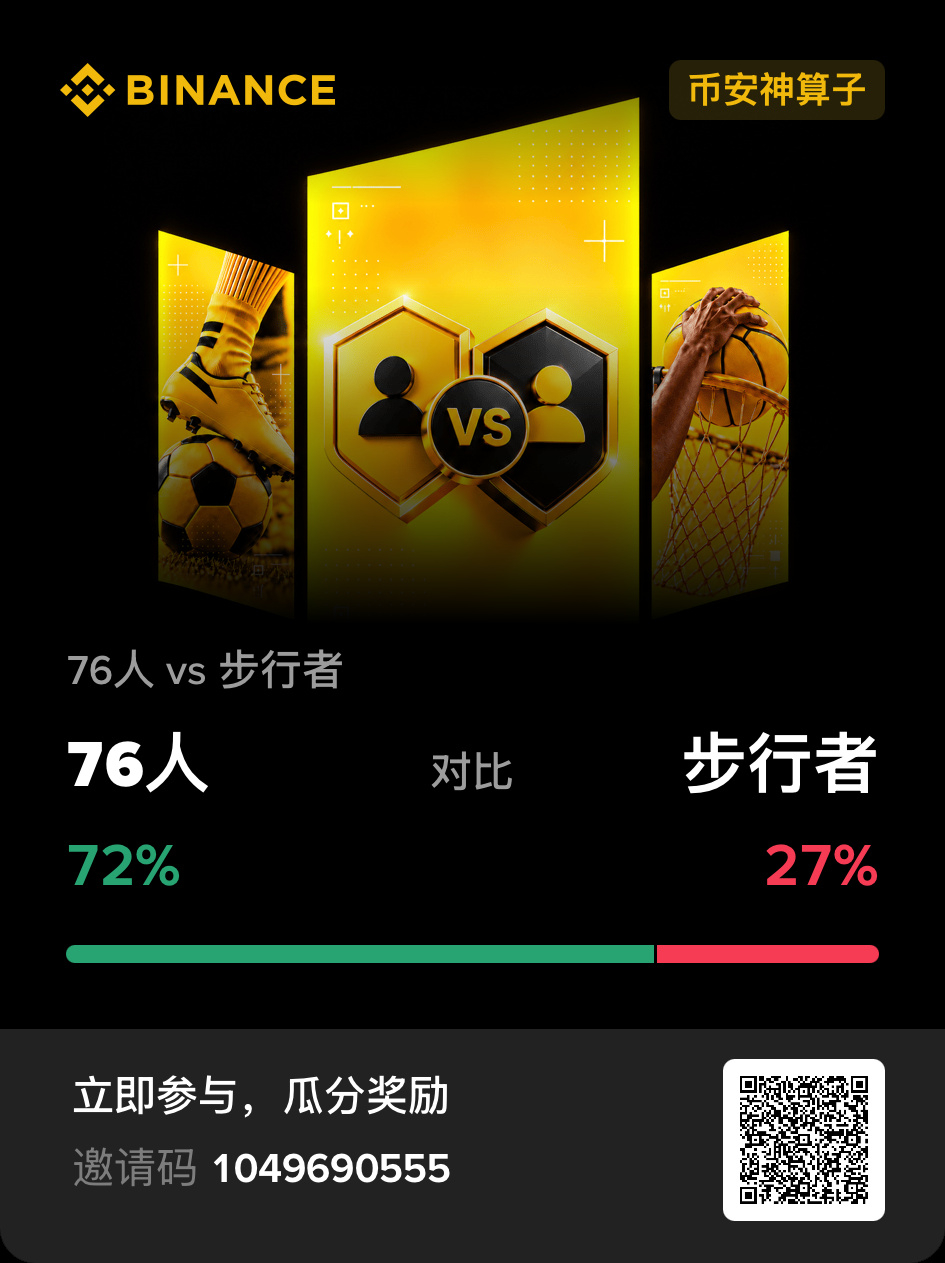
#币安神算子 哈哈哈哈哈哈哈哈哈哈哈哈哈哈哈哈哈哈哈哈哈哈哈哈哈哈哈哈哈哈哈哈哈哈哈哈哈哈
#币安神算子 哈哈哈哈哈哈哈哈哈哈哈哈哈哈哈哈哈哈哈哈哈哈哈哈哈哈哈哈哈哈哈哈哈哈哈哈哈哈
·
--
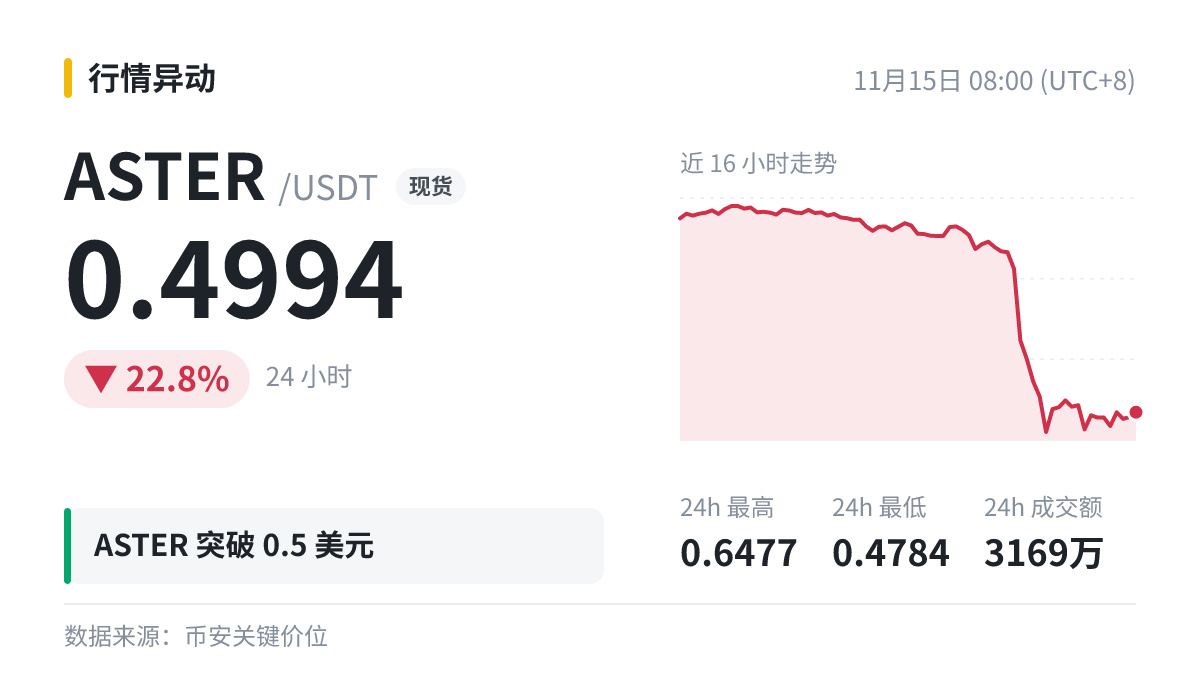
📊 Key price level monitoring for $ASTER
· Price level: 0.5 (round-number threshold)
· Action: Breakout
· Current price: 0.4994 (has fallen back below the price level)
· Time since last reached: 281 days
· 24h: -22.8%
What do you think of this phase?
📊 Key price level monitoring for $ASTER
· Price level: 0.5 (round-number threshold)
· Action: Breakout
· Current price: 0.4994 (has fallen back below the price level)
· Time since last reached: 281 days
· 24h: -22.8%
What do you think of this phase?
· Price level: 0.5 (round-number threshold)
· Action: Breakout
· Current price: 0.4994 (has fallen back below the price level)
· Time since last reached: 281 days
· 24h: -22.8%
What do you think of this phase?
78
·
--
The candlestick close matters more than the wick: a solid close means the direction is real.
For example: $ARIA 1-hour drop of 11.72% to 0.191. No matter how fierce the market, set your defense level first.
The candlestick close matters more than the wick: a solid close means the direction is real.
For example: $ARIA 1-hour drop of 11.72% to 0.191. No matter how fierce the market, set your defense level first.
For example: $ARIA 1-hour drop of 11.72% to 0.191. No matter how fierce the market, set your defense level first.
1
·
--
See translation
📊 数据说话:$BTC 66723.67|1h -0.68%|4h -0.71%|24h -4.51%|成交 13.7亿
背景:数据:美国政府持有 30.679 万枚比特币、1.743 万枚 ETH 及其他加密资产,总价值约 205.7 亿美元
盘面偏弱,消息面能不能改变节奏,看后续成交。
你们更相信技术面还是情绪?
📊 数据说话:$BTC 66723.67|1h -0.68%|4h -0.71%|24h -4.51%|成交 13.7亿
背景:数据:美国政府持有 30.679 万枚比特币、1.743 万枚 ETH 及其他加密资产,总价值约 205.7 亿美元
盘面偏弱,消息面能不能改变节奏,看后续成交。
你们更相信技术面还是情绪?
背景:数据:美国政府持有 30.679 万枚比特币、1.743 万枚 ETH 及其他加密资产,总价值约 205.7 亿美元
盘面偏弱,消息面能不能改变节奏,看后续成交。
你们更相信技术面还是情绪?
1
·
--
Unusual trading volume: Volume surged 14.2x over $XLM 5 minutes, while the price fell 0.4%.
Do you think it’s going up or down next? Leave a comment and pick a side.
Unusual trading volume: Volume surged 14.2x over $XLM 5 minutes, while the price fell 0.4%.
Do you think it’s going up or down next? Leave a comment and pick a side.
Do you think it’s going up or down next? Leave a comment and pick a side.
2
·
--
Developer track prizes up to $5,000 | $BNB
Only simultaneous movement in trading volume and price counts. If the price moves but volume doesn't, be skeptical.
Developer track prizes up to $5,000 | $BNB
Only simultaneous movement in trading volume and price counts. If the price moves but volume doesn't, be skeptical.
Only simultaneous movement in trading volume and price counts. If the price moves but volume doesn't, be skeptical.
2
·
--
See translation
$BULLA 1小时级别快速拉升 +20.18%,现价 0.03634。
向上阻力看 24h 高点 0.04985 一带,有效突破才有新空间;回踩若能守住拉升起点附近,短线结构依旧偏强。
你们会怎么操作?
$BULLA 1小时级别快速拉升 +20.18%,现价 0.03634。
向上阻力看 24h 高点 0.04985 一带,有效突破才有新空间;回踩若能守住拉升起点附近,短线结构依旧偏强。
你们会怎么操作?
向上阻力看 24h 高点 0.04985 一带,有效突破才有新空间;回踩若能守住拉升起点附近,短线结构依旧偏强。
你们会怎么操作?
·
--
Market notes | $BULLA
15 min +19.63%, 24h -25.76%
The smoother the rally, the more you should move your stop-loss upward.
#BULLA
Market notes | $BULLA
15 min +19.63%, 24h -25.76%
The smoother the rally, the more you should move your stop-loss upward.
#BULLA
15 min +19.63%, 24h -25.76%
The smoother the rally, the more you should move your stop-loss upward.
#BULLA
1
·
--
📌 A certain whale liquidated 95% of their ETH holdings, taking a loss of about $1.27 million
$ETH .
I’m used to marking the time a news item comes out on the intraday chart, then looking back to compare the changes.
📌 A certain whale liquidated 95% of their ETH holdings, taking a loss of about $1.27 million
$ETH .
I’m used to marking the time a news item comes out on the intraday chart, then looking back to compare the changes.
$ETH .
I’m used to marking the time a news item comes out on the intraday chart, then looking back to compare the changes.
8
·
--
Total losses are about $35.69 million, and one address has added about $18.99 million to its BTC short position.
How should we interpret institutional moves? Institutional selling can easily dampen sentiment in the short term; the key is whether this is a one-off portfolio adjustment or sustained outflows.
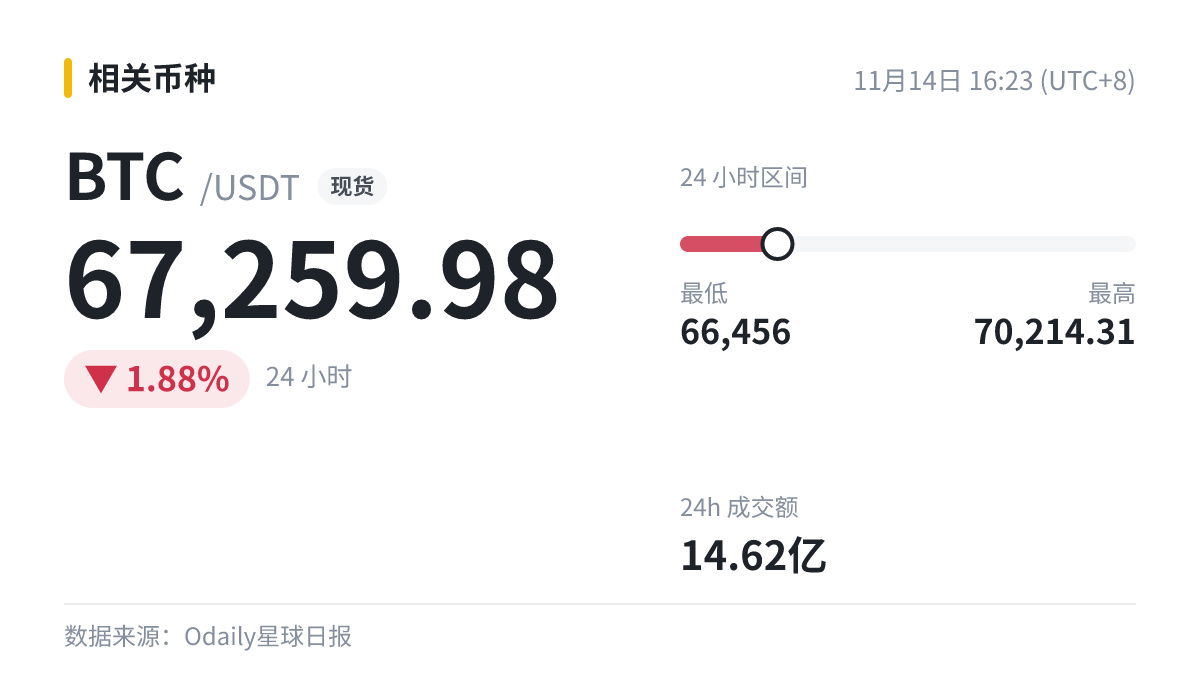
$BTC Current price: 67259.98. In one sentence, what’s your take right now?
Total losses are about $35.69 million, and one address has added about $18.99 million to its BTC short position.
How should we interpret institutional moves? Institutional selling can easily dampen sentiment in the short term; the key is whether this is a one-off portfolio adjustment or sustained outflows.
$BTC Current price: 67259.98. In one sentence, what’s your take right now?
How should we interpret institutional moves? Institutional selling can easily dampen sentiment in the short term; the key is whether this is a one-off portfolio adjustment or sustained outflows.
$BTC Current price: 67259.98. In one sentence, what’s your take right now?
7
·
--
$BARD fell below the 24-hour low during trading, but the current price of 0.1233 has already moved back above the previous low of 0.1232.
Keep a close eye on this price action:
· Holding above the previous low of 0.1232 could be a bear trap
· A renewed break below it would confirm that the downtrend is continuing
Do you think this is the beginning or the end?
#BARD
$BARD fell below the 24-hour low during trading, but the current price of 0.1233 has already moved back above the previous low of 0.1232.
Keep a close eye on this price action:
· Holding above the previous low of 0.1232 could be a bear trap
· A renewed break below it would confirm that the downtrend is continuing
Do you think this is the beginning or the end?
#BARD
Keep a close eye on this price action:
· Holding above the previous low of 0.1232 could be a bear trap
· A renewed break below it would confirm that the downtrend is continuing
Do you think this is the beginning or the end?
#BARD
·
--
$SHELL Rose 7.91% over 15 minutes, trading at 0.0332, with a 24-hour range of 0.0192–0.05163.
A genuine trend needs a series of higher highs and lows; one or two candlesticks are only the beginning.
After a rally, leveraged long positions usually enter too. If the funding rate gets too high, watch out for longs getting squeezed.
$SHELL Rose 7.91% over 15 minutes, trading at 0.0332, with a 24-hour range of 0.0192–0.05163.
A genuine trend needs a series of higher highs and lows; one or two candlesticks are only the beginning.
After a rally, leveraged long positions usually enter too. If the funding rate gets too high, watch out for longs getting squeezed.
A genuine trend needs a series of higher highs and lows; one or two candlesticks are only the beginning.
After a rally, leveraged long positions usually enter too. If the funding rate gets too high, watch out for longs getting squeezed.
2
·
--
📌 Trending search ranking #11: Genshin Impact story PV
Correlation: blockchain game → $SAND (-1.9%)
Getting ready to compare prices before and after it appeared in trending searches to see whether it actually had an impact.
📌 Trending search ranking #11: Genshin Impact story PV
Correlation: blockchain game → $SAND (-1.9%)
Getting ready to compare prices before and after it appeared in trending searches to see whether it actually had an impact.
Correlation: blockchain game → $SAND (-1.9%)
Getting ready to compare prices before and after it appeared in trending searches to see whether it actually had an impact.
·
--
📢 SBI Holdings and the National Bank of Cambodia (Cambodia’s central bank) have signed a basic agreement to collaborate on two blockchain technology tests. One involves tokenizing Cambodian government bonds, and the other involves cross-border remittances between Japan and Cambodia using a yen stablecoin (JPYSC).
The news is somewhat positive; $BTC is currently at 67018.61.
Markets sometimes price in news ahead of time, so when it comes out, it can trigger a sell-the-news reaction. How do you think big investors will respond?
📢 SBI Holdings and the National Bank of Cambodia (Cambodia’s central bank) have signed a basic agreement to collaborate on two blockchain technology tests. One involves tokenizing Cambodian government bonds, and the other involves cross-border remittances between Japan and Cambodia using a yen stablecoin (JPYSC).
The news is somewhat positive; $BTC is currently at 67018.61.
Markets sometimes price in news ahead of time, so when it comes out, it can trigger a sell-the-news reaction. How do you think big investors will respond?
The news is somewhat positive; $BTC is currently at 67018.61.
Markets sometimes price in news ahead of time, so when it comes out, it can trigger a sell-the-news reaction. How do you think big investors will respond?
8
·
--
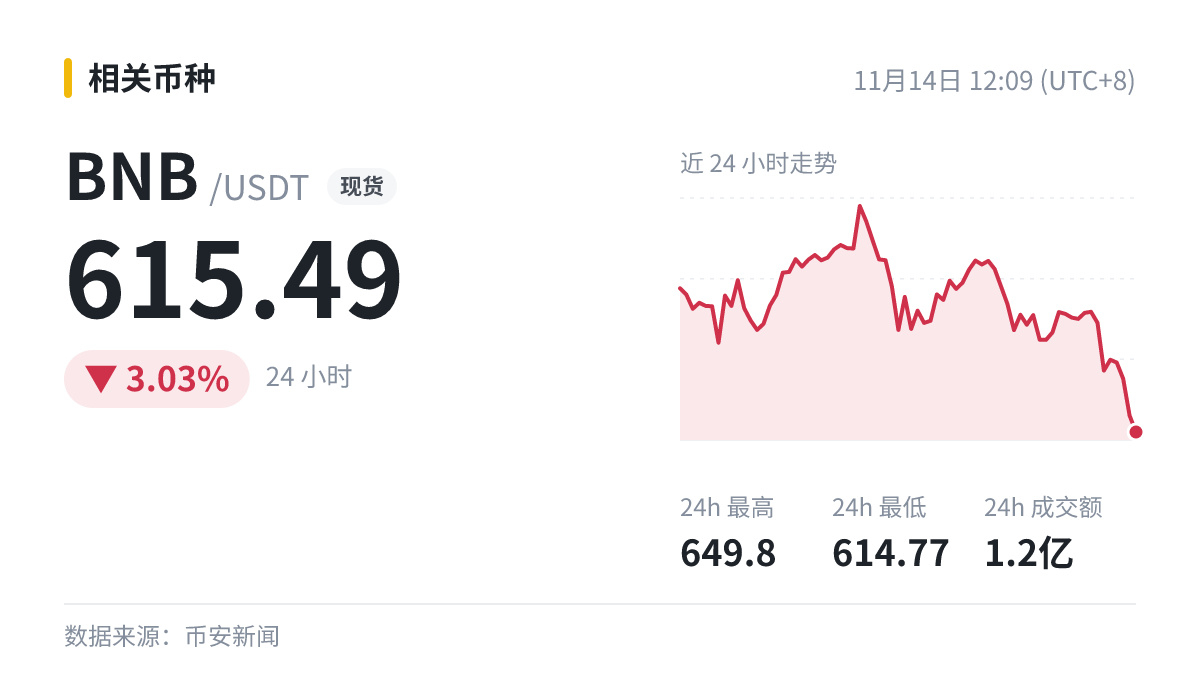
$BNB intraday: -3.03%. There’s a new development: Binance has resumed withdrawals on 87 networks and aims to restore the remaining services before next weekend.
There’s no clear directional signal, so prices will probably continue at their previous pace. Trading volume is the most honest indicator; you can tell whether the news is having an effect by looking at volume.
$BNB intraday: -3.03%. There’s a new development: Binance has resumed withdrawals on 87 networks and aims to restore the remaining services before next weekend.
There’s no clear directional signal, so prices will probably continue at their previous pace. Trading volume is the most honest indicator; you can tell whether the news is having an effect by looking at volume.
There’s no clear directional signal, so prices will probably continue at their previous pace. Trading volume is the most honest indicator; you can tell whether the news is having an effect by looking at volume.
Log in to explore more content
Join global crypto users on Binance Square
⚡️ Get latest and useful information about crypto.
💬 Trusted by the world’s largest crypto exchange.
👍 Discover real insights from verified creators.
Email / Phone number
Trending Topics
CryptoSelloffTriggersMultipleWhaleLiquidations
853 views
56 Discussing
Crypto Liquidations Top $2B in 24 Hours as 329,000 Traders Are Wiped Out
Binance News
·5 Likes
·1.6k views
USSpotXRPETFsSeeLargestWeeklyOutflowIn8Months
43,148 views
502 Discussing
WillFOMCMinutesReinforceRateHikeExpectations?
36 views
13 Discussing