
Luam Rámsër
74 Posts

Luam Rámsër
Trader no mercado forex com mais de 7 anos de experiência.
26 Following
72 Followers
161 Liked
Posts
All
Videos
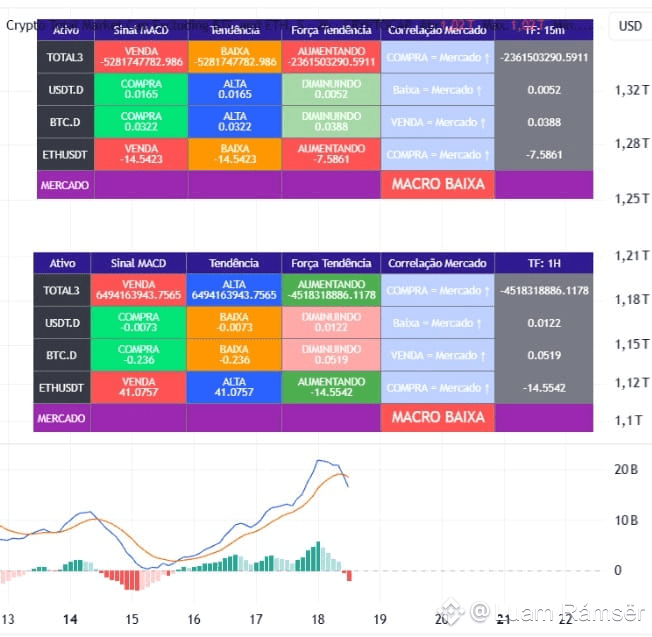
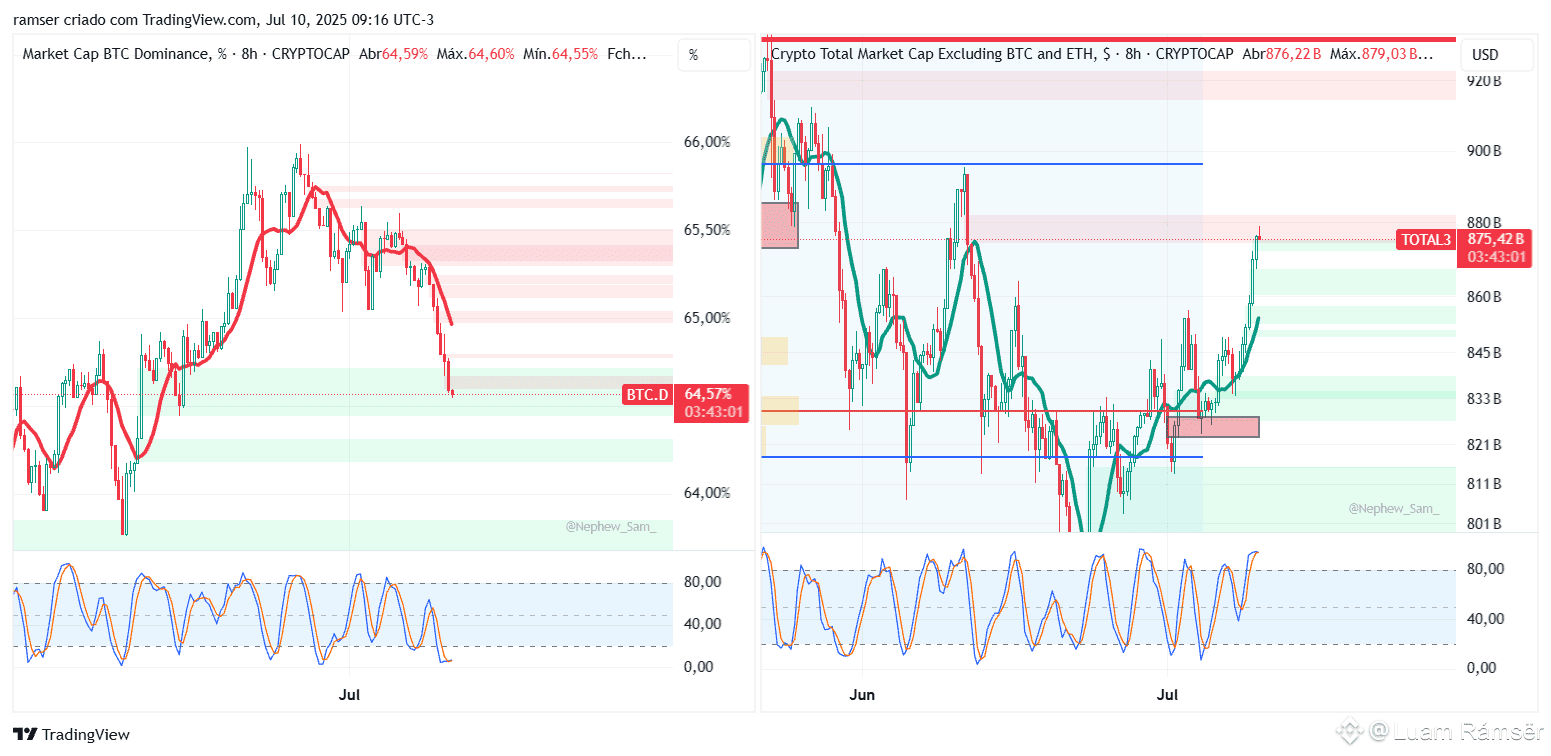
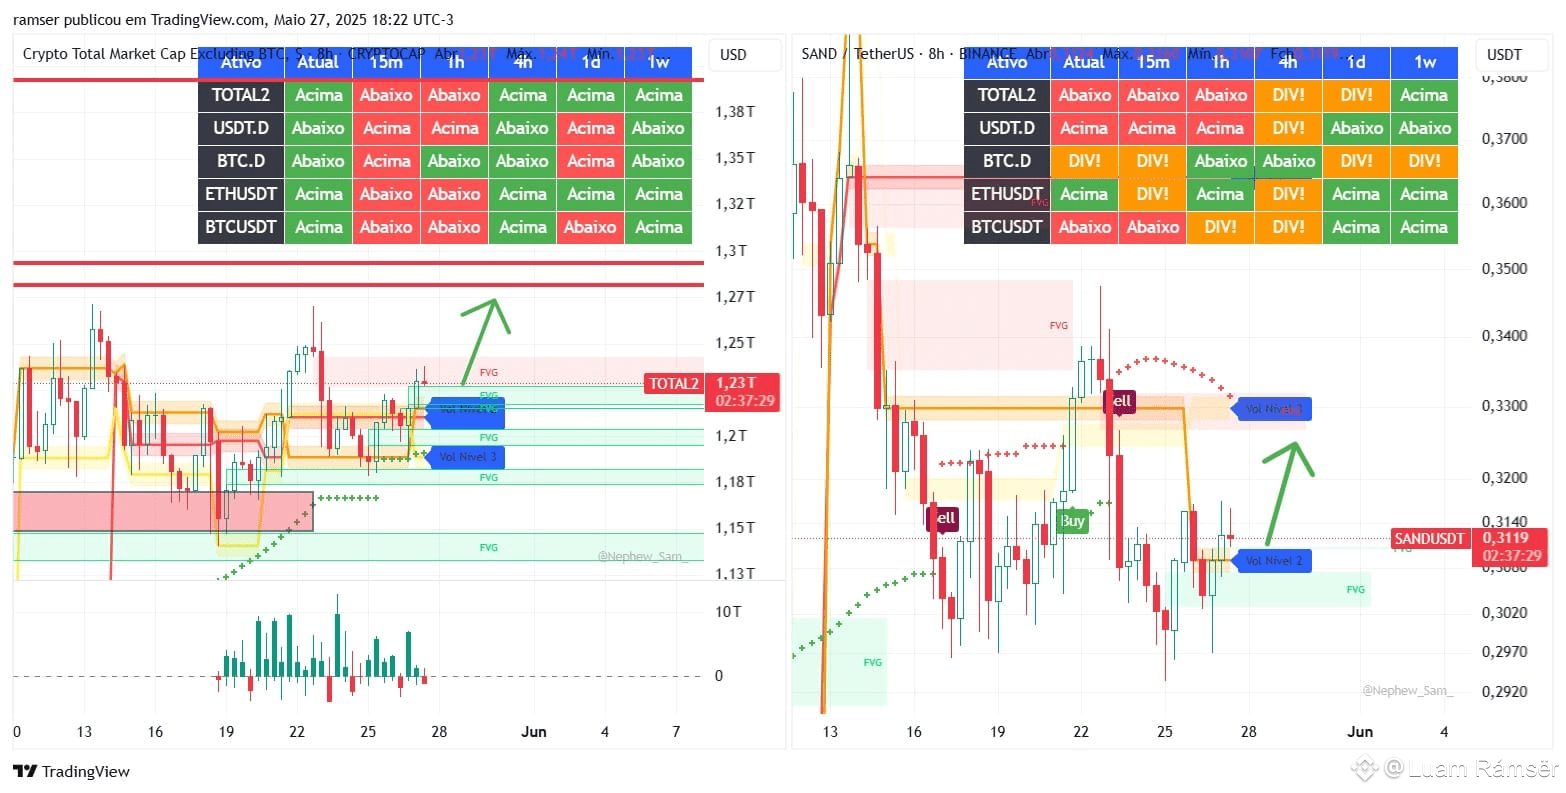
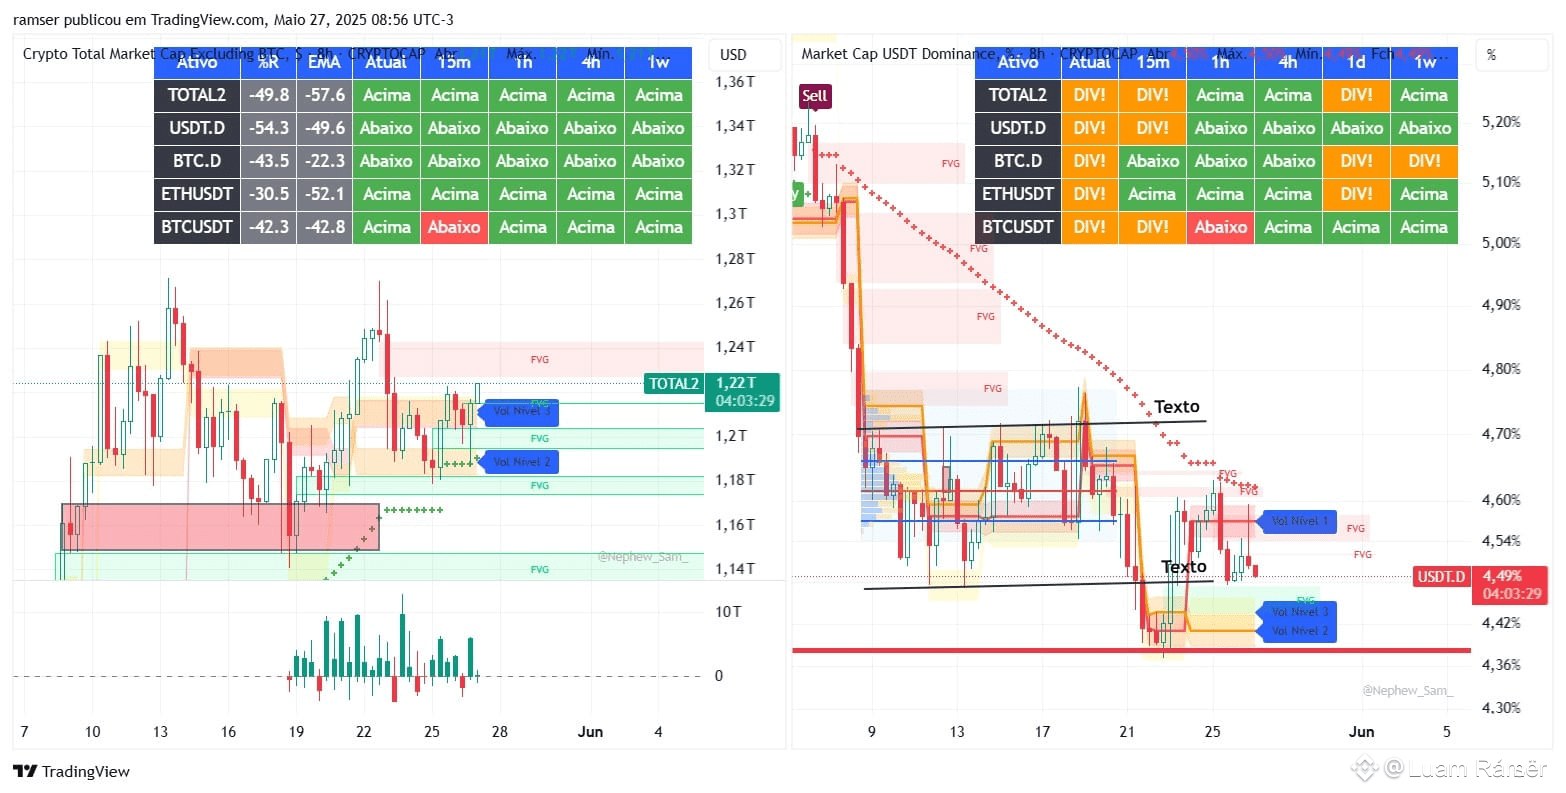
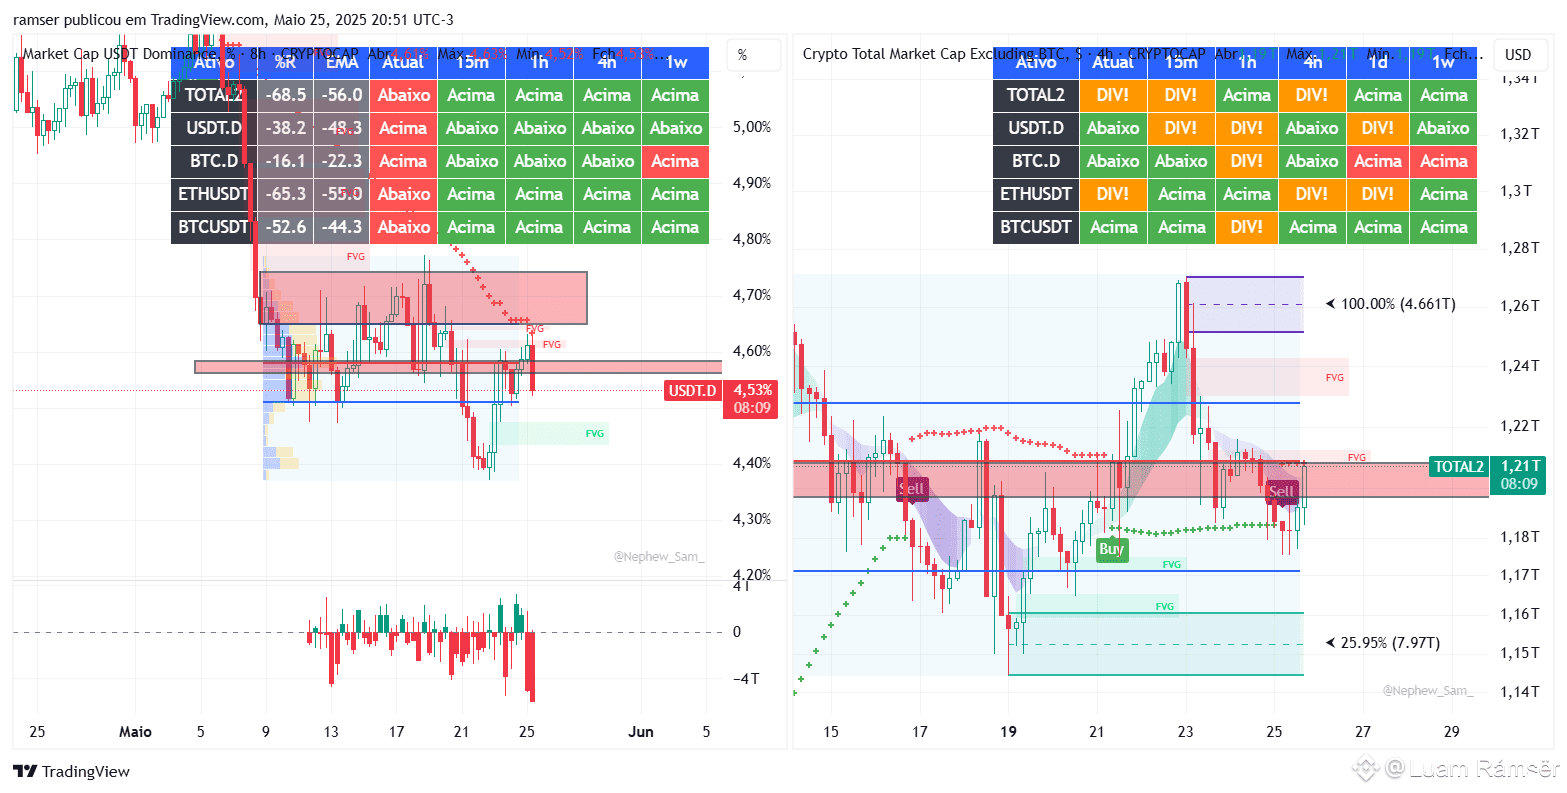
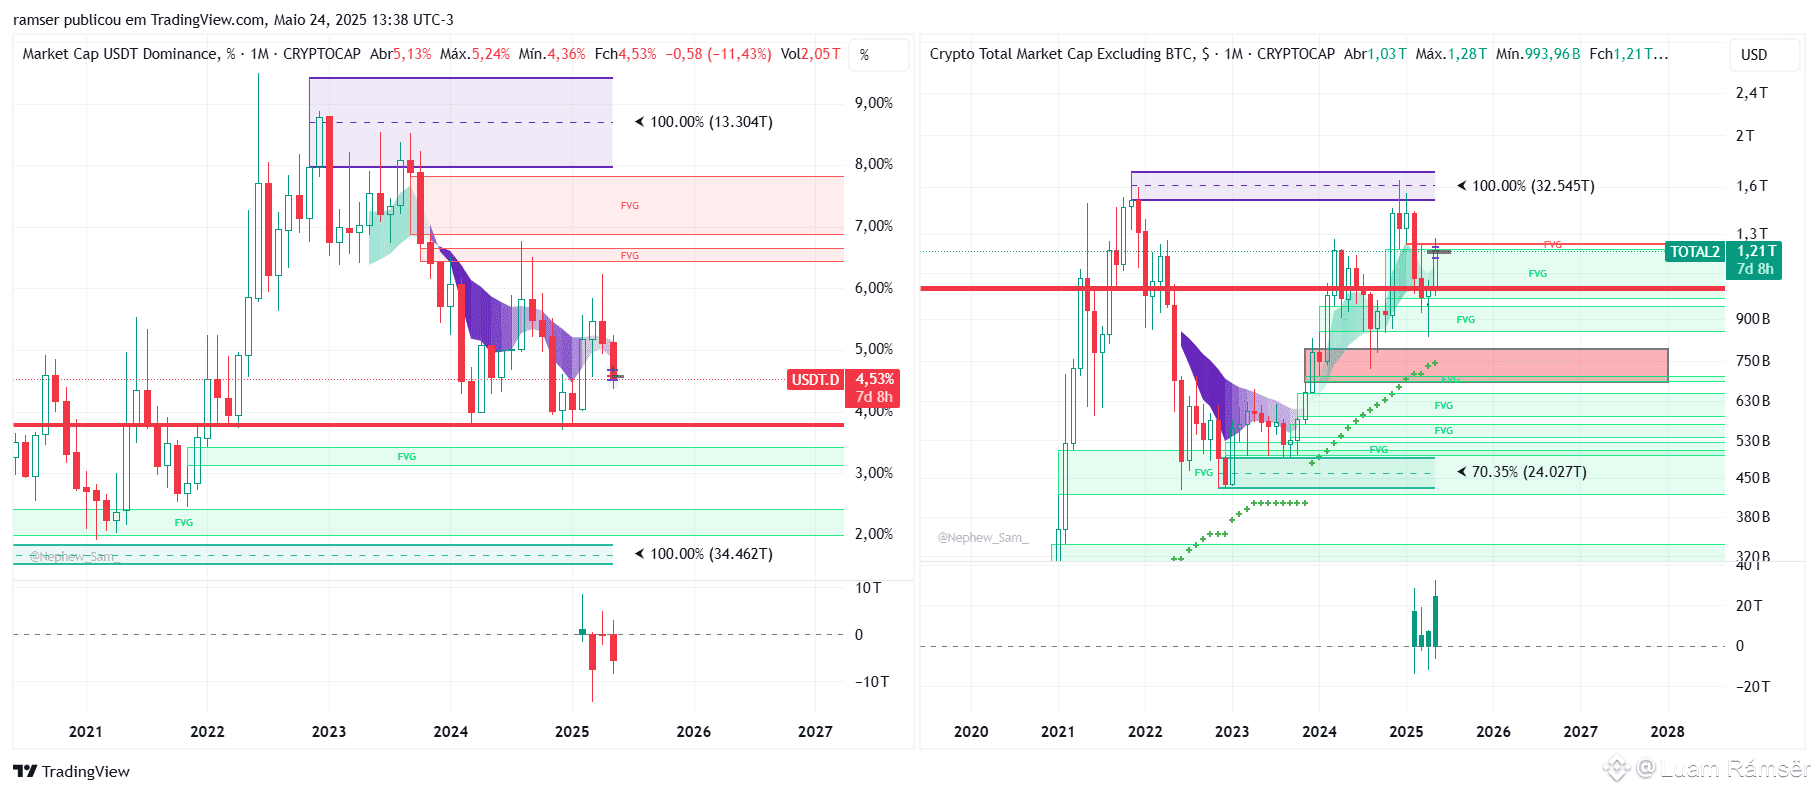
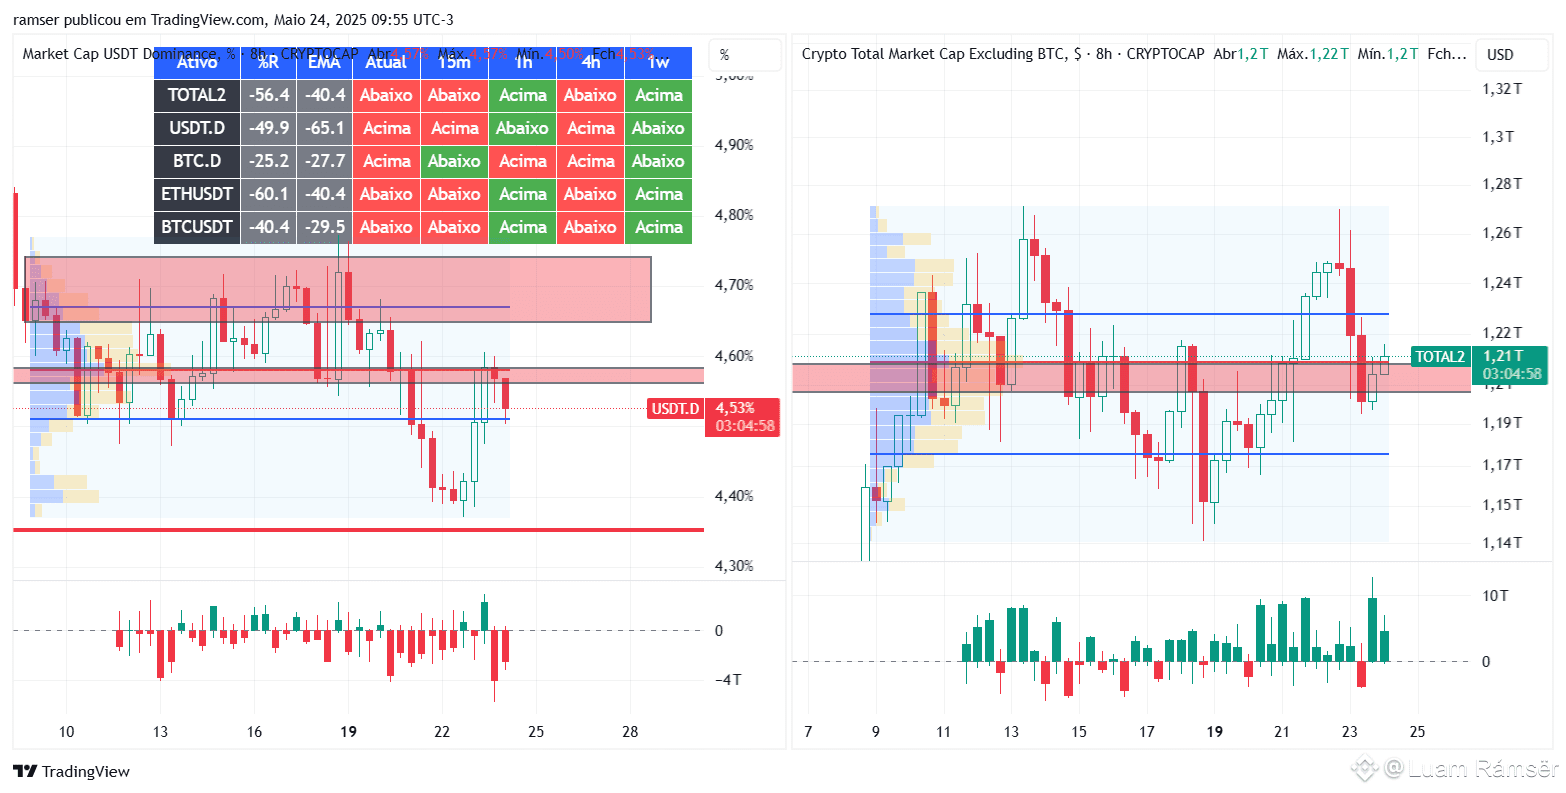
Monthly Chart, in this case, the upward movement becomes more perfect, we have USDT.D in a downtrend, with it falling representing more money entering the market, and next to it we have TOTAL3 clearly showing the upward movement with several FVG of buying strength.$BTC $ETH $SOL
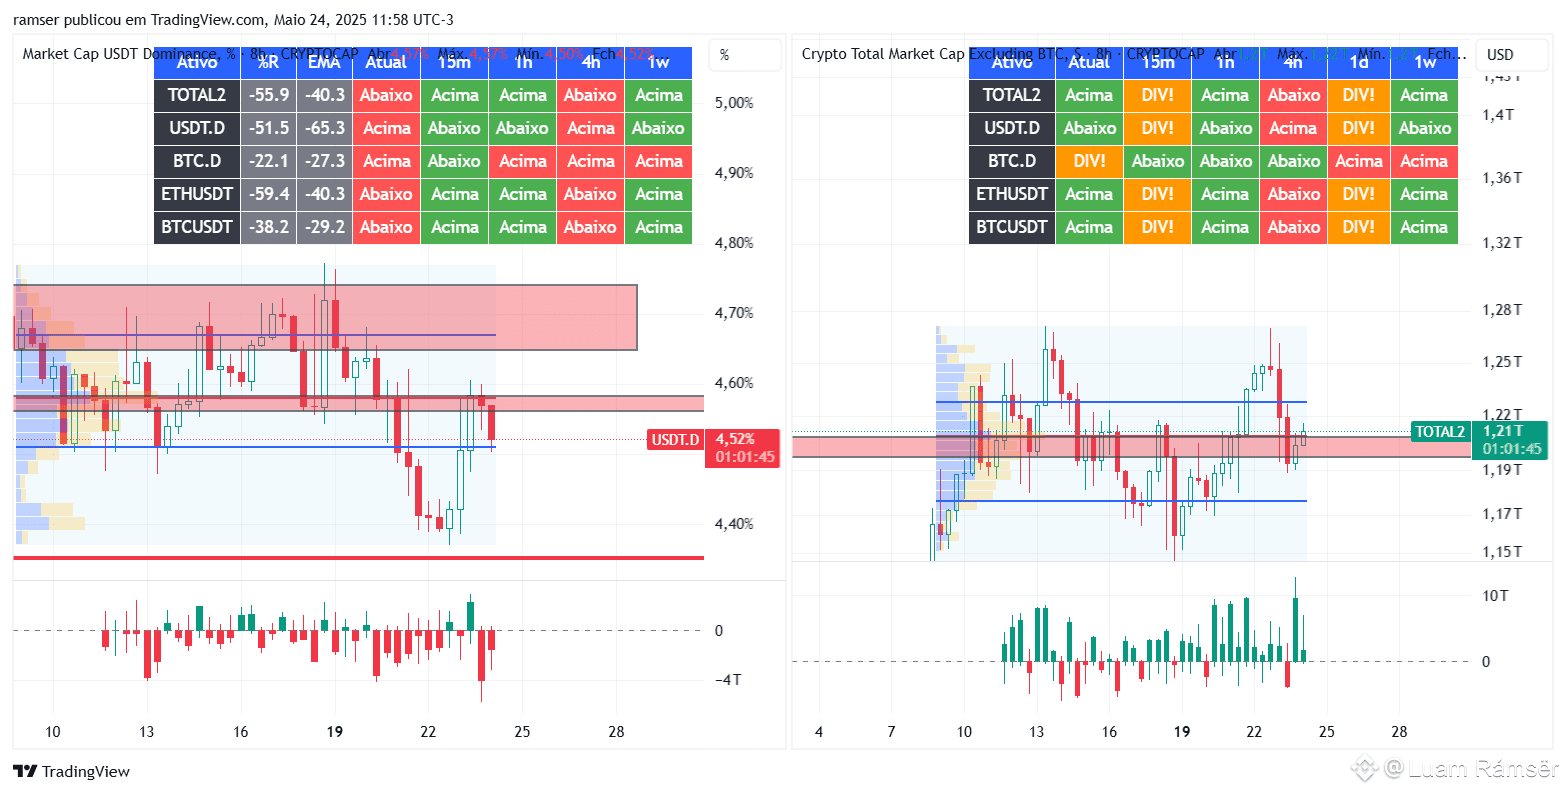
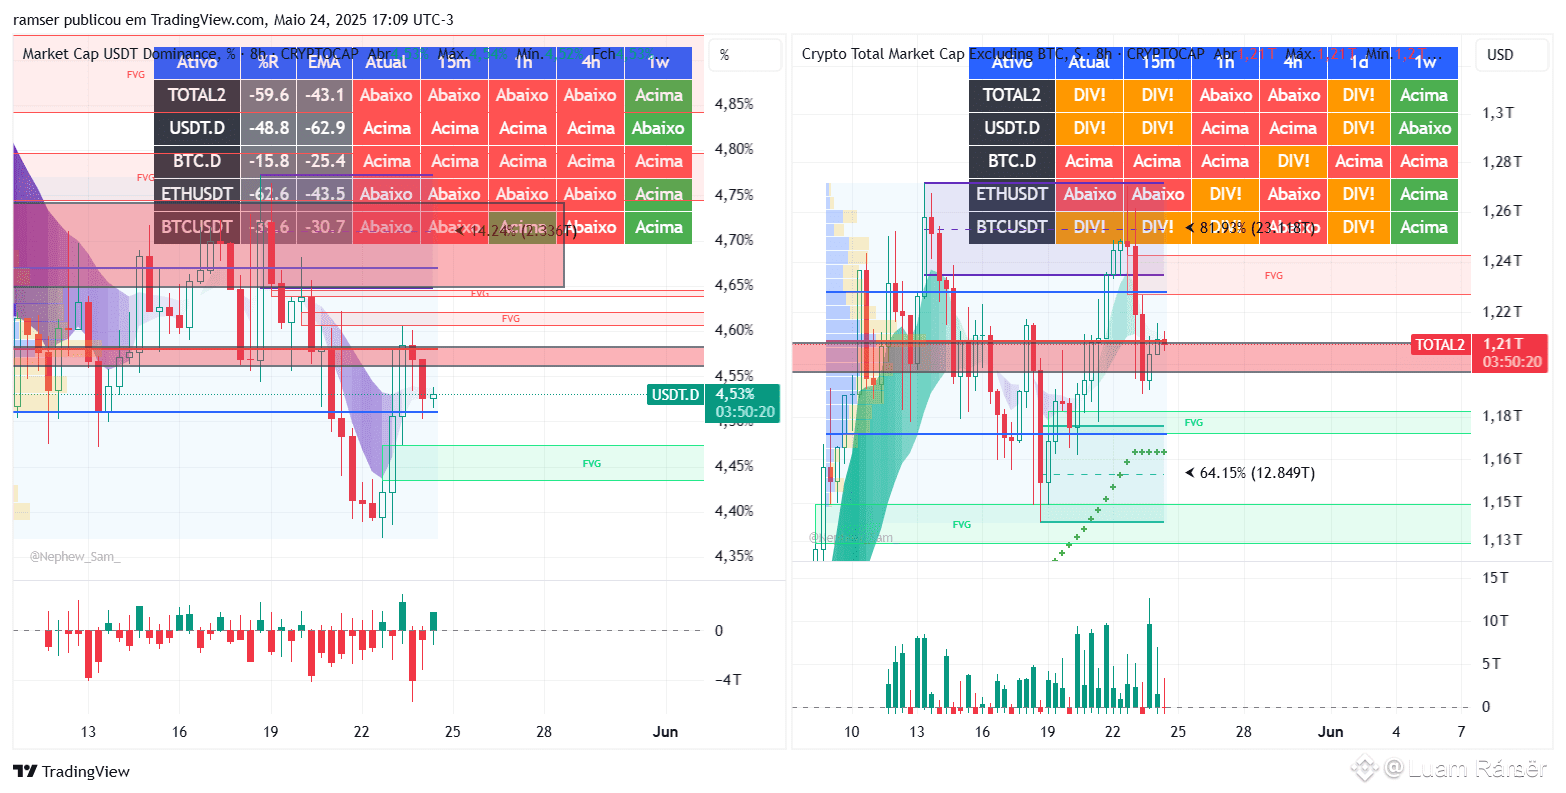
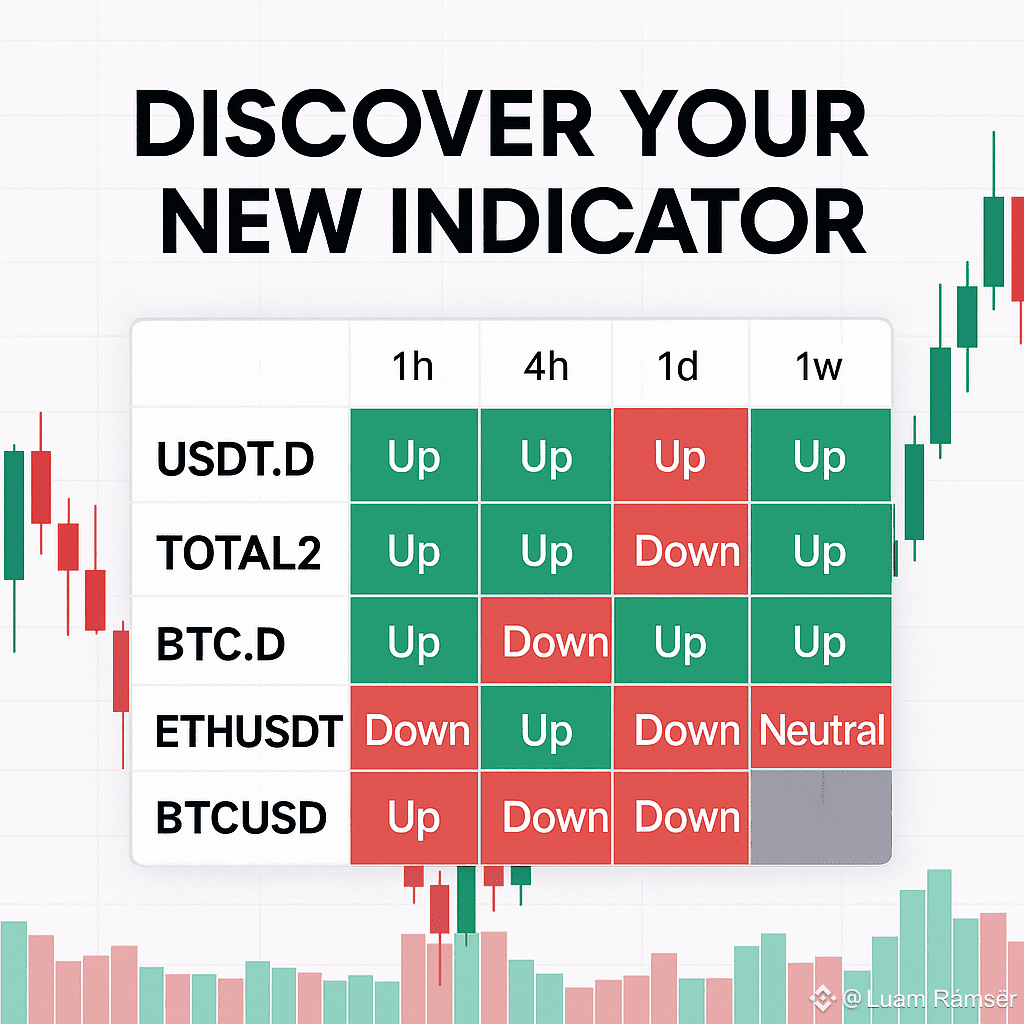
Discover the indicator that takes your crypto analysis to the next level!
🔎 Complete Market View: Track USDT.D, TOTAL2, BTC.D, ETHUSDT and BTCUSD across 1h, 4h, 1d and 1w.
📊 Clean Table Layout: All crucial metrics in one place—no cluttered overlays.
🚀 Ready to upgrade your edge?
#CryptoTools #TradingView #USDTD #TOTAL2 #BTCD #ETHUSDT #BTCUSD #CryptoTrading #MarketAnalysis
$ETH $XRP $BTC
🔎 Complete Market View: Track USDT.D, TOTAL2, BTC.D, ETHUSDT and BTCUSD across 1h, 4h, 1d and 1w.
📊 Clean Table Layout: All crucial metrics in one place—no cluttered overlays.
🚀 Ready to upgrade your edge?
#CryptoTools #TradingView #USDTD #TOTAL2 #BTCD #ETHUSDT #BTCUSD #CryptoTrading #MarketAnalysis
$ETH $XRP $BTC
$XRP $BTC $SOL
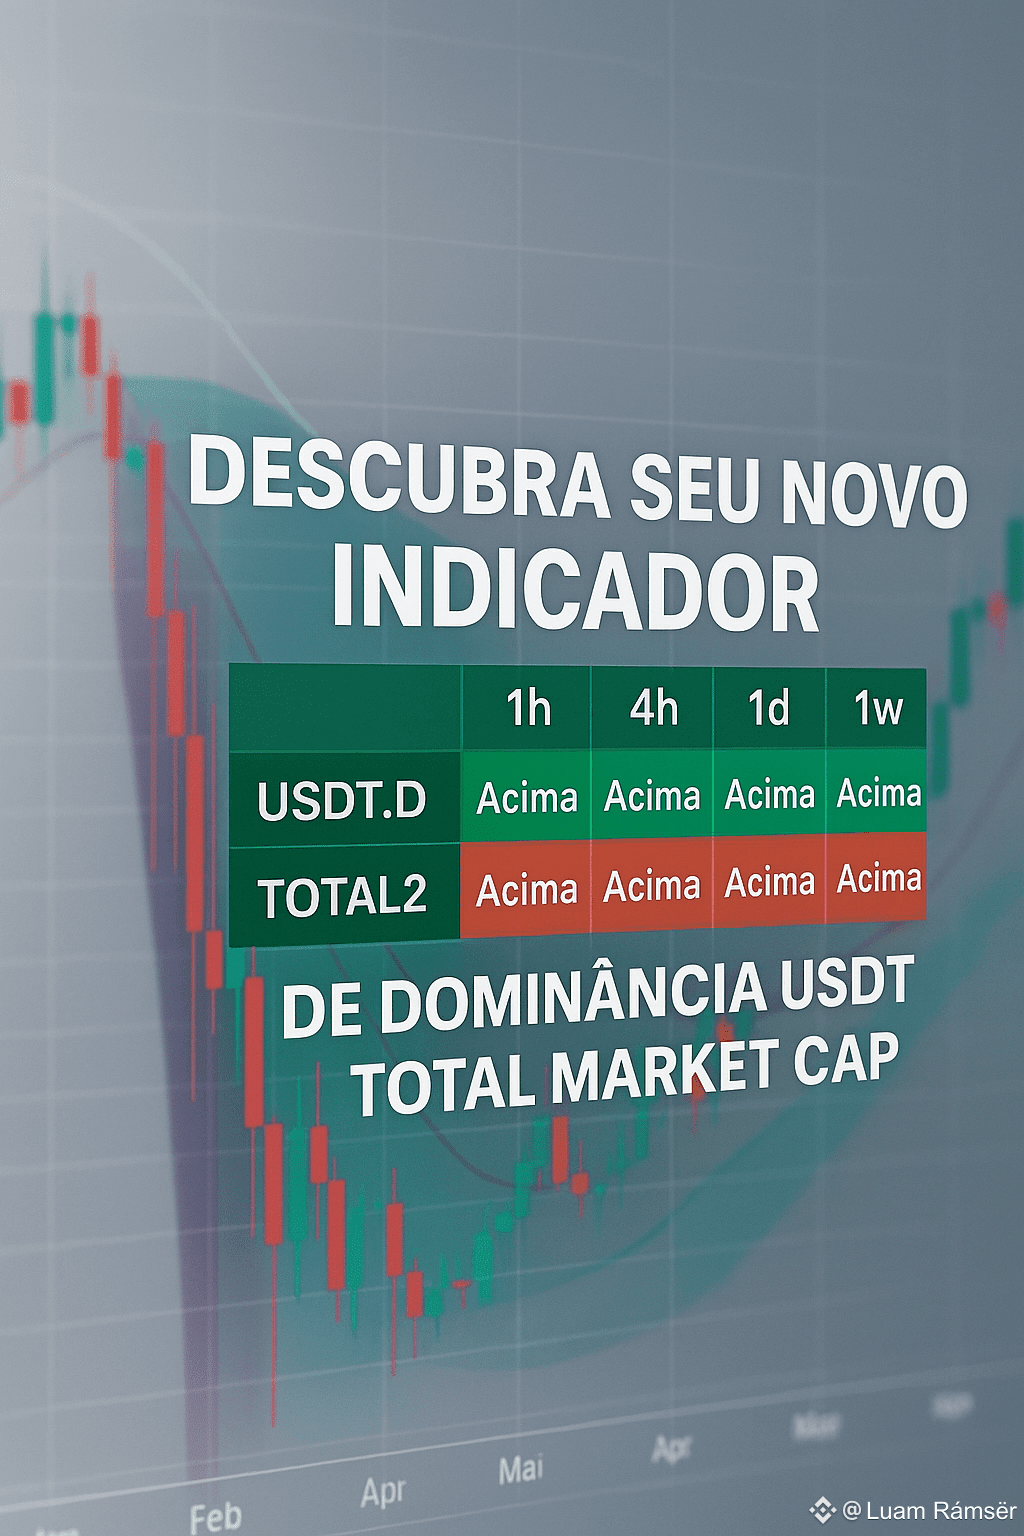
Discover the indicator that will take your crypto analysis to another level!
🔎 Complete View: USDT.D, TOTAL2, BTC.D, ETHUSDT, and BTCUSD in 1h, 4h, 1d, and 1w.
📈 Everything in a clean table: no clutter from overlaps in the chart – just actionable data for USDT.D and BTC.D.
#CryptoTools #TradingView #USDTD #TOTAL2 #BTCD #ETHUSDT #BTCUSD #DayTrade #DigitalInvestment
Discover the indicator that will take your crypto analysis to another level!
🔎 Complete View: USDT.D, TOTAL2, BTC.D, ETHUSDT, and BTCUSD in 1h, 4h, 1d, and 1w.
📈 Everything in a clean table: no clutter from overlaps in the chart – just actionable data for USDT.D and BTC.D.
#CryptoTools #TradingView #USDTD #TOTAL2 #BTCD #ETHUSDT #BTCUSD #DayTrade #DigitalInvestment
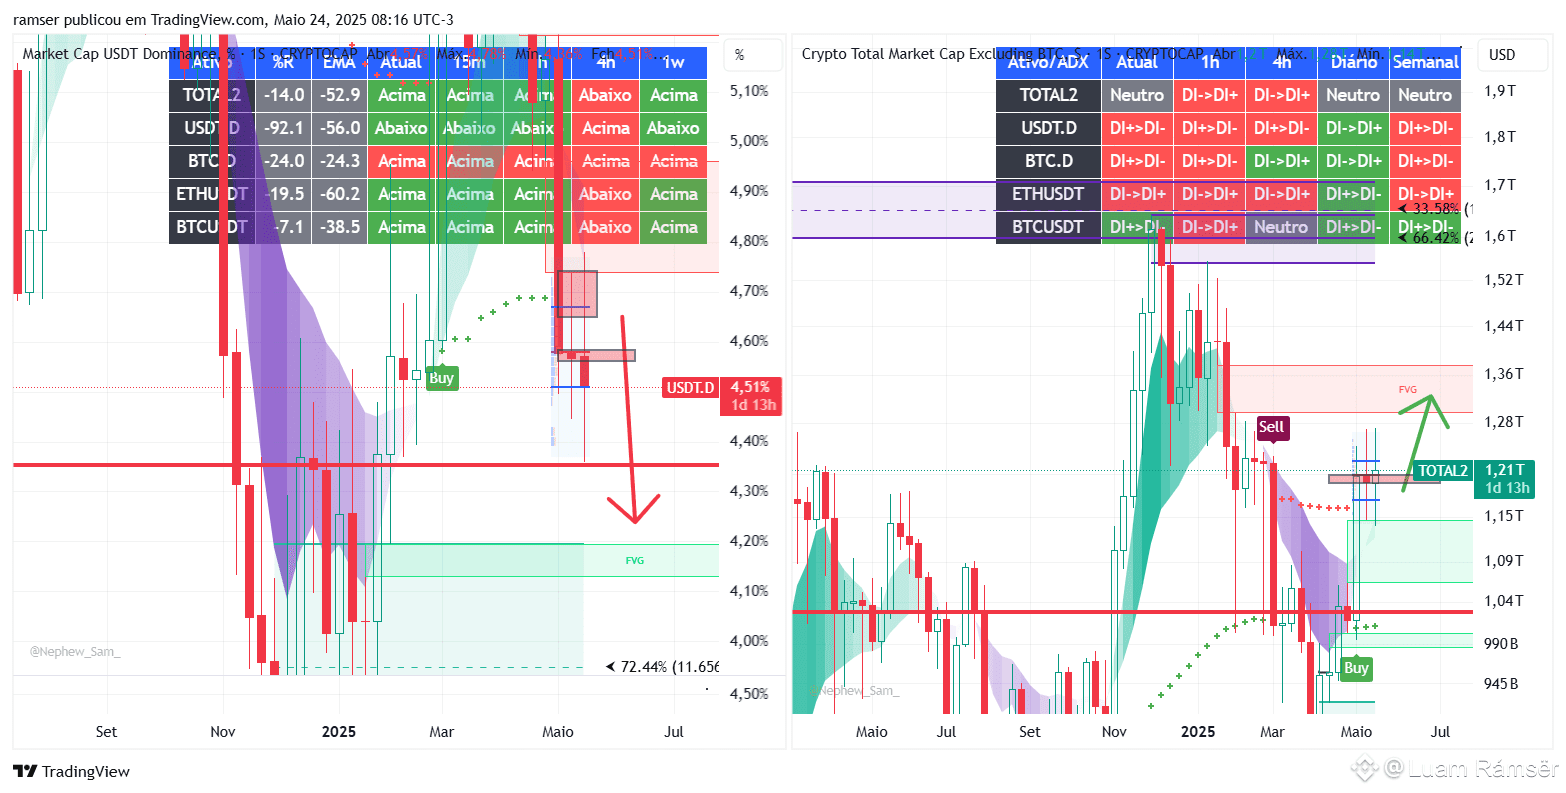
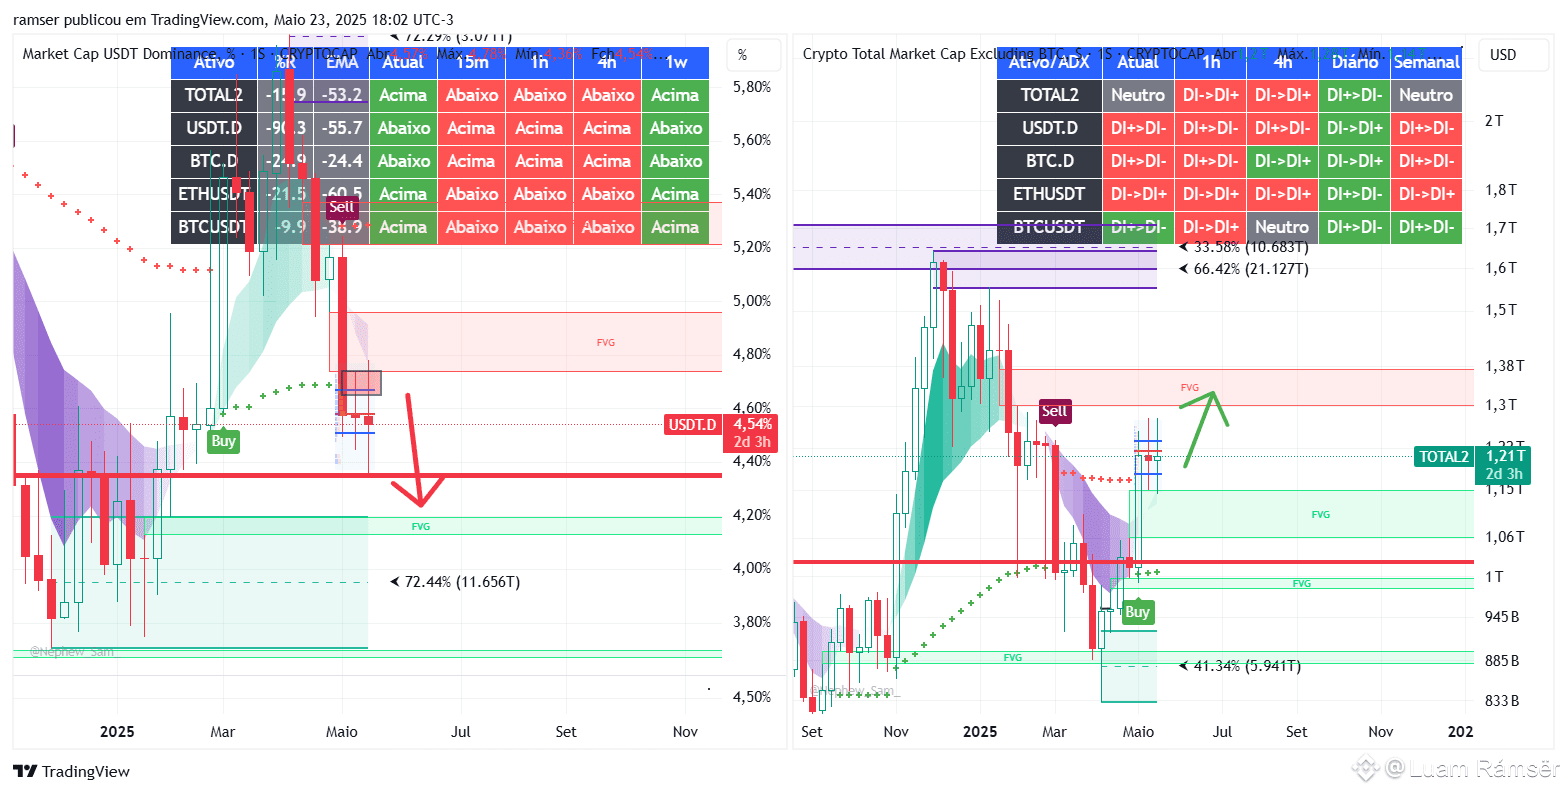
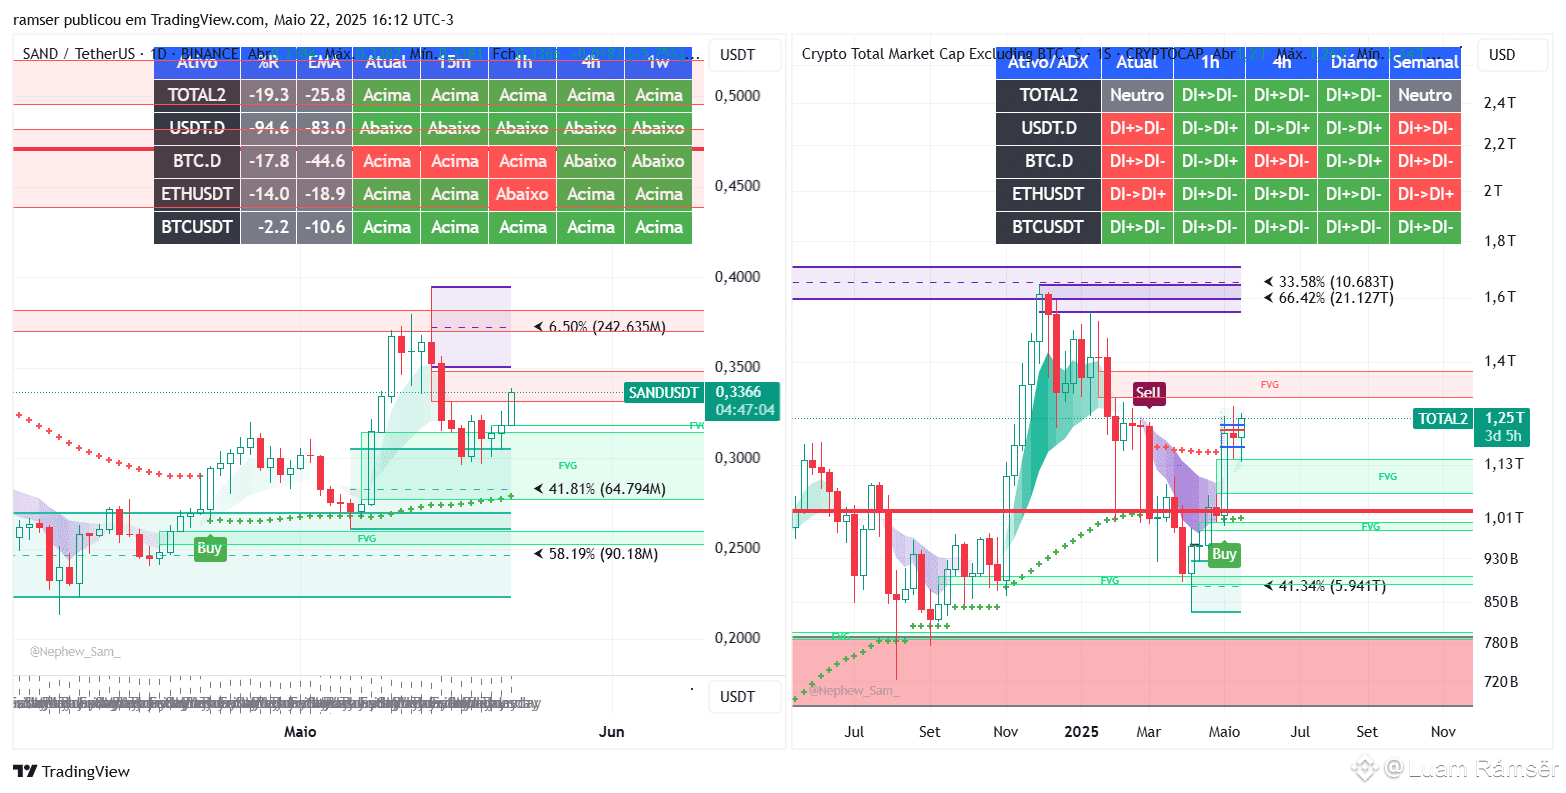
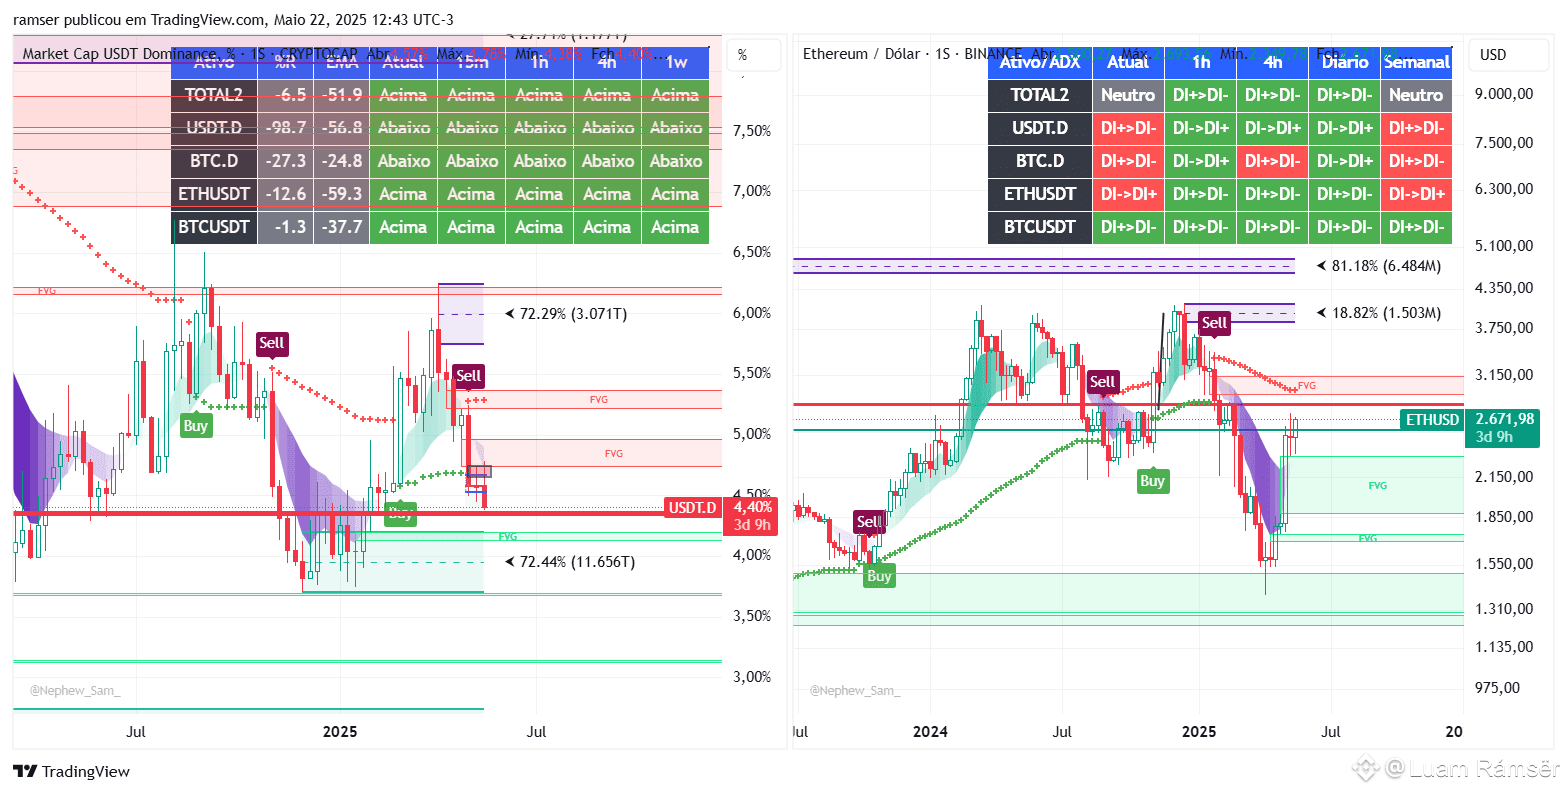
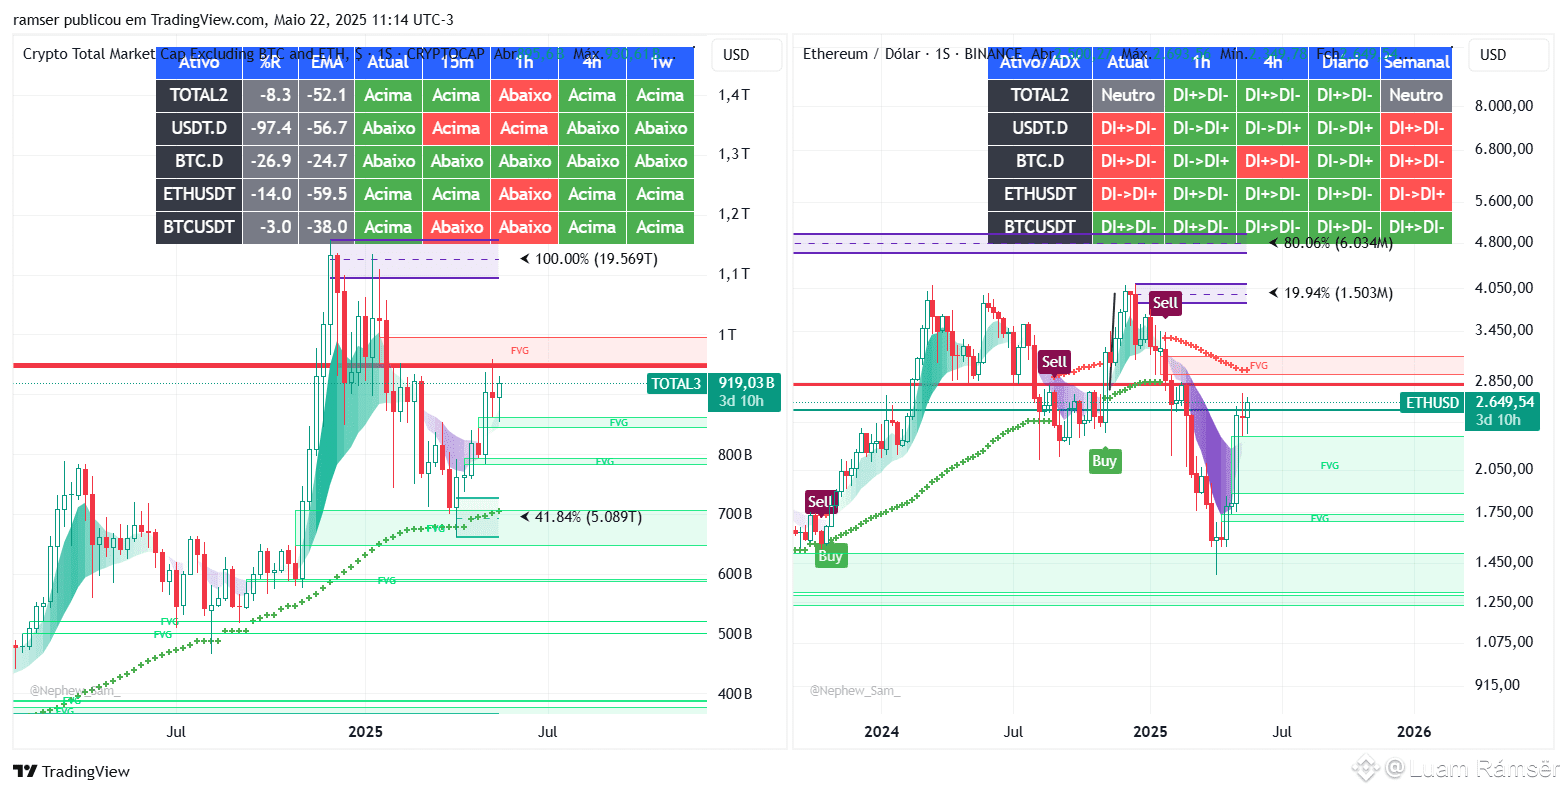
The cryptocurrency market is basically like a big algorithm; in fact, all markets operate this way. However, regulated and more mature markets have many variables that make it difficult to understand them all at once, but the cryptocurrency market is newer and has fewer parties involved. The main thing you need to understand is that the game here is extreme manipulation, with few big players holding a lot of cash. We don't have governments like we do with currencies and economies of countries balancing the market. That's why we see fluctuations of 6%, 10%, 20%. To avoid these long movements, you need to learn to operate by analyzing the macro; the macro is the daily chart going up. Look at the indices that make up this algorithm, USDT.D is the main one to understand the timing and flow; confirm the flow with total3, total2, ETHUSDT, and BTCUSD.$ETH $BTC $SOL
Log in to explore more content