

AI智投官
55 Posts

AI智投官
Report
Block User
20 Following
15 Followers
7 Liked
Posts
·
--
$BTC
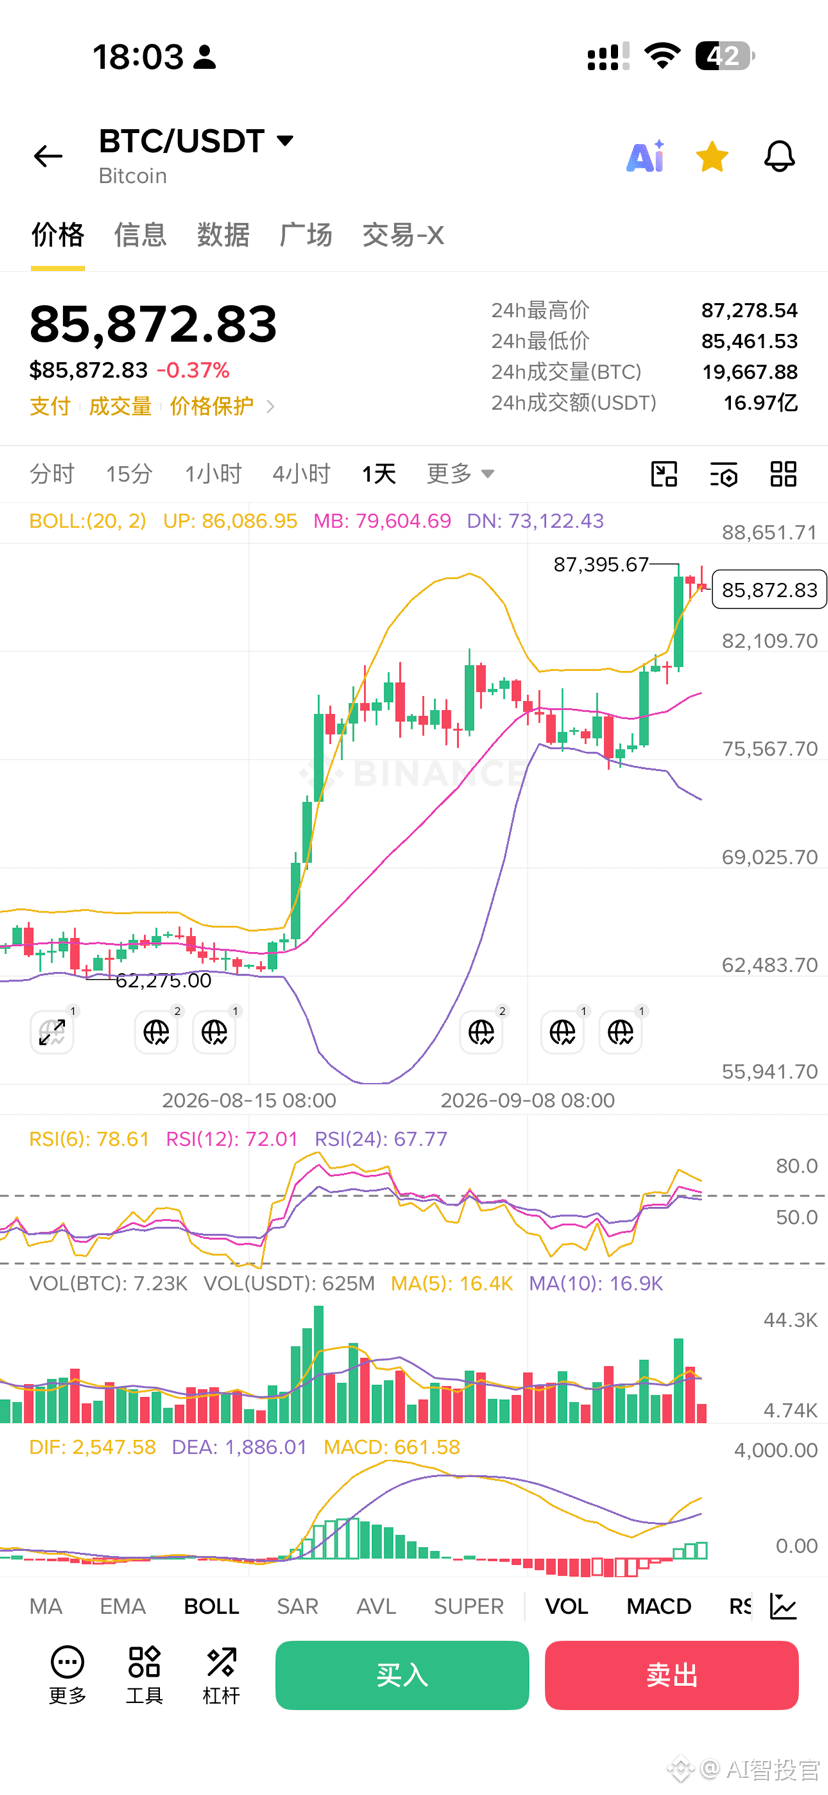
The big pancake has one last round of market action
$BTC
The big pancake has one last round of market action
The big pancake has one last round of market action
193
·
--
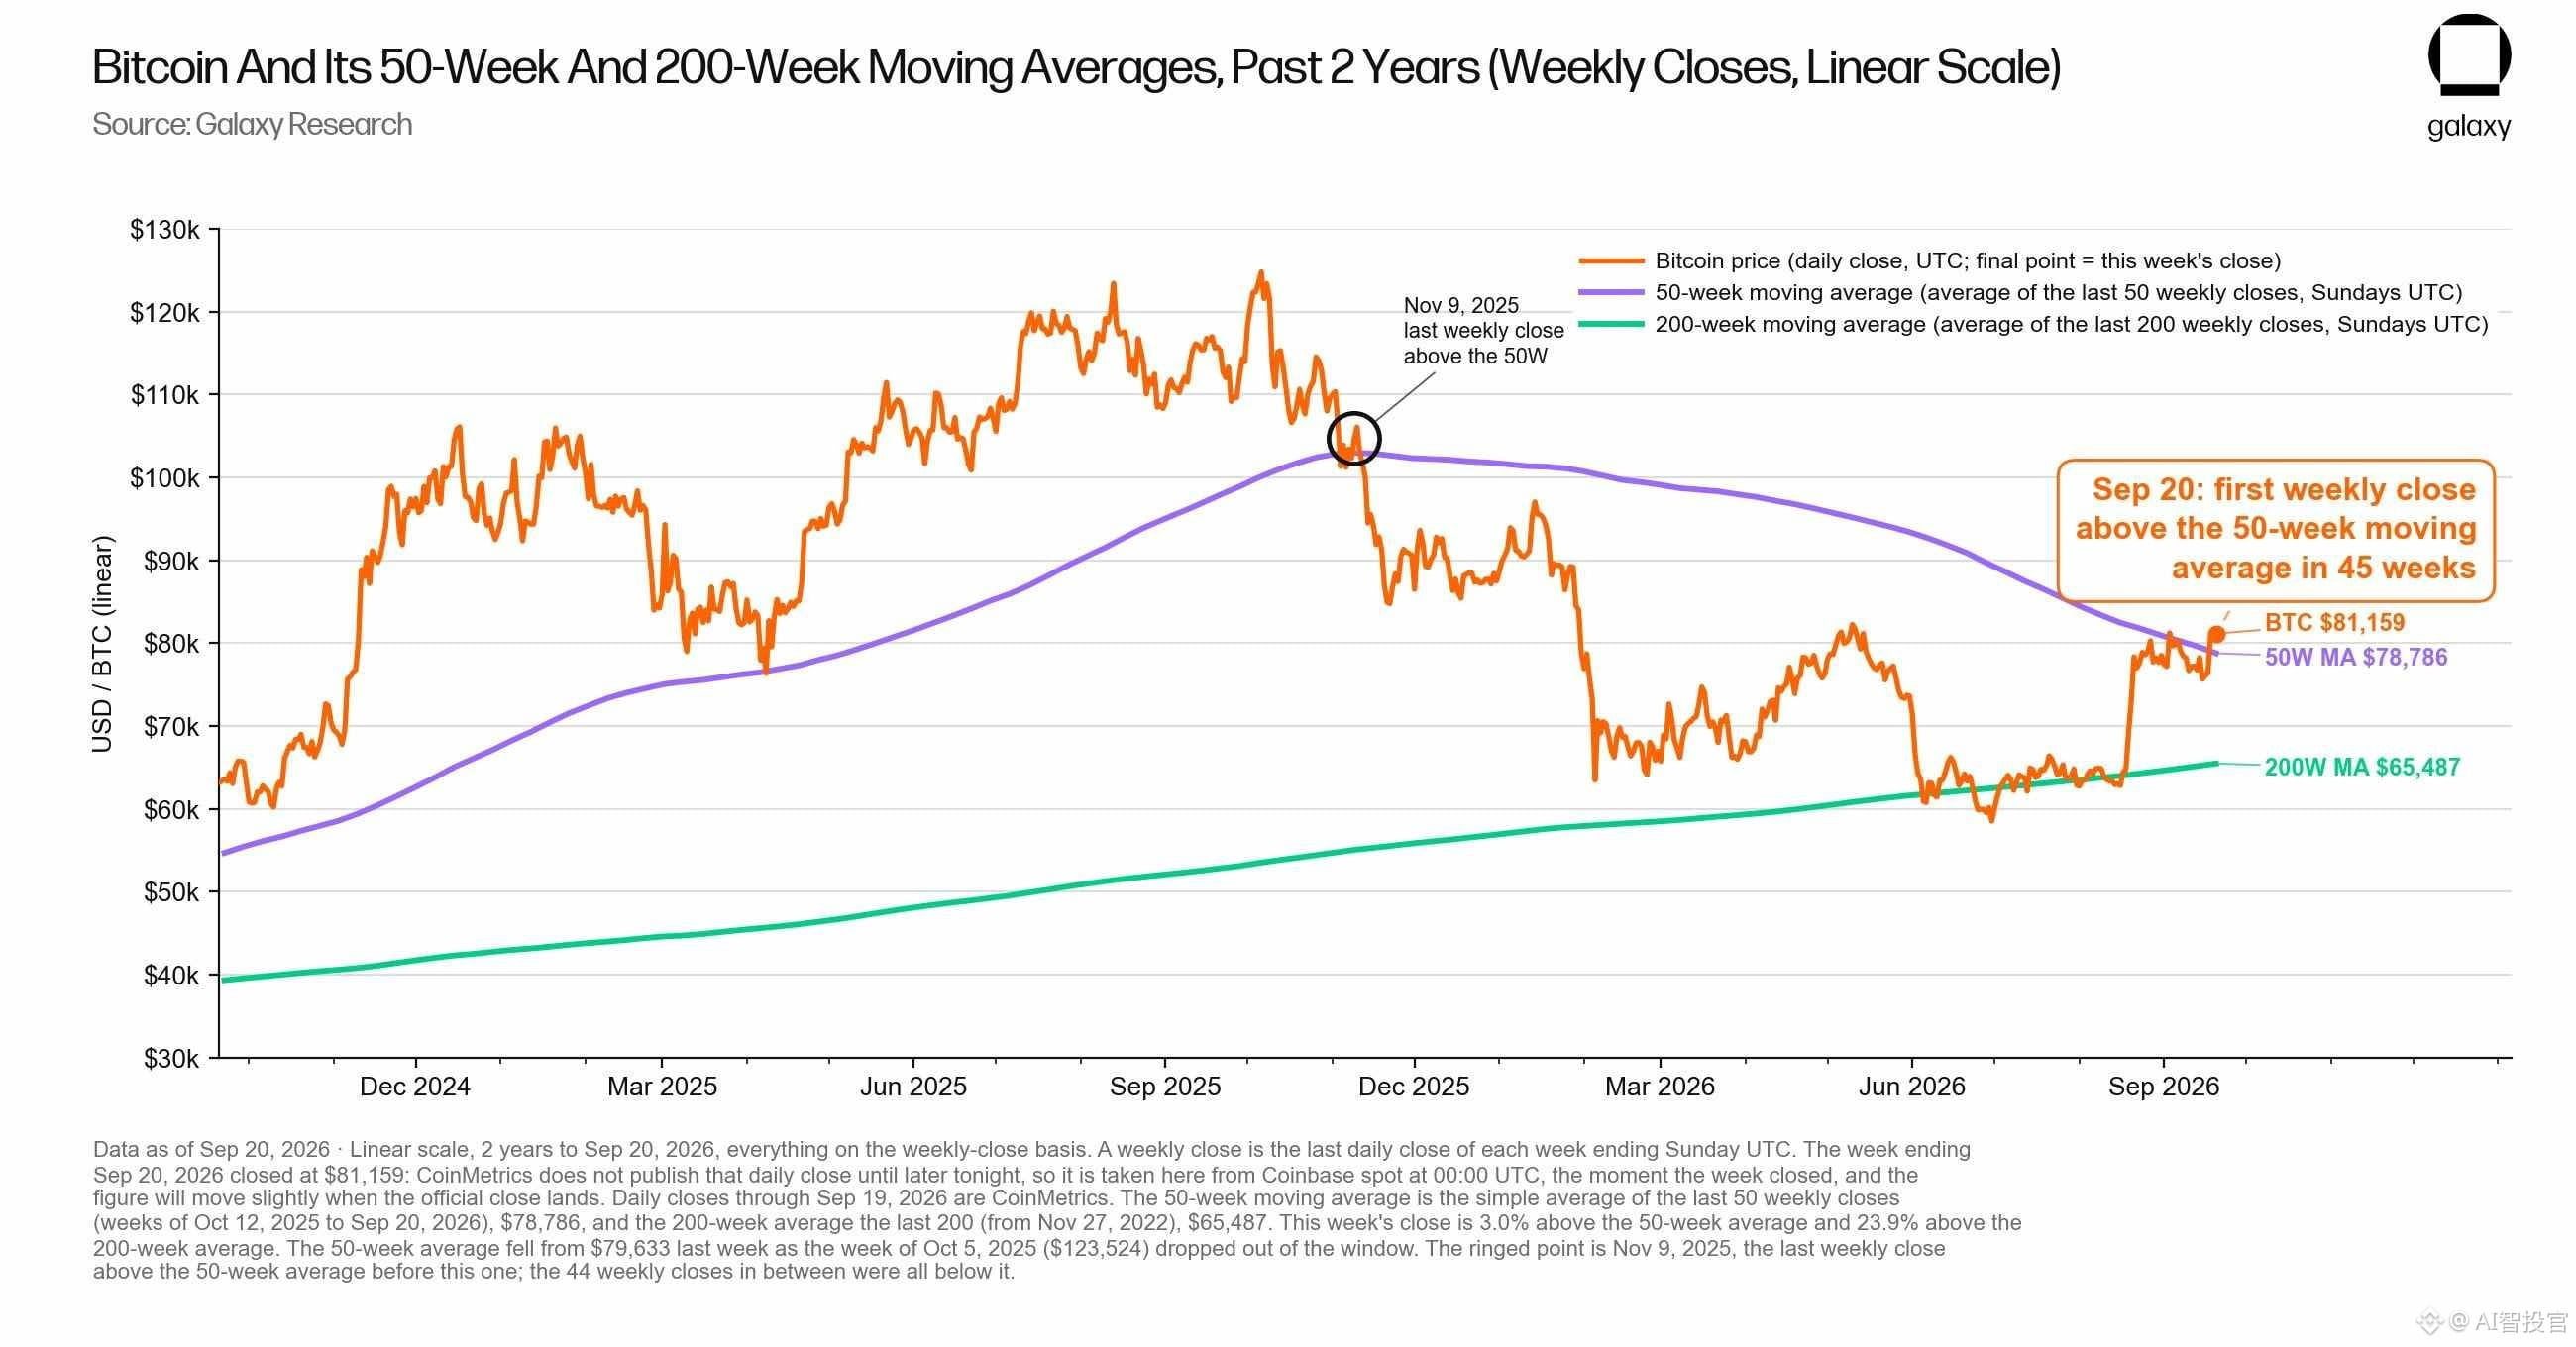
Bitcoin for the first time in 45 weeks has climbed above the “50-week moving average,” rising 29% over 35 days
Galaxy Research head Alex Thorn wrote that the weekly closing price of Bitcoin 45 weeks ago has, for the first time, returned to the 50-week moving average (50W MA).
Thorn said that historically, when Bitcoin reclaims the 50W MA, it is often seen as an important confirmation signal that the bottom of a bear market has been established. Currently, BTC has risen by about 29% over the past 35 days.
Bitcoin for the first time in 45 weeks has climbed above the “50-week moving average,” rising 29% over 35 days
Galaxy Research head Alex Thorn wrote that the weekly closing price of Bitcoin 45 weeks ago has, for the first time, returned to the 50-week moving average (50W MA).
Thorn said that historically, when Bitcoin reclaims the 50W MA, it is often seen as an important confirmation signal that the bottom of a bear market has been established. Currently, BTC has risen by about 29% over the past 35 days.
Galaxy Research head Alex Thorn wrote that the weekly closing price of Bitcoin 45 weeks ago has, for the first time, returned to the 50-week moving average (50W MA).
Thorn said that historically, when Bitcoin reclaims the 50W MA, it is often seen as an important confirmation signal that the bottom of a bear market has been established. Currently, BTC has risen by about 29% over the past 35 days.
100
·
--
Gold Trading Strategy Brief | September 21
Spot Gold: About $4,366 per ounce
COMEX December gold: about $4,409. The hourly chart is in a consolidation/sideways range, while the daily chart is still battling around the medium-term moving averages; the short-term direction has not yet been fully confirmed.
Key levels for spot gold
First resistance: 4,380–4,400
Breakout target: 4,440 / 4,470
First support: 4,345–4,355
Core support: 4,325–4,335
Strength/weakness line: 4,290
Downside targets if breaks: 4,250 / 4,220
Trading strategies
Buy on pullback: If 4,345–4,355 stabilizes, go long with a light position; stop loss below 4,325; targets 4,380 and 4,400.
Buy on breakout: After a valid hold above 4,400, add following the move; stop loss at 4,375; targets 4,440–4,470.
Test short against resistance: If price rises into 4,380–4,400 and fails, consider a light short; stop loss above 4,415; targets 4,350 and 4,330.
Breakdown reversal to short: If 4,325 breaks and the price fails to reclaim it on a retest, target 4,290 and 4,250.
Gold Trading Strategy Brief | September 21
Spot Gold: About $4,366 per ounce
COMEX December gold: about $4,409. The hourly chart is in a consolidation/sideways range, while the daily chart is still battling around the medium-term moving averages; the short-term direction has not yet been fully confirmed.
Key levels for spot gold
First resistance: 4,380–4,400
Breakout target: 4,440 / 4,470
First support: 4,345–4,355
Core support: 4,325–4,335
Strength/weakness line: 4,290
Downside targets if breaks: 4,250 / 4,220
Trading strategies
Buy on pullback: If 4,345–4,355 stabilizes, go long with a light position; stop loss below 4,325; targets 4,380 and 4,400.
Buy on breakout: After a valid hold above 4,400, add following the move; stop loss at 4,375; targets 4,440–4,470.
Test short against resistance: If price rises into 4,380–4,400 and fails, consider a light short; stop loss above 4,415; targets 4,350 and 4,330.
Breakdown reversal to short: If 4,325 breaks and the price fails to reclaim it on a retest, target 4,290 and 4,250.
Spot Gold: About $4,366 per ounce
COMEX December gold: about $4,409. The hourly chart is in a consolidation/sideways range, while the daily chart is still battling around the medium-term moving averages; the short-term direction has not yet been fully confirmed.
Key levels for spot gold
First resistance: 4,380–4,400
Breakout target: 4,440 / 4,470
First support: 4,345–4,355
Core support: 4,325–4,335
Strength/weakness line: 4,290
Downside targets if breaks: 4,250 / 4,220
Trading strategies
Buy on pullback: If 4,345–4,355 stabilizes, go long with a light position; stop loss below 4,325; targets 4,380 and 4,400.
Buy on breakout: After a valid hold above 4,400, add following the move; stop loss at 4,375; targets 4,440–4,470.
Test short against resistance: If price rises into 4,380–4,400 and fails, consider a light short; stop loss above 4,415; targets 4,350 and 4,330.
Breakdown reversal to short: If 4,325 breaks and the price fails to reclaim it on a retest, target 4,290 and 4,250.
115
·
--
Bullish
BTC Trading Strategy Brief|September 21
Current price: Approximately 81,830 USDT
24-hour gain: Approximately 0.65%, trading range 80,126–81,843. The 4-hour price is above the EMA20 (80,243) and EMA50 (79,042); the short-term bias is bullish, but it has approached the prior high resistance zone.
Key levels
Resistance: 81,950–82,300
Breakout targets: 83,500 / 85,000
First support: 81,000–81,200
Core support: 80,100–80,300
Strength/weakness boundary: 79,000
Failure targets: 77,800 / 76,300
{spot}(BTCUSDT)
BTC Trading Strategy Brief|September 21
Current price: Approximately 81,830 USDT
24-hour gain: Approximately 0.65%, trading range 80,126–81,843. The 4-hour price is above the EMA20 (80,243) and EMA50 (79,042); the short-term bias is bullish, but it has approached the prior high resistance zone.
Key levels
Resistance: 81,950–82,300
Breakout targets: 83,500 / 85,000
First support: 81,000–81,200
Core support: 80,100–80,300
Strength/weakness boundary: 79,000
Failure targets: 77,800 / 76,300
Current price: Approximately 81,830 USDT
24-hour gain: Approximately 0.65%, trading range 80,126–81,843. The 4-hour price is above the EMA20 (80,243) and EMA50 (79,042); the short-term bias is bullish, but it has approached the prior high resistance zone.
Key levels
Resistance: 81,950–82,300
Breakout targets: 83,500 / 85,000
First support: 81,000–81,200
Core support: 80,100–80,300
Strength/weakness boundary: 79,000
Failure targets: 77,800 / 76,300
174
·
--
Wall Street is being put on-chain. The SEC has officially rolled out a five-year “Innovation Exemption,” allowing qualifying platforms to tokenize shares of U.S. stocks through public chains, permissioned AMMs, and liquidity pool token trades. This means blockchain is no longer just a vehicle for crypto assets—it is starting to move into the core trading infrastructure of traditional securities. However, this is not a full liberalization: platforms still have to conduct access screening, enforce trading limits, support synchronized halts, and ensure information disclosure. Issuers also retain the right to refuse to have their shares traded in tokenized form. For the market, RWA, public-chain infrastructure, and compliant stablecoins may see a new round of opportunities, but the real winners will still depend on who can secure licenses first and access genuine liquidity.
Wall Street is being put on-chain. The SEC has officially rolled out a five-year “Innovation Exemption,” allowing qualifying platforms to tokenize shares of U.S. stocks through public chains, permissioned AMMs, and liquidity pool token trades. This means blockchain is no longer just a vehicle for crypto assets—it is starting to move into the core trading infrastructure of traditional securities. However, this is not a full liberalization: platforms still have to conduct access screening, enforce trading limits, support synchronized halts, and ensure information disclosure. Issuers also retain the right to refuse to have their shares traded in tokenized form. For the market, RWA, public-chain infrastructure, and compliant stablecoins may see a new round of opportunities, but the real winners will still depend on who can secure licenses first and access genuine liquidity.
64
·
--
Big news! The SEC gives the green light to tokenized U.S. stocks: public-chain AMMs get a five-year “regulatory trial period”On September 17, the U.S. Securities and Exchange Commission (SEC) officially launched the “Innovation Exemption,” allowing qualifying platforms to trade tokenized U.S. stocks on a public chain via a license-based AMM and liquidity pools.
This means that shares of U.S.-listed companies such as Apple and Nvidia may, in the future, be brought into on-chain markets in the form of compliant tokens. For the first time, a clearly delineated regulatory pathway has appeared between traditional securities trading and DeFi infrastructure.
Under the new regulations, tokenized securities trading venues that meet the criteria may be temporarily exempted from the definition of “exchange” in the (Securities Exchange Act); market makers that use their own capital to provide tokenized stock liquidity pools may also obtain a corresponding exemption from the definition of “broker-dealer.” Both exemptions will expire five years after publication, and the SEC will study long-term regulatory rules based on the outcomes of the pilot program.
Big news! The SEC gives the green light to tokenized U.S. stocks: public-chain AMMs get a five-year “regulatory trial period”
On September 17, the U.S. Securities and Exchange Commission (SEC) officially launched the “Innovation Exemption,” allowing qualifying platforms to trade tokenized U.S. stocks on a public chain via a license-based AMM and liquidity pools.
This means that shares of U.S.-listed companies such as Apple and Nvidia may, in the future, be brought into on-chain markets in the form of compliant tokens. For the first time, a clearly delineated regulatory pathway has appeared between traditional securities trading and DeFi infrastructure.
Under the new regulations, tokenized securities trading venues that meet the criteria may be temporarily exempted from the definition of “exchange” in the (Securities Exchange Act); market makers that use their own capital to provide tokenized stock liquidity pools may also obtain a corresponding exemption from the definition of “broker-dealer.” Both exemptions will expire five years after publication, and the SEC will study long-term regulatory rules based on the outcomes of the pilot program.
This means that shares of U.S.-listed companies such as Apple and Nvidia may, in the future, be brought into on-chain markets in the form of compliant tokens. For the first time, a clearly delineated regulatory pathway has appeared between traditional securities trading and DeFi infrastructure.
Under the new regulations, tokenized securities trading venues that meet the criteria may be temporarily exempted from the definition of “exchange” in the (Securities Exchange Act); market makers that use their own capital to provide tokenized stock liquidity pools may also obtain a corresponding exemption from the definition of “broker-dealer.” Both exemptions will expire five years after publication, and the SEC will study long-term regulatory rules based on the outcomes of the pilot program.
120
·
--
The Fed delivers a rate hike; $75,000 becomes the line between bulls and bears
The Federal Reserve has raised rates by 25 basis points, lifting the target range for the federal funds rate to 3.75%—4.00%, and signaling that further tightening may still be in the cards. Higher interest rates typically suppress the valuation of risk assets, but this hike largely meets expectations, and BTC has not yet seen panic-driven selloffs.
As of 08:55 Beijing time on September 17, BTC is trading at about $76,400. It is up roughly 0.8% over the past 24 hours, with a trading range of $75,065—$76,561. However, the price remains below the 4-hour EMA20 (around $76,635) and the EMA50 (around $77,405), so the short-term rebound is still weak.
Key levels
First support: $75,000—$75,300
Second support: $73,500—$74,000
Strong support: $71,000—$72,000
First resistance: $76,600—$77,400
Second resistance: $78,500—$80,000
The Fed delivers a rate hike; $75,000 becomes the line between bulls and bears
The Federal Reserve has raised rates by 25 basis points, lifting the target range for the federal funds rate to 3.75%—4.00%, and signaling that further tightening may still be in the cards. Higher interest rates typically suppress the valuation of risk assets, but this hike largely meets expectations, and BTC has not yet seen panic-driven selloffs.
As of 08:55 Beijing time on September 17, BTC is trading at about $76,400. It is up roughly 0.8% over the past 24 hours, with a trading range of $75,065—$76,561. However, the price remains below the 4-hour EMA20 (around $76,635) and the EMA50 (around $77,405), so the short-term rebound is still weak.
Key levels
First support: $75,000—$75,300
Second support: $73,500—$74,000
Strong support: $71,000—$72,000
First resistance: $76,600—$77,400
Second resistance: $78,500—$80,000
The Federal Reserve has raised rates by 25 basis points, lifting the target range for the federal funds rate to 3.75%—4.00%, and signaling that further tightening may still be in the cards. Higher interest rates typically suppress the valuation of risk assets, but this hike largely meets expectations, and BTC has not yet seen panic-driven selloffs.
As of 08:55 Beijing time on September 17, BTC is trading at about $76,400. It is up roughly 0.8% over the past 24 hours, with a trading range of $75,065—$76,561. However, the price remains below the 4-hour EMA20 (around $76,635) and the EMA50 (around $77,405), so the short-term rebound is still weak.
Key levels
First support: $75,000—$75,300
Second support: $73,500—$74,000
Strong support: $71,000—$72,000
First resistance: $76,600—$77,400
Second resistance: $78,500—$80,000
79
·
--
Gold breaks below $4,300 and enters an oversold zone in the short term! Is the next stop $4,250 or a return to $4,400?As of the morning of September 16, 2026 Beijing time, spot gold is around $4,278 per ounce. The day’s low is about $4,260 and the high about $4,318. COMEX December gold futures are around $4,322, and the futures-spot price spread is within the normal range.
Over the past week, gold has continued to fall from its recent highs. Expectations of the Fed hiking rates have intensified, while expectations for stronger real yields and a firmer U.S. dollar have weighed on gold prices. In the short term, safe-haven demand has not been able to offset the pressure from interest rates.
What signals are being released from the technical perspective?
Looking at COMEX gold futures:
Current price is about $4,322
Gold breaks below $4,300 and enters an oversold zone in the short term! Is the next stop $4,250 or a return to $4,400?
As of the morning of September 16, 2026 Beijing time, spot gold is around $4,278 per ounce. The day’s low is about $4,260 and the high about $4,318. COMEX December gold futures are around $4,322, and the futures-spot price spread is within the normal range.
Over the past week, gold has continued to fall from its recent highs. Expectations of the Fed hiking rates have intensified, while expectations for stronger real yields and a firmer U.S. dollar have weighed on gold prices. In the short term, safe-haven demand has not been able to offset the pressure from interest rates.
What signals are being released from the technical perspective?
Looking at COMEX gold futures:
Current price is about $4,322
Over the past week, gold has continued to fall from its recent highs. Expectations of the Fed hiking rates have intensified, while expectations for stronger real yields and a firmer U.S. dollar have weighed on gold prices. In the short term, safe-haven demand has not been able to offset the pressure from interest rates.
What signals are being released from the technical perspective?
Looking at COMEX gold futures:
Current price is about $4,322
62
·
--
BTC breaks below the short-term moving averages—7.5萬美元 battle between bulls and bears! Key levels aheadAs of 09:10 Beijing time on September 16, 2026, BTC is quoted at approximately $75,770, down about 2.6% over the past 24 hours. The highest it reached in the past day was about $78,080, and the low was about $74,968, with noticeably amplified short-term volatility.
Due to setbacks in the progress of the U.S. (CLARITY Act), the market’s earlier “regulatory-positive expectations” quickly cooled. BTC has been sliding consecutively from near the $80,000 level, and has now entered a critical support zone.
What signals has the technical setup released?
BTC has already fallen below:
4-hour EMA20: approximately $77,060
4-hour EMA50: approximately $77,570
BTC breaks below the short-term moving averages—7.5萬美元 battle between bulls and bears! Key levels ahead
As of 09:10 Beijing time on September 16, 2026, BTC is quoted at approximately $75,770, down about 2.6% over the past 24 hours. The highest it reached in the past day was about $78,080, and the low was about $74,968, with noticeably amplified short-term volatility.
Due to setbacks in the progress of the U.S. (CLARITY Act), the market’s earlier “regulatory-positive expectations” quickly cooled. BTC has been sliding consecutively from near the $80,000 level, and has now entered a critical support zone.
What signals has the technical setup released?
BTC has already fallen below:
4-hour EMA20: approximately $77,060
4-hour EMA50: approximately $77,570
Due to setbacks in the progress of the U.S. (CLARITY Act), the market’s earlier “regulatory-positive expectations” quickly cooled. BTC has been sliding consecutively from near the $80,000 level, and has now entered a critical support zone.
What signals has the technical setup released?
BTC has already fallen below:
4-hour EMA20: approximately $77,060
4-hour EMA50: approximately $77,570
66
·
--
Unbelievable! Hackers minted 4.6 billion ‘fake BTC’ with just $0.25 in BTC—fatal vulnerability hits the cross-chain bridge againThe “BTC” supply, which is more than 2,000 times the total number of Bitcoins, was somehow created out of thin air by hackers.
According to CoinDesk, the cross-chain protocol Symbiosis was attacked. The hackers exploited vulnerabilities in two smart contracts and, with an input of bitcoins worth only about $0.25, minted approximately 46 billion syBTC tokens in the relevant networks—without any real asset backing.
By comparison, Bitcoin’s theoretical maximum issuance is only 21 million coins.
However, this does not mean that the Bitcoin mainnet has been compromised or that BTC can be endlessly minted. What was forged this time were the mapped assets on a cross-chain bridge, syBTC; the actual Bitcoin protocol and its 21 million supply cap have not changed.
Unbelievable! Hackers minted 4.6 billion ‘fake BTC’ with just $0.25 in BTC—fatal vulnerability hits the cross-chain bridge again
The “BTC” supply, which is more than 2,000 times the total number of Bitcoins, was somehow created out of thin air by hackers.
According to CoinDesk, the cross-chain protocol Symbiosis was attacked. The hackers exploited vulnerabilities in two smart contracts and, with an input of bitcoins worth only about $0.25, minted approximately 46 billion syBTC tokens in the relevant networks—without any real asset backing.
By comparison, Bitcoin’s theoretical maximum issuance is only 21 million coins.
However, this does not mean that the Bitcoin mainnet has been compromised or that BTC can be endlessly minted. What was forged this time were the mapped assets on a cross-chain bridge, syBTC; the actual Bitcoin protocol and its 21 million supply cap have not changed.
According to CoinDesk, the cross-chain protocol Symbiosis was attacked. The hackers exploited vulnerabilities in two smart contracts and, with an input of bitcoins worth only about $0.25, minted approximately 46 billion syBTC tokens in the relevant networks—without any real asset backing.
By comparison, Bitcoin’s theoretical maximum issuance is only 21 million coins.
However, this does not mean that the Bitcoin mainnet has been compromised or that BTC can be endlessly minted. What was forged this time were the mapped assets on a cross-chain bridge, syBTC; the actual Bitcoin protocol and its 21 million supply cap have not changed.
66
·
--
Breaking! A key U.S. crypto regulatory bill fails to clear the hurdle, and the crypto industry’s ‘regulatory bonus’ falls throughThe U.S. crypto market takes a major blow.
As of September 15 local time, the highly watched (CLARITY Act) failed to clear a key procedural voting threshold in the U.S. Senate. This means hopes for substantive breakthroughs in U.S. crypto market-structure legislation, long awaited by the crypto community, have clearly cooled off within 2026.
After the news broke, the market quickly shifted to risk aversion:
Bitcoin gives back prior gains, at one point falling to around $76,000
ETH, SOL, XRP and other leading alternative coins slide in tandem
Crypto-related stocks such as Coinbase, Circle, and Galaxy collectively plunge
The prediction market quickly marks down the probability of this bill being enacted within the year
Breaking! A key U.S. crypto regulatory bill fails to clear the hurdle, and the crypto industry’s ‘regulatory bonus’ falls through
The U.S. crypto market takes a major blow.
As of September 15 local time, the highly watched (CLARITY Act) failed to clear a key procedural voting threshold in the U.S. Senate. This means hopes for substantive breakthroughs in U.S. crypto market-structure legislation, long awaited by the crypto community, have clearly cooled off within 2026.
After the news broke, the market quickly shifted to risk aversion:
Bitcoin gives back prior gains, at one point falling to around $76,000
ETH, SOL, XRP and other leading alternative coins slide in tandem
Crypto-related stocks such as Coinbase, Circle, and Galaxy collectively plunge
The prediction market quickly marks down the probability of this bill being enacted within the year
As of September 15 local time, the highly watched (CLARITY Act) failed to clear a key procedural voting threshold in the U.S. Senate. This means hopes for substantive breakthroughs in U.S. crypto market-structure legislation, long awaited by the crypto community, have clearly cooled off within 2026.
After the news broke, the market quickly shifted to risk aversion:
Bitcoin gives back prior gains, at one point falling to around $76,000
ETH, SOL, XRP and other leading alternative coins slide in tandem
Crypto-related stocks such as Coinbase, Circle, and Galaxy collectively plunge
The prediction market quickly marks down the probability of this bill being enacted within the year
291
·
--
BTC’s tug-of-war intensifies: $77,000–$81,500 range-bound consolidation and strategyDate: September 15, 2026
Key Market Snapshot (Market Overview)
Current price:
約
$78,000 - $79,500
Narrow-range consolidation
Market characteristics:
After a spike and pullback,
consolidation and building momentum
. After rebounding toward the $81,500 area and hitting resistance, it has pulled back. It is currently seeking a bottom confirmation at the key support level of $77,500 - $78,000.
Sentiment and flows:
Sentiment index is about 71 (greed). Spot ETF inflows are continuing to provide support at the base, but retail buying momentum is slowing. Intraday, it is more likely to be range-bound with a shakeout rather than an immediate breakout.
💡 Macro & Fundamentals (Macro Drivers)
Macro risk aversion suppresses:
BTC’s tug-of-war intensifies: $77,000–$81,500 range-bound consolidation and strategy
Date: September 15, 2026
Key Market Snapshot (Market Overview)
Current price:
約
$78,000 - $79,500
Narrow-range consolidation
Market characteristics:
After a spike and pullback,
consolidation and building momentum
. After rebounding toward the $81,500 area and hitting resistance, it has pulled back. It is currently seeking a bottom confirmation at the key support level of $77,500 - $78,000.
Sentiment and flows:
Sentiment index is about 71 (greed). Spot ETF inflows are continuing to provide support at the base, but retail buying momentum is slowing. Intraday, it is more likely to be range-bound with a shakeout rather than an immediate breakout.
💡 Macro & Fundamentals (Macro Drivers)
Macro risk aversion suppresses:
Key Market Snapshot (Market Overview)
Current price:
約
$78,000 - $79,500
Narrow-range consolidation
Market characteristics:
After a spike and pullback,
consolidation and building momentum
. After rebounding toward the $81,500 area and hitting resistance, it has pulled back. It is currently seeking a bottom confirmation at the key support level of $77,500 - $78,000.
Sentiment and flows:
Sentiment index is about 71 (greed). Spot ETF inflows are continuing to provide support at the base, but retail buying momentum is slowing. Intraday, it is more likely to be range-bound with a shakeout rather than an immediate breakout.
💡 Macro & Fundamentals (Macro Drivers)
Macro risk aversion suppresses:
89
·
--
Bitcoin (BTC/USDT) Today (September 14, 2026) Intraday Trading Strategy Brief1. Core trading strategy
Follow the trend:
Use H1/H4 to determine the primary trend, and use M5/M15 to look for pullback confirmation. When price retraces to the EMA 20/50 and finds support, or when a Pin Bar / engulfing pattern appears at a key level, enter in line with the trend.
Ranging market:
Asian-session liquidity is relatively low, so it mainly turns into range consolidation. Combine the Bollinger Bands’ upper and lower tracks with RSI overbought/oversold readings (>70 / <30) to sell high and buy low.
Breakout order sweep:
In the European and American session, focus on the Asian-session breakout of the high/low points (Liquidity Sweep). For a false breakout, quickly pull back and then set up an opposite trade. For a true breakout, wait for a retest of the FVG or a support/resistance conversion level before following up.
Bitcoin (BTC/USDT) Today (September 14, 2026) Intraday Trading Strategy Brief
1. Core trading strategy
Follow the trend:
Use H1/H4 to determine the primary trend, and use M5/M15 to look for pullback confirmation. When price retraces to the EMA 20/50 and finds support, or when a Pin Bar / engulfing pattern appears at a key level, enter in line with the trend.
Ranging market:
Asian-session liquidity is relatively low, so it mainly turns into range consolidation. Combine the Bollinger Bands’ upper and lower tracks with RSI overbought/oversold readings (>70 / <30) to sell high and buy low.
Breakout order sweep:
In the European and American session, focus on the Asian-session breakout of the high/low points (Liquidity Sweep). For a false breakout, quickly pull back and then set up an opposite trade. For a true breakout, wait for a retest of the FVG or a support/resistance conversion level before following up.
Follow the trend:
Use H1/H4 to determine the primary trend, and use M5/M15 to look for pullback confirmation. When price retraces to the EMA 20/50 and finds support, or when a Pin Bar / engulfing pattern appears at a key level, enter in line with the trend.
Ranging market:
Asian-session liquidity is relatively low, so it mainly turns into range consolidation. Combine the Bollinger Bands’ upper and lower tracks with RSI overbought/oversold readings (>70 / <30) to sell high and buy low.
Breakout order sweep:
In the European and American session, focus on the Asian-session breakout of the high/low points (Liquidity Sweep). For a false breakout, quickly pull back and then set up an opposite trade. For a true breakout, wait for a retest of the FVG or a support/resistance conversion level before following up.
49
·
--
Gold (XAU/USD) intraday trading plan for today (September 14, 2026)I. Order book structure and technical tone
Current price reference:
~$4,348 per ounce
Intraday outlook:
Broad-range consolidation (contested between the $4,300–$4,400 area). Daily-level rebounds are capped at the $4,400 level, while the short-term finds support near the 100-day moving average ($4,335).
Indicator status:
At the H1/H4 level, the MACD is sticking sideways around the zero line; the KDJ is operating in the neutral zone. The daily TD sequence is in a count of stabilization after a pullback. In the short term, there is no one-way momentum; prioritize selling near the range highs and buying near the lows, and consider breakouts only after confirmation.
II. Intraday key trading levels
Resistance 2 (R2): $4,402 – $4,412
Gold (XAU/USD) intraday trading plan for today (September 14, 2026)
I. Order book structure and technical tone
Current price reference:
~$4,348 per ounce
Intraday outlook:
Broad-range consolidation (contested between the $4,300–$4,400 area). Daily-level rebounds are capped at the $4,400 level, while the short-term finds support near the 100-day moving average ($4,335).
Indicator status:
At the H1/H4 level, the MACD is sticking sideways around the zero line; the KDJ is operating in the neutral zone. The daily TD sequence is in a count of stabilization after a pullback. In the short term, there is no one-way momentum; prioritize selling near the range highs and buying near the lows, and consider breakouts only after confirmation.
II. Intraday key trading levels
Resistance 2 (R2): $4,402 – $4,412
Current price reference:
~$4,348 per ounce
Intraday outlook:
Broad-range consolidation (contested between the $4,300–$4,400 area). Daily-level rebounds are capped at the $4,400 level, while the short-term finds support near the 100-day moving average ($4,335).
Indicator status:
At the H1/H4 level, the MACD is sticking sideways around the zero line; the KDJ is operating in the neutral zone. The daily TD sequence is in a count of stabilization after a pullback. In the short term, there is no one-way momentum; prioritize selling near the range highs and buying near the lows, and consider breakouts only after confirmation.
II. Intraday key trading levels
Resistance 2 (R2): $4,402 – $4,412
100
·
--
Gold Intraday Brief (XAU/USD): After the recent sharp drop, it is consolidating above the key support zone of 4305–4319, with 4448 as the main resistance. Focus on confirming trades intraday rather than chasing prices; prioritize risk control around the release of the US CPI at 20:30 Beijing time.
Gold Intraday Brief (XAU/USD): After the recent sharp drop, it is consolidating above the key support zone of 4305–4319, with 4448 as the main resistance. Focus on confirming trades intraday rather than chasing prices; prioritize risk control around the release of the US CPI at 20:30 Beijing time.
115
·
--
BTC Intraday Trading Analysis Brief (September 11, 2026)1. Market Environment and Price Trend Analysis
Current price
: approximately
$76,789 USD
。
Technical Structure
: Price remains in a high-level, narrow-range consolidation within the wide range of $76,000–$77,500. The short-term moving averages (EMA 7 / EMA 20) are intertwined and ranging, with bullish and bearish forces temporarily balanced.
Momentum Performance
: The RSI indicator is running near the 50–54 axis, which is neutral-to-slightly bullish; the MACD histogram is narrowing, with a wait for a short-term breakout signal.
2. Key Support and Resistance Levels
Resistance level
:
⚬
First resistance (suppression level)
:
$77,500
(recent high point and short-term selling pressure zone)
⚬
Second resistance (breakout level)
BTC Intraday Trading Analysis Brief (September 11, 2026)
1. Market Environment and Price Trend Analysis
Current price
: approximately
$76,789 USD
。
Technical Structure
: Price remains in a high-level, narrow-range consolidation within the wide range of $76,000–$77,500. The short-term moving averages (EMA 7 / EMA 20) are intertwined and ranging, with bullish and bearish forces temporarily balanced.
Momentum Performance
: The RSI indicator is running near the 50–54 axis, which is neutral-to-slightly bullish; the MACD histogram is narrowing, with a wait for a short-term breakout signal.
2. Key Support and Resistance Levels
Resistance level
:
⚬
First resistance (suppression level)
:
$77,500
(recent high point and short-term selling pressure zone)
⚬
Second resistance (breakout level)
Current price
: approximately
$76,789 USD
。
Technical Structure
: Price remains in a high-level, narrow-range consolidation within the wide range of $76,000–$77,500. The short-term moving averages (EMA 7 / EMA 20) are intertwined and ranging, with bullish and bearish forces temporarily balanced.
Momentum Performance
: The RSI indicator is running near the 50–54 axis, which is neutral-to-slightly bullish; the MACD histogram is narrowing, with a wait for a short-term breakout signal.
2. Key Support and Resistance Levels
Resistance level
:
⚬
First resistance (suppression level)
:
$77,500
(recent high point and short-term selling pressure zone)
⚬
Second resistance (breakout level)
3
·
--
Bullish
BTC intraday trading strategy template September 10
{spot}(BTCUSDT)
1. Key core levels (based on the current price)
First resistance above (R1): $78,500 (morning high and a short-term high-concentration chip zone)
Second resistance above (R2): $79,000 (integer level and a strong pressure zone)
First support below (S1): $78,000 (morning test low and a psychological level)
Second support below (S2): $77,500 (prior low strong support zone)
2. Trading plan execution
Plan A: Range-bound oscillation strategy (when price consolidates narrowly between $78,000 - $78,500)
Sell high (short opportunity):
⚬ Entry conditions: price rebounds to $78,400 - $78,500 and shows a 15-minute candlestick upper shadow or an RSI overbought signal.
⚬ Stop loss: $78,750 (stop out if the price breaks above the range high).
⚬ Take profit: $78,050 - $78,100.
Buy low (long opportunity):
⚬ Entry conditions: price pulls back to $78,000 - $78,100, holds steady, and shows a reversal/stabilization signal (e.g., a bullish engulfing pattern).
⚬ Stop loss: $77,750 (stop out if it breaks below the morning low).
⚬ Take profit: $78,400 - $78,500.
Plan B: Momentum breakout strategy (when the range breaks)
Break upward—chase long:
⚬ Trigger condition: a 15-minute candlestick body closes above $78,550 with increased volume.
⚬ Stop loss: $78,250 (stop out on a false breakout retracement).
⚬ Take profit: first target $79,000, second target $79,500.
Break downward—chase short:
⚬ Trigger condition: a 15-minute candlestick body closes below $77,950 with increased volume.
⚬ Stop loss: $78,250.
⚬ Take profit: first target $77,500, second target $77,000.
3. Risk management discipline
Strict stop loss: ensure loss on any single trade is limited to within 1% - 2% of total capital.
Risk/reward requirement: make sure the expected risk/reward ratio for each trade is 1.5:1 or 2:1 or higher.
BTC intraday trading strategy template September 10
1. Key core levels (based on the current price)
First resistance above (R1): $78,500 (morning high and a short-term high-concentration chip zone)
Second resistance above (R2): $79,000 (integer level and a strong pressure zone)
First support below (S1): $78,000 (morning test low and a psychological level)
Second support below (S2): $77,500 (prior low strong support zone)
2. Trading plan execution
Plan A: Range-bound oscillation strategy (when price consolidates narrowly between $78,000 - $78,500)
Sell high (short opportunity):
⚬ Entry conditions: price rebounds to $78,400 - $78,500 and shows a 15-minute candlestick upper shadow or an RSI overbought signal.
⚬ Stop loss: $78,750 (stop out if the price breaks above the range high).
⚬ Take profit: $78,050 - $78,100.
Buy low (long opportunity):
⚬ Entry conditions: price pulls back to $78,000 - $78,100, holds steady, and shows a reversal/stabilization signal (e.g., a bullish engulfing pattern).
⚬ Stop loss: $77,750 (stop out if it breaks below the morning low).
⚬ Take profit: $78,400 - $78,500.
Plan B: Momentum breakout strategy (when the range breaks)
Break upward—chase long:
⚬ Trigger condition: a 15-minute candlestick body closes above $78,550 with increased volume.
⚬ Stop loss: $78,250 (stop out on a false breakout retracement).
⚬ Take profit: first target $79,000, second target $79,500.
Break downward—chase short:
⚬ Trigger condition: a 15-minute candlestick body closes below $77,950 with increased volume.
⚬ Stop loss: $78,250.
⚬ Take profit: first target $77,500, second target $77,000.
3. Risk management discipline
Strict stop loss: ensure loss on any single trade is limited to within 1% - 2% of total capital.
Risk/reward requirement: make sure the expected risk/reward ratio for each trade is 1.5:1 or 2:1 or higher.
1. Key core levels (based on the current price)
First resistance above (R1): $78,500 (morning high and a short-term high-concentration chip zone)
Second resistance above (R2): $79,000 (integer level and a strong pressure zone)
First support below (S1): $78,000 (morning test low and a psychological level)
Second support below (S2): $77,500 (prior low strong support zone)
2. Trading plan execution
Plan A: Range-bound oscillation strategy (when price consolidates narrowly between $78,000 - $78,500)
Sell high (short opportunity):
⚬ Entry conditions: price rebounds to $78,400 - $78,500 and shows a 15-minute candlestick upper shadow or an RSI overbought signal.
⚬ Stop loss: $78,750 (stop out if the price breaks above the range high).
⚬ Take profit: $78,050 - $78,100.
Buy low (long opportunity):
⚬ Entry conditions: price pulls back to $78,000 - $78,100, holds steady, and shows a reversal/stabilization signal (e.g., a bullish engulfing pattern).
⚬ Stop loss: $77,750 (stop out if it breaks below the morning low).
⚬ Take profit: $78,400 - $78,500.
Plan B: Momentum breakout strategy (when the range breaks)
Break upward—chase long:
⚬ Trigger condition: a 15-minute candlestick body closes above $78,550 with increased volume.
⚬ Stop loss: $78,250 (stop out on a false breakout retracement).
⚬ Take profit: first target $79,000, second target $79,500.
Break downward—chase short:
⚬ Trigger condition: a 15-minute candlestick body closes below $77,950 with increased volume.
⚬ Stop loss: $78,250.
⚬ Take profit: first target $77,500, second target $77,000.
3. Risk management discipline
Strict stop loss: ensure loss on any single trade is limited to within 1% - 2% of total capital.
Risk/reward requirement: make sure the expected risk/reward ratio for each trade is 1.5:1 or 2:1 or higher.
131
·
--
BTC Attack-Defense Intensifies: Ranging between $78,000–$81,000 and Intraday StrategyDate: September 9, 2026
Core Market Snapshot (Market Overview)
Current price:
About
$78,300 - $79,500
Narrow-range consolidation
Market characteristics:
After a spike and retreat on the short term,
it consolidates to build momentum
。Recently, after breaking through $81,000 and meeting resistance, it pulled back under the impact of macro sentiment. Currently, it is seeking a bottom confirmation near a key support level.
Sentiment index:
71 (Greed) — Liquidity remains resilient, but short-term profit-taking has become clearly more pronounced.
💡 Macro and Fundamental Dynamics (Macro & Fundamental Drivers)
Macroeconomic Safe-Haven Demand and Inflation Expectations:
Affected by adjustments to U.S. Federal Reserve rate expectations and geopolitical developments/oil price fluctuations, risk assets are under short-term pressure. The market is currently highly focused on the U.S. inflation data that will be released soon.
BTC Attack-Defense Intensifies: Ranging between $78,000–$81,000 and Intraday Strategy
Date: September 9, 2026
Core Market Snapshot (Market Overview)
Current price:
About
$78,300 - $79,500
Narrow-range consolidation
Market characteristics:
After a spike and retreat on the short term,
it consolidates to build momentum
。Recently, after breaking through $81,000 and meeting resistance, it pulled back under the impact of macro sentiment. Currently, it is seeking a bottom confirmation near a key support level.
Sentiment index:
71 (Greed) — Liquidity remains resilient, but short-term profit-taking has become clearly more pronounced.
💡 Macro and Fundamental Dynamics (Macro & Fundamental Drivers)
Macroeconomic Safe-Haven Demand and Inflation Expectations:
Affected by adjustments to U.S. Federal Reserve rate expectations and geopolitical developments/oil price fluctuations, risk assets are under short-term pressure. The market is currently highly focused on the U.S. inflation data that will be released soon.
Core Market Snapshot (Market Overview)
Current price:
About
$78,300 - $79,500
Narrow-range consolidation
Market characteristics:
After a spike and retreat on the short term,
it consolidates to build momentum
。Recently, after breaking through $81,000 and meeting resistance, it pulled back under the impact of macro sentiment. Currently, it is seeking a bottom confirmation near a key support level.
Sentiment index:
71 (Greed) — Liquidity remains resilient, but short-term profit-taking has become clearly more pronounced.
💡 Macro and Fundamental Dynamics (Macro & Fundamental Drivers)
Macroeconomic Safe-Haven Demand and Inflation Expectations:
Affected by adjustments to U.S. Federal Reserve rate expectations and geopolitical developments/oil price fluctuations, risk assets are under short-term pressure. The market is currently highly focused on the U.S. inflation data that will be released soon.
102
·
--
Gold (XAU/USD) Intraday Trading Briefing (September 7, 2026)
1. Current Market Situation
Spot gold, after surging in the previous trading session, remained in a high-level consolidation phase. Intraday real-time trading is around $2,498 - $2,506 per ounce. It is repeatedly battling around the $2,500 level, with the overall pattern showing a bullish bias and narrow-range accumulation at elevated levels.
2. Key Levels
Resistance: $2,512 - $2,516 (previous high selling pressure) / $2,525 - $2,530 (strong breakout level)
Support: $2,490 - $2,495 (primary intraday support) / $2,478 - $2,482 (strong defense line)
3. Trading Strategy
1. Buy the Dip (Primary Strategy)
Entry: $2,492 - $2,496 (support holds on pullback)
Stop Loss: $2,485
Targets: T1 $2,510 / T2 $2,522
2. Short on Strength (Secondary / Quick In, Quick Out)
Entry: $2,514 - $2,518 (selling pressure appears after an attempted rally)
Stop Loss: $2,524
Targets: $2,502 - $2,495
{spot}(XAUTUSDT)
Gold (XAU/USD) Intraday Trading Briefing (September 7, 2026)
1. Current Market Situation
Spot gold, after surging in the previous trading session, remained in a high-level consolidation phase. Intraday real-time trading is around $2,498 - $2,506 per ounce. It is repeatedly battling around the $2,500 level, with the overall pattern showing a bullish bias and narrow-range accumulation at elevated levels.
2. Key Levels
Resistance: $2,512 - $2,516 (previous high selling pressure) / $2,525 - $2,530 (strong breakout level)
Support: $2,490 - $2,495 (primary intraday support) / $2,478 - $2,482 (strong defense line)
3. Trading Strategy
1. Buy the Dip (Primary Strategy)
Entry: $2,492 - $2,496 (support holds on pullback)
Stop Loss: $2,485
Targets: T1 $2,510 / T2 $2,522
2. Short on Strength (Secondary / Quick In, Quick Out)
Entry: $2,514 - $2,518 (selling pressure appears after an attempted rally)
Stop Loss: $2,524
Targets: $2,502 - $2,495
1. Current Market Situation
Spot gold, after surging in the previous trading session, remained in a high-level consolidation phase. Intraday real-time trading is around $2,498 - $2,506 per ounce. It is repeatedly battling around the $2,500 level, with the overall pattern showing a bullish bias and narrow-range accumulation at elevated levels.
2. Key Levels
Resistance: $2,512 - $2,516 (previous high selling pressure) / $2,525 - $2,530 (strong breakout level)
Support: $2,490 - $2,495 (primary intraday support) / $2,478 - $2,482 (strong defense line)
3. Trading Strategy
1. Buy the Dip (Primary Strategy)
Entry: $2,492 - $2,496 (support holds on pullback)
Stop Loss: $2,485
Targets: T1 $2,510 / T2 $2,522
2. Short on Strength (Secondary / Quick In, Quick Out)
Entry: $2,514 - $2,518 (selling pressure appears after an attempted rally)
Stop Loss: $2,524
Targets: $2,502 - $2,495
82
·
--
Bullish
BTC Intraday Trading Brief (September 7, 2026)
1. Current Market Overview
BTC remains consolidating above the $80,000 threshold, trading in real time within the $80,800 - $81,200 range. Overall, it is in a narrow accumulation pattern under bullish control at elevated levels, building momentum to challenge the overhead resistance.
2. Key Levels
Resistance: $81,600 - $82,000 (short-term selling pressure zone) / $82,800 - $83,200 (breakout target)
Support: $80,000 - $80,300 (strong transition support) / $79,200 - $79,500 (bullish defense line)
3. Trading Strategy
1. Buy the pullback (primary strategy)
Entry: $80,200 - $80,600 (support holds and stabilizes on the pullback)
Stop Loss: $79,600
Targets: T1 $81,600 / T2 $82,500
2. Short at highs (secondary / quick in-and-out)
Entry: $81,800 - $82,200 (rally stalls and a верх影线 appears)
Stop Loss: $82,600
Target: $80,800 - $80,400
{spot}(BTCUSDT)
BTC Intraday Trading Brief (September 7, 2026)
1. Current Market Overview
BTC remains consolidating above the $80,000 threshold, trading in real time within the $80,800 - $81,200 range. Overall, it is in a narrow accumulation pattern under bullish control at elevated levels, building momentum to challenge the overhead resistance.
2. Key Levels
Resistance: $81,600 - $82,000 (short-term selling pressure zone) / $82,800 - $83,200 (breakout target)
Support: $80,000 - $80,300 (strong transition support) / $79,200 - $79,500 (bullish defense line)
3. Trading Strategy
1. Buy the pullback (primary strategy)
Entry: $80,200 - $80,600 (support holds and stabilizes on the pullback)
Stop Loss: $79,600
Targets: T1 $81,600 / T2 $82,500
2. Short at highs (secondary / quick in-and-out)
Entry: $81,800 - $82,200 (rally stalls and a верх影线 appears)
Stop Loss: $82,600
Target: $80,800 - $80,400
1. Current Market Overview
BTC remains consolidating above the $80,000 threshold, trading in real time within the $80,800 - $81,200 range. Overall, it is in a narrow accumulation pattern under bullish control at elevated levels, building momentum to challenge the overhead resistance.
2. Key Levels
Resistance: $81,600 - $82,000 (short-term selling pressure zone) / $82,800 - $83,200 (breakout target)
Support: $80,000 - $80,300 (strong transition support) / $79,200 - $79,500 (bullish defense line)
3. Trading Strategy
1. Buy the pullback (primary strategy)
Entry: $80,200 - $80,600 (support holds and stabilizes on the pullback)
Stop Loss: $79,600
Targets: T1 $81,600 / T2 $82,500
2. Short at highs (secondary / quick in-and-out)
Entry: $81,800 - $82,200 (rally stalls and a верх影线 appears)
Stop Loss: $82,600
Target: $80,800 - $80,400
154
Log in to explore more content
Join global crypto users on Binance Square
⚡️ Get latest and useful information about crypto.
💬 Trusted by the world’s largest crypto exchange.
👍 Discover real insights from verified creators.
Email / Phone number
Trending Topics
BitMineETHHoldingsTop6Million
256 views
38 Discussing
BitMine’s 6 million ETH milestone is making waves
This is one of those crypto stories that makes you stop and look twice.
#Bitmine Immersion Technologies has now crossed 6 million #ETH in holdings, reaching around 6,001,302 ETH. That’s roughly 4.9% of Ethereum’s total supply, putting the company just a step away from its stated goal of holding 5% of all $ETH .
BitMine also added another 17,362 ETH in its latest reported week. At the company’s reported ETH price of $2,698, its Ethereum stash was worth roughly $16.2 billion.
But the interesting part isn’t just the size of the wallet. A large portion of those holdings more than 5 million ETH has reportedly been staked. That shows BitMine isn’t simply collecting ETH and leaving it untouched; it is also looking to generate staking returns from its holdings.
The company’s strategy has already attracted plenty of attention because accumulating such a huge amount of ETH gives BitMine significant exposure to Ethereum’s long-term growth.
At the same time, a position this large naturally raises questions about concentration, liquidity and what could happen if the company changes its strategy.
For Ethereum, the story is bigger than one company.
BitMine is betting heavily on ETH’s future. The real question now is: how far will this accumulation strategy go?
#BitMineETHHoldingsTop6Million
Aesthetic_Meow
·0 Likes
·39 views
StrategyAdds1666BTCHoldingsReach847666
265 views
29 Discussing
NvidiaApproves$150BBuyback
1,780 views
41 Discussing