

阿信BTC_Axin338
4k Posts

阿信BTC_Axin338
Report
Block User
专注BTC、 ETH行情分析,擅长技术分析,只抓高盈亏比机会。推特:@Axin888btc 币安聊天ID:10086772
51 Following
1.4K+ Followers
3.6K+ Liked
Posts
All
Quotes
Videos
Live
PINNED
一,Big news: if you want to settle a contract account through order-following (trading signals) and unwind your positions, just go directly into the “Special Care Group.” I’ll personally guide you on opening the contract and do advanced operations (rolling positions, moving stop-loss, etc.)
二,If you want to talk with me directly on Binance, please add me as a Binance friend. The steps are as follows:
① On the Binance homepage, in the search bar type 【Chat Room】 to find the entry
② Click 【+】 in the top-right corner to add a friend
③ Enter the Binance ID: 10086772
④ One-click search—add me immediately!
一,Big news: if you want to settle a contract account through order-following (trading signals) and unwind your positions, just go directly into the “Special Care Group.” I’ll personally guide you on opening the contract and do advanced operations (rolling positions, moving stop-loss, etc.)
二,If you want to talk with me directly on Binance, please add me as a Binance friend. The steps are as follows:
① On the Binance homepage, in the search bar type 【Chat Room】 to find the entry
② Click 【+】 in the top-right corner to add a friend
③ Enter the Binance ID: 10086772
④ One-click search—add me immediately!
二,If you want to talk with me directly on Binance, please add me as a Binance friend. The steps are as follows:
① On the Binance homepage, in the search bar type 【Chat Room】 to find the entry
② Click 【+】 in the top-right corner to add a friend
③ Enter the Binance ID: 10086772
④ One-click search—add me immediately!
2
7
267
·
--
Bullish
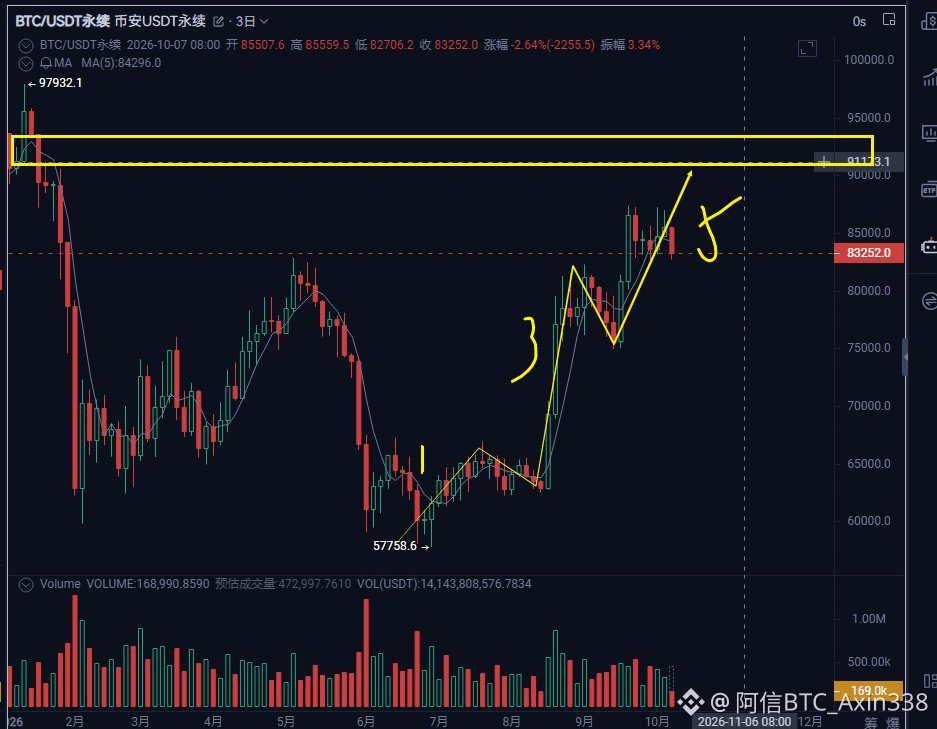
$BTC The uptrend is clearly still going strong.
We’re currently in the final push of Wave 5.
But there’s a huge divide between bulls and bears right now, because Wave 5 is often when market sentiment is at its most euphoric—but it’s also the stage most prone to a deep correction (possibly even a major ABC correction). A bearish divergence has already appeared on the daily chart, and many people are worried about a sharp pullback. Some are even predicting a break below 60,000.
So many of the big players who shorted at the 828 resistance won’t take profits completely. Some are sure to be holding on to most of their short positions, expecting the price could fall to 750 or even break below 700.
As the price rises, these big players will also become the most valuable fuel.
$BTC The uptrend is clearly still going strong.
We’re currently in the final push of Wave 5.
But there’s a huge divide between bulls and bears right now, because Wave 5 is often when market sentiment is at its most euphoric—but it’s also the stage most prone to a deep correction (possibly even a major ABC correction). A bearish divergence has already appeared on the daily chart, and many people are worried about a sharp pullback. Some are even predicting a break below 60,000.
So many of the big players who shorted at the 828 resistance won’t take profits completely. Some are sure to be holding on to most of their short positions, expecting the price could fall to 750 or even break below 700.
As the price rises, these big players will also become the most valuable fuel.
We’re currently in the final push of Wave 5.
But there’s a huge divide between bulls and bears right now, because Wave 5 is often when market sentiment is at its most euphoric—but it’s also the stage most prone to a deep correction (possibly even a major ABC correction). A bearish divergence has already appeared on the daily chart, and many people are worried about a sharp pullback. Some are even predicting a break below 60,000.
So many of the big players who shorted at the 828 resistance won’t take profits completely. Some are sure to be holding on to most of their short positions, expecting the price could fall to 750 or even break below 700.
As the price rises, these big players will also become the most valuable fuel.
4
2
1.4k
356
Verified
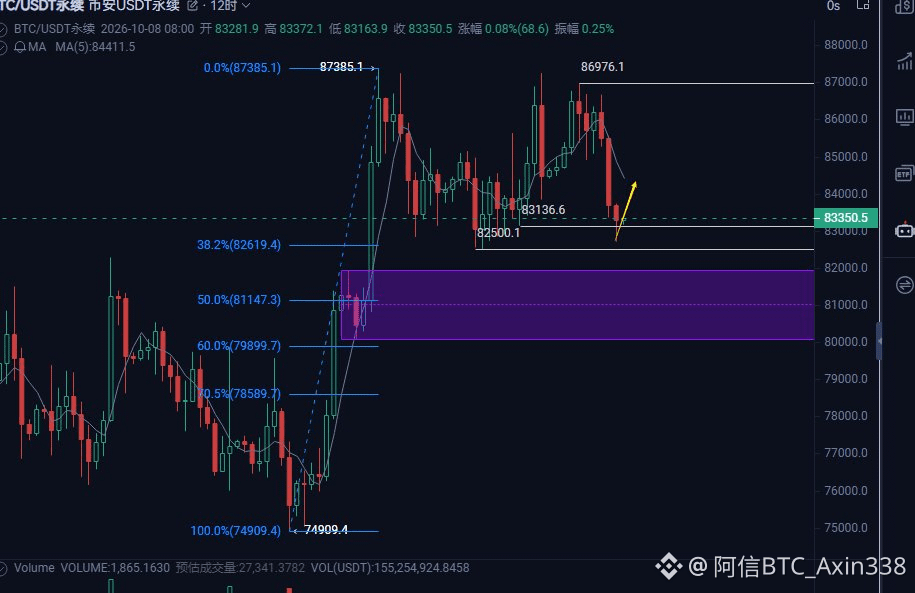
I took a look.
There really is news tonight.
At 2 a.m., the Fed will release the minutes from its monetary policy meeting.
So there could be big market swings tonight.
There are also FOMC speeches tomorrow night and the night after.
So this week’s tone is set: sideways, with at most a bit of a recovery.
The market probably won’t turn until the CPI figures come out next Wednesday.
That’ll be
$BTC the decisive moment for bulls and bears.
Actually, with prices having fallen this far, tonight is a critical moment too!
I took a look.
There really is news tonight.
At 2 a.m., the Fed will release the minutes from its monetary policy meeting.
So there could be big market swings tonight.
There are also FOMC speeches tomorrow night and the night after.
So this week’s tone is set: sideways, with at most a bit of a recovery.
The market probably won’t turn until the CPI figures come out next Wednesday.
That’ll be
$BTC the decisive moment for bulls and bears.
Actually, with prices having fallen this far, tonight is a critical moment too!
There really is news tonight.
At 2 a.m., the Fed will release the minutes from its monetary policy meeting.
So there could be big market swings tonight.
There are also FOMC speeches tomorrow night and the night after.
So this week’s tone is set: sideways, with at most a bit of a recovery.
The market probably won’t turn until the CPI figures come out next Wednesday.
That’ll be
$BTC the decisive moment for bulls and bears.
Actually, with prices having fallen this far, tonight is a critical moment too!
2.3k
10/7 What is a bull market? $BTC What are the characteristics of a bull market? Very, very important
10/7 What is a bull market? $BTC What are the characteristics of a bull market? Very, very important
4
1
1.3k
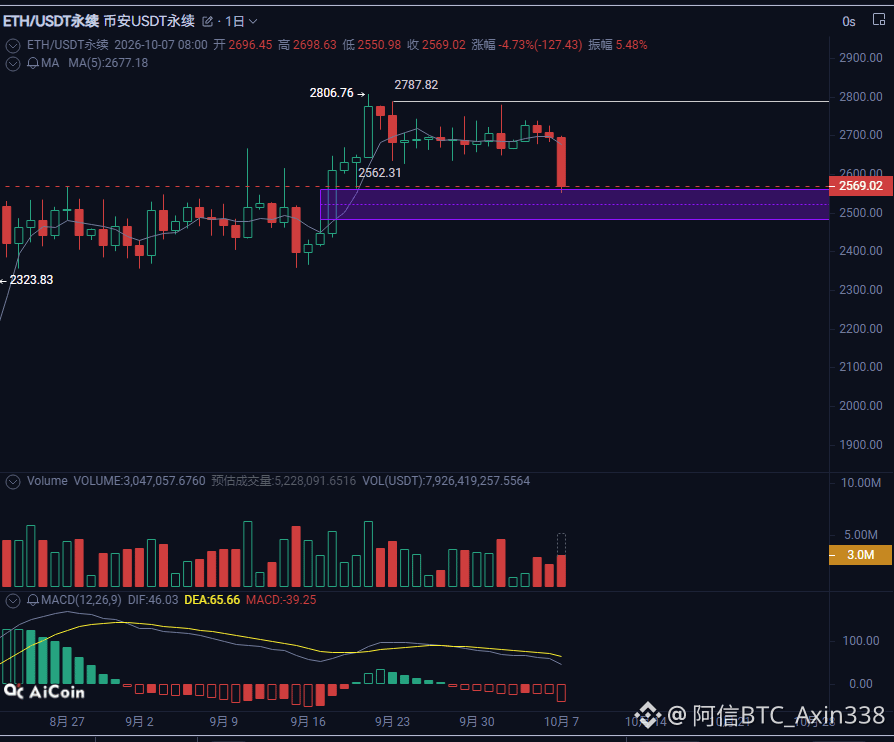
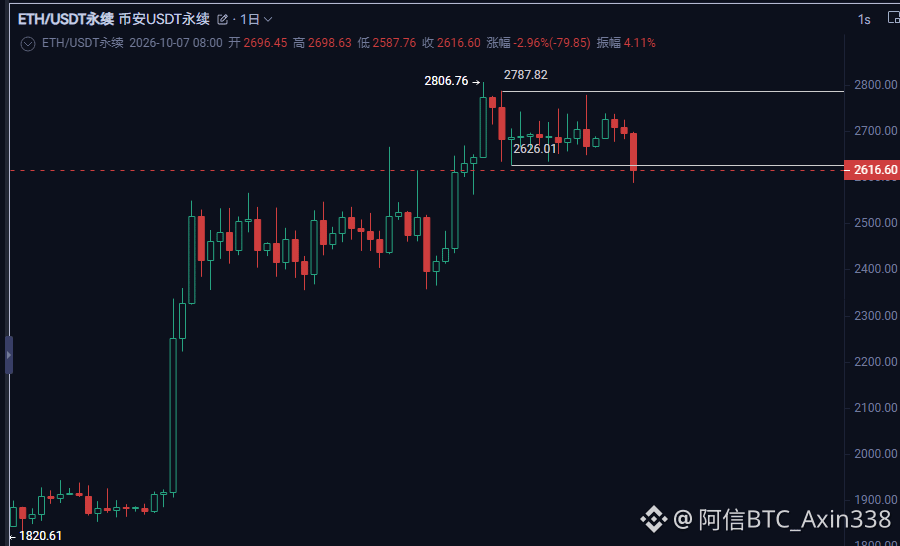
$ETH Don't chase shorts.
Support at the 2626 low has been swept.
There will usually be a rebound.
Wait for the rebound and then see how it moves after consolidating.
$ETH Don't chase shorts.
Support at the 2626 low has been swept.
There will usually be a rebound.
Wait for the rebound and then see how it moves after consolidating.
Support at the 2626 low has been swept.
There will usually be a rebound.
Wait for the rebound and then see how it moves after consolidating.
1
1.4k
·
--
Bullish
2
666
Historical data shows that Bitcoin ( $BTC ) has a very high probability of rising in October each year.
In 10 of the past 13 Octobers, prices closed higher; in only 3 did they close lower.
There have been 3 years in which Bitcoin fell in October:
October 2014: -13.4% (a period of sharp declines in the bear market)
October 2018: -4.5% (just before the bear market bottomed)
October 2025: -3.9% (shocked by a sudden black swan event, macro tariff concerns, and a liquidation crisis, ending a multi-year winning streak for October)
Even when October ultimately closes with a big bullish candle, there are often intra-month pullbacks of around 2%–10% or liquidity hunts. Chasing long positions with high leverage can lead to liquidation during the shakeout early in the month.
Seasonal patterns mainly reflect probabilities and market sentiment, but when major shifts in macro policy (such as Fed rate decisions or CPI releases) or sudden black swan events occur, macro trends can still dictate the broader market’s direction.
Historical data shows that Bitcoin ( $BTC ) has a very high probability of rising in October each year.
In 10 of the past 13 Octobers, prices closed higher; in only 3 did they close lower.
There have been 3 years in which Bitcoin fell in October:
October 2014: -13.4% (a period of sharp declines in the bear market)
October 2018: -4.5% (just before the bear market bottomed)
October 2025: -3.9% (shocked by a sudden black swan event, macro tariff concerns, and a liquidation crisis, ending a multi-year winning streak for October)
Even when October ultimately closes with a big bullish candle, there are often intra-month pullbacks of around 2%–10% or liquidity hunts. Chasing long positions with high leverage can lead to liquidation during the shakeout early in the month.
Seasonal patterns mainly reflect probabilities and market sentiment, but when major shifts in macro policy (such as Fed rate decisions or CPI releases) or sudden black swan events occur, macro trends can still dictate the broader market’s direction.
In 10 of the past 13 Octobers, prices closed higher; in only 3 did they close lower.
There have been 3 years in which Bitcoin fell in October:
October 2014: -13.4% (a period of sharp declines in the bear market)
October 2018: -4.5% (just before the bear market bottomed)
October 2025: -3.9% (shocked by a sudden black swan event, macro tariff concerns, and a liquidation crisis, ending a multi-year winning streak for October)
Even when October ultimately closes with a big bullish candle, there are often intra-month pullbacks of around 2%–10% or liquidity hunts. Chasing long positions with high leverage can lead to liquidation during the shakeout early in the month.
Seasonal patterns mainly reflect probabilities and market sentiment, but when major shifts in macro policy (such as Fed rate decisions or CPI releases) or sudden black swan events occur, macro trends can still dictate the broader market’s direction.
3
937
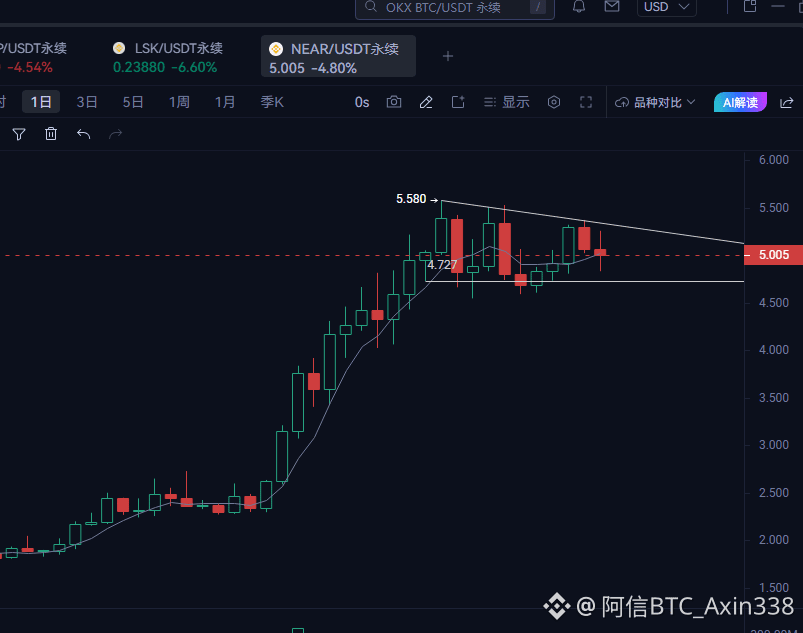
$NEAR This thing is insanely strong
Stronger than ETH and BTC
Now that's a real god
I'm impressed
{future}(NEARUSDT)
$NEAR This thing is insanely strong
Stronger than ETH and BTC
Now that's a real god
I'm impressed
Stronger than ETH and BTC
Now that's a real god
I'm impressed
700
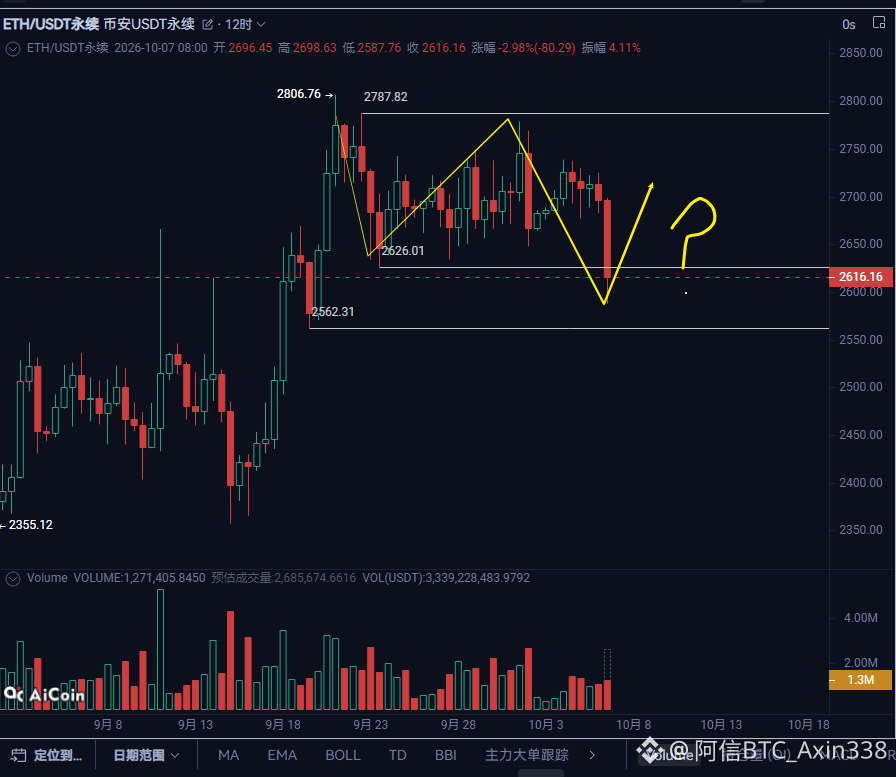
$ETH is weaker than BTC.
The level has been broken.
Today's focus: Can ETH reclaim support at 2626?
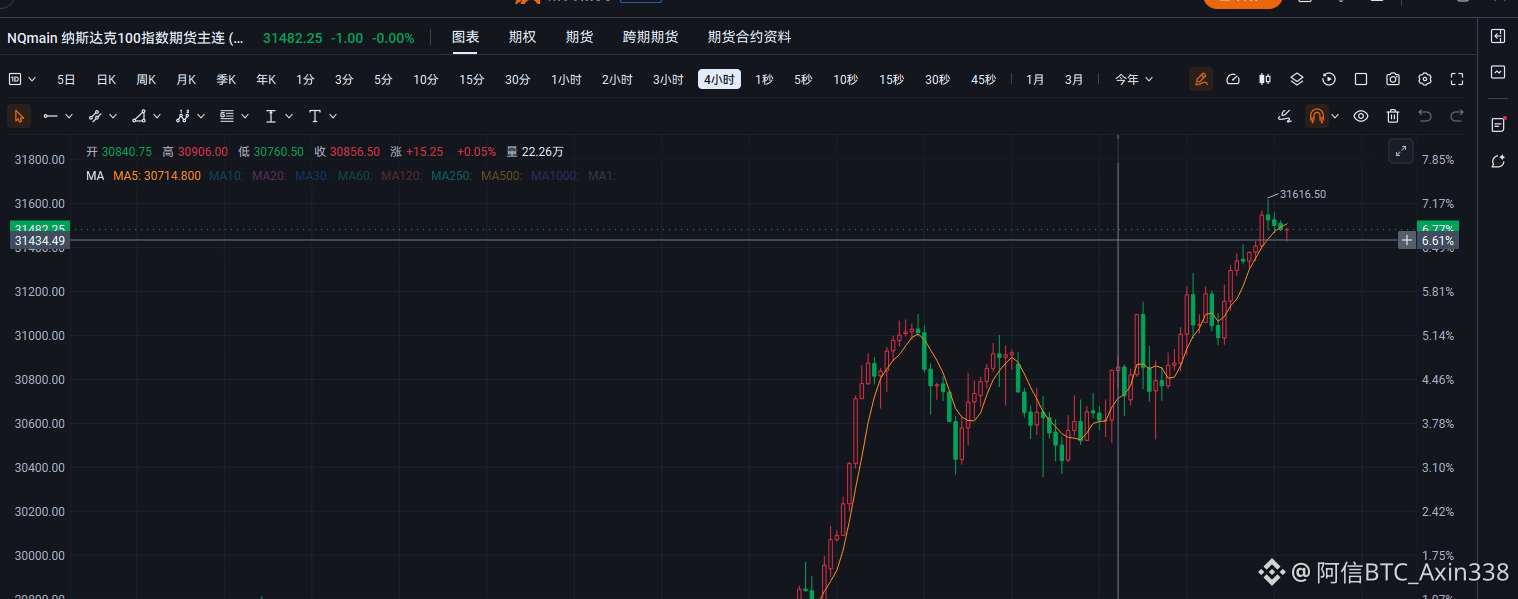
Gold and the Nasdaq 100 haven't fallen much.
ETH also has some chance of a false breakdown. When price has only just broken below support, immediately chasing it with a short is relatively risky. If the market rebounds in a V-shape, you could end up shorting right at the bottom.
Please stay tuned. I'll provide updates promptly.
$ETH is weaker than BTC.
The level has been broken.
Today's focus: Can ETH reclaim support at 2626?
Gold and the Nasdaq 100 haven't fallen much.
ETH also has some chance of a false breakdown. When price has only just broken below support, immediately chasing it with a short is relatively risky. If the market rebounds in a V-shape, you could end up shorting right at the bottom.
Please stay tuned. I'll provide updates promptly.
The level has been broken.
Today's focus: Can ETH reclaim support at 2626?
Gold and the Nasdaq 100 haven't fallen much.
ETH also has some chance of a false breakdown. When price has only just broken below support, immediately chasing it with a short is relatively risky. If the market rebounds in a V-shape, you could end up shorting right at the bottom.
Please stay tuned. I'll provide updates promptly.
6
1.1k
·
--
Bullish
No matter how things change, the underlying principle remains the same.
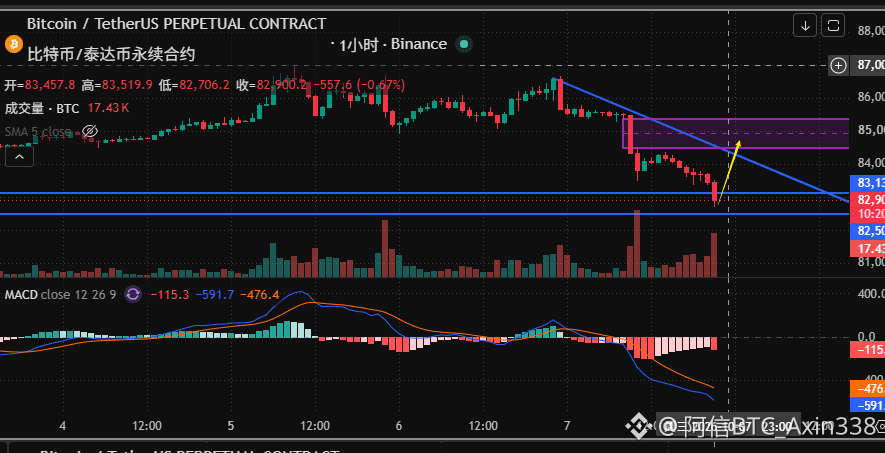
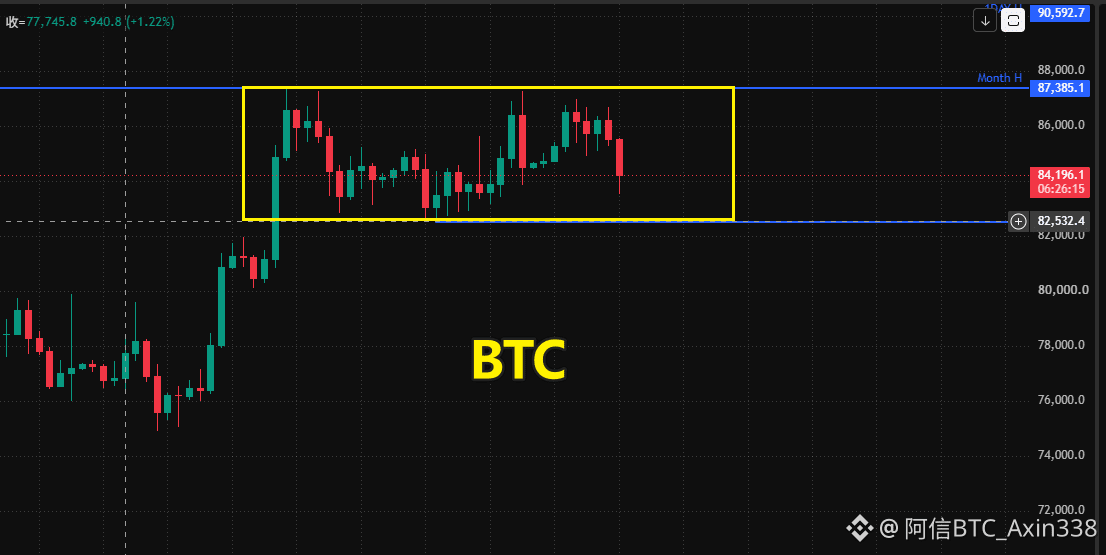
$BTC Sideways action means stops getting swept back and forth until it’s time for a market move!
Keep a close eye on Wednesday, October 14: U.S. September CPI inflation data
It takes time to recover.
The real rally will come after the news is released.
As long as the low of this range at 825 holds, there’s no problem.
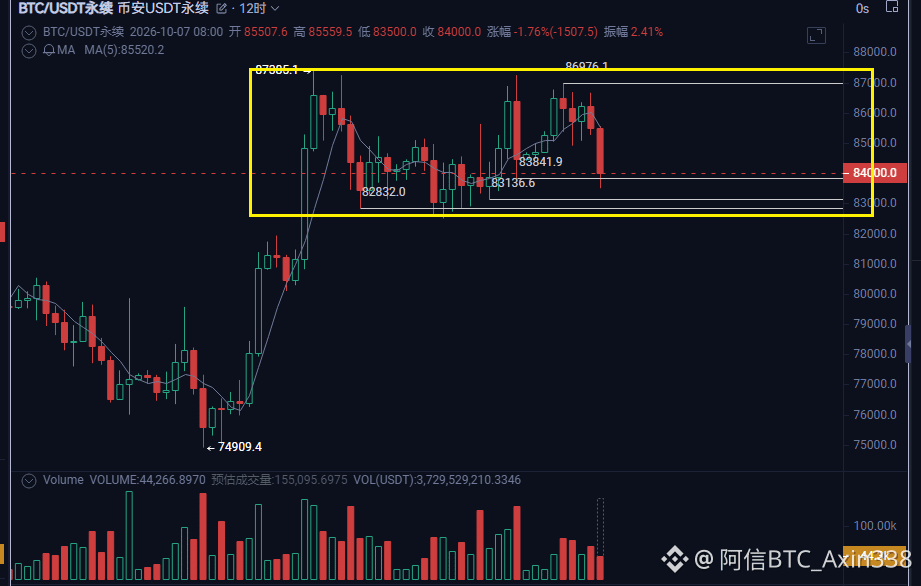
To consider the worst-case scenario: if support at 825 breaks, will we see another sharp drop or a V-shaped reversal after the breakdown? We’ll keep monitoring it then.
Based on the current situation, 825 may well hold!
That’s because BTC is clearly stronger than ETH right now. ETH broke below support at 2626, but BTC hasn’t broken below 825. This shows that the market maker is maneuvering BTC with precision. Stay tuned—I’ll keep tracking it.
No matter how things change, the underlying principle remains the same.
$BTC Sideways action means stops getting swept back and forth until it’s time for a market move!
Keep a close eye on Wednesday, October 14: U.S. September CPI inflation data
It takes time to recover.
The real rally will come after the news is released.
As long as the low of this range at 825 holds, there’s no problem.
To consider the worst-case scenario: if support at 825 breaks, will we see another sharp drop or a V-shaped reversal after the breakdown? We’ll keep monitoring it then.
Based on the current situation, 825 may well hold!
That’s because BTC is clearly stronger than ETH right now. ETH broke below support at 2626, but BTC hasn’t broken below 825. This shows that the market maker is maneuvering BTC with precision. Stay tuned—I’ll keep tracking it.
$BTC Sideways action means stops getting swept back and forth until it’s time for a market move!
Keep a close eye on Wednesday, October 14: U.S. September CPI inflation data
It takes time to recover.
The real rally will come after the news is released.
As long as the low of this range at 825 holds, there’s no problem.
To consider the worst-case scenario: if support at 825 breaks, will we see another sharp drop or a V-shaped reversal after the breakdown? We’ll keep monitoring it then.
Based on the current situation, 825 may well hold!
That’s because BTC is clearly stronger than ETH right now. ETH broke below support at 2626, but BTC hasn’t broken below 825. This shows that the market maker is maneuvering BTC with precision. Stay tuned—I’ll keep tracking it.
1
2
2.3k
Verified
10/7 BTC Market Update:
Don't panic too much; we're still in a wide-ranging consolidation.
This latest drop in BTC and ETH was driven by oil.
The reason is that a report just came out saying oil inventories are low, and the G7's reserve release won't even cover a day's consumption. This pushed oil prices up and $BTC , $ETH down.
Whether BTC forms a double top and plunges depends mainly on today's 4H price action (that is, the close and the candlestick pattern).
Key times to watch: 12:00, 16:00, and 20:00.
Because sometimes a breakdown gets reversed, and that takes time.
BTC is moving sideways in a range, with a range of 825–872.
In other words, BTC hasn't broken down, and there's no signal that the overall uptrend is over yet.
ETH is relatively weaker and has broken down. Let's see whether it can recover by this afternoon or tonight.
So let's keep watching. There are usually more false signals during the day; genuine signals often come around the New York open.
All I can say is that today is very important. Potential risk: if ETH can't reclaim the key support at 2626 today, there's a risk of a major pullback.
10/7 BTC Market Update:
Don't panic too much; we're still in a wide-ranging consolidation.
This latest drop in BTC and ETH was driven by oil.
The reason is that a report just came out saying oil inventories are low, and the G7's reserve release won't even cover a day's consumption. This pushed oil prices up and $BTC , $ETH down.
Whether BTC forms a double top and plunges depends mainly on today's 4H price action (that is, the close and the candlestick pattern).
Key times to watch: 12:00, 16:00, and 20:00.
Because sometimes a breakdown gets reversed, and that takes time.
BTC is moving sideways in a range, with a range of 825–872.
In other words, BTC hasn't broken down, and there's no signal that the overall uptrend is over yet.
ETH is relatively weaker and has broken down. Let's see whether it can recover by this afternoon or tonight.
So let's keep watching. There are usually more false signals during the day; genuine signals often come around the New York open.
All I can say is that today is very important. Potential risk: if ETH can't reclaim the key support at 2626 today, there's a risk of a major pullback.
Don't panic too much; we're still in a wide-ranging consolidation.
This latest drop in BTC and ETH was driven by oil.
The reason is that a report just came out saying oil inventories are low, and the G7's reserve release won't even cover a day's consumption. This pushed oil prices up and $BTC , $ETH down.
Whether BTC forms a double top and plunges depends mainly on today's 4H price action (that is, the close and the candlestick pattern).
Key times to watch: 12:00, 16:00, and 20:00.
Because sometimes a breakdown gets reversed, and that takes time.
BTC is moving sideways in a range, with a range of 825–872.
In other words, BTC hasn't broken down, and there's no signal that the overall uptrend is over yet.
ETH is relatively weaker and has broken down. Let's see whether it can recover by this afternoon or tonight.
So let's keep watching. There are usually more false signals during the day; genuine signals often come around the New York open.
All I can say is that today is very important. Potential risk: if ETH can't reclaim the key support at 2626 today, there's a risk of a major pullback.
3
2
2.3k
Verified
Key market-moving dates in October:
October 13–16: U.S. Q3 earnings season kicks off: major banks such as JPMorgan Chase (JPM) and Citigroup report first
October 14 (Wednesday): U.S. September CPI inflation data
October 15 (Thursday): U.S. PPI and retail sales data
October 20–31: Earnings reports from major tech companies
(Capex spending and earnings guidance from AI and tech giants such as Microsoft, Google, Apple, and Amazon will determine whether the S&P 500 and Nasdaq break higher or pull back sharply.)
October 29 (2:00 a.m.): FOMC interest rate decision
October 29 (Thursday): U.S. September PCE price index
(The Federal Reserve’s preferred inflation gauge)
October 29 (Thursday): ECB interest rate decision
Daylight saving time reminder: Europe switches to standard time on October 25, while the U.S. switches on November 1.
Can’t be lazy after all—I just looked this up myself. Feel free to add anything.
Key market-moving dates in October:
October 13–16: U.S. Q3 earnings season kicks off: major banks such as JPMorgan Chase (JPM) and Citigroup report first
October 14 (Wednesday): U.S. September CPI inflation data
October 15 (Thursday): U.S. PPI and retail sales data
October 20–31: Earnings reports from major tech companies
(Capex spending and earnings guidance from AI and tech giants such as Microsoft, Google, Apple, and Amazon will determine whether the S&P 500 and Nasdaq break higher or pull back sharply.)
October 29 (2:00 a.m.): FOMC interest rate decision
October 29 (Thursday): U.S. September PCE price index
(The Federal Reserve’s preferred inflation gauge)
October 29 (Thursday): ECB interest rate decision
Daylight saving time reminder: Europe switches to standard time on October 25, while the U.S. switches on November 1.
Can’t be lazy after all—I just looked this up myself. Feel free to add anything.
October 13–16: U.S. Q3 earnings season kicks off: major banks such as JPMorgan Chase (JPM) and Citigroup report first
October 14 (Wednesday): U.S. September CPI inflation data
October 15 (Thursday): U.S. PPI and retail sales data
October 20–31: Earnings reports from major tech companies
(Capex spending and earnings guidance from AI and tech giants such as Microsoft, Google, Apple, and Amazon will determine whether the S&P 500 and Nasdaq break higher or pull back sharply.)
October 29 (2:00 a.m.): FOMC interest rate decision
October 29 (Thursday): U.S. September PCE price index
(The Federal Reserve’s preferred inflation gauge)
October 29 (Thursday): ECB interest rate decision
Daylight saving time reminder: Europe switches to standard time on October 25, while the U.S. switches on November 1.
Can’t be lazy after all—I just looked this up myself. Feel free to add anything.
阿信BTC_Axin338
·
--
What major events are coming up this month, everyone?
CPI next Wednesday
PCE at the end of the month
That’s all I know right now. I’m too lazy to look anything else up, damn.
Why do I want to know? Because these are basically all potential market turning points.
CPI next Wednesday
PCE at the end of the month
That’s all I know right now. I’m too lazy to look anything else up, damn.
Why do I want to know? Because these are basically all potential market turning points.
1
739
Verified
What major events are coming up this month, everyone?
CPI next Wednesday
PCE at the end of the month
That’s all I know right now. I’m too lazy to look anything else up, damn.
Why do I want to know? Because these are basically all potential market turning points.
What major events are coming up this month, everyone?
CPI next Wednesday
PCE at the end of the month
That’s all I know right now. I’m too lazy to look anything else up, damn.
Why do I want to know? Because these are basically all potential market turning points.
CPI next Wednesday
PCE at the end of the month
That’s all I know right now. I’m too lazy to look anything else up, damn.
Why do I want to know? Because these are basically all potential market turning points.
1
1.8k
·
--
Bullish
When it comes to faith, gold is the way to go
Strong as hell
$XAU
{future}(XAUUSDT)
When it comes to faith, gold is the way to go
Strong as hell
$XAU
Strong as hell
$XAU
430
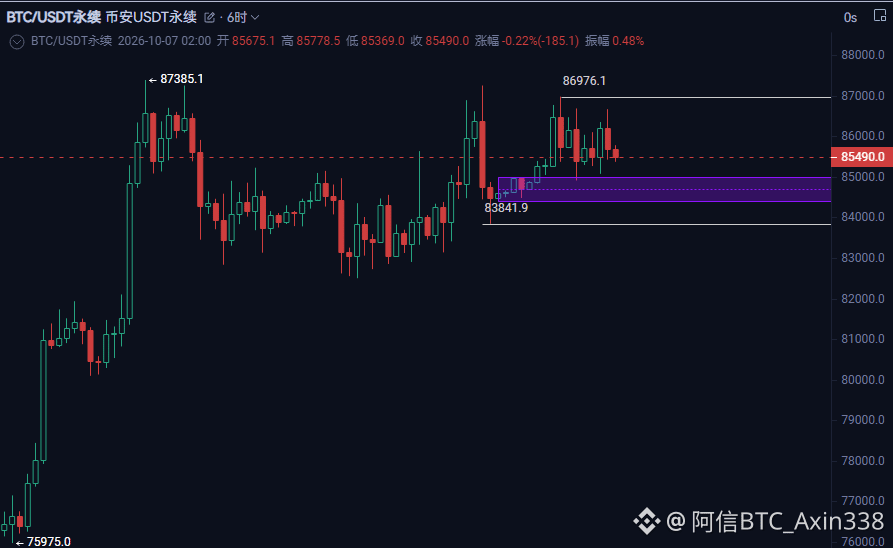
$BTC fell—or, more accurately, it's moving sideways.
But the bears are shouting again, haha.
It's either the bulls overpowering the bears or the bears overpowering the bulls.
This is a sideways market, and the time for a trend reversal hasn't come yet.
As I said before, the market will reverse by next Wednesday at the latest, when the CPI is released.
For it to reverse sooner, it would need to break above 867. It didn't break above 867 last night, so we'll keep trading sideways. Be patient, everyone—we're still ranging between 838 and 870.
$BTC fell—or, more accurately, it's moving sideways.
But the bears are shouting again, haha.
It's either the bulls overpowering the bears or the bears overpowering the bulls.
This is a sideways market, and the time for a trend reversal hasn't come yet.
As I said before, the market will reverse by next Wednesday at the latest, when the CPI is released.
For it to reverse sooner, it would need to break above 867. It didn't break above 867 last night, so we'll keep trading sideways. Be patient, everyone—we're still ranging between 838 and 870.
But the bears are shouting again, haha.
It's either the bulls overpowering the bears or the bears overpowering the bulls.
This is a sideways market, and the time for a trend reversal hasn't come yet.
As I said before, the market will reverse by next Wednesday at the latest, when the CPI is released.
For it to reverse sooner, it would need to break above 867. It didn't break above 867 last night, so we'll keep trading sideways. Be patient, everyone—we're still ranging between 838 and 870.
阿信BTC_Axin338
·
--
BullishBig news—this is extremely important.
$BTC could break out and rise at any time over the next few days.
At the latest, it should happen by next Wednesday (the 14th), when the CPI data is released.
The reason is simple: in this upward impulse wave, the first, third, and fifth waves have already risen, and the seventh wave is now getting ready to rise.
Generally speaking, the time spent consolidating and shaking out weak holders gets shorter and shorter, and the actual calculations show the same pattern: the corrections lasted 42 days in wave two, 26 days in wave four, and 14 days in wave six (not yet broken out): 42, 26, 14.
The next key reversal window is 16 days away, matching a strict golden-ratio decrease of 42 → 26 → 16 (0.618).
If there is one more period of tight, high-level consolidation before the breakout, the reversal is very likely to happen around the CPI release next week.
In summary: within the window from this Wednesday to next Wednesday, BTC is highly likely to break through the 872–873 resistance zone and then continue rising!
Of course, this depends on the key support at 838 holding. Otherwise, there is a risk of a further drop below 825! DYOR
$BTC could break out and rise at any time over the next few days.
At the latest, it should happen by next Wednesday (the 14th), when the CPI data is released.
The reason is simple: in this upward impulse wave, the first, third, and fifth waves have already risen, and the seventh wave is now getting ready to rise.
Generally speaking, the time spent consolidating and shaking out weak holders gets shorter and shorter, and the actual calculations show the same pattern: the corrections lasted 42 days in wave two, 26 days in wave four, and 14 days in wave six (not yet broken out): 42, 26, 14.
The next key reversal window is 16 days away, matching a strict golden-ratio decrease of 42 → 26 → 16 (0.618).
If there is one more period of tight, high-level consolidation before the breakout, the reversal is very likely to happen around the CPI release next week.
In summary: within the window from this Wednesday to next Wednesday, BTC is highly likely to break through the 872–873 resistance zone and then continue rising!
Of course, this depends on the key support at 838 holding. Otherwise, there is a risk of a further drop below 825! DYOR
5
2k
·
--
Bullish
Come on, short $BTC , $ETH .
The market needs you shorts as fuel to rise.
😁
Come on, short $BTC , $ETH .
The market needs you shorts as fuel to rise.
😁
The market needs you shorts as fuel to rise.
😁
5
2
1.5k
·
--
Bullish
Don't fucking short, or you'll end up in a world of pain.
I'm talking about $BTC , $ETH .
If you've already gotten into the habit of shorting at resistance, break that habit right now.
Because it will destroy you.
The big players are trying to condition you to think this way—to short whenever price reaches resistance.
Your wins and losses come from the same strategy. You might make money shorting resistance four times, but one loss is enough to wipe you out. After winning the first four times, you'll get overconfident, and the next time you might go all in with a huge short position.
Don't fucking short, or you'll end up in a world of pain.
I'm talking about $BTC , $ETH .
If you've already gotten into the habit of shorting at resistance, break that habit right now.
Because it will destroy you.
The big players are trying to condition you to think this way—to short whenever price reaches resistance.
Your wins and losses come from the same strategy. You might make money shorting resistance four times, but one loss is enough to wipe you out. After winning the first four times, you'll get overconfident, and the next time you might go all in with a huge short position.
I'm talking about $BTC , $ETH .
If you've already gotten into the habit of shorting at resistance, break that habit right now.
Because it will destroy you.
The big players are trying to condition you to think this way—to short whenever price reaches resistance.
Your wins and losses come from the same strategy. You might make money shorting resistance four times, but one loss is enough to wipe you out. After winning the first four times, you'll get overconfident, and the next time you might go all in with a huge short position.
3
946
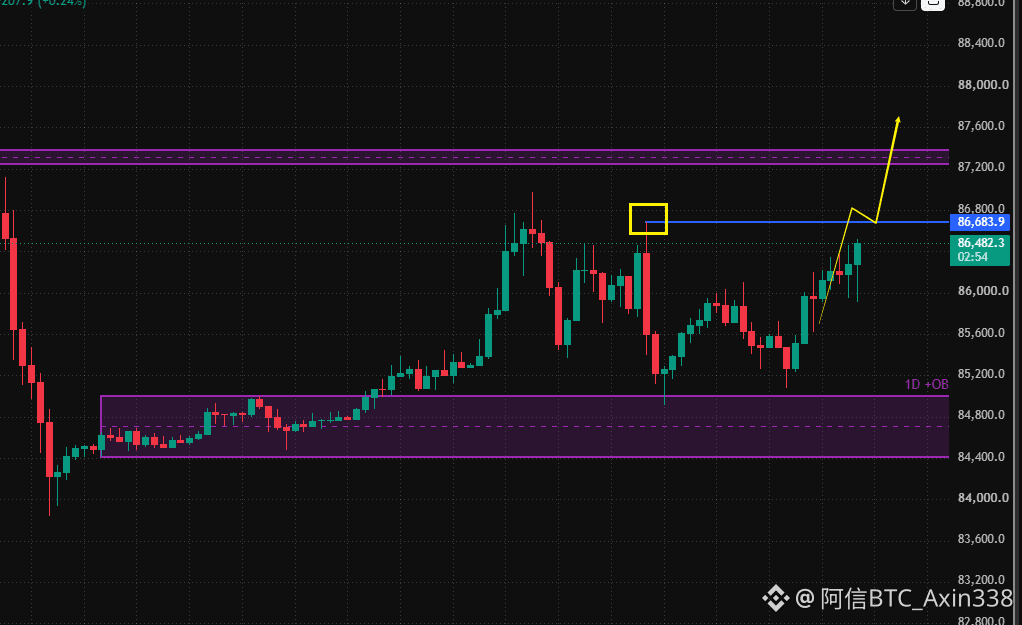
10/6 evening $BTC latest market update:
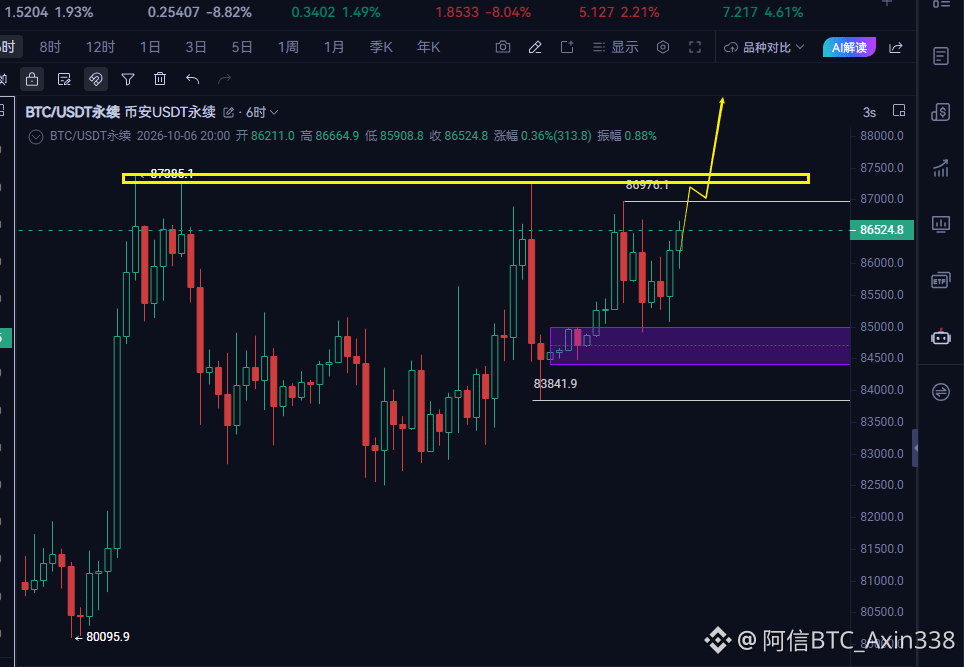
The key resistance is 867. If it breaks through for real, the market may take off tonight.
If it’s a false breakout, we’ll continue to see sideways trading.
We’ll have to see what move the big players make to catalyze this market.
You can never predict the news. In my view, news is just a tool that accompanies price movements.
Let’s first analyze the logic behind a rise. News only plays a supporting role—it’s just something the bullish scenario needs.
10/6 evening $BTC latest market update:
The key resistance is 867. If it breaks through for real, the market may take off tonight.
If it’s a false breakout, we’ll continue to see sideways trading.
We’ll have to see what move the big players make to catalyze this market.
You can never predict the news. In my view, news is just a tool that accompanies price movements.
Let’s first analyze the logic behind a rise. News only plays a supporting role—it’s just something the bullish scenario needs.
The key resistance is 867. If it breaks through for real, the market may take off tonight.
If it’s a false breakout, we’ll continue to see sideways trading.
We’ll have to see what move the big players make to catalyze this market.
You can never predict the news. In my view, news is just a tool that accompanies price movements.
Let’s first analyze the logic behind a rise. News only plays a supporting role—it’s just something the bullish scenario needs.
1
3
1.7k
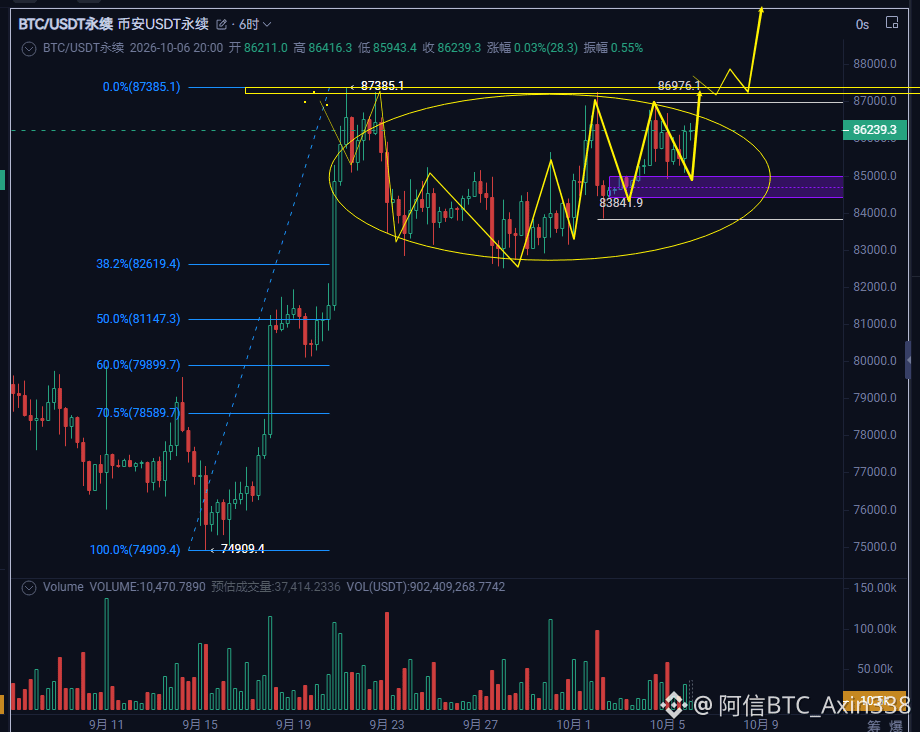
Let me tell you something real.
This is really important, so don’t let the current choppy action wear you down.
It’s all part of the big players’ effort to build up enough liquidity for a rise, setting the stage to surge when the breakout comes.
Generally speaking, when $BTC rises, the more complex and prolonged the consolidation, the stronger and more sustained the move will be once it truly breaks out.
Let me tell you something real.
This is really important, so don’t let the current choppy action wear you down.
It’s all part of the big players’ effort to build up enough liquidity for a rise, setting the stage to surge when the breakout comes.
Generally speaking, when $BTC rises, the more complex and prolonged the consolidation, the stronger and more sustained the move will be once it truly breaks out.
This is really important, so don’t let the current choppy action wear you down.
It’s all part of the big players’ effort to build up enough liquidity for a rise, setting the stage to surge when the breakout comes.
Generally speaking, when $BTC rises, the more complex and prolonged the consolidation, the stronger and more sustained the move will be once it truly breaks out.
16
3
5.8k
Log in to explore more content
Join global crypto users on Binance Square
⚡️ Get latest and useful information about crypto.
💬 Trusted by the world’s largest crypto exchange.
👍 Discover real insights from verified creators.
Email / Phone number
Trending Topics
FedMinutesFocusOnOctoberPause
244,061 views
1,584 Discussing
🚨 HIGH ALERT ‼️ PLEASE DON’T TRADE BLINDLY FOR THE NEXT HOUR 🚨
Guys, we have FOMC Minutes coming in less than 1 hour.
And after the kind of volatility we already saw today, I really don’t want anyone opening random high-leverage positions just before this release.
The biggest reaction I’m watching will be in Gold (XAU), Silver (XAG), BTC and ETH. Then coins like SOL and other highly leveraged mid/low-cap alts can exaggerate whatever move BTC makes.
Gold and Silver are especially sensitive tonight because the market is already reacting to the US dollar + Treasury yields, and both metals have been under heavy pressure ahead of the Fed minutes.
Briefly speaking
📉Hawkish Fed Minutes → Dollar/yields can push higher → pressure on BTC, crypto, Gold & silver
📈Dovish Fed Minutes → Dollar/yields can cool → BTC, Gold, Silver and risk assets can bounce hard.
And please remember the first candle can be a trap. We can get a pump, immediate dump, liquidations on both sides, and then the real direction.
So for now, protect your positions, reduce unnecessary leverage and don’t FOMO into the first move.
Tonight I’m watching $XAU , $XAG and $BTC first. These will tell us very quickly how the market is reading the Fed.
I will Update you guys on time
Follow @Panda Traders and Turn on Your notifications right now
#FedMinutesFocusOnOctoberPause
Panda Traders
·20 Likes
·4.6k views
BinanceLaunchesBinanceIntelligence
1.2M views
6,740 Discussing
EvernorthDelaysNasdaqDebutToOct12
30,122 views
395 Discussing