

鑫鹰说财
1.8k Posts

鑫鹰说财
Report
Block User
推特(X): Miger168
聊天室ID:1111721035
擅长现货 合约,长线 短线,欢迎交流!
5 Following
4.4K+ Followers
3.2K+ Liked
Posts
All
Quotes
Videos
PINNED
·
--
Bullish
There are still fans who can’t find the chat room and communicate with Xinying!
Xinying provides the full process!
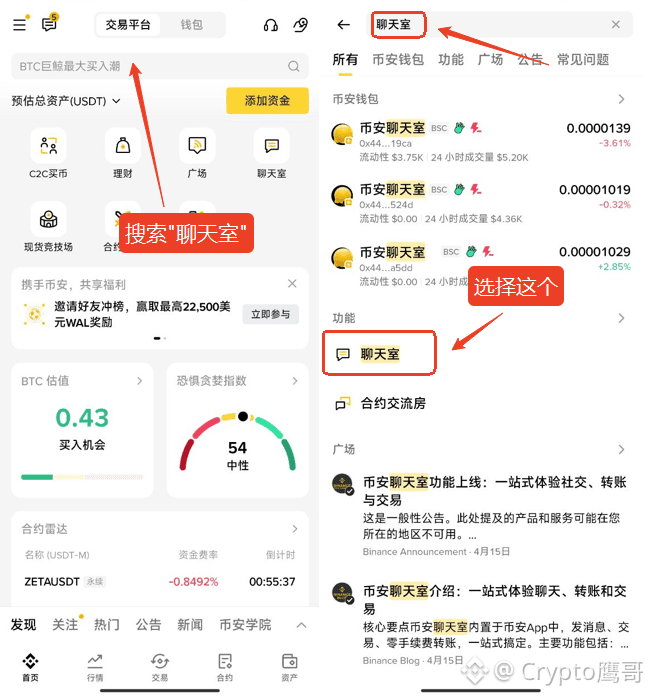
【1】Enter 【Chat Room】 in the search bar to find the entry
【2】Tap ➕ at the top-right corner to add a contact.
【3】Choose "Scan QR code" or "Search by Binance ID/Chat ID"
Xinying ID:1111721035
You can find Xinying for both copy-trading and analysis. If Xinying sees you, they will respond!
#比特币价格走势 #加密市场回暖 $BTC $ETH $RAVE
There are still fans who can’t find the chat room and communicate with Xinying!
Xinying provides the full process!
【1】Enter 【Chat Room】 in the search bar to find the entry
【2】Tap ➕ at the top-right corner to add a contact.
【3】Choose "Scan QR code" or "Search by Binance ID/Chat ID"
Xinying ID:1111721035
You can find Xinying for both copy-trading and analysis. If Xinying sees you, they will respond!
#比特币价格走势 #加密市场回暖 $BTC $ETH $RAVE
Xinying provides the full process!
【1】Enter 【Chat Room】 in the search bar to find the entry
【2】Tap ➕ at the top-right corner to add a contact.
【3】Choose "Scan QR code" or "Search by Binance ID/Chat ID"
Xinying ID:1111721035
You can find Xinying for both copy-trading and analysis. If Xinying sees you, they will respond!
#比特币价格走势 #加密市场回暖 $BTC $ETH $RAVE

417
PINNED
·
--
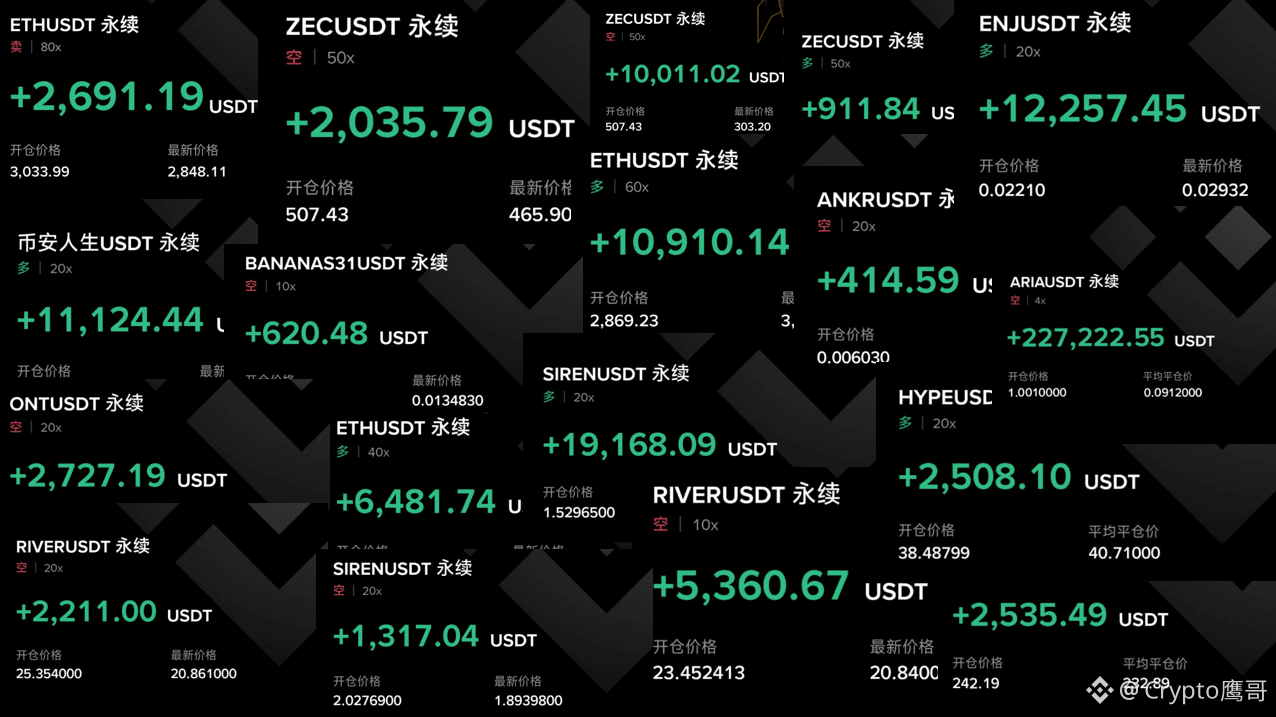
In the future, it will be easier for the brothers to keep up with Eagle Brother's rhythm, and they won't have to worry about not being able to find Eagle Brother!!
Eagle Brother is always on standby for the brothers! Eagle Brother's strength is not boastful, nor does he make empty promises; he only teaches you practical survival skills.
Follow Eagle Brother, and fans who want to keep up will find Eagle Brother; he announces the entry points and exit timings every day!
#加密市场回暖 #美军封锁霍尔木兹海峡
$BTC $ETH $CL
In the future, it will be easier for the brothers to keep up with Eagle Brother's rhythm, and they won't have to worry about not being able to find Eagle Brother!!
Eagle Brother is always on standby for the brothers! Eagle Brother's strength is not boastful, nor does he make empty promises; he only teaches you practical survival skills.
Follow Eagle Brother, and fans who want to keep up will find Eagle Brother; he announces the entry points and exit timings every day!
#加密市场回暖 #美军封锁霍尔木兹海峡
$BTC $ETH $CL
Eagle Brother is always on standby for the brothers! Eagle Brother's strength is not boastful, nor does he make empty promises; he only teaches you practical survival skills.
Follow Eagle Brother, and fans who want to keep up will find Eagle Brother; he announces the entry points and exit timings every day!
#加密市场回暖 #美军封锁霍尔木兹海峡
$BTC $ETH $CL

280
·
--
Bullish
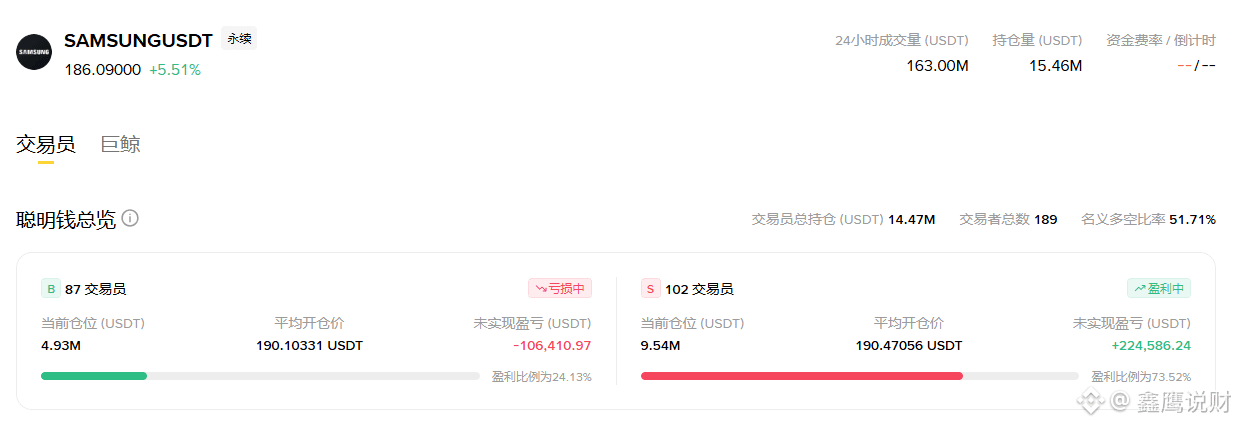
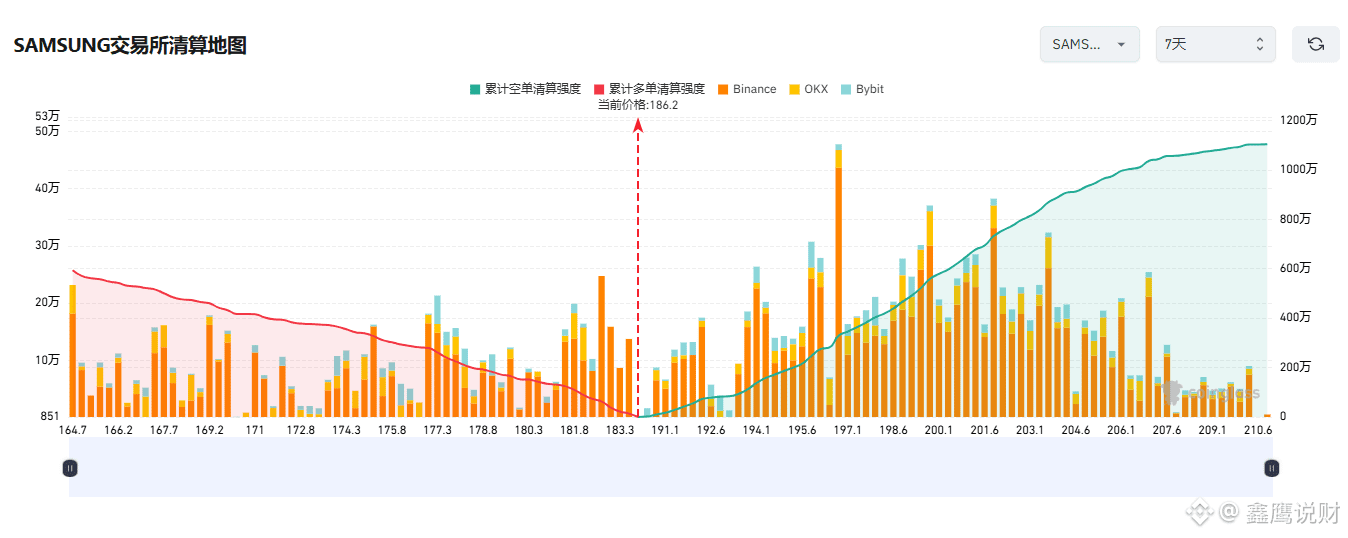
$SAMSUNG Violent rebound +6%! From 162 all the way back to 190—short sellers got blown up and can’t find their way, and the trend has quietly changed!
Brothers, this rebound feels so good!
Yesterday, Samsung’s low was smashed to 162.75, and today it went straight up with a single big bullish candle to the high of 189.78. Current price: 187.55, up 6.27% in one day!
A key reversal signal has appeared on the technical chart!
MA(7) at 188.19 has turned upward, and price has reclaimed MA(25) at 185.00 and MA(99) at 184.76. This is a classic bottom-reversal pattern!
The long positions that XinYing pointed out yesterday at 169–170 have now surged to a high of 189.78—an exact 20-point jump. Brothers who followed the pace have already eaten their fill!
XinYing’s long/short bid-direction trading suggestions:
Go long on pullbacks around 185–186 for consolidation, then enter long;
For shorts, try a light position around 190–192.
The strength of this rebound is also relatively beyond expectations.
Yesterday’s low at 162.75 is very likely the short-term bottom, and today’s big bullish candle confirms the reversal signal.
My plan is very clear: focus on going long on the pullback at 185–186; if it first pushes up to 190–192, you can try a light short position to bet on a pullback.
#2026足球风潮 #长鑫科技IPO定价8.66元估值5791亿元
$SAMSUNG Violent rebound +6%! From 162 all the way back to 190—short sellers got blown up and can’t find their way, and the trend has quietly changed!
Brothers, this rebound feels so good!
Yesterday, Samsung’s low was smashed to 162.75, and today it went straight up with a single big bullish candle to the high of 189.78. Current price: 187.55, up 6.27% in one day!
A key reversal signal has appeared on the technical chart!
MA(7) at 188.19 has turned upward, and price has reclaimed MA(25) at 185.00 and MA(99) at 184.76. This is a classic bottom-reversal pattern!
The long positions that XinYing pointed out yesterday at 169–170 have now surged to a high of 189.78—an exact 20-point jump. Brothers who followed the pace have already eaten their fill!
XinYing’s long/short bid-direction trading suggestions:
Go long on pullbacks around 185–186 for consolidation, then enter long;
For shorts, try a light position around 190–192.
The strength of this rebound is also relatively beyond expectations.
Yesterday’s low at 162.75 is very likely the short-term bottom, and today’s big bullish candle confirms the reversal signal.
My plan is very clear: focus on going long on the pullback at 185–186; if it first pushes up to 190–192, you can try a light short position to bet on a pullback.
#2026足球风潮 #长鑫科技IPO定价8.66元估值5791亿元
Brothers, this rebound feels so good!
Yesterday, Samsung’s low was smashed to 162.75, and today it went straight up with a single big bullish candle to the high of 189.78. Current price: 187.55, up 6.27% in one day!
A key reversal signal has appeared on the technical chart!
MA(7) at 188.19 has turned upward, and price has reclaimed MA(25) at 185.00 and MA(99) at 184.76. This is a classic bottom-reversal pattern!
The long positions that XinYing pointed out yesterday at 169–170 have now surged to a high of 189.78—an exact 20-point jump. Brothers who followed the pace have already eaten their fill!
XinYing’s long/short bid-direction trading suggestions:
Go long on pullbacks around 185–186 for consolidation, then enter long;
For shorts, try a light position around 190–192.
The strength of this rebound is also relatively beyond expectations.
Yesterday’s low at 162.75 is very likely the short-term bottom, and today’s big bullish candle confirms the reversal signal.
My plan is very clear: focus on going long on the pullback at 185–186; if it first pushes up to 190–192, you can try a light short position to bet on a pullback.
#2026足球风潮 #长鑫科技IPO定价8.66元估值5791亿元
343
·
--
Bullish
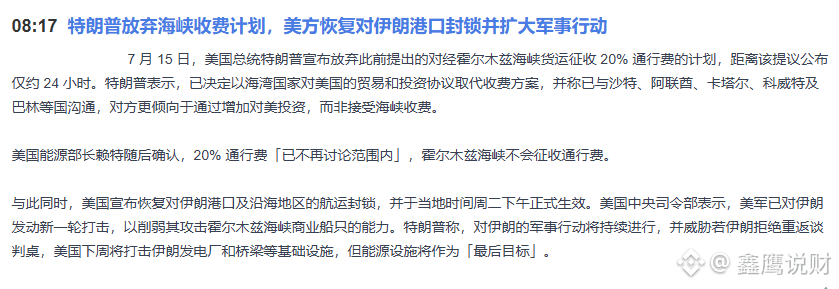
Trump Drops Strait Toll Plans but Military Strikes Escalate! $CL spikes then falls back; bulls and bears battle at the 80 level—this doji candle appears, and the direction is about to be chosen!
Brothers, today the crude oil news flow is a complete mess! Trump just said he would abandon the strait toll plan, and then immediately resumed the blockade of Iranian ports and expanded military strikes. Oil prices surged straight from around 77 up to a high of 79.50, and the current price is 79.11—rally high then pullback within the day. This price action leaves you scratching your head.
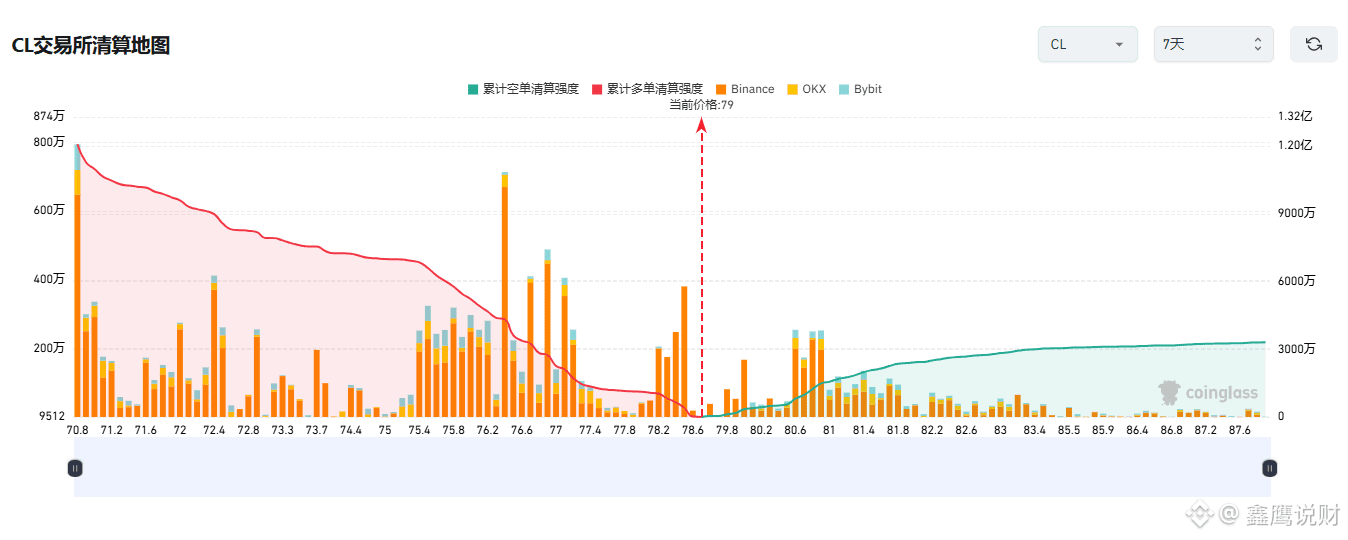
From a technical perspective, MA(7) at 79.22 and MA(25) at 79.23 are almost stuck together, with price hovering and grinding around the moving averages—this is a classic consolidation-and-breakout-in-waiting pattern. MA(99) at 75.15 firmly holds as support, indicating the bigger trend hasn’t gone bad yet, but the 80 handle has been tested three times and failed, so overhead pressure is still significant.
Xinying multi-/short-side trading suggestions:
Go long on a pullback and stabilization around 78.4–78.6 to enter; short around 80–80.5 after a stall/rise is exhausted, using a light position.
Although Trump has abandoned the toll plan, the military escalation against Iran is real and tangible—risk in the Strait of Hormuz remains. The moving averages sticking together shows bulls and bears are evenly matched, but there is still a geopolitical risk premium. My bias is to focus on longs on the pullback around 78.4–78.6.
#2026足球风潮 #长鑫科技IPO定价8.66元估值5791亿元
Trump Drops Strait Toll Plans but Military Strikes Escalate! $CL spikes then falls back; bulls and bears battle at the 80 level—this doji candle appears, and the direction is about to be chosen!
Brothers, today the crude oil news flow is a complete mess! Trump just said he would abandon the strait toll plan, and then immediately resumed the blockade of Iranian ports and expanded military strikes. Oil prices surged straight from around 77 up to a high of 79.50, and the current price is 79.11—rally high then pullback within the day. This price action leaves you scratching your head.
From a technical perspective, MA(7) at 79.22 and MA(25) at 79.23 are almost stuck together, with price hovering and grinding around the moving averages—this is a classic consolidation-and-breakout-in-waiting pattern. MA(99) at 75.15 firmly holds as support, indicating the bigger trend hasn’t gone bad yet, but the 80 handle has been tested three times and failed, so overhead pressure is still significant.
Xinying multi-/short-side trading suggestions:
Go long on a pullback and stabilization around 78.4–78.6 to enter; short around 80–80.5 after a stall/rise is exhausted, using a light position.
Although Trump has abandoned the toll plan, the military escalation against Iran is real and tangible—risk in the Strait of Hormuz remains. The moving averages sticking together shows bulls and bears are evenly matched, but there is still a geopolitical risk premium. My bias is to focus on longs on the pullback around 78.4–78.6.
#2026足球风潮 #长鑫科技IPO定价8.66元估值5791亿元
Brothers, today the crude oil news flow is a complete mess! Trump just said he would abandon the strait toll plan, and then immediately resumed the blockade of Iranian ports and expanded military strikes. Oil prices surged straight from around 77 up to a high of 79.50, and the current price is 79.11—rally high then pullback within the day. This price action leaves you scratching your head.
From a technical perspective, MA(7) at 79.22 and MA(25) at 79.23 are almost stuck together, with price hovering and grinding around the moving averages—this is a classic consolidation-and-breakout-in-waiting pattern. MA(99) at 75.15 firmly holds as support, indicating the bigger trend hasn’t gone bad yet, but the 80 handle has been tested three times and failed, so overhead pressure is still significant.
Xinying multi-/short-side trading suggestions:
Go long on a pullback and stabilization around 78.4–78.6 to enter; short around 80–80.5 after a stall/rise is exhausted, using a light position.
Although Trump has abandoned the toll plan, the military escalation against Iran is real and tangible—risk in the Strait of Hormuz remains. The moving averages sticking together shows bulls and bears are evenly matched, but there is still a geopolitical risk premium. My bias is to focus on longs on the pullback around 78.4–78.6.
#2026足球风潮 #长鑫科技IPO定价8.66元估值5791亿元
654
·
--
Bullish
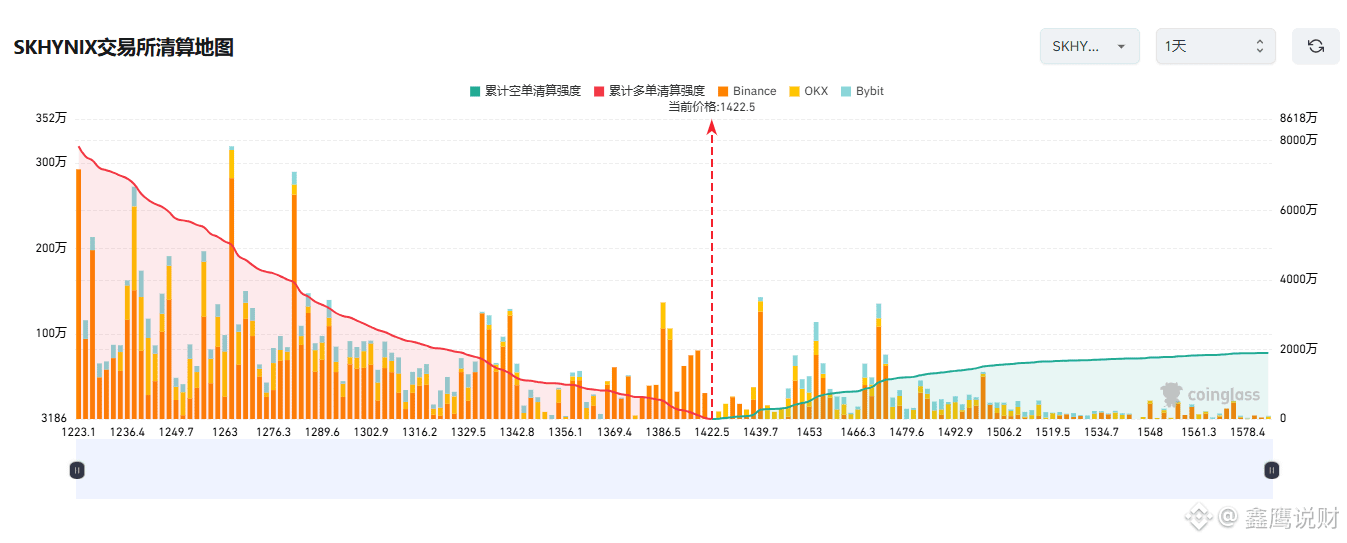
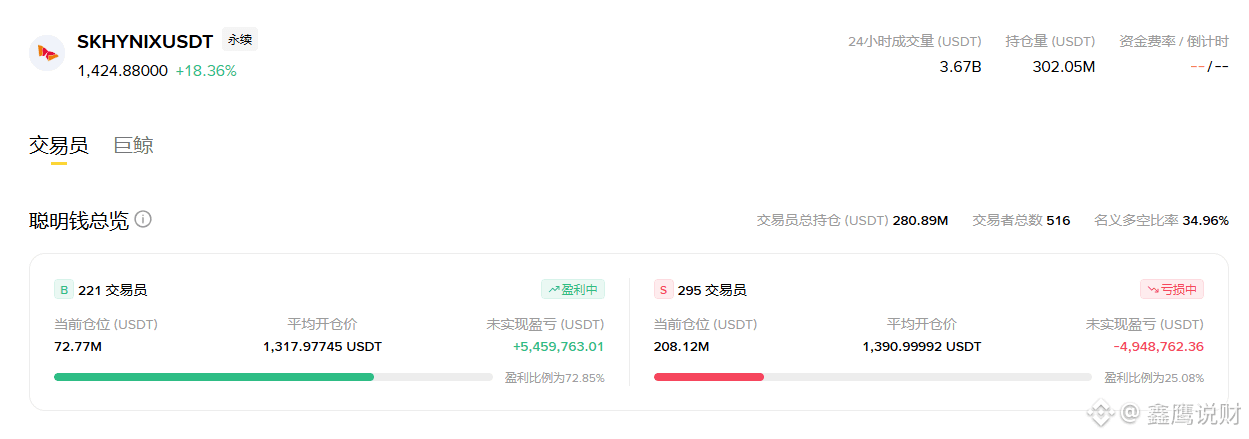
$SKHYNIX Hynix violent rebound 16%! It went straight from 1173 to 1445—short sellers got wiped out, leaving nothing! This big bullish candle has appeared; short sellers must back down!
Brothers, this rebound is too fierce! Yesterday SK Hynix was smashed to the low at 1173.24; today it surged with a single big bullish candle to a high of 1445.96. The current price is 1422.65, a daily jump of 16.45%! The brothers who bought the dip finally can hold their heads high—short sellers probably are already crying for help.
A key technical reversal signal has emerged! MA(7) at 1400 has turned upward; price is above all short-term moving averages. MA(25) at 1334 has also started to flatten—this is a textbook bottom reversal pattern.
The long positions suggested by Xinye around 1211 yesterday are now up to a high of 1445 today, a gain of a full 230 points. Brothers who followed the rhythm have already had their fill!
Xinye’s bidirectional trading suggestions:
Go long on stabilization after a pullback near 1400–1408; for short sellers, if there’s sluggish price action near 1450–1465, try a small-sized short to bet on a pullback.
Xinye’s personal view: The strength of this rebound really exceeds expectations. Yesterday’s low at 1173 is very likely the short-term bottom, and today’s big bullish candle confirms the reversal signal.
My thinking is clear: the main idea is to buy the dip near 1400. If it first rushes to 1450–1465, you can try a small-sized short to bet on a pullback.
#2026足球风潮 #长鑫科技IPO定价8.66元估值5791亿元
$SKHYNIX Hynix violent rebound 16%! It went straight from 1173 to 1445—short sellers got wiped out, leaving nothing! This big bullish candle has appeared; short sellers must back down!
Brothers, this rebound is too fierce! Yesterday SK Hynix was smashed to the low at 1173.24; today it surged with a single big bullish candle to a high of 1445.96. The current price is 1422.65, a daily jump of 16.45%! The brothers who bought the dip finally can hold their heads high—short sellers probably are already crying for help.
A key technical reversal signal has emerged! MA(7) at 1400 has turned upward; price is above all short-term moving averages. MA(25) at 1334 has also started to flatten—this is a textbook bottom reversal pattern.
The long positions suggested by Xinye around 1211 yesterday are now up to a high of 1445 today, a gain of a full 230 points. Brothers who followed the rhythm have already had their fill!
Xinye’s bidirectional trading suggestions:
Go long on stabilization after a pullback near 1400–1408; for short sellers, if there’s sluggish price action near 1450–1465, try a small-sized short to bet on a pullback.
Xinye’s personal view: The strength of this rebound really exceeds expectations. Yesterday’s low at 1173 is very likely the short-term bottom, and today’s big bullish candle confirms the reversal signal.
My thinking is clear: the main idea is to buy the dip near 1400. If it first rushes to 1450–1465, you can try a small-sized short to bet on a pullback.
#2026足球风潮 #长鑫科技IPO定价8.66元估值5791亿元
Brothers, this rebound is too fierce! Yesterday SK Hynix was smashed to the low at 1173.24; today it surged with a single big bullish candle to a high of 1445.96. The current price is 1422.65, a daily jump of 16.45%! The brothers who bought the dip finally can hold their heads high—short sellers probably are already crying for help.
A key technical reversal signal has emerged! MA(7) at 1400 has turned upward; price is above all short-term moving averages. MA(25) at 1334 has also started to flatten—this is a textbook bottom reversal pattern.
The long positions suggested by Xinye around 1211 yesterday are now up to a high of 1445 today, a gain of a full 230 points. Brothers who followed the rhythm have already had their fill!
Xinye’s bidirectional trading suggestions:
Go long on stabilization after a pullback near 1400–1408; for short sellers, if there’s sluggish price action near 1450–1465, try a small-sized short to bet on a pullback.
Xinye’s personal view: The strength of this rebound really exceeds expectations. Yesterday’s low at 1173 is very likely the short-term bottom, and today’s big bullish candle confirms the reversal signal.
My thinking is clear: the main idea is to buy the dip near 1400. If it first rushes to 1450–1465, you can try a small-sized short to bet on a pullback.
#2026足球风潮 #长鑫科技IPO定价8.66元估值5791亿元
719
·
--
Bearish
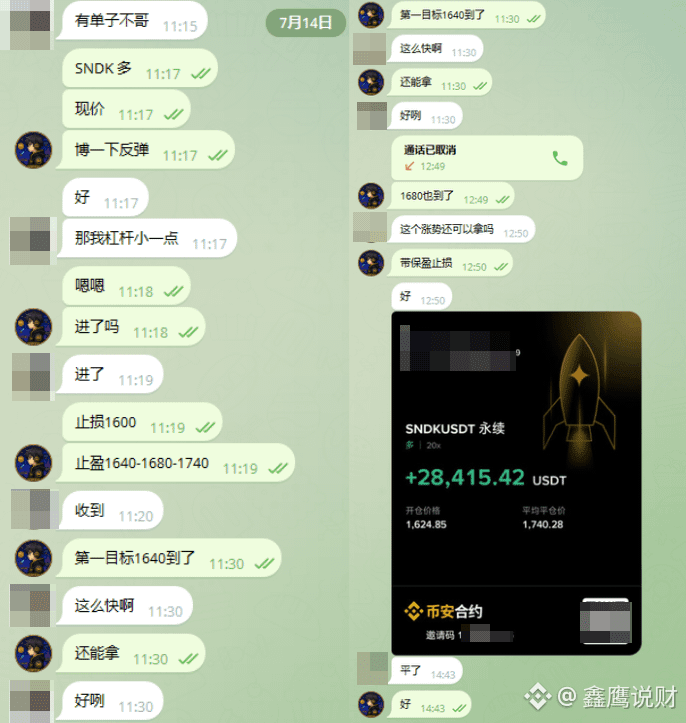
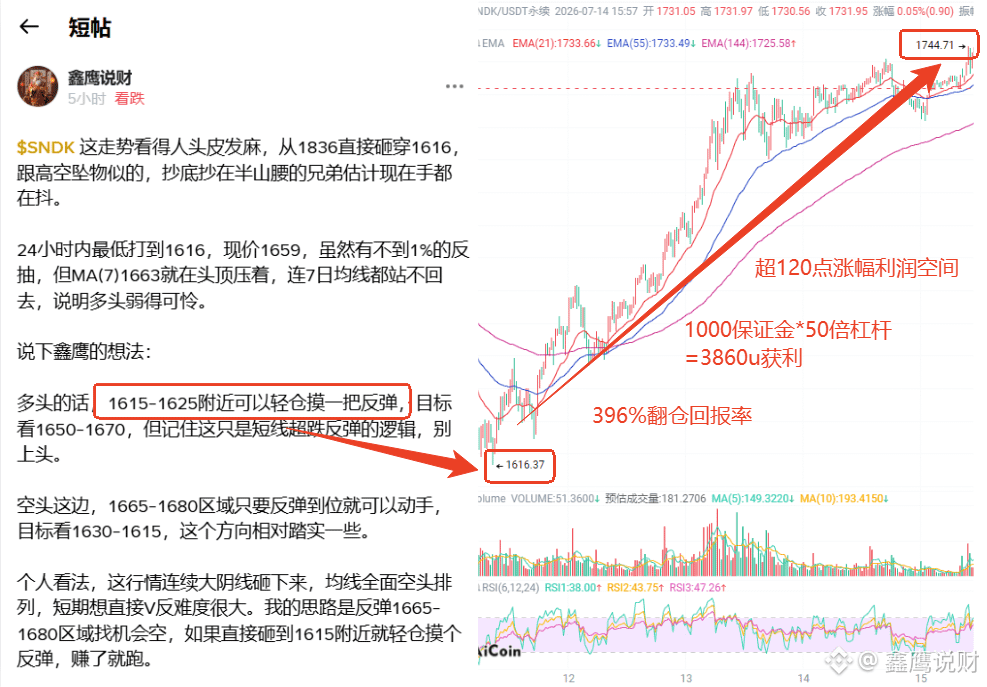
$SNDK Just say how you eagles, this rebound was how good?? It topped out at 1785, with a gain of nearly 170 points—there’s plenty of profit potential space. Even though I didn’t catch that many points, a 100-point rebound still put the profits right into my hands!!
#韩国KOSPI盘中V型反转 #韩国KOSPI盘中V型反转
$SNDK Just say how you eagles, this rebound was how good?? It topped out at 1785, with a gain of nearly 170 points—there’s plenty of profit potential space. Even though I didn’t catch that many points, a 100-point rebound still put the profits right into my hands!!
#韩国KOSPI盘中V型反转 #韩国KOSPI盘中V型反转
#韩国KOSPI盘中V型反转 #韩国KOSPI盘中V型反转
鑫鹰说财
·
--
Bearish$SNDK This trend is so terrifying it makes your scalp tingle. It was crushed straight through from 1836 down to 1616—like a falling object from the sky. The brothers who caught the bottom halfway up the hill probably have hands that are still trembling now.
Within 24 hours, it hit a low of 1616; current price is 1659. Although there’s less than a 1% rebound, MA(7) at 1663 is right overhead pressing down. Even the 7-day moving average can’t get back above it, which shows the bulls are extremely weak.
Let me share Xinying’s thoughts:
For the bulls: around 1615-1625 you can take a small position to try a rebound. The target is 1650-1670, but remember—this is only the logic of a short-term oversold bounce. Don’t get carried away.
For the bears: in the 1665-1680 area, as long as the rebound comes up properly, you can take action. The target is 1630-1615. This direction is relatively steadier.
My personal take: with this market continuing to drop with consecutive long bearish candles and the moving averages fully arranged bearishly, it will be very hard to get a clean V-shaped reversal in the short term. My plan is to look for opportunities to short in the 1665-1680 rebound zone. If it directly drops to around 1615, then take a light position to catch a rebound—make a profit and get out.
#币安九周年 #科技股拖累美股走低
Within 24 hours, it hit a low of 1616; current price is 1659. Although there’s less than a 1% rebound, MA(7) at 1663 is right overhead pressing down. Even the 7-day moving average can’t get back above it, which shows the bulls are extremely weak.
Let me share Xinying’s thoughts:
For the bulls: around 1615-1625 you can take a small position to try a rebound. The target is 1650-1670, but remember—this is only the logic of a short-term oversold bounce. Don’t get carried away.
For the bears: in the 1665-1680 area, as long as the rebound comes up properly, you can take action. The target is 1630-1615. This direction is relatively steadier.
My personal take: with this market continuing to drop with consecutive long bearish candles and the moving averages fully arranged bearishly, it will be very hard to get a clean V-shaped reversal in the short term. My plan is to look for opportunities to short in the 1665-1680 rebound zone. If it directly drops to around 1615, then take a light position to catch a rebound—make a profit and get out.
#币安九周年 #科技股拖累美股走低
477
·
--
Bearish
CPI nuclear bomb goes off the eve! $BTC holds the line at 62,000, while $ETH strengthens against the trend—at 8:30 tonight, will it rocket higher or crash? The direction is coming out now!
Brothers, the CPI release countdown is on!
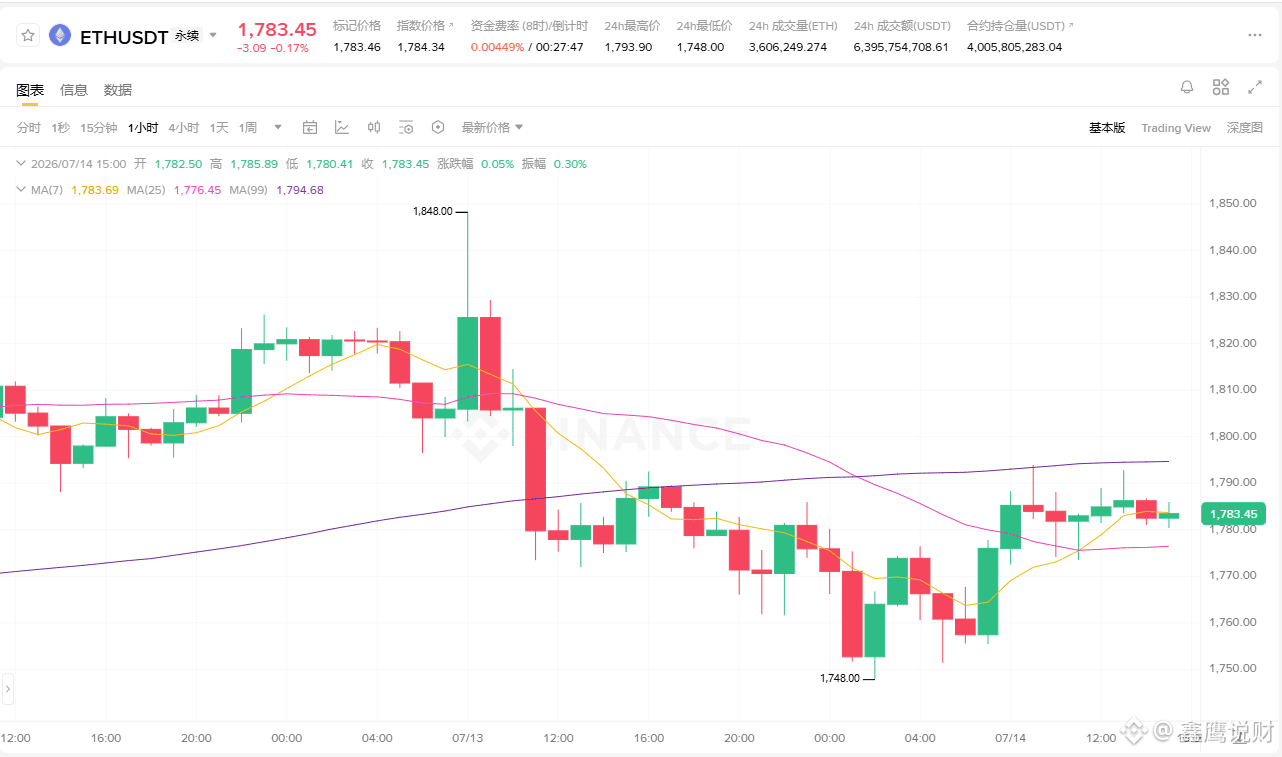
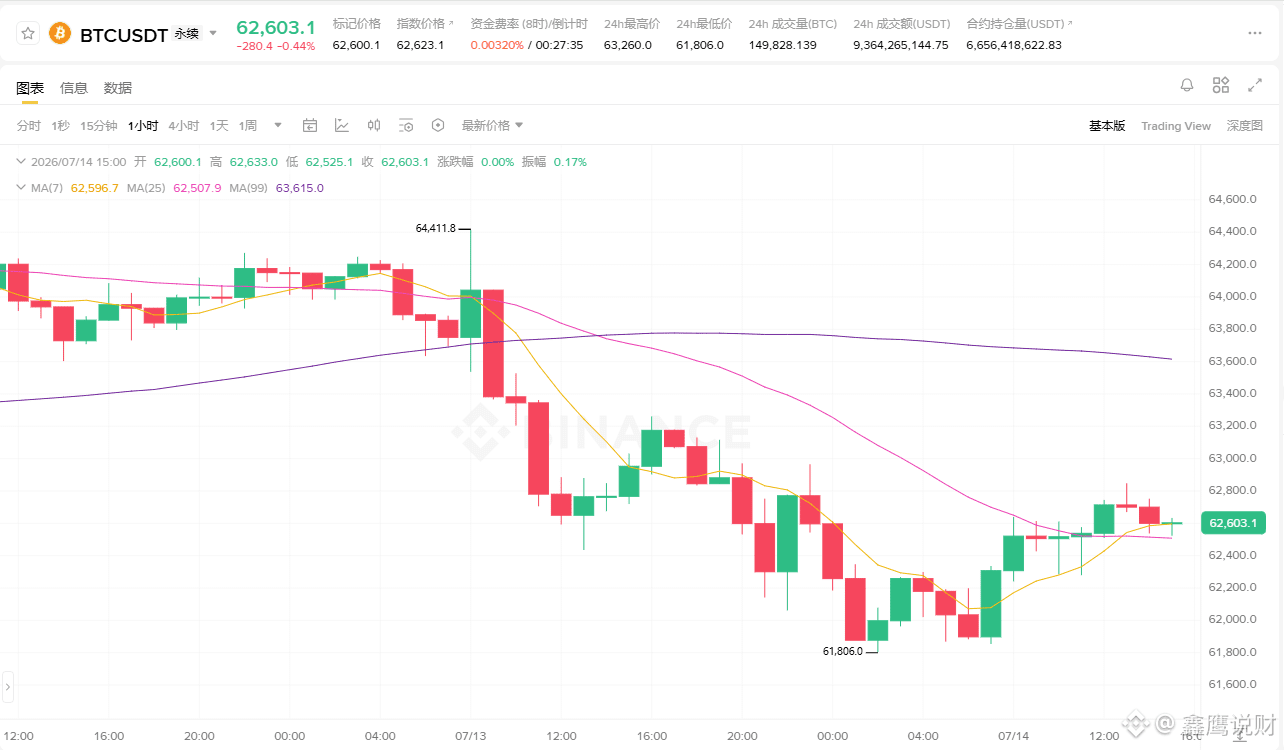
BTC is ranging narrowly between 61,806–63,260, current price 62,578, with less than a 1,500-point move; ETH is relatively strong, at 1,783, already above MA(7) and MA(25). The 24h low of 1,748 hasn’t been broken—clearly more resilient than BTC. This suggests capital is betting on a CPI upside surprise!
But Wall Street has started issuing warnings! Overall CPI could “cool off” temporarily due to falling oil prices, but core inflation is what really matters. Even more alarming: the bond market has already priced in a surge in the probability of a July rate hike to 50%, and the 2-year U.S. Treasury yield is holding above 4.25%. If core CPI comes in hotter than expected, the market could collapse directly!
Xingying’s bidirectional trading plan:
BTC: Buy on pullbacks at 61,300–60,300; short near 63,500–64,000
ETH: Buy after the pullback stabilizes near 1,710–1,690; place shorts near 1,790–1,810
CPI release may cause sudden swings—don’t bet the data with a heavy position, and don’t “hold on” through it. Suggested approach: stay in cash and wait until the direction becomes clear before entering!
Brothers, for tonight’s CPI, do you think it will be good or bad news?
#币安九周年 #长鑫存储据悉7月27日上交所上市
CPI nuclear bomb goes off the eve! $BTC holds the line at 62,000, while $ETH strengthens against the trend—at 8:30 tonight, will it rocket higher or crash? The direction is coming out now!
Brothers, the CPI release countdown is on!
BTC is ranging narrowly between 61,806–63,260, current price 62,578, with less than a 1,500-point move; ETH is relatively strong, at 1,783, already above MA(7) and MA(25). The 24h low of 1,748 hasn’t been broken—clearly more resilient than BTC. This suggests capital is betting on a CPI upside surprise!
But Wall Street has started issuing warnings! Overall CPI could “cool off” temporarily due to falling oil prices, but core inflation is what really matters. Even more alarming: the bond market has already priced in a surge in the probability of a July rate hike to 50%, and the 2-year U.S. Treasury yield is holding above 4.25%. If core CPI comes in hotter than expected, the market could collapse directly!
Xingying’s bidirectional trading plan:
BTC: Buy on pullbacks at 61,300–60,300; short near 63,500–64,000
ETH: Buy after the pullback stabilizes near 1,710–1,690; place shorts near 1,790–1,810
CPI release may cause sudden swings—don’t bet the data with a heavy position, and don’t “hold on” through it. Suggested approach: stay in cash and wait until the direction becomes clear before entering!
Brothers, for tonight’s CPI, do you think it will be good or bad news?
#币安九周年 #长鑫存储据悉7月27日上交所上市
Brothers, the CPI release countdown is on!
BTC is ranging narrowly between 61,806–63,260, current price 62,578, with less than a 1,500-point move; ETH is relatively strong, at 1,783, already above MA(7) and MA(25). The 24h low of 1,748 hasn’t been broken—clearly more resilient than BTC. This suggests capital is betting on a CPI upside surprise!
But Wall Street has started issuing warnings! Overall CPI could “cool off” temporarily due to falling oil prices, but core inflation is what really matters. Even more alarming: the bond market has already priced in a surge in the probability of a July rate hike to 50%, and the 2-year U.S. Treasury yield is holding above 4.25%. If core CPI comes in hotter than expected, the market could collapse directly!
Xingying’s bidirectional trading plan:
BTC: Buy on pullbacks at 61,300–60,300; short near 63,500–64,000
ETH: Buy after the pullback stabilizes near 1,710–1,690; place shorts near 1,790–1,810
CPI release may cause sudden swings—don’t bet the data with a heavy position, and don’t “hold on” through it. Suggested approach: stay in cash and wait until the direction becomes clear before entering!
Brothers, for tonight’s CPI, do you think it will be good or bad news?
#币安九周年 #长鑫存储据悉7月27日上交所上市
227
·
--
Bearish
CPI nuclear bomb about to detonate! At 8:30 tonight the market will change—whether the Fed raises rates or cuts them all depends on this set of numbers. All brothers, keep your eyes on the screen!
Brothers, something big is coming tonight!
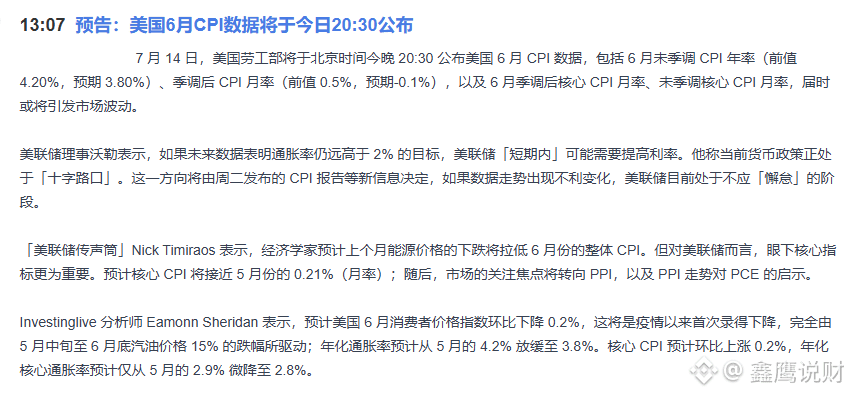
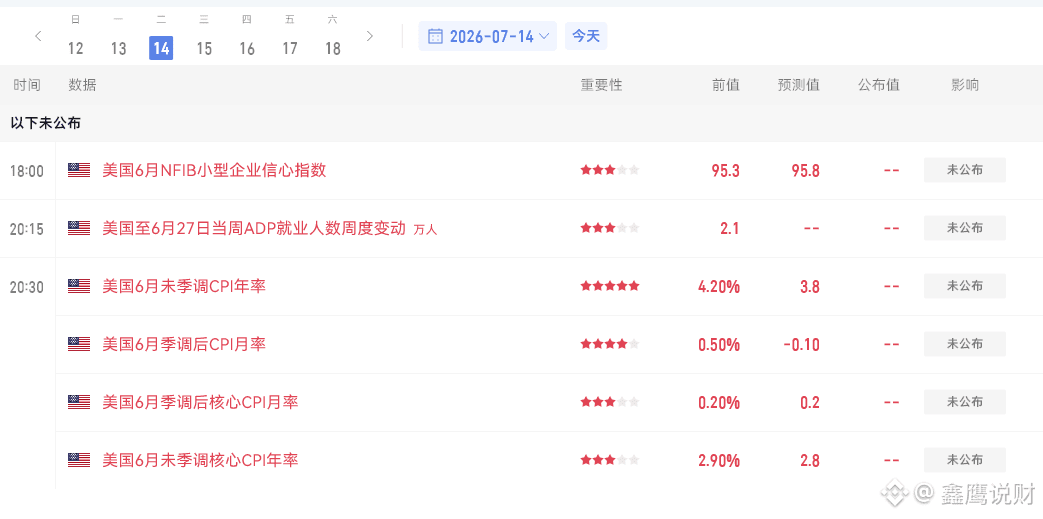
At 20:30 Beijing time, the U.S. June CPI data will be released. This is the most heavyweight “nuclear bomb”-level event for global markets this week!
First, look at the forecast: Headline CPI year-over-year—previous 4.2%, expected 3.8%; month-over-month—previous 0.5%, expected -0.1%. This is the first time the forecast turns negative since the pandemic! Core CPI month-over-month expected at 0.2%, basically in line with the prior 0.21%.
There are two key takeaways:
First, last month’s oil price plunge of 15% will drag down headline CPI, but core inflation is what the Fed truly cares about;
Second, Fed Governor Waller has already said—if the data is not ideal, “it may mean that the Fed could raise rates in the short term”! Two-year Treasury yields have already surged to 4.24%, and the market is already pricing in a rate hike in September!
If core CPI comes in below 0.2%, the market may interpret it as inflation cooling, and risk assets could bounce for a round; if it beats expectations, then the “rate-hike boot” will come crashing down.
Personally, I’m inclined not to take heavy positions before the data is released. I’ll look for direction after it lands. Brothers, tonight “Eagle Brother” will interact with everyone in real time in the comments section!
#币安九周年 #美股美债齐跌 $BTC $CL $XAU
CPI nuclear bomb about to detonate! At 8:30 tonight the market will change—whether the Fed raises rates or cuts them all depends on this set of numbers. All brothers, keep your eyes on the screen!
Brothers, something big is coming tonight!
At 20:30 Beijing time, the U.S. June CPI data will be released. This is the most heavyweight “nuclear bomb”-level event for global markets this week!
First, look at the forecast: Headline CPI year-over-year—previous 4.2%, expected 3.8%; month-over-month—previous 0.5%, expected -0.1%. This is the first time the forecast turns negative since the pandemic! Core CPI month-over-month expected at 0.2%, basically in line with the prior 0.21%.
There are two key takeaways:
First, last month’s oil price plunge of 15% will drag down headline CPI, but core inflation is what the Fed truly cares about;
Second, Fed Governor Waller has already said—if the data is not ideal, “it may mean that the Fed could raise rates in the short term”! Two-year Treasury yields have already surged to 4.24%, and the market is already pricing in a rate hike in September!
If core CPI comes in below 0.2%, the market may interpret it as inflation cooling, and risk assets could bounce for a round; if it beats expectations, then the “rate-hike boot” will come crashing down.
Personally, I’m inclined not to take heavy positions before the data is released. I’ll look for direction after it lands. Brothers, tonight “Eagle Brother” will interact with everyone in real time in the comments section!
#币安九周年 #美股美债齐跌 $BTC $CL $XAU
Brothers, something big is coming tonight!
At 20:30 Beijing time, the U.S. June CPI data will be released. This is the most heavyweight “nuclear bomb”-level event for global markets this week!
First, look at the forecast: Headline CPI year-over-year—previous 4.2%, expected 3.8%; month-over-month—previous 0.5%, expected -0.1%. This is the first time the forecast turns negative since the pandemic! Core CPI month-over-month expected at 0.2%, basically in line with the prior 0.21%.
There are two key takeaways:
First, last month’s oil price plunge of 15% will drag down headline CPI, but core inflation is what the Fed truly cares about;
Second, Fed Governor Waller has already said—if the data is not ideal, “it may mean that the Fed could raise rates in the short term”! Two-year Treasury yields have already surged to 4.24%, and the market is already pricing in a rate hike in September!
If core CPI comes in below 0.2%, the market may interpret it as inflation cooling, and risk assets could bounce for a round; if it beats expectations, then the “rate-hike boot” will come crashing down.
Personally, I’m inclined not to take heavy positions before the data is released. I’ll look for direction after it lands. Brothers, tonight “Eagle Brother” will interact with everyone in real time in the comments section!
#币安九周年 #美股美债齐跌 $BTC $CL $XAU
1
286
·
--
Bearish
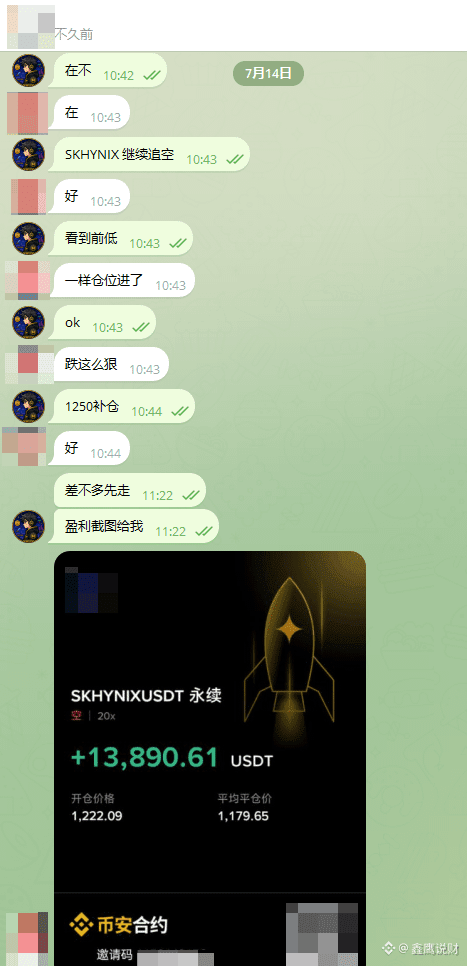
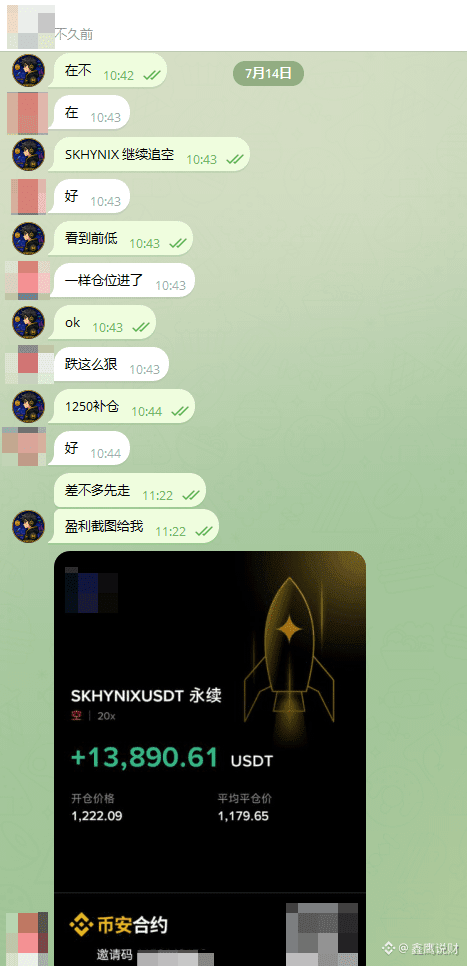
$SKHYNIX half an hour and more to harvest 13,000U—strict execution is the result: you get to eat meat!!
While you’re still hesitating whether to get in, others have already executed it properly. XinYing helps you keep watching the market in real time the whole way—what are you still worried about?? If you have another chance, keep going. In the short term it won’t be able to go up; follow XinYing and keep eating the big meat!!
#币安九周年 #科技股拖累美股走低
$SKHYNIX half an hour and more to harvest 13,000U—strict execution is the result: you get to eat meat!!
While you’re still hesitating whether to get in, others have already executed it properly. XinYing helps you keep watching the market in real time the whole way—what are you still worried about?? If you have another chance, keep going. In the short term it won’t be able to go up; follow XinYing and keep eating the big meat!!
#币安九周年 #科技股拖累美股走低
While you’re still hesitating whether to get in, others have already executed it properly. XinYing helps you keep watching the market in real time the whole way—what are you still worried about?? If you have another chance, keep going. In the short term it won’t be able to go up; follow XinYing and keep eating the big meat!!
#币安九周年 #科技股拖累美股走低
鑫鹰说财
·
--
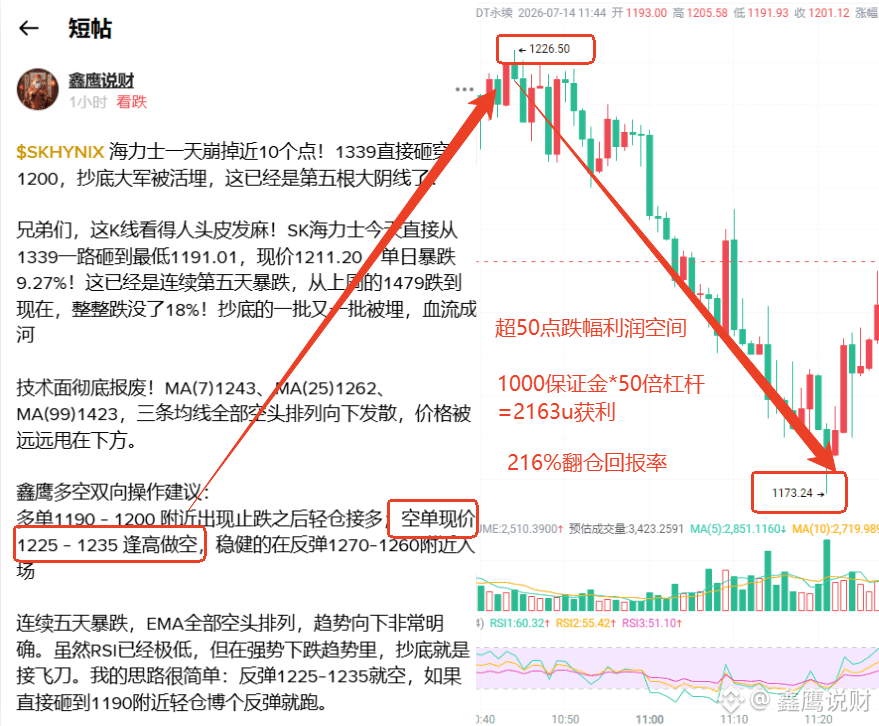
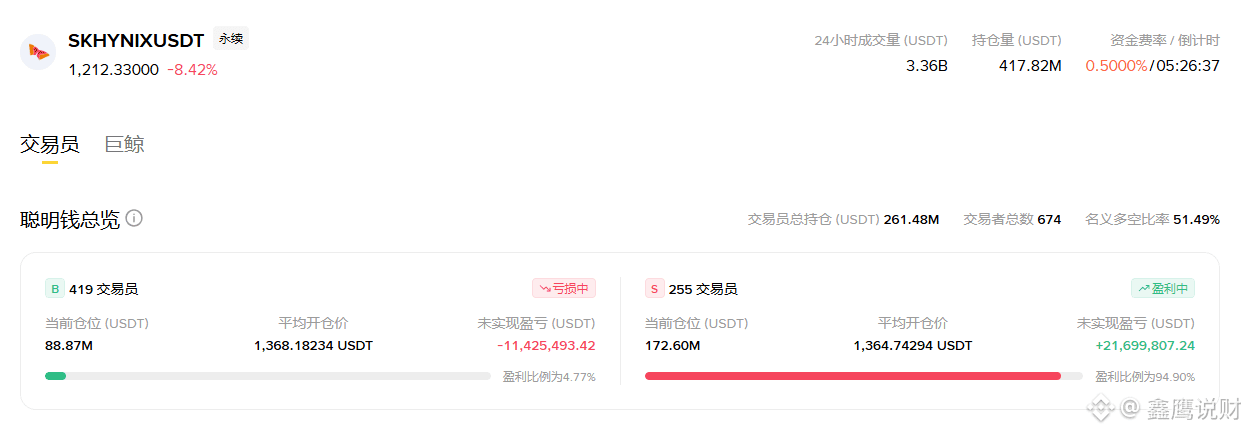
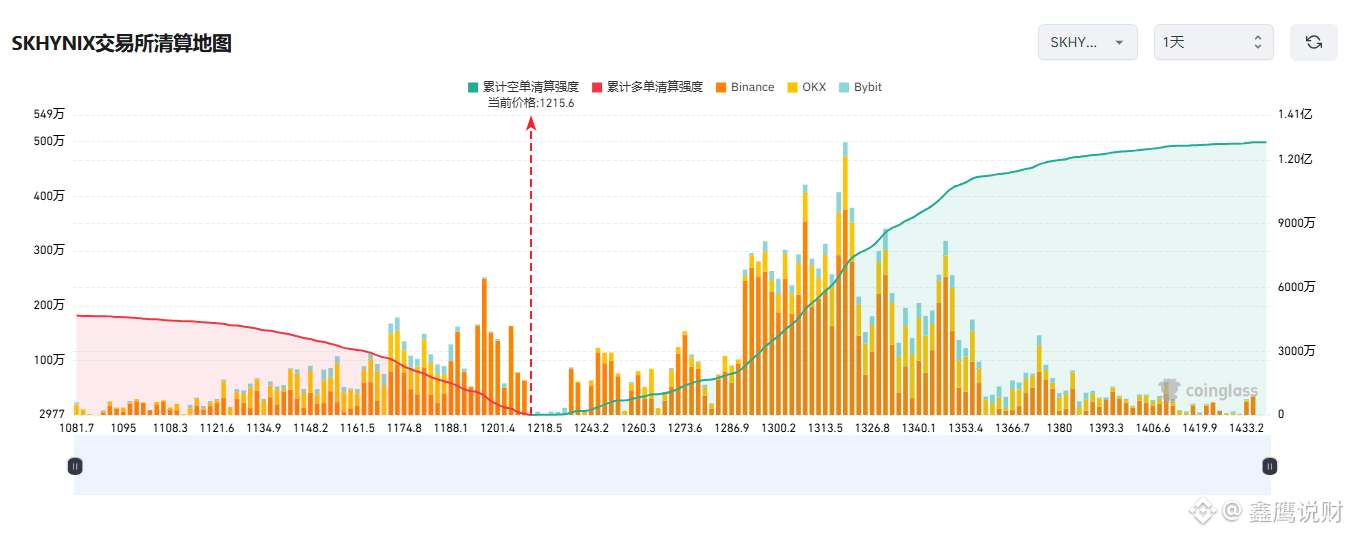
Bearish$SKHYNIX Hynix’s day collapses by nearly 10 points! 1339 directly smashes through 1200— the bargain-hunters got buried alive. This is already the fifth consecutive huge bearish candle!
Brothers, this candlestick chart is giving people chills! SK Hynix today directly dropped from 1339 all the way to the low of 1191.01. Current price is 1211.20, with a one-day plunge of 9.27%! This is already the fifth straight day of decline. From last week’s 1479 to now—down a full 18%!
Batches of would-be buyers are getting buried one after another—blood everywhere.
The technicals are completely wrecked! MA(7) 1243, MA(25) 1262, MA(99) 1423— all three moving averages are in a bearish alignment, spreading downward. Price has been left far below.
Xinying’s long/short two-way trading plan:
For longs: after a potential stop-the-fall near 1190–1200, cautiously start buying with small size.
For shorts: at the current price around 1225–1235, short on rallies; more conservative entries should be around 1270–1260.
Five straight days of selloff— all EMAs are bearish and aligned downward, with the trend clearly heading lower. Although the RSI is already extremely low, in a strong downtrend, catching the bottom is catching a falling knife. My thinking is very simple: short a rebound at 1225–1235; if it directly drops to around 1190, take a small-size gamble on a rebound and then exit.
#币安九周年 #比特币计划eCash硬分叉
Brothers, this candlestick chart is giving people chills! SK Hynix today directly dropped from 1339 all the way to the low of 1191.01. Current price is 1211.20, with a one-day plunge of 9.27%! This is already the fifth straight day of decline. From last week’s 1479 to now—down a full 18%!
Batches of would-be buyers are getting buried one after another—blood everywhere.
The technicals are completely wrecked! MA(7) 1243, MA(25) 1262, MA(99) 1423— all three moving averages are in a bearish alignment, spreading downward. Price has been left far below.
Xinying’s long/short two-way trading plan:
For longs: after a potential stop-the-fall near 1190–1200, cautiously start buying with small size.
For shorts: at the current price around 1225–1235, short on rallies; more conservative entries should be around 1270–1260.
Five straight days of selloff— all EMAs are bearish and aligned downward, with the trend clearly heading lower. Although the RSI is already extremely low, in a strong downtrend, catching the bottom is catching a falling knife. My thinking is very simple: short a rebound at 1225–1235; if it directly drops to around 1190, take a small-size gamble on a rebound and then exit.
#币安九周年 #比特币计划eCash硬分叉
281
·
--
Bearish
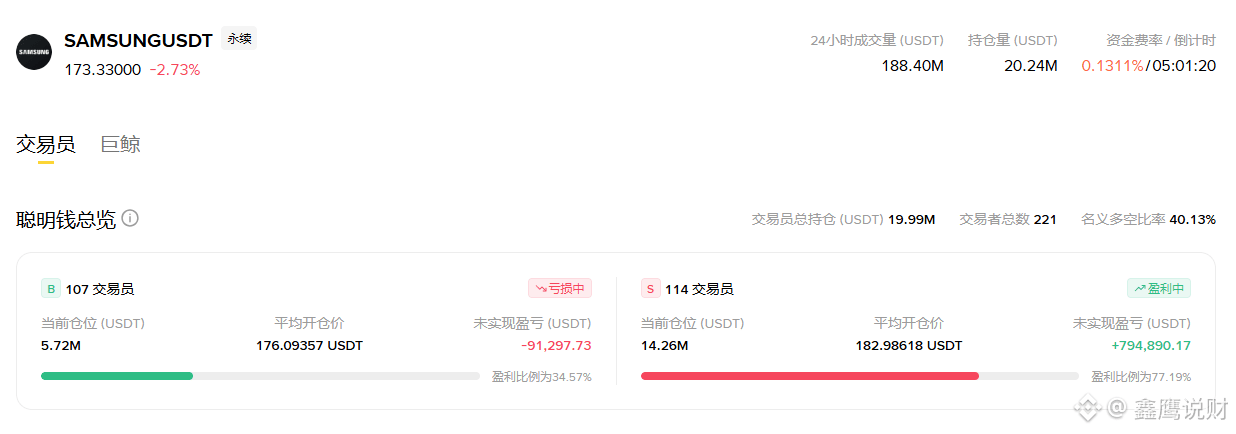
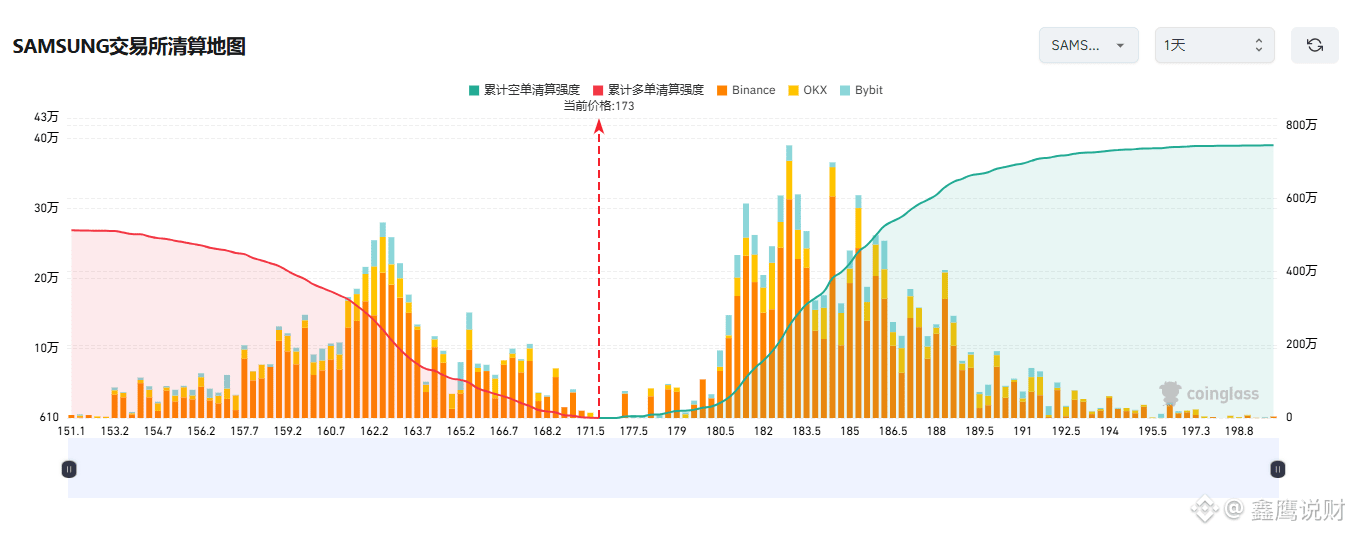
$SAMSUNG 刚刚跌破173!从181狂泻至162,多头正在被活活耗死,162守不住就是无底洞!
Brothers, Samsung’s needle today is too brutal! It was directly smashed in a straight line from 181.39 down to 162.75. Current price: 173.23, with a day range amplitude of nearly 4%! From the prior high of 194 to now, it’s already down 11%—basically wiped out.
The technical picture has already turned completely ugly. MA(7) at 173.25 is barely holding, but MA(25) at 173.89 has already started to turn downward. MA(99) at 186.78 is way up there, and price is being tightly suppressed.
Xinying dual-direction trading plan:
For longs: place orders near 162–165 with light exposure as the price is poked lower; for shorts: on a rebound around 178–177, open shorts when prices are higher—aggressive traders can enter short positions near the current price around 174.
Samsung’s chart is as miserable as other semiconductor stocks. With MA(99) at 186 and far away from the current price, it indicates the medium-term trend has already flipped bearish.
Brothers, for this move in Samsung—do you think you can hold 162, or will it run to 150?
#币安九周年 #科技股拖累美股走低
$SAMSUNG 刚刚跌破173!从181狂泻至162,多头正在被活活耗死,162守不住就是无底洞!
Brothers, Samsung’s needle today is too brutal! It was directly smashed in a straight line from 181.39 down to 162.75. Current price: 173.23, with a day range amplitude of nearly 4%! From the prior high of 194 to now, it’s already down 11%—basically wiped out.
The technical picture has already turned completely ugly. MA(7) at 173.25 is barely holding, but MA(25) at 173.89 has already started to turn downward. MA(99) at 186.78 is way up there, and price is being tightly suppressed.
Xinying dual-direction trading plan:
For longs: place orders near 162–165 with light exposure as the price is poked lower; for shorts: on a rebound around 178–177, open shorts when prices are higher—aggressive traders can enter short positions near the current price around 174.
Samsung’s chart is as miserable as other semiconductor stocks. With MA(99) at 186 and far away from the current price, it indicates the medium-term trend has already flipped bearish.
Brothers, for this move in Samsung—do you think you can hold 162, or will it run to 150?
#币安九周年 #科技股拖累美股走低
Brothers, Samsung’s needle today is too brutal! It was directly smashed in a straight line from 181.39 down to 162.75. Current price: 173.23, with a day range amplitude of nearly 4%! From the prior high of 194 to now, it’s already down 11%—basically wiped out.
The technical picture has already turned completely ugly. MA(7) at 173.25 is barely holding, but MA(25) at 173.89 has already started to turn downward. MA(99) at 186.78 is way up there, and price is being tightly suppressed.
Xinying dual-direction trading plan:
For longs: place orders near 162–165 with light exposure as the price is poked lower; for shorts: on a rebound around 178–177, open shorts when prices are higher—aggressive traders can enter short positions near the current price around 174.
Samsung’s chart is as miserable as other semiconductor stocks. With MA(99) at 186 and far away from the current price, it indicates the medium-term trend has already flipped bearish.
Brothers, for this move in Samsung—do you think you can hold 162, or will it run to 150?
#币安九周年 #科技股拖累美股走低
252
·
--
Bearish
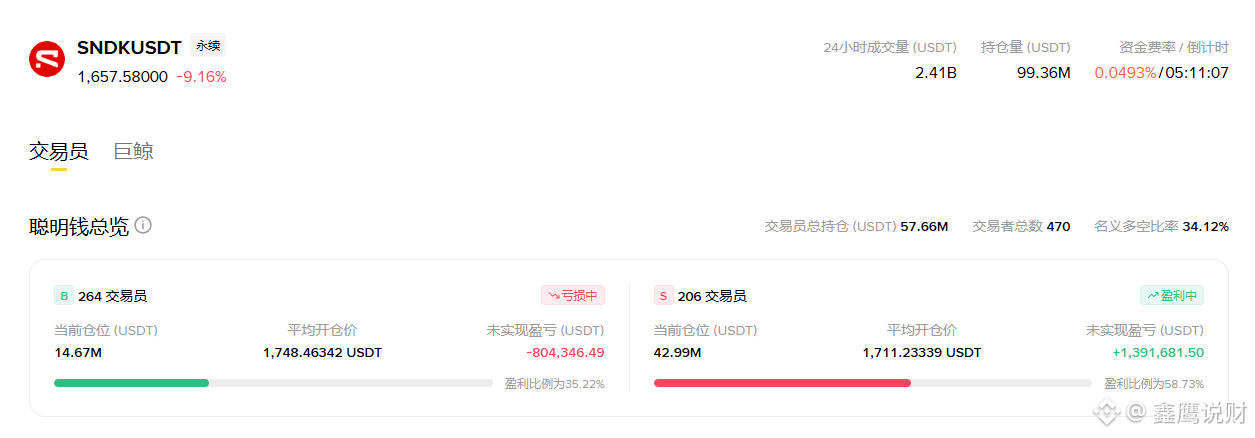
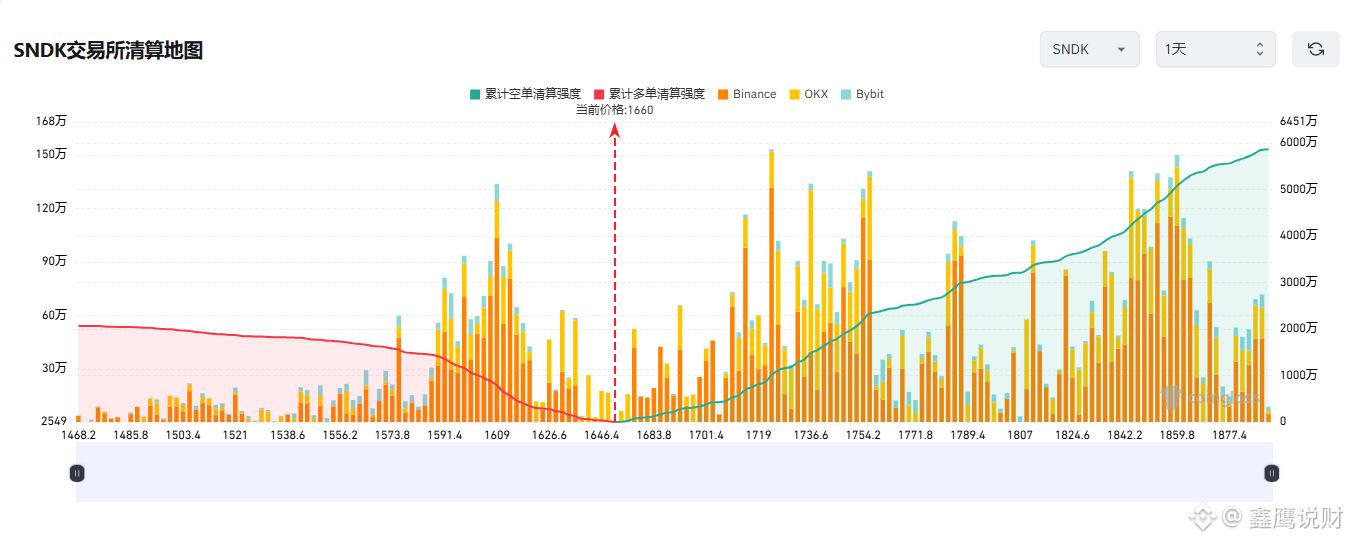
$SNDK This trend is so terrifying it makes your scalp tingle. It was crushed straight through from 1836 down to 1616—like a falling object from the sky. The brothers who caught the bottom halfway up the hill probably have hands that are still trembling now.
Within 24 hours, it hit a low of 1616; current price is 1659. Although there’s less than a 1% rebound, MA(7) at 1663 is right overhead pressing down. Even the 7-day moving average can’t get back above it, which shows the bulls are extremely weak.
Let me share Xinying’s thoughts:
For the bulls: around 1615-1625 you can take a small position to try a rebound. The target is 1650-1670, but remember—this is only the logic of a short-term oversold bounce. Don’t get carried away.
For the bears: in the 1665-1680 area, as long as the rebound comes up properly, you can take action. The target is 1630-1615. This direction is relatively steadier.
My personal take: with this market continuing to drop with consecutive long bearish candles and the moving averages fully arranged bearishly, it will be very hard to get a clean V-shaped reversal in the short term. My plan is to look for opportunities to short in the 1665-1680 rebound zone. If it directly drops to around 1615, then take a light position to catch a rebound—make a profit and get out.
#币安九周年 #科技股拖累美股走低
$SNDK This trend is so terrifying it makes your scalp tingle. It was crushed straight through from 1836 down to 1616—like a falling object from the sky. The brothers who caught the bottom halfway up the hill probably have hands that are still trembling now.
Within 24 hours, it hit a low of 1616; current price is 1659. Although there’s less than a 1% rebound, MA(7) at 1663 is right overhead pressing down. Even the 7-day moving average can’t get back above it, which shows the bulls are extremely weak.
Let me share Xinying’s thoughts:
For the bulls: around 1615-1625 you can take a small position to try a rebound. The target is 1650-1670, but remember—this is only the logic of a short-term oversold bounce. Don’t get carried away.
For the bears: in the 1665-1680 area, as long as the rebound comes up properly, you can take action. The target is 1630-1615. This direction is relatively steadier.
My personal take: with this market continuing to drop with consecutive long bearish candles and the moving averages fully arranged bearishly, it will be very hard to get a clean V-shaped reversal in the short term. My plan is to look for opportunities to short in the 1665-1680 rebound zone. If it directly drops to around 1615, then take a light position to catch a rebound—make a profit and get out.
#币安九周年 #科技股拖累美股走低
Within 24 hours, it hit a low of 1616; current price is 1659. Although there’s less than a 1% rebound, MA(7) at 1663 is right overhead pressing down. Even the 7-day moving average can’t get back above it, which shows the bulls are extremely weak.
Let me share Xinying’s thoughts:
For the bulls: around 1615-1625 you can take a small position to try a rebound. The target is 1650-1670, but remember—this is only the logic of a short-term oversold bounce. Don’t get carried away.
For the bears: in the 1665-1680 area, as long as the rebound comes up properly, you can take action. The target is 1630-1615. This direction is relatively steadier.
My personal take: with this market continuing to drop with consecutive long bearish candles and the moving averages fully arranged bearishly, it will be very hard to get a clean V-shaped reversal in the short term. My plan is to look for opportunities to short in the 1665-1680 rebound zone. If it directly drops to around 1615, then take a light position to catch a rebound—make a profit and get out.
#币安九周年 #科技股拖累美股走低
1
491
·
--
Bearish
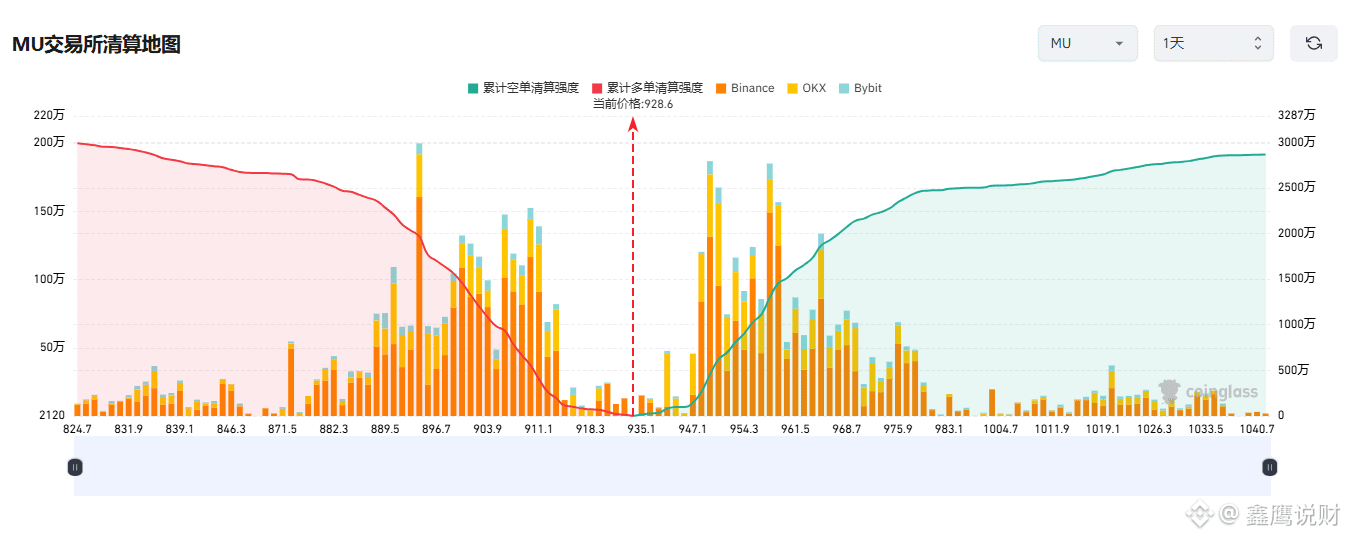
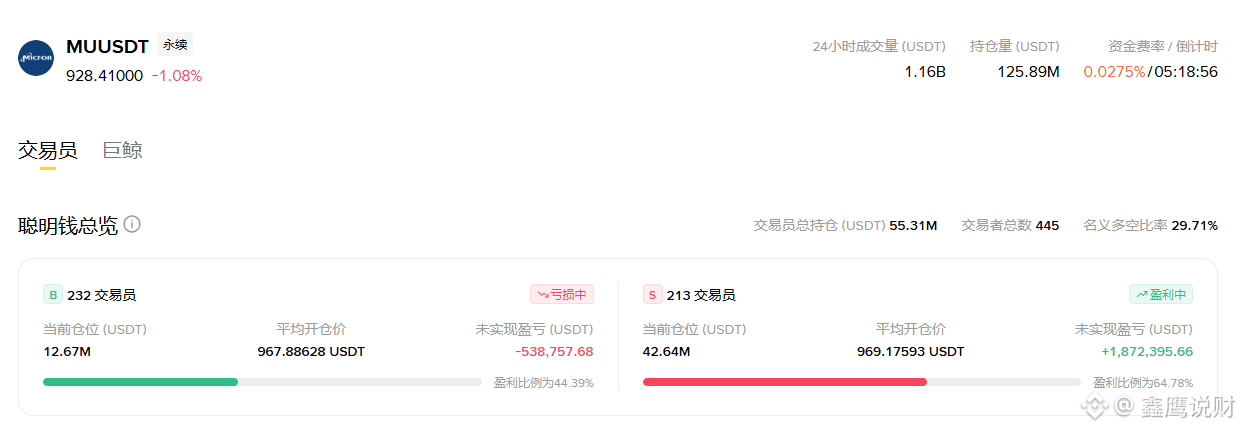
$MU touched the 900 mark again! From 989 crashing down to 903, the dip-buying crowd got wiped out—this is where the nightmare begins!
Brothers, MU has been slaughtered again today! It hit a low of 903.55; the current price is 919.25, down another 2.13% intraday! From last week’s 989 down to now—over just a few days, 8.7% has been wiped out!
Technicals are completely broken across the board! All three moving averages have spread downward; price is being tightly suppressed—classic bearish alignment. The bulls are still stubbornly holding on; once the bulls get trampled, MU will accelerate its decline. Right now, the only support is the 900 psychological level.
Xinying long/short trading suggestions:
Longs: 900–895, try a light long position after a rebound/stop of the selloff;
Shorts: on rebounds around 930–940, continue shorting near the highs.
A continuous plunge, bearish moving-average alignment, and the funding rate still this high—this shows the bulls are hard-pressing. Once 900 breaks, it’s going to be a bottomless pit. My plan is very clear: short the rebound at 930–940. If it directly smashes down to 900, I’ll take a light position to bet on a bounce and run.
#币安九周年 #科技股拖累美股走低
$MU touched the 900 mark again! From 989 crashing down to 903, the dip-buying crowd got wiped out—this is where the nightmare begins!
Brothers, MU has been slaughtered again today! It hit a low of 903.55; the current price is 919.25, down another 2.13% intraday! From last week’s 989 down to now—over just a few days, 8.7% has been wiped out!
Technicals are completely broken across the board! All three moving averages have spread downward; price is being tightly suppressed—classic bearish alignment. The bulls are still stubbornly holding on; once the bulls get trampled, MU will accelerate its decline. Right now, the only support is the 900 psychological level.
Xinying long/short trading suggestions:
Longs: 900–895, try a light long position after a rebound/stop of the selloff;
Shorts: on rebounds around 930–940, continue shorting near the highs.
A continuous plunge, bearish moving-average alignment, and the funding rate still this high—this shows the bulls are hard-pressing. Once 900 breaks, it’s going to be a bottomless pit. My plan is very clear: short the rebound at 930–940. If it directly smashes down to 900, I’ll take a light position to bet on a bounce and run.
#币安九周年 #科技股拖累美股走低
Brothers, MU has been slaughtered again today! It hit a low of 903.55; the current price is 919.25, down another 2.13% intraday! From last week’s 989 down to now—over just a few days, 8.7% has been wiped out!
Technicals are completely broken across the board! All three moving averages have spread downward; price is being tightly suppressed—classic bearish alignment. The bulls are still stubbornly holding on; once the bulls get trampled, MU will accelerate its decline. Right now, the only support is the 900 psychological level.
Xinying long/short trading suggestions:
Longs: 900–895, try a light long position after a rebound/stop of the selloff;
Shorts: on rebounds around 930–940, continue shorting near the highs.
A continuous plunge, bearish moving-average alignment, and the funding rate still this high—this shows the bulls are hard-pressing. Once 900 breaks, it’s going to be a bottomless pit. My plan is very clear: short the rebound at 930–940. If it directly smashes down to 900, I’ll take a light position to bet on a bounce and run.
#币安九周年 #科技股拖累美股走低
429
·
--
Bearish
$SKHYNIX Hynix’s day collapses by nearly 10 points! 1339 directly smashes through 1200— the bargain-hunters got buried alive. This is already the fifth consecutive huge bearish candle!
Brothers, this candlestick chart is giving people chills! SK Hynix today directly dropped from 1339 all the way to the low of 1191.01. Current price is 1211.20, with a one-day plunge of 9.27%! This is already the fifth straight day of decline. From last week’s 1479 to now—down a full 18%!
Batches of would-be buyers are getting buried one after another—blood everywhere.
The technicals are completely wrecked! MA(7) 1243, MA(25) 1262, MA(99) 1423— all three moving averages are in a bearish alignment, spreading downward. Price has been left far below.
Xinying’s long/short two-way trading plan:
For longs: after a potential stop-the-fall near 1190–1200, cautiously start buying with small size.
For shorts: at the current price around 1225–1235, short on rallies; more conservative entries should be around 1270–1260.
Five straight days of selloff— all EMAs are bearish and aligned downward, with the trend clearly heading lower. Although the RSI is already extremely low, in a strong downtrend, catching the bottom is catching a falling knife. My thinking is very simple: short a rebound at 1225–1235; if it directly drops to around 1190, take a small-size gamble on a rebound and then exit.
#币安九周年 #比特币计划eCash硬分叉
$SKHYNIX Hynix’s day collapses by nearly 10 points! 1339 directly smashes through 1200— the bargain-hunters got buried alive. This is already the fifth consecutive huge bearish candle!
Brothers, this candlestick chart is giving people chills! SK Hynix today directly dropped from 1339 all the way to the low of 1191.01. Current price is 1211.20, with a one-day plunge of 9.27%! This is already the fifth straight day of decline. From last week’s 1479 to now—down a full 18%!
Batches of would-be buyers are getting buried one after another—blood everywhere.
The technicals are completely wrecked! MA(7) 1243, MA(25) 1262, MA(99) 1423— all three moving averages are in a bearish alignment, spreading downward. Price has been left far below.
Xinying’s long/short two-way trading plan:
For longs: after a potential stop-the-fall near 1190–1200, cautiously start buying with small size.
For shorts: at the current price around 1225–1235, short on rallies; more conservative entries should be around 1270–1260.
Five straight days of selloff— all EMAs are bearish and aligned downward, with the trend clearly heading lower. Although the RSI is already extremely low, in a strong downtrend, catching the bottom is catching a falling knife. My thinking is very simple: short a rebound at 1225–1235; if it directly drops to around 1190, take a small-size gamble on a rebound and then exit.
#币安九周年 #比特币计划eCash硬分叉
Brothers, this candlestick chart is giving people chills! SK Hynix today directly dropped from 1339 all the way to the low of 1191.01. Current price is 1211.20, with a one-day plunge of 9.27%! This is already the fifth straight day of decline. From last week’s 1479 to now—down a full 18%!
Batches of would-be buyers are getting buried one after another—blood everywhere.
The technicals are completely wrecked! MA(7) 1243, MA(25) 1262, MA(99) 1423— all three moving averages are in a bearish alignment, spreading downward. Price has been left far below.
Xinying’s long/short two-way trading plan:
For longs: after a potential stop-the-fall near 1190–1200, cautiously start buying with small size.
For shorts: at the current price around 1225–1235, short on rallies; more conservative entries should be around 1270–1260.
Five straight days of selloff— all EMAs are bearish and aligned downward, with the trend clearly heading lower. Although the RSI is already extremely low, in a strong downtrend, catching the bottom is catching a falling knife. My thinking is very simple: short a rebound at 1225–1235; if it directly drops to around 1190, take a small-size gamble on a rebound and then exit.
#币安九周年 #比特币计划eCash硬分叉
1
1
831
·
--
Bearish
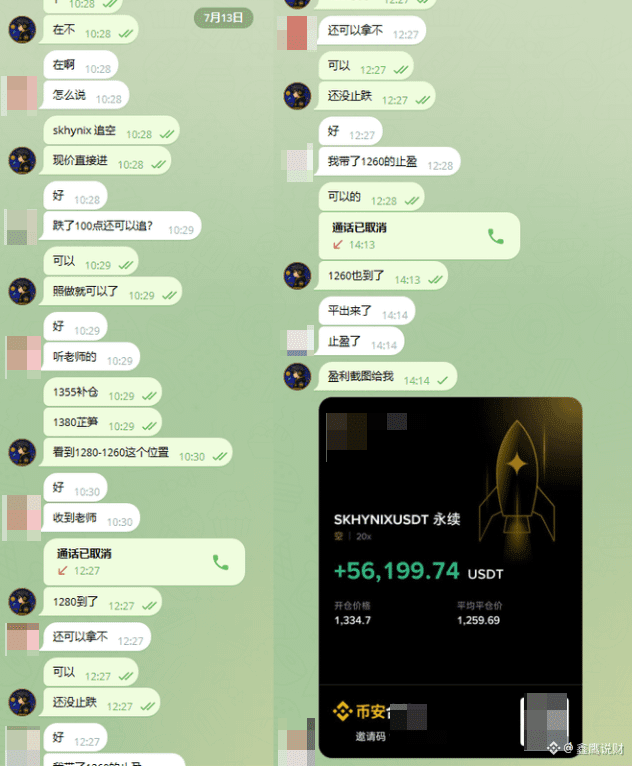
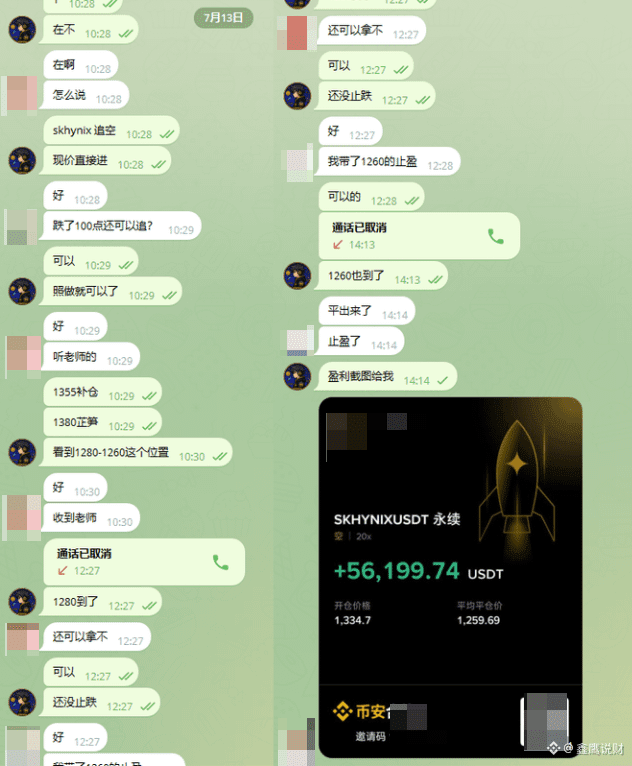
$SKHYNIX strictly adhere, XinYing takes you step by step to feast on profits!!
Don’t ask why—if you’re told to chase, then chase. The short positions are fully arranged, and there have been no signals indicating a potential stop to the decline. Even when the stocks in the same sector also dropped in sync, there still weren’t any signs of a pause in the downturn. If you don’t chase, aren’t you just going to watch others feast on profits??
XinYing keeps a real-time watch on the market the whole time. After closing the position, they also review and analyze the price action, so it not only helps you profit, but also gives you the thinking behind how to place your own trades!!
#币安九周年 #比特币ETF九周来首次周净流入
$SKHYNIX strictly adhere, XinYing takes you step by step to feast on profits!!
Don’t ask why—if you’re told to chase, then chase. The short positions are fully arranged, and there have been no signals indicating a potential stop to the decline. Even when the stocks in the same sector also dropped in sync, there still weren’t any signs of a pause in the downturn. If you don’t chase, aren’t you just going to watch others feast on profits??
XinYing keeps a real-time watch on the market the whole time. After closing the position, they also review and analyze the price action, so it not only helps you profit, but also gives you the thinking behind how to place your own trades!!
#币安九周年 #比特币ETF九周来首次周净流入
Don’t ask why—if you’re told to chase, then chase. The short positions are fully arranged, and there have been no signals indicating a potential stop to the decline. Even when the stocks in the same sector also dropped in sync, there still weren’t any signs of a pause in the downturn. If you don’t chase, aren’t you just going to watch others feast on profits??
XinYing keeps a real-time watch on the market the whole time. After closing the position, they also review and analyze the price action, so it not only helps you profit, but also gives you the thinking behind how to place your own trades!!
#币安九周年 #比特币ETF九周来首次周净流入
鑫鹰说财
·
--
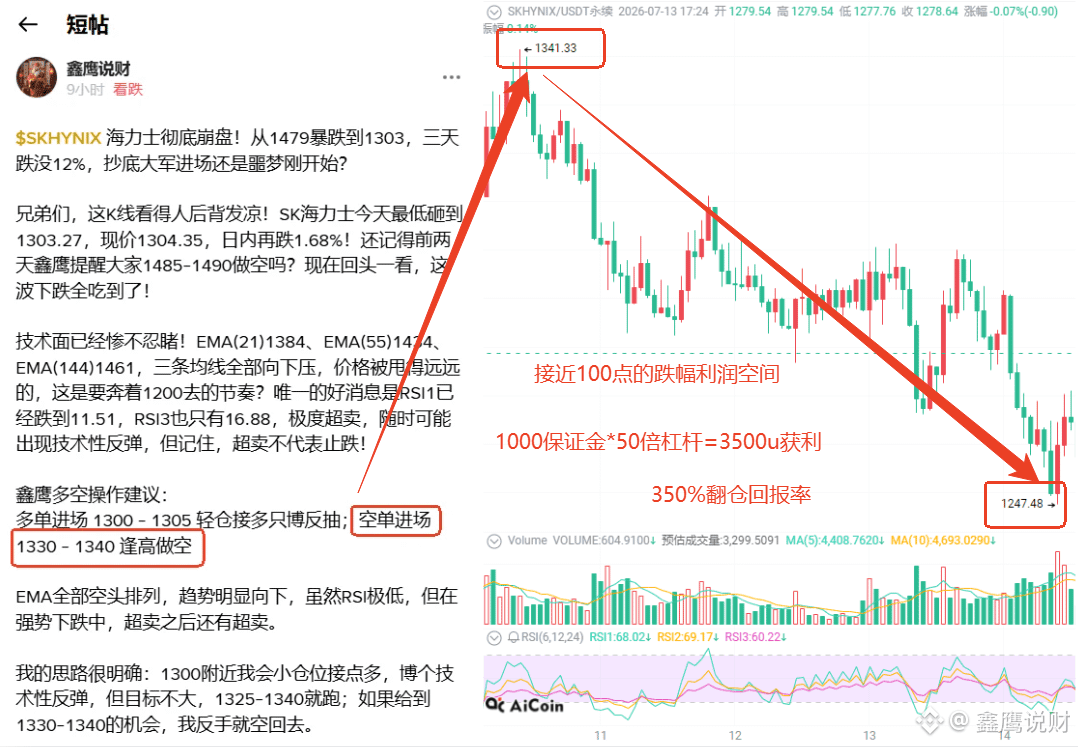
Bearish$SKHYNIX SK Hynix completely collapses! Dropping from 1479 to 1303—over three days down more than 12%. Is the bottom-fishing crowd entering… or is the nightmare just beginning?
Brothers, looking at this candlestick chart makes your back go cold! Today SK Hynix was hammered to a low of 1303.27; the current price is 1304.35, down another 1.68% intraday. Remember when Xin Ying reminded everyone to short at 1485–1490 two days ago? Now when you look back, this whole move has been fully taken to the downside!
The technical picture is already unbearable! EMA(21) 1384, EMA(55) 1434, EMA(144) 1461—these three moving averages are all pointing downward, and price has been thrown far away from them. Is this the rhythm heading toward 1200? The only good news is that RSI1 has already fallen to 11.51, and RSI3 is only 16.88—extremely oversold. A technical rebound could happen at any moment, but remember: oversold doesn’t mean the selloff is over!
Xin Ying’s long/short operation suggestions:
Go long: enter at 1300–1305, open small positions and buy multiple for a counter-trend bounce;
Go short: enter at 1330–1340, short on rallies
All EMAs are in bearish alignment, the trend is clearly downward. Even though RSI is extremely low, in a strong selloff, oversold can turn into even more oversold.
My thinking is very clear: around 1300, I’ll take a small position long to catch a minor technical rebound, but the upside isn’t big—I’ll take profit around 1325–1340. If there’s an opportunity to get 1330–1340, I’ll flip and short back.
#Zcash年内涨1190% #美国2年期国债收益率创2025年以来新高
Brothers, looking at this candlestick chart makes your back go cold! Today SK Hynix was hammered to a low of 1303.27; the current price is 1304.35, down another 1.68% intraday. Remember when Xin Ying reminded everyone to short at 1485–1490 two days ago? Now when you look back, this whole move has been fully taken to the downside!
The technical picture is already unbearable! EMA(21) 1384, EMA(55) 1434, EMA(144) 1461—these three moving averages are all pointing downward, and price has been thrown far away from them. Is this the rhythm heading toward 1200? The only good news is that RSI1 has already fallen to 11.51, and RSI3 is only 16.88—extremely oversold. A technical rebound could happen at any moment, but remember: oversold doesn’t mean the selloff is over!
Xin Ying’s long/short operation suggestions:
Go long: enter at 1300–1305, open small positions and buy multiple for a counter-trend bounce;
Go short: enter at 1330–1340, short on rallies
All EMAs are in bearish alignment, the trend is clearly downward. Even though RSI is extremely low, in a strong selloff, oversold can turn into even more oversold.
My thinking is very clear: around 1300, I’ll take a small position long to catch a minor technical rebound, but the upside isn’t big—I’ll take profit around 1325–1340. If there’s an opportunity to get 1330–1340, I’ll flip and short back.
#Zcash年内涨1190% #美国2年期国债收益率创2025年以来新高
363
·
--
Bullish
“When the investors in the leek panic and cut their losses, the giant whales are quietly accumulating!”
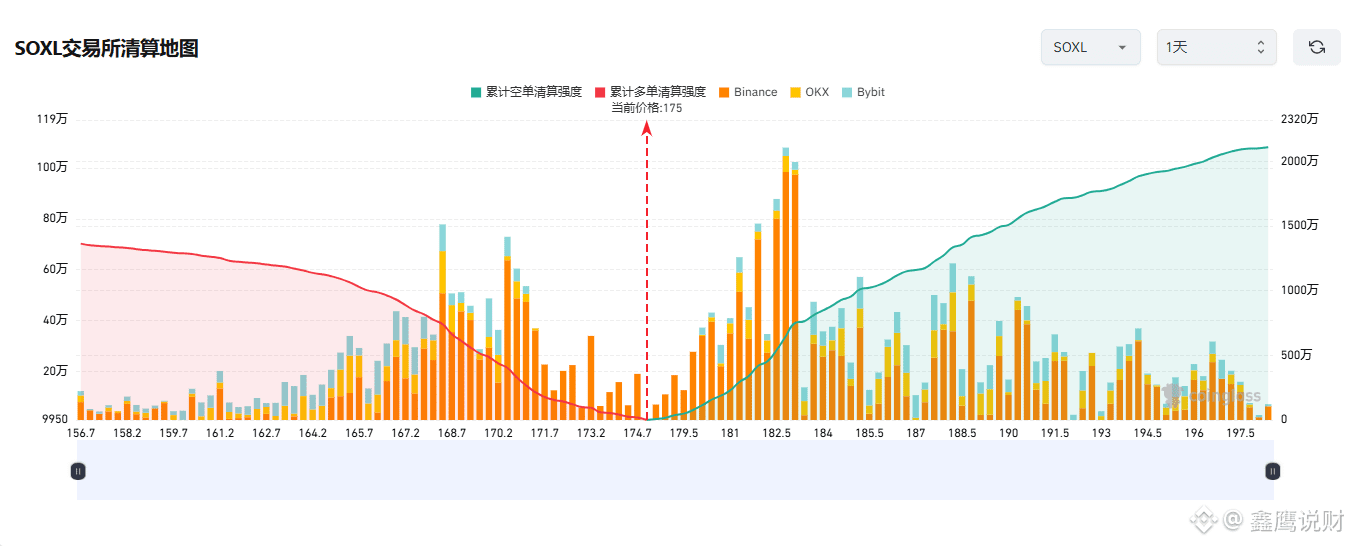
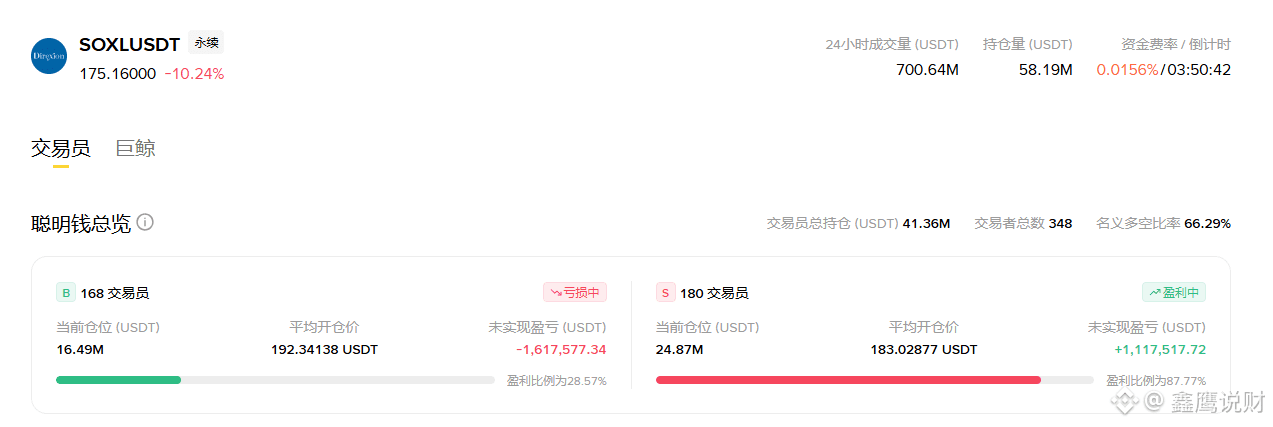
$SOXL This round, from 195 down to 170.75—on the surface, it looks like the positive catalyst from the Hynix ADR listing has already been priced in, triggering a stampede. But brothers, take a closer look—short sellers’ profit ratio is 87.77%, and shorts are pocketing money hand over fist. What do you call this? The emotion market has reached an extreme low point—shorts are fully crowded!
The liquidation map has already told you the answer!
Short positions’ liquidations are piling up in the 174.7–175.7 area, while long positions’ liquidations are around 170.2. Today, the market precisely tapped 170.75 and then surged back to 175.03—this is when the final defense line of the bulls was held, and the shorts have to start repaying their debts!
And on top of that, a report just came out from a U.S. bank: NVIDIA, Micron, and Broadcom are expected to generate a staggering $430 billion in free cash flow over the next 12 months. The semiconductor fundamentals are about to enter a main upswing!
XinYing’s advice for both long and short strategies:
Go long at entry 175.7, breaking through the MA7 plus the short liquidation zone; Go short at entry 184.50, on a pullback to the MA25 resistance level.
SOXL’s gain this year-to-date is 306%. You think this pullback marks the end? Wrong! It’s the last chance for those who haven’t boarded yet. Smart money is quietly positioning itself—so what are you waiting for?
#币安九周年 #欧洲股市下跌
“When the investors in the leek panic and cut their losses, the giant whales are quietly accumulating!”
$SOXL This round, from 195 down to 170.75—on the surface, it looks like the positive catalyst from the Hynix ADR listing has already been priced in, triggering a stampede. But brothers, take a closer look—short sellers’ profit ratio is 87.77%, and shorts are pocketing money hand over fist. What do you call this? The emotion market has reached an extreme low point—shorts are fully crowded!
The liquidation map has already told you the answer!
Short positions’ liquidations are piling up in the 174.7–175.7 area, while long positions’ liquidations are around 170.2. Today, the market precisely tapped 170.75 and then surged back to 175.03—this is when the final defense line of the bulls was held, and the shorts have to start repaying their debts!
And on top of that, a report just came out from a U.S. bank: NVIDIA, Micron, and Broadcom are expected to generate a staggering $430 billion in free cash flow over the next 12 months. The semiconductor fundamentals are about to enter a main upswing!
XinYing’s advice for both long and short strategies:
Go long at entry 175.7, breaking through the MA7 plus the short liquidation zone; Go short at entry 184.50, on a pullback to the MA25 resistance level.
SOXL’s gain this year-to-date is 306%. You think this pullback marks the end? Wrong! It’s the last chance for those who haven’t boarded yet. Smart money is quietly positioning itself—so what are you waiting for?
#币安九周年 #欧洲股市下跌
$SOXL This round, from 195 down to 170.75—on the surface, it looks like the positive catalyst from the Hynix ADR listing has already been priced in, triggering a stampede. But brothers, take a closer look—short sellers’ profit ratio is 87.77%, and shorts are pocketing money hand over fist. What do you call this? The emotion market has reached an extreme low point—shorts are fully crowded!
The liquidation map has already told you the answer!
Short positions’ liquidations are piling up in the 174.7–175.7 area, while long positions’ liquidations are around 170.2. Today, the market precisely tapped 170.75 and then surged back to 175.03—this is when the final defense line of the bulls was held, and the shorts have to start repaying their debts!
And on top of that, a report just came out from a U.S. bank: NVIDIA, Micron, and Broadcom are expected to generate a staggering $430 billion in free cash flow over the next 12 months. The semiconductor fundamentals are about to enter a main upswing!
XinYing’s advice for both long and short strategies:
Go long at entry 175.7, breaking through the MA7 plus the short liquidation zone; Go short at entry 184.50, on a pullback to the MA25 resistance level.
SOXL’s gain this year-to-date is 306%. You think this pullback marks the end? Wrong! It’s the last chance for those who haven’t boarded yet. Smart money is quietly positioning itself—so what are you waiting for?
#币安九周年 #欧洲股市下跌
445
·
--
Bearish
$ZEC surged by nearly $40 only to be precisely targeted by institutions! Is 549.65 a hard ceiling? Once this negative funding rate signal appears, both bulls and bears need to stay alert!
Brothers, ZEC’s move today is basically a rollercoaster! Within 24 hours, it blasted from the low of 511.53 all the way to the high of 549.65—an increase of $38. Those who chased longs were laughing for a moment. But it didn’t last: it got slammed straight back to 521.23, which is like rolling down from the peak. The ones who chased up high got hung on the flagpole!
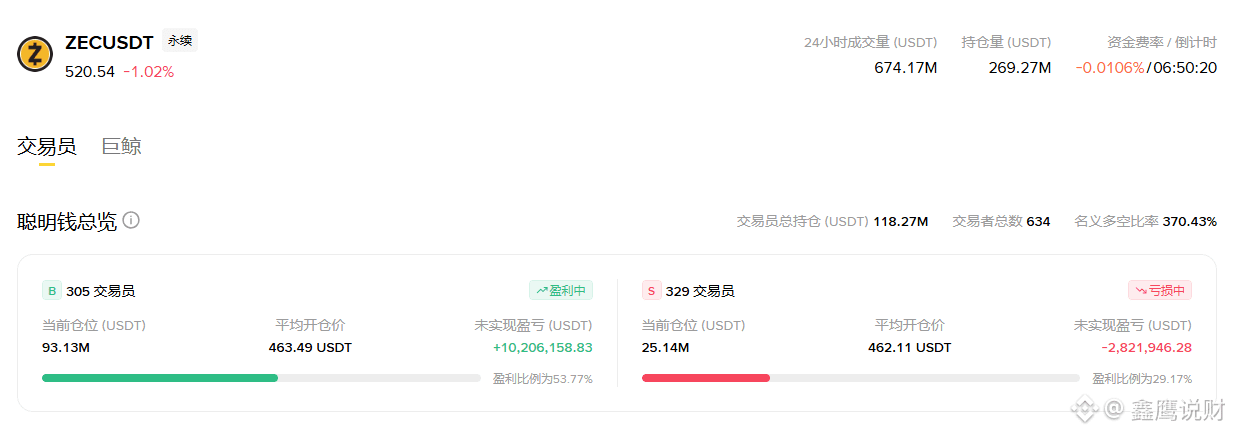
Clear technical signals have shown up! MA(7) 519.20 has already turned upward, and the price is above the short-term moving average, suggesting there’s still some breath left for the short-term bulls. But MA(25) 528.71 is still firmly pressing above—this is the line between the medium-term trend. More importantly, the funding rate has turned to -0.010%. Shorts are paying longs, which indicates short-selling sentiment is heating up again.
Look at volume: the 24-hour trading volume has jumped to 1.38 million coins—clearly large funds are competing here. Is 549.65 the hard top of this rebound, or just a temporary pause? We’ll know soon!
Xinyao’s two-way trading plan:
Go long on pullbacks near 517–520 after it stabilizes; go short on rebounds near 528–532.
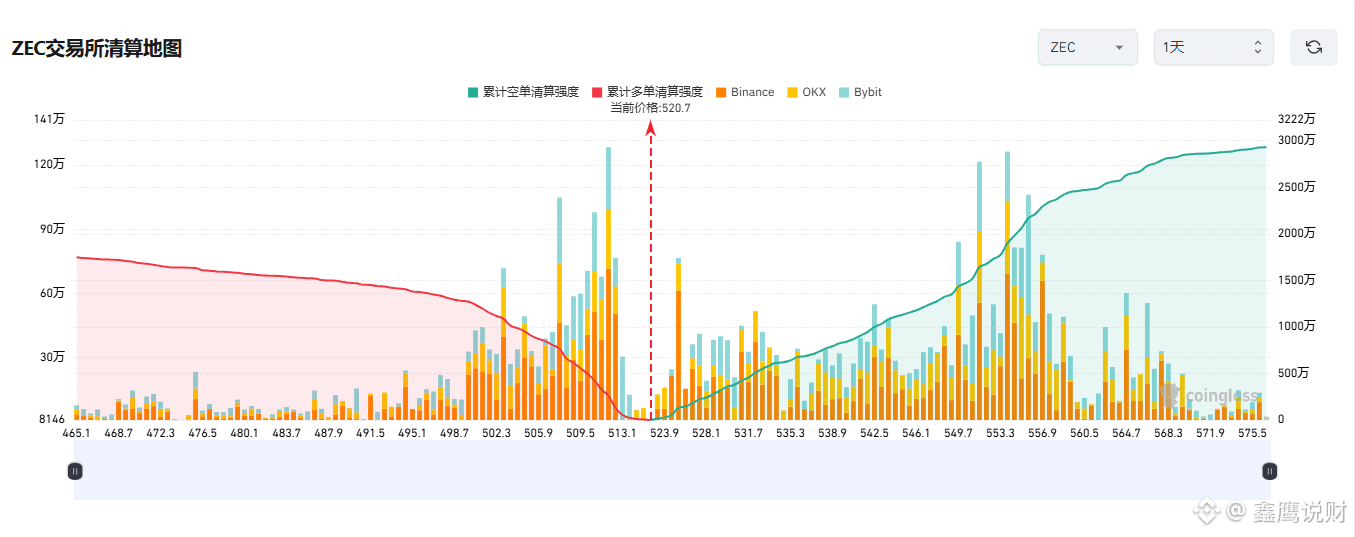
A negative funding rate means shorts are crowded, and a squeeze could happen at any time in the short term! But with macro conditions and rate-hike expectations warming up, chasing highs is extremely risky. Trade with a light position and set a stop-loss—don’t bet on one direction!
#币安九周年 #WTI原油触及73美元
$ZEC surged by nearly $40 only to be precisely targeted by institutions! Is 549.65 a hard ceiling? Once this negative funding rate signal appears, both bulls and bears need to stay alert!
Brothers, ZEC’s move today is basically a rollercoaster! Within 24 hours, it blasted from the low of 511.53 all the way to the high of 549.65—an increase of $38. Those who chased longs were laughing for a moment. But it didn’t last: it got slammed straight back to 521.23, which is like rolling down from the peak. The ones who chased up high got hung on the flagpole!
Clear technical signals have shown up! MA(7) 519.20 has already turned upward, and the price is above the short-term moving average, suggesting there’s still some breath left for the short-term bulls. But MA(25) 528.71 is still firmly pressing above—this is the line between the medium-term trend. More importantly, the funding rate has turned to -0.010%. Shorts are paying longs, which indicates short-selling sentiment is heating up again.
Look at volume: the 24-hour trading volume has jumped to 1.38 million coins—clearly large funds are competing here. Is 549.65 the hard top of this rebound, or just a temporary pause? We’ll know soon!
Xinyao’s two-way trading plan:
Go long on pullbacks near 517–520 after it stabilizes; go short on rebounds near 528–532.
A negative funding rate means shorts are crowded, and a squeeze could happen at any time in the short term! But with macro conditions and rate-hike expectations warming up, chasing highs is extremely risky. Trade with a light position and set a stop-loss—don’t bet on one direction!
#币安九周年 #WTI原油触及73美元
Brothers, ZEC’s move today is basically a rollercoaster! Within 24 hours, it blasted from the low of 511.53 all the way to the high of 549.65—an increase of $38. Those who chased longs were laughing for a moment. But it didn’t last: it got slammed straight back to 521.23, which is like rolling down from the peak. The ones who chased up high got hung on the flagpole!
Clear technical signals have shown up! MA(7) 519.20 has already turned upward, and the price is above the short-term moving average, suggesting there’s still some breath left for the short-term bulls. But MA(25) 528.71 is still firmly pressing above—this is the line between the medium-term trend. More importantly, the funding rate has turned to -0.010%. Shorts are paying longs, which indicates short-selling sentiment is heating up again.
Look at volume: the 24-hour trading volume has jumped to 1.38 million coins—clearly large funds are competing here. Is 549.65 the hard top of this rebound, or just a temporary pause? We’ll know soon!
Xinyao’s two-way trading plan:
Go long on pullbacks near 517–520 after it stabilizes; go short on rebounds near 528–532.
A negative funding rate means shorts are crowded, and a squeeze could happen at any time in the short term! But with macro conditions and rate-hike expectations warming up, chasing highs is extremely risky. Trade with a light position and set a stop-loss—don’t bet on one direction!
#币安九周年 #WTI原油触及73美元
129
·
--
Bearish
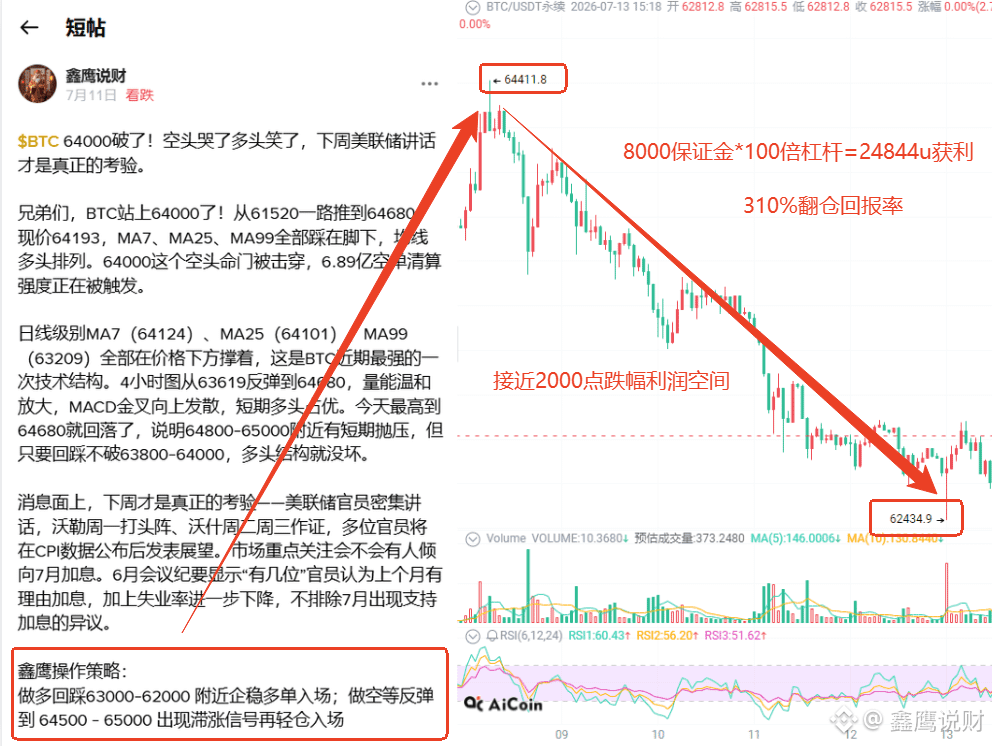
$BTC This short-sell wave has everyone who followed along getting their share of the profit! Up to a 2000-point profit room!
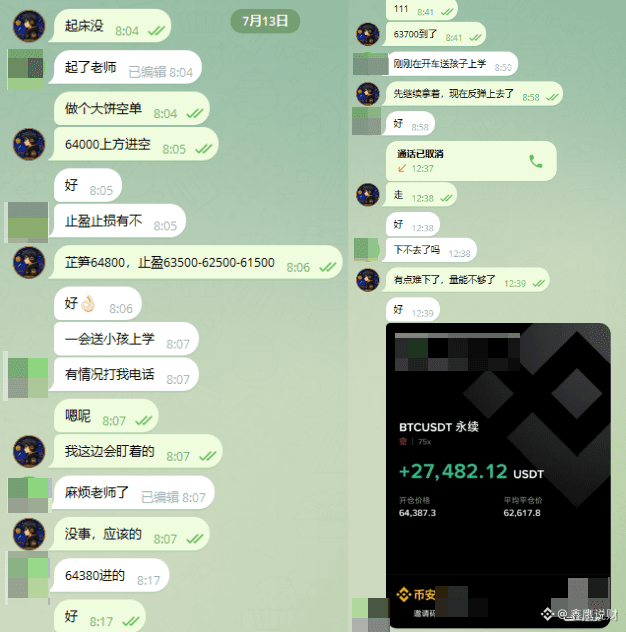
The weekend’s volatility isn’t big. The profits for those who entered on Saturday and those who entered this morning are about the same. The lowest point was around 62,400. For those who entered this morning, they were close to a drop of around 2000 points, giving a profit space of nearly that amount. The 27k followers have already cashed in their gains!!
If you didn’t follow along, don’t feel discouraged. Xinying keeps updating its operation suggestions. Next wave—let’s share the profits together!!
#币安九周年 #WTI原油触及73美元
$BTC This short-sell wave has everyone who followed along getting their share of the profit! Up to a 2000-point profit room!
The weekend’s volatility isn’t big. The profits for those who entered on Saturday and those who entered this morning are about the same. The lowest point was around 62,400. For those who entered this morning, they were close to a drop of around 2000 points, giving a profit space of nearly that amount. The 27k followers have already cashed in their gains!!
If you didn’t follow along, don’t feel discouraged. Xinying keeps updating its operation suggestions. Next wave—let’s share the profits together!!
#币安九周年 #WTI原油触及73美元
The weekend’s volatility isn’t big. The profits for those who entered on Saturday and those who entered this morning are about the same. The lowest point was around 62,400. For those who entered this morning, they were close to a drop of around 2000 points, giving a profit space of nearly that amount. The 27k followers have already cashed in their gains!!
If you didn’t follow along, don’t feel discouraged. Xinying keeps updating its operation suggestions. Next wave—let’s share the profits together!!
#币安九周年 #WTI原油触及73美元
鑫鹰说财
·
--
Bearish$BTC 64000 It’s broken! The bears are crying and the bulls are laughing. Next week’s Fed remarks are the real test.
Brothers, BTC has broken above 64,000! From 61,520 all the way pushed to 64,680—current price is 64,193. MA7, MA25, and MA99 are all beneath the price, and the moving averages are aligned bullishly. The 64,000 bear “weak point” has been pierced. The liquidation force of the 689 million short positions is being triggered.
On the daily timeframe, MA7 (64,124), MA25 (64,101), and MA99 (63,209) are all providing support below the price—this is BTC’s strongest technical structure recently. On the 4-hour chart, it rebounded from 63,619 to 64,680. Trading volume has increased moderately. The MACD bullish crossover is spreading upward, and the short-term bulls have the advantage. Today it rose to 64,680 and then pulled back, indicating short-term sell pressure around 64,800–65,000. But as long as the pullback doesn’t break 63,800–64,000, the bullish structure won’t be damaged.
On the news front, next week is the real test—numerous Fed officials will speak in succession. Waller leads off on Monday, Waller? (Actually: Waller Monday, Waller/Waller?)—Waller testifies Tuesday and Wednesday, and several officials will offer outlooks after the CPI data is released. The market’s key focus is whether anyone shows a tilt toward a July rate hike. The June meeting minutes show that “several” officials believed there was reason to raise rates last month, combined with unemployment falling further—so it’s not impossible that dissent supporting a July hike appears.
XinYing trading strategy:
Go long on pullbacks around 63,000–62,000; wait to short—enter with a light position only if a rebound to 64,500–65,000 shows stagnation / sluggishness signals.
Brothers, BTC has broken through 64,000. The technicals are indeed impressive—but don’t celebrate too early. Next week’s Fed remarks are the real test. If Waller turns hawkish, or if someone supports a July rate hike, BTC may need another pullback. You can take a light long position now, but don’t go all-in—wait until the remarks are out before increasing the position size more safely.
#日本政府敦促GPIF增持本土资产 #SK海力士完成美国最大外企上市
Brothers, BTC has broken above 64,000! From 61,520 all the way pushed to 64,680—current price is 64,193. MA7, MA25, and MA99 are all beneath the price, and the moving averages are aligned bullishly. The 64,000 bear “weak point” has been pierced. The liquidation force of the 689 million short positions is being triggered.
On the daily timeframe, MA7 (64,124), MA25 (64,101), and MA99 (63,209) are all providing support below the price—this is BTC’s strongest technical structure recently. On the 4-hour chart, it rebounded from 63,619 to 64,680. Trading volume has increased moderately. The MACD bullish crossover is spreading upward, and the short-term bulls have the advantage. Today it rose to 64,680 and then pulled back, indicating short-term sell pressure around 64,800–65,000. But as long as the pullback doesn’t break 63,800–64,000, the bullish structure won’t be damaged.
On the news front, next week is the real test—numerous Fed officials will speak in succession. Waller leads off on Monday, Waller? (Actually: Waller Monday, Waller/Waller?)—Waller testifies Tuesday and Wednesday, and several officials will offer outlooks after the CPI data is released. The market’s key focus is whether anyone shows a tilt toward a July rate hike. The June meeting minutes show that “several” officials believed there was reason to raise rates last month, combined with unemployment falling further—so it’s not impossible that dissent supporting a July hike appears.
XinYing trading strategy:
Go long on pullbacks around 63,000–62,000; wait to short—enter with a light position only if a rebound to 64,500–65,000 shows stagnation / sluggishness signals.
Brothers, BTC has broken through 64,000. The technicals are indeed impressive—but don’t celebrate too early. Next week’s Fed remarks are the real test. If Waller turns hawkish, or if someone supports a July rate hike, BTC may need another pullback. You can take a light long position now, but don’t go all-in—wait until the remarks are out before increasing the position size more safely.
#日本政府敦促GPIF增持本土资产 #SK海力士完成美国最大外企上市
109
·
--
Bearish
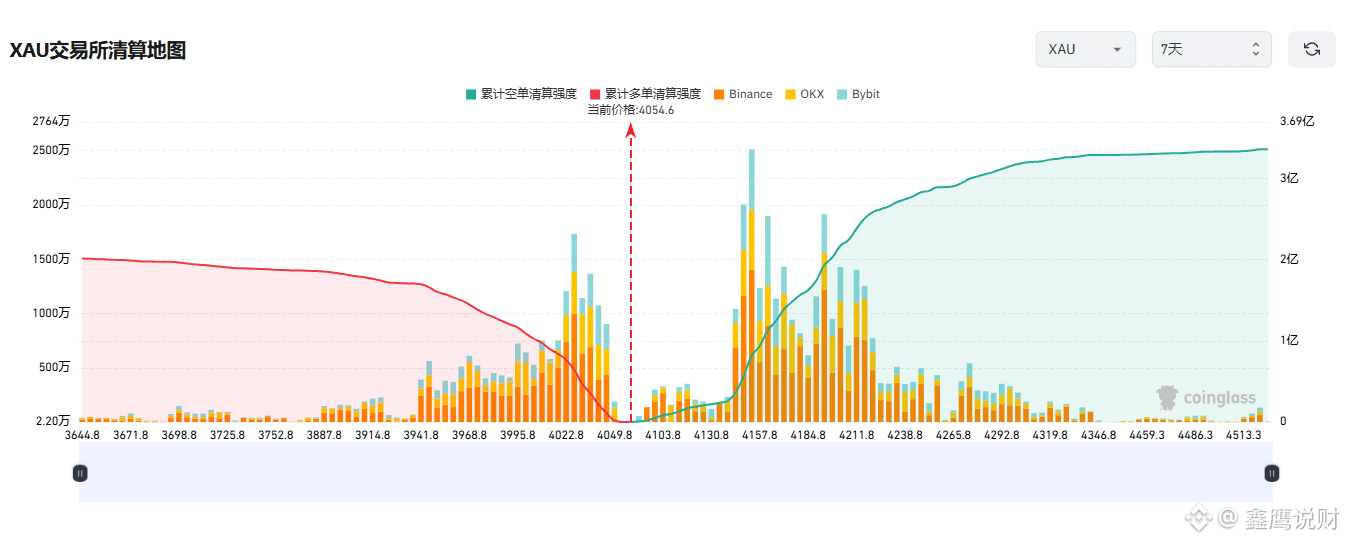
$XAU suddenly collapses! The rate-hike “nuclear bomb” strikes again—gold tumbles from 4140. Before the CPI, do you buy the dip or run for your life?
Brothers, this massive bearish candle in gold has caught everyone off guard! Fueled by the US-Iran conflict pushing up oil prices and rapidly rising expectations for rate hikes, gold was directly smashed all the way from above 4140 down to the low of 4046.43. The current price is 4055.95—down 1.25% for the day, a drop of nearly 100 dollars!
The technical picture is already fully turning bearish! MA(7) 4065, MA(25) 4092, MA(99) 4109—these three moving averages have all turned downward. Price is being pinned below, which is a classic mid-term top signal! If tomorrow’s CPI data comes in hotter than expected, gold could very well rush straight to the 4000 level.
Xinyao trading suggestions:
Go long for a bounce around 4020–4030. After the downside stabilizes, enter with a small position;
For shorts, stay steady and look to short on rallies around 4075–4085. If you’re aggressive, enter a short directly in the 4060–4050 range.
Rising rate-hike expectations are deadly bearish news for gold! CPI data ahead brings violent fluctuations—keep your position sizing to below half of your usual amount, and strictly set stop-losses!
Brothers, in this wave, do you think you can hold 4000—or will it keep collapsing?
#币安九周年 #WTI原油触及73美元
$XAU suddenly collapses! The rate-hike “nuclear bomb” strikes again—gold tumbles from 4140. Before the CPI, do you buy the dip or run for your life?
Brothers, this massive bearish candle in gold has caught everyone off guard! Fueled by the US-Iran conflict pushing up oil prices and rapidly rising expectations for rate hikes, gold was directly smashed all the way from above 4140 down to the low of 4046.43. The current price is 4055.95—down 1.25% for the day, a drop of nearly 100 dollars!
The technical picture is already fully turning bearish! MA(7) 4065, MA(25) 4092, MA(99) 4109—these three moving averages have all turned downward. Price is being pinned below, which is a classic mid-term top signal! If tomorrow’s CPI data comes in hotter than expected, gold could very well rush straight to the 4000 level.
Xinyao trading suggestions:
Go long for a bounce around 4020–4030. After the downside stabilizes, enter with a small position;
For shorts, stay steady and look to short on rallies around 4075–4085. If you’re aggressive, enter a short directly in the 4060–4050 range.
Rising rate-hike expectations are deadly bearish news for gold! CPI data ahead brings violent fluctuations—keep your position sizing to below half of your usual amount, and strictly set stop-losses!
Brothers, in this wave, do you think you can hold 4000—or will it keep collapsing?
#币安九周年 #WTI原油触及73美元
Brothers, this massive bearish candle in gold has caught everyone off guard! Fueled by the US-Iran conflict pushing up oil prices and rapidly rising expectations for rate hikes, gold was directly smashed all the way from above 4140 down to the low of 4046.43. The current price is 4055.95—down 1.25% for the day, a drop of nearly 100 dollars!
The technical picture is already fully turning bearish! MA(7) 4065, MA(25) 4092, MA(99) 4109—these three moving averages have all turned downward. Price is being pinned below, which is a classic mid-term top signal! If tomorrow’s CPI data comes in hotter than expected, gold could very well rush straight to the 4000 level.
Xinyao trading suggestions:
Go long for a bounce around 4020–4030. After the downside stabilizes, enter with a small position;
For shorts, stay steady and look to short on rallies around 4075–4085. If you’re aggressive, enter a short directly in the 4060–4050 range.
Rising rate-hike expectations are deadly bearish news for gold! CPI data ahead brings violent fluctuations—keep your position sizing to below half of your usual amount, and strictly set stop-losses!
Brothers, in this wave, do you think you can hold 4000—or will it keep collapsing?
#币安九周年 #WTI原油触及73美元
221
·
--
Bearish
Partly True
$ETH Just surged to 1848 and got smashed back to the starting point! A rate-hike “nuclear bomb” is coming—will a second dip happen, or will it break down and plunge again?
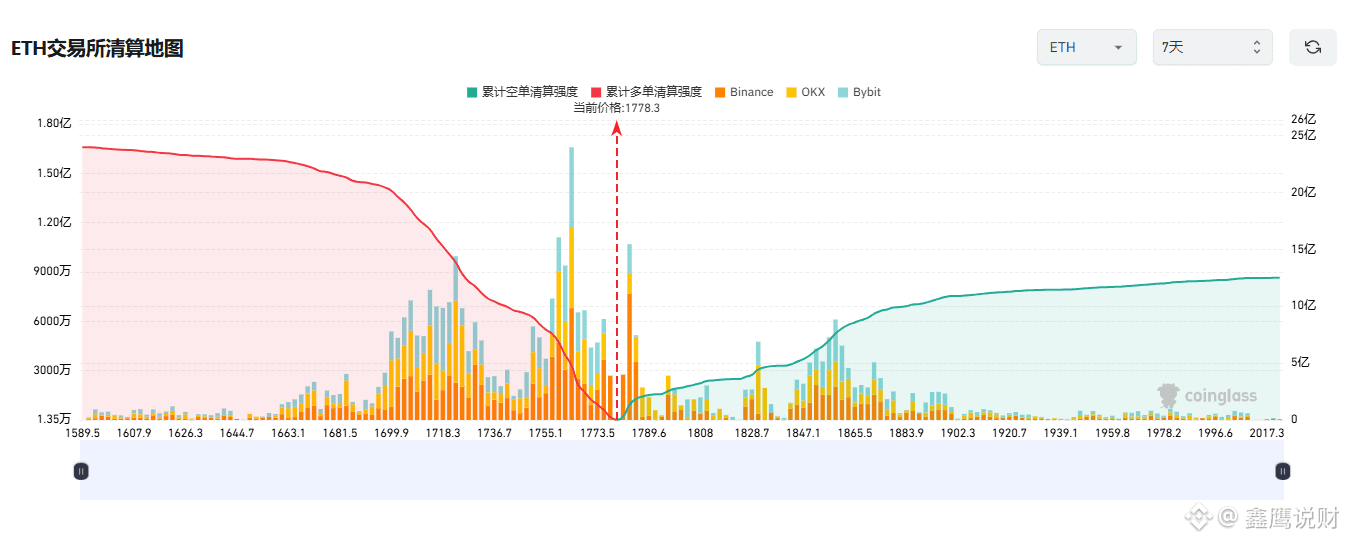
Brothers, ETH’s chart looks a bit dangerous! It bounced back to 1848 yesterday, but today it was directly smashed back to 1775.90. Down 0.94% intraday; the low hit 1772, and in the past 24 hours it’s fallen by more than 70 dollars!
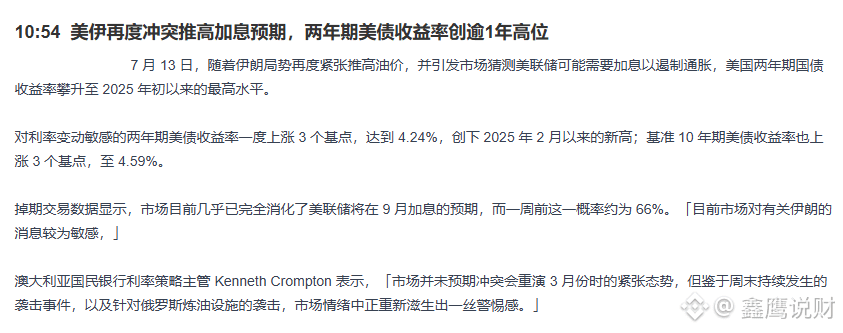
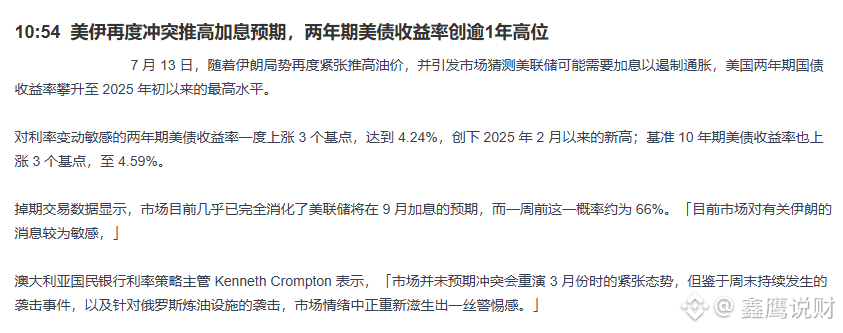
From the technical side: MA(7) 1793, MA(25) 1805, MA(99) 1788— all three moving averages are pointing downward. Price has already been pushed below all moving averages, which is a clear bearish alignment! Even scarier is what’s happening on the macro front: the US-Iran conflict has pushed oil prices up, and the market has nearly fully priced in a September rate hike by the Fed. The yield on the 2-year US Treasury has surged to 4.24%, hitting a new high for the year. This is a deadly blow to risk assets!
Longs: around 1710–1720, consider trying small, as you may see stalled upside. Shorts: sell on rebounds more steadily from 1830–1810; for the aggressive approach, short at the current price around 1780.
Right now, the macro environment is very unfriendly to crypto. Oil prices rising → inflation rising → rate-hike expectations heating up → pressure on risk assets—the logic chain is very clear. Technically, all moving averages are in bearish order, and the downtrend is obvious.
Brothers, do you think this ETH move can hold 1750, or will it head straight toward 1700?
#币安九周年 #WTI原油触及73美元
$ETH Just surged to 1848 and got smashed back to the starting point! A rate-hike “nuclear bomb” is coming—will a second dip happen, or will it break down and plunge again?
Brothers, ETH’s chart looks a bit dangerous! It bounced back to 1848 yesterday, but today it was directly smashed back to 1775.90. Down 0.94% intraday; the low hit 1772, and in the past 24 hours it’s fallen by more than 70 dollars!
From the technical side: MA(7) 1793, MA(25) 1805, MA(99) 1788— all three moving averages are pointing downward. Price has already been pushed below all moving averages, which is a clear bearish alignment! Even scarier is what’s happening on the macro front: the US-Iran conflict has pushed oil prices up, and the market has nearly fully priced in a September rate hike by the Fed. The yield on the 2-year US Treasury has surged to 4.24%, hitting a new high for the year. This is a deadly blow to risk assets!
Longs: around 1710–1720, consider trying small, as you may see stalled upside. Shorts: sell on rebounds more steadily from 1830–1810; for the aggressive approach, short at the current price around 1780.
Right now, the macro environment is very unfriendly to crypto. Oil prices rising → inflation rising → rate-hike expectations heating up → pressure on risk assets—the logic chain is very clear. Technically, all moving averages are in bearish order, and the downtrend is obvious.
Brothers, do you think this ETH move can hold 1750, or will it head straight toward 1700?
#币安九周年 #WTI原油触及73美元
Brothers, ETH’s chart looks a bit dangerous! It bounced back to 1848 yesterday, but today it was directly smashed back to 1775.90. Down 0.94% intraday; the low hit 1772, and in the past 24 hours it’s fallen by more than 70 dollars!
From the technical side: MA(7) 1793, MA(25) 1805, MA(99) 1788— all three moving averages are pointing downward. Price has already been pushed below all moving averages, which is a clear bearish alignment! Even scarier is what’s happening on the macro front: the US-Iran conflict has pushed oil prices up, and the market has nearly fully priced in a September rate hike by the Fed. The yield on the 2-year US Treasury has surged to 4.24%, hitting a new high for the year. This is a deadly blow to risk assets!
Longs: around 1710–1720, consider trying small, as you may see stalled upside. Shorts: sell on rebounds more steadily from 1830–1810; for the aggressive approach, short at the current price around 1780.
Right now, the macro environment is very unfriendly to crypto. Oil prices rising → inflation rising → rate-hike expectations heating up → pressure on risk assets—the logic chain is very clear. Technically, all moving averages are in bearish order, and the downtrend is obvious.
Brothers, do you think this ETH move can hold 1750, or will it head straight toward 1700?
#币安九周年 #WTI原油触及73美元
1
691
·
--
Bullish
$CL has gone completely mad! Middle East conflict begins—oil prices surged more than 4 days in a row. Can you still catch up before the CPI? This long bullish candle tells brothers a key signal!
Brothers, WTI crude oil has been too intense this round! After the U.S. took action against Iran, oil prices jumped straight from around 72 to a high of 74.92. The current price is 74.44, and it’s up another 1.77% today—this is already the fourth consecutive day of rally!
From a technical perspective, MA(7) is 74.29, MA(25) is 73.84, and MA(99) is 72.57. All three moving averages are clearly fanning out upward, and the price is holding steadily above all moving averages—strong confirmation of a bullish trend! But don’t forget: CPI data will be released tomorrow evening at 8:30. If inflation comes in hotter than expected and expectations for Fed rate hikes heat up, oil prices may take a hit.
Xinying multi-side and short-side bidirectional trading suggestions:
Go long on a pullback at 74 to 74.2; for shorts, try a low-position short at 75.5 to 75.8.
Before CPI data, big funds will likely stay on the sidelines, and volatility may narrow. Only after the data lands will the real direction become clear. Don’t bet your whole position on the data!
In the short term, the Middle East situation is hard to cool down. The oil bullish trend has already formed. But there’s considerable resistance above 75, and with CPI data uncertainty, chasing higher prices carries high risk. If the CPI data turns out to be bearish and the negative impact is fully priced in, add to longs; if it’s worse than expected on the downside, withdraw first and wait and see.
#币安九周年 #比特币ETF终结八周资金流出
$CL has gone completely mad! Middle East conflict begins—oil prices surged more than 4 days in a row. Can you still catch up before the CPI? This long bullish candle tells brothers a key signal!
Brothers, WTI crude oil has been too intense this round! After the U.S. took action against Iran, oil prices jumped straight from around 72 to a high of 74.92. The current price is 74.44, and it’s up another 1.77% today—this is already the fourth consecutive day of rally!
From a technical perspective, MA(7) is 74.29, MA(25) is 73.84, and MA(99) is 72.57. All three moving averages are clearly fanning out upward, and the price is holding steadily above all moving averages—strong confirmation of a bullish trend! But don’t forget: CPI data will be released tomorrow evening at 8:30. If inflation comes in hotter than expected and expectations for Fed rate hikes heat up, oil prices may take a hit.
Xinying multi-side and short-side bidirectional trading suggestions:
Go long on a pullback at 74 to 74.2; for shorts, try a low-position short at 75.5 to 75.8.
Before CPI data, big funds will likely stay on the sidelines, and volatility may narrow. Only after the data lands will the real direction become clear. Don’t bet your whole position on the data!
In the short term, the Middle East situation is hard to cool down. The oil bullish trend has already formed. But there’s considerable resistance above 75, and with CPI data uncertainty, chasing higher prices carries high risk. If the CPI data turns out to be bearish and the negative impact is fully priced in, add to longs; if it’s worse than expected on the downside, withdraw first and wait and see.
#币安九周年 #比特币ETF终结八周资金流出
Brothers, WTI crude oil has been too intense this round! After the U.S. took action against Iran, oil prices jumped straight from around 72 to a high of 74.92. The current price is 74.44, and it’s up another 1.77% today—this is already the fourth consecutive day of rally!
From a technical perspective, MA(7) is 74.29, MA(25) is 73.84, and MA(99) is 72.57. All three moving averages are clearly fanning out upward, and the price is holding steadily above all moving averages—strong confirmation of a bullish trend! But don’t forget: CPI data will be released tomorrow evening at 8:30. If inflation comes in hotter than expected and expectations for Fed rate hikes heat up, oil prices may take a hit.
Xinying multi-side and short-side bidirectional trading suggestions:
Go long on a pullback at 74 to 74.2; for shorts, try a low-position short at 75.5 to 75.8.
Before CPI data, big funds will likely stay on the sidelines, and volatility may narrow. Only after the data lands will the real direction become clear. Don’t bet your whole position on the data!
In the short term, the Middle East situation is hard to cool down. The oil bullish trend has already formed. But there’s considerable resistance above 75, and with CPI data uncertainty, chasing higher prices carries high risk. If the CPI data turns out to be bearish and the negative impact is fully priced in, add to longs; if it’s worse than expected on the downside, withdraw first and wait and see.
#币安九周年 #比特币ETF终结八周资金流出

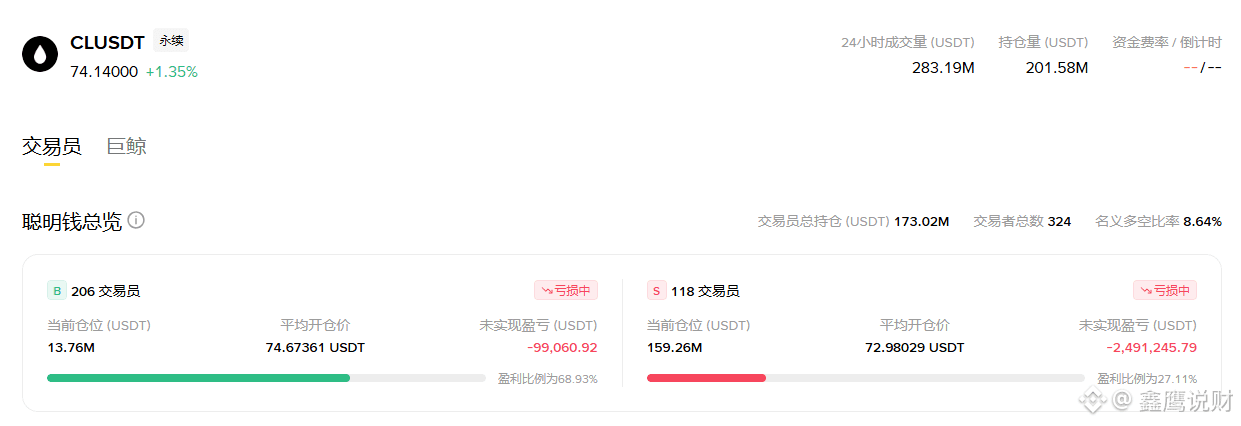
454
Log in to explore more content
Join global crypto users on Binance Square
⚡️ Get latest and useful information about crypto.
💬 Trusted by the world’s largest crypto exchange.
👍 Discover real insights from verified creators.
Email / Phone number