
CryptoWithAhad03
68 Posts

CryptoWithAhad03
Report
Block User
Crypto education for my followers.Simple.Safe Educational Learn crypto the right way.
Open Trade
High-Frequency Trader
2.9 Years
161 Following
104 Followers
38 Liked
Posts
Portfolio
All
Quotes
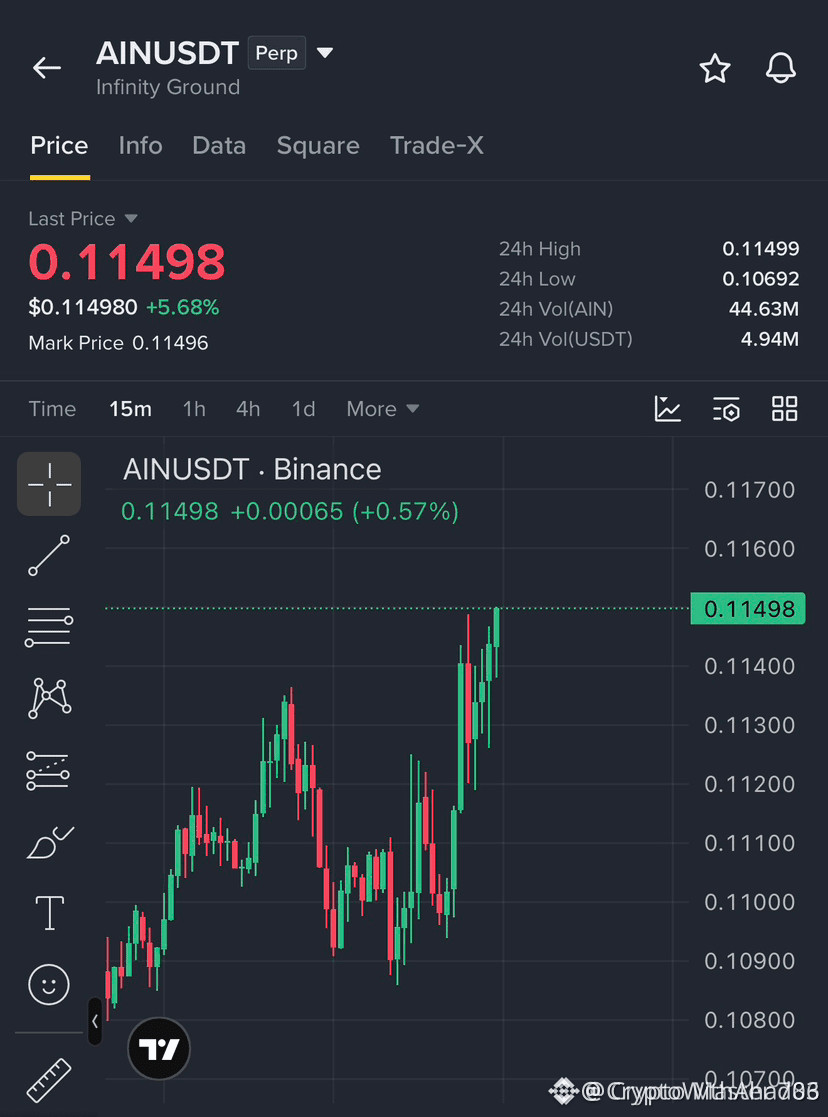
🚀$AIN IN – LONG SETUP | BOUNCE CONFIRMATION
I'm watching $AIN for a potential bullish bounce from the $0.11400 support zone.
🟢 TRADE: LONG
📍 Entry: $0.11400 (after bullish confirmation)
🎯 Take Profit: $0.11700
🛑 Stop Loss: $0.11250
📊 Trade Strategy:
Looking for a strong bounce from support before entering. If buyers defend $0.11400, a move toward $0.11700 could be possible.
⚠️ No confirmation, no trade. Always manage your risk.
🔥 Are you bullish on $AIN? What's your target?
NFA | DYOR
#AIN #AINUSDT #CryptoTrading #BinanceSquare #TradingSetup
{future}(AINUSDT)
🚀$AIN IN – LONG SETUP | BOUNCE CONFIRMATION
I'm watching $AIN for a potential bullish bounce from the $0.11400 support zone.
🟢 TRADE: LONG
📍 Entry: $0.11400 (after bullish confirmation)
🎯 Take Profit: $0.11700
🛑 Stop Loss: $0.11250
📊 Trade Strategy:
Looking for a strong bounce from support before entering. If buyers defend $0.11400, a move toward $0.11700 could be possible.
⚠️ No confirmation, no trade. Always manage your risk.
🔥 Are you bullish on $AIN ? What's your target?
NFA | DYOR
#AIN #AINUSDT #CryptoTrading #BinanceSquare #TradingSetup
I'm watching $AIN for a potential bullish bounce from the $0.11400 support zone.
🟢 TRADE: LONG
📍 Entry: $0.11400 (after bullish confirmation)
🎯 Take Profit: $0.11700
🛑 Stop Loss: $0.11250
📊 Trade Strategy:
Looking for a strong bounce from support before entering. If buyers defend $0.11400, a move toward $0.11700 could be possible.
⚠️ No confirmation, no trade. Always manage your risk.
🔥 Are you bullish on $AIN ? What's your target?
NFA | DYOR
#AIN #AINUSDT #CryptoTrading #BinanceSquare #TradingSetup
92
🚀 $BLUR R – BREAKOUT WATCH | LONG SETUP
$BLUR is approaching a potential breakout opportunity, and I'm watching the $0.00777 level closely.
🟢 TRADE: LONG
Entry: $0.00777 (after 1H breakout and successful retest)
🎯 Take Profit: $0.00820
🛑 Stop Loss: $0.00755
📊 Trading Strategy:
I’m looking for a confirmed 1H candle close above $0.00777, followed by a successful retest as support before entering.
No confirmation, no trade. Discipline comes first!
🔥 Are you bullish on $BLUR? Share your targets below!
NFA | DYOR
$BLUR
#BLUR #BLURUSDT #CryptoTrading #BinanceSquare #TradingSetup
{future}(BLURUSDT)
🚀 $BLUR R – BREAKOUT WATCH | LONG SETUP
$BLUR is approaching a potential breakout opportunity, and I'm watching the $0.00777 level closely.
🟢 TRADE: LONG
Entry: $0.00777 (after 1H breakout and successful retest)
🎯 Take Profit: $0.00820
🛑 Stop Loss: $0.00755
📊 Trading Strategy:
I’m looking for a confirmed 1H candle close above $0.00777, followed by a successful retest as support before entering.
No confirmation, no trade. Discipline comes first!
🔥 Are you bullish on $BLUR ? Share your targets below!
NFA | DYOR
$BLUR
#BLUR #BLURUSDT #CryptoTrading #BinanceSquare #TradingSetup
$BLUR is approaching a potential breakout opportunity, and I'm watching the $0.00777 level closely.
🟢 TRADE: LONG
Entry: $0.00777 (after 1H breakout and successful retest)
🎯 Take Profit: $0.00820
🛑 Stop Loss: $0.00755
📊 Trading Strategy:
I’m looking for a confirmed 1H candle close above $0.00777, followed by a successful retest as support before entering.
No confirmation, no trade. Discipline comes first!
🔥 Are you bullish on $BLUR ? Share your targets below!
NFA | DYOR
$BLUR
#BLUR #BLURUSDT #CryptoTrading #BinanceSquare #TradingSetup
147
$POPCAT $POPCAT T /USDT - SHORT
Entry : 0.02423
Targets :
0.02400
0.02376
0.02354
0.02321
0.02293
0.02264
Stoploss : 0.02578
Leverage : 25x Cross
#DYOR🟢
#ManagerRisks
$POPCAT
{future}(POPCATUSDT)
$POPCAT $POPCAT T /USDT - SHORT
Entry : 0.02423
Targets :
0.02400
0.02376
0.02354
0.02321
0.02293
0.02264
Stoploss : 0.02578
Leverage : 25x Cross
#DYOR🟢
#ManagerRisks
$POPCAT
Entry : 0.02423
Targets :
0.02400
0.02376
0.02354
0.02321
0.02293
0.02264
Stoploss : 0.02578
Leverage : 25x Cross
#DYOR🟢
#ManagerRisks
$POPCAT
6
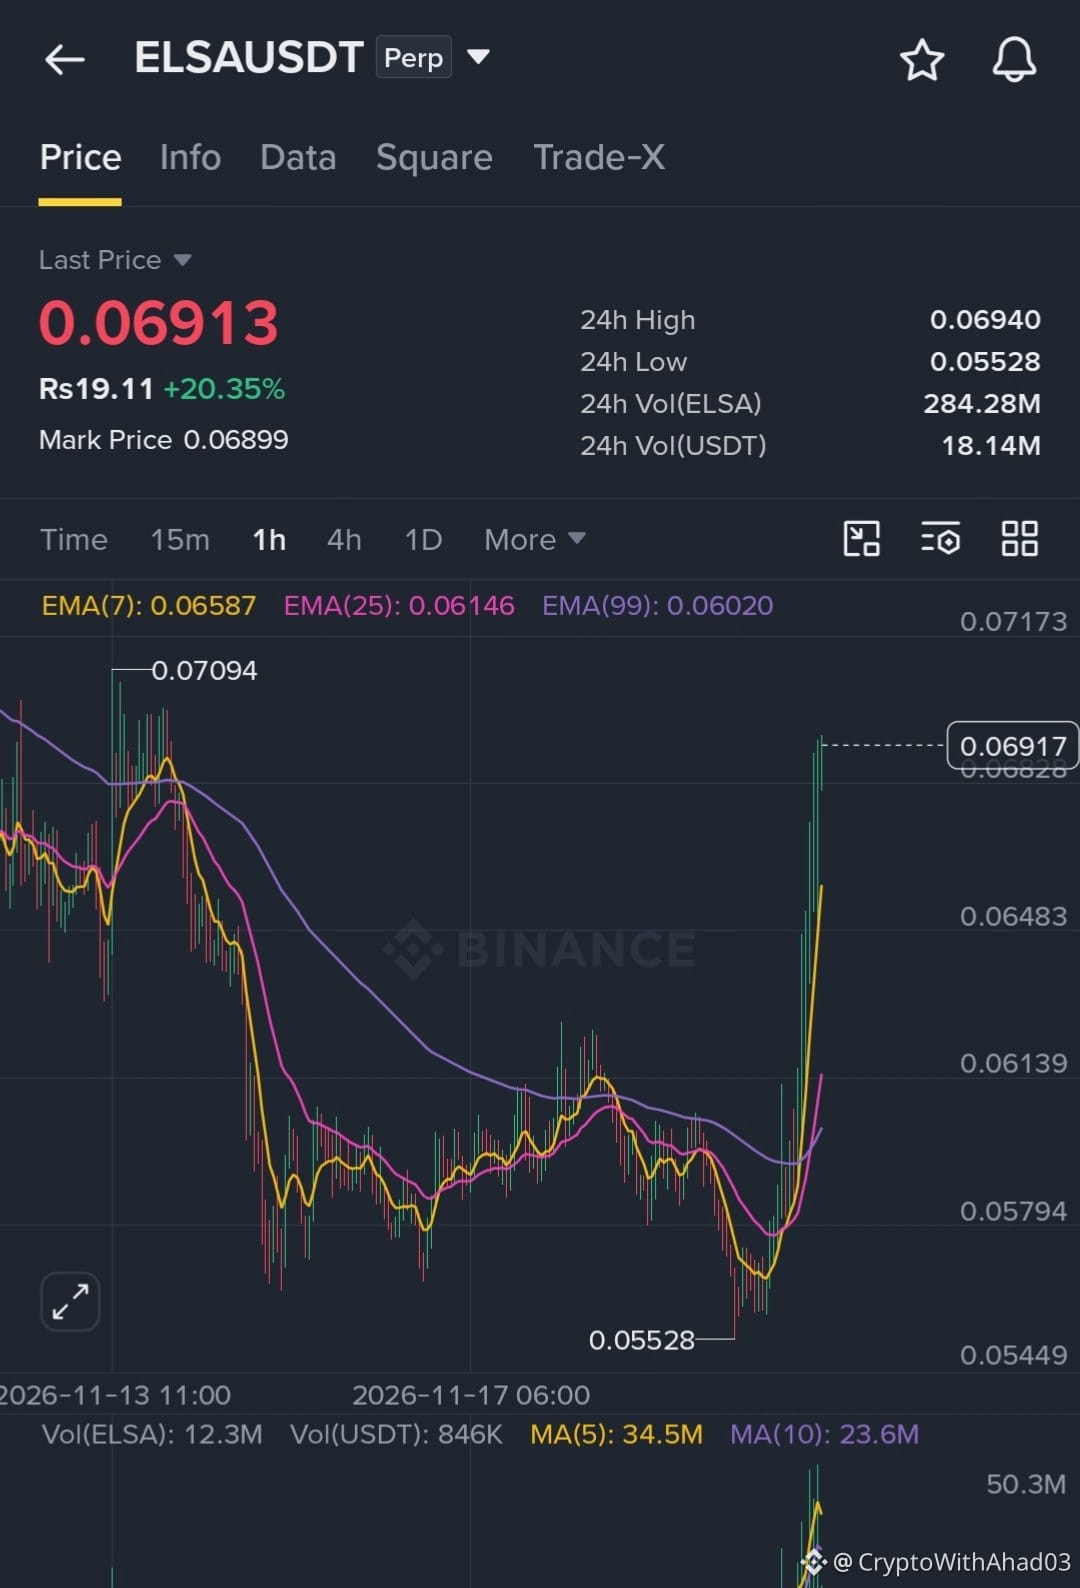
🚀 $ELSA /USDT – VIP LONG SIGNAL | MASSIVE BULLISH BREAKOUT!
🟢 TRADE: LONG (PULLBACK ENTRY)
🎯 Entry Zone: 0.06550 – 0.06650
🛑 Stop Loss: 0.06380
💰 TAKE PROFIT TARGETS:
🥇 TP1: 0.06940
🥈 TP2: 0.07094
🥉 TP3: 0.07170
⏳ Timeframe: 1H
⚠️ Entry only after bullish confirmation in the pullback zone. Do not chase the current pump.
━━━━━━━━━━━━━━━━
📊 $ELSA MARKET OVERVIEW
Current Price: $0.06913
24H Change: +20.35%
24H High: $0.06940
24H Volume: $18.14M USDT
EMA 7: 0.06587
EMA 25: 0.06146
EMA 99: 0.06020
RSI (6): 95.65
🔥 WHY I'M WATCHING ELSA
1️⃣ Strong bullish breakout with a significant increase in trading volume.
2️⃣ Price has moved above all three major EMAs, indicating a bullish structure.
3️⃣ EMA 7 is above EMA 25 and EMA 99, showing positive trend alignment.
4️⃣ Buyers have taken control after an extended consolidation phase.
5️⃣ However, RSI at 95.65 indicates extremely overbought conditions, making a short-term pullback possible.
📈 BULLISH SCENARIO
If ELSA maintains support around 0.06550–0.06650 and buyers return with strong volume, another attempt toward 0.06940 and 0.07094 could develop.
A confirmed breakout above 0.07094 could open the way toward 0.07170.
❌ TRADE INVALIDATION
A strong 1H close below 0.06380 invalidates this particular LONG setup.
💡 MY FINAL MARKET VIEW
ELSA has demonstrated impressive bullish momentum, but entering after a massive green candle can be dangerous.
My strategy is simple: wait for a healthy pullback, look for confirmation, and then consider the LONG opportunity.
Don't chase the pump. Trade the confirmation.
👇 LET'S DISCUSS!
Are you bullish on $ELSA, or do you expect a deeper correction before the next move?
Share your entry and target in the comments!
⚠️ Risk management is essential. Suggested risk: maximum 1% of trading capital.
NFA | DYOR
$ELSA
#ELSA #ELSAUSDT #CryptoTrading #BinanceSquare #TradingSignals #Altcoins #TechnicalAnalysis_Tickeron
{future}(ELSAUSDT)
🚀 $ELSA /USDT – VIP LONG SIGNAL | MASSIVE BULLISH BREAKOUT!
🟢 TRADE: LONG (PULLBACK ENTRY)
🎯 Entry Zone: 0.06550 – 0.06650
🛑 Stop Loss: 0.06380
💰 TAKE PROFIT TARGETS:
🥇 TP1: 0.06940
🥈 TP2: 0.07094
🥉 TP3: 0.07170
⏳ Timeframe: 1H
⚠️ Entry only after bullish confirmation in the pullback zone. Do not chase the current pump.
━━━━━━━━━━━━━━━━
📊 $ELSA MARKET OVERVIEW
Current Price: $0.06913
24H Change: +20.35%
24H High: $0.06940
24H Volume: $18.14M USDT
EMA 7: 0.06587
EMA 25: 0.06146
EMA 99: 0.06020
RSI (6): 95.65
🔥 WHY I'M WATCHING ELSA
1️⃣ Strong bullish breakout with a significant increase in trading volume.
2️⃣ Price has moved above all three major EMAs, indicating a bullish structure.
3️⃣ EMA 7 is above EMA 25 and EMA 99, showing positive trend alignment.
4️⃣ Buyers have taken control after an extended consolidation phase.
5️⃣ However, RSI at 95.65 indicates extremely overbought conditions, making a short-term pullback possible.
📈 BULLISH SCENARIO
If ELSA maintains support around 0.06550–0.06650 and buyers return with strong volume, another attempt toward 0.06940 and 0.07094 could develop.
A confirmed breakout above 0.07094 could open the way toward 0.07170.
❌ TRADE INVALIDATION
A strong 1H close below 0.06380 invalidates this particular LONG setup.
💡 MY FINAL MARKET VIEW
ELSA has demonstrated impressive bullish momentum, but entering after a massive green candle can be dangerous.
My strategy is simple: wait for a healthy pullback, look for confirmation, and then consider the LONG opportunity.
Don't chase the pump. Trade the confirmation.
👇 LET'S DISCUSS!
Are you bullish on $ELSA , or do you expect a deeper correction before the next move?
Share your entry and target in the comments!
⚠️ Risk management is essential. Suggested risk: maximum 1% of trading capital.
NFA | DYOR
$ELSA
#ELSA #ELSAUSDT #CryptoTrading #BinanceSquare #TradingSignals #Altcoins #TechnicalAnalysis_Tickeron
🟢 TRADE: LONG (PULLBACK ENTRY)
🎯 Entry Zone: 0.06550 – 0.06650
🛑 Stop Loss: 0.06380
💰 TAKE PROFIT TARGETS:
🥇 TP1: 0.06940
🥈 TP2: 0.07094
🥉 TP3: 0.07170
⏳ Timeframe: 1H
⚠️ Entry only after bullish confirmation in the pullback zone. Do not chase the current pump.
━━━━━━━━━━━━━━━━
📊 $ELSA MARKET OVERVIEW
Current Price: $0.06913
24H Change: +20.35%
24H High: $0.06940
24H Volume: $18.14M USDT
EMA 7: 0.06587
EMA 25: 0.06146
EMA 99: 0.06020
RSI (6): 95.65
🔥 WHY I'M WATCHING ELSA
1️⃣ Strong bullish breakout with a significant increase in trading volume.
2️⃣ Price has moved above all three major EMAs, indicating a bullish structure.
3️⃣ EMA 7 is above EMA 25 and EMA 99, showing positive trend alignment.
4️⃣ Buyers have taken control after an extended consolidation phase.
5️⃣ However, RSI at 95.65 indicates extremely overbought conditions, making a short-term pullback possible.
📈 BULLISH SCENARIO
If ELSA maintains support around 0.06550–0.06650 and buyers return with strong volume, another attempt toward 0.06940 and 0.07094 could develop.
A confirmed breakout above 0.07094 could open the way toward 0.07170.
❌ TRADE INVALIDATION
A strong 1H close below 0.06380 invalidates this particular LONG setup.
💡 MY FINAL MARKET VIEW
ELSA has demonstrated impressive bullish momentum, but entering after a massive green candle can be dangerous.
My strategy is simple: wait for a healthy pullback, look for confirmation, and then consider the LONG opportunity.
Don't chase the pump. Trade the confirmation.
👇 LET'S DISCUSS!
Are you bullish on $ELSA , or do you expect a deeper correction before the next move?
Share your entry and target in the comments!
⚠️ Risk management is essential. Suggested risk: maximum 1% of trading capital.
NFA | DYOR
$ELSA
#ELSA #ELSAUSDT #CryptoTrading #BinanceSquare #TradingSignals #Altcoins #TechnicalAnalysis_Tickeron
108
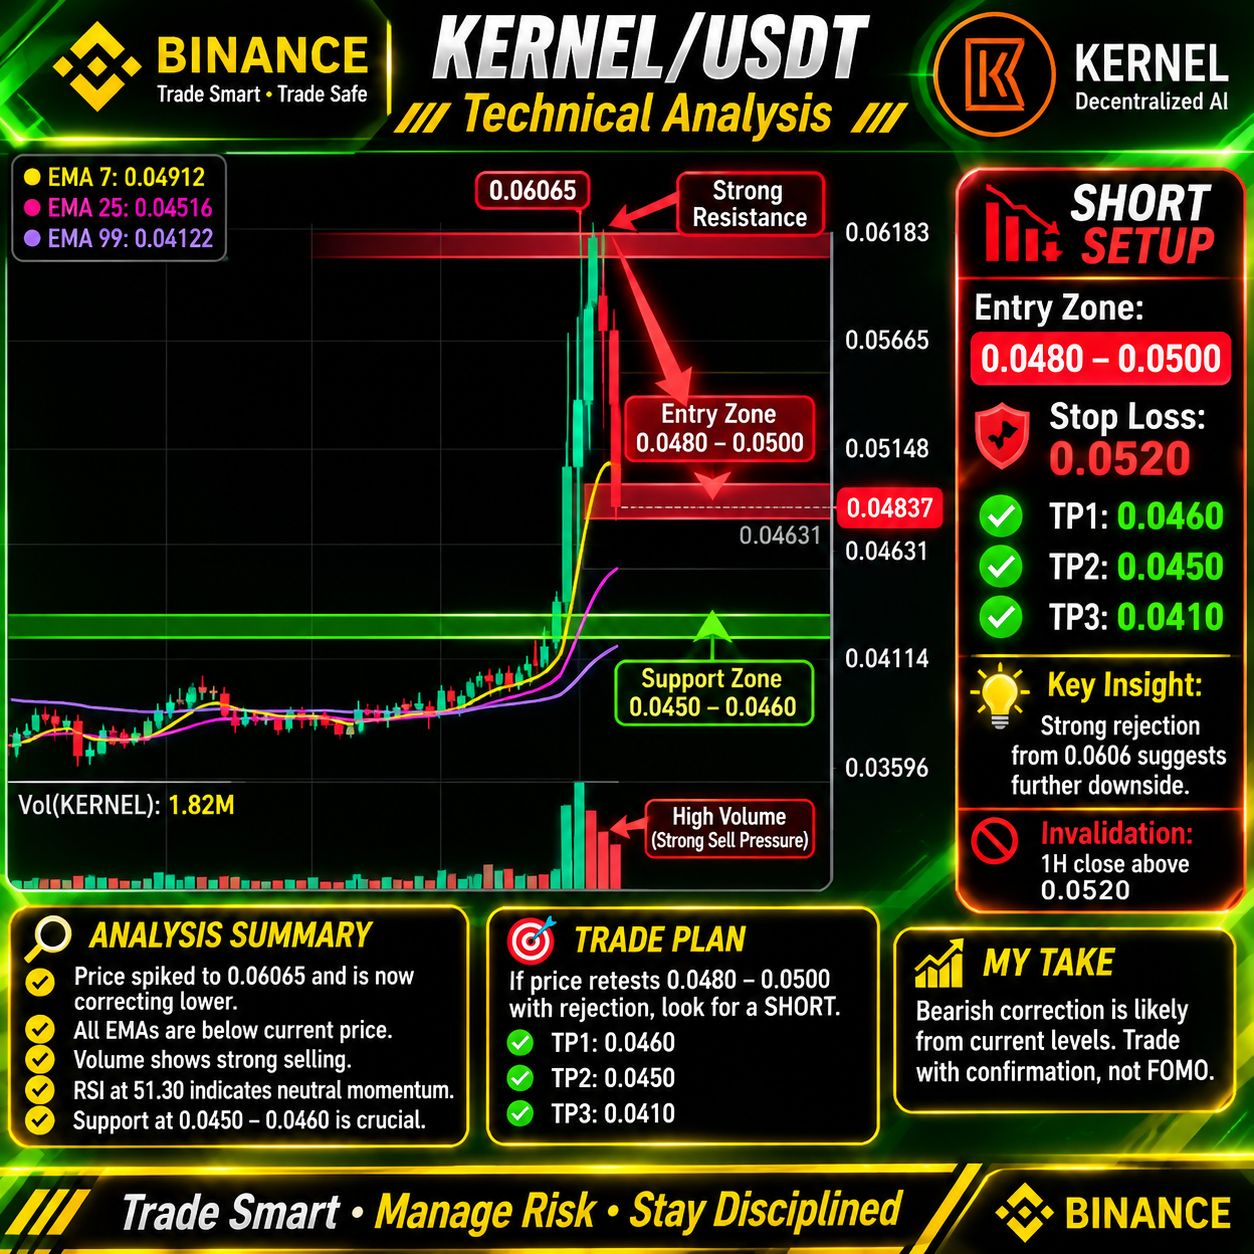
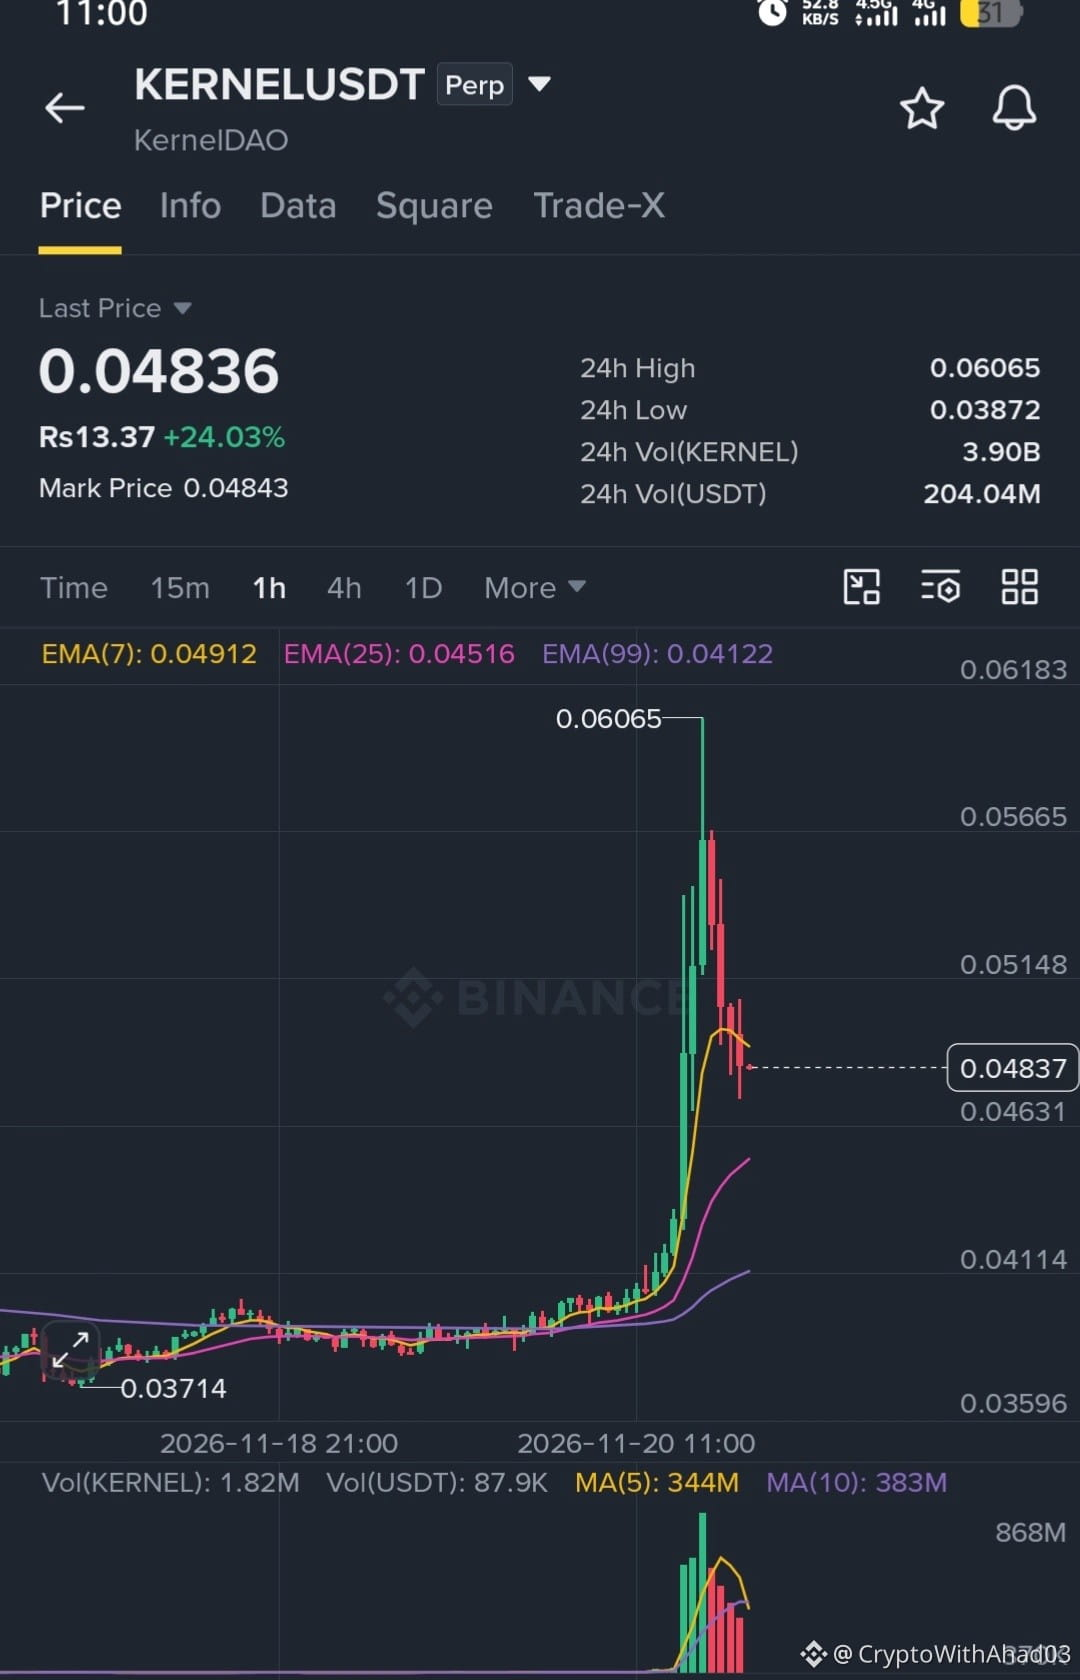
🚨 $KERNEL /USDT – VIP SHORT SIGNAL
🔴 TRADE: SHORT
🎯 Entry Zone: 0.04880 – 0.05000
🛑 Stop Loss: 0.05200
💰 TAKE PROFIT TARGETS:
🥇 TP1: 0.04600
🥈 TP2: 0.04500
🥉 TP3: 0.04120
⏳ Timeframe: 1H
⚠️ Entry only after bearish rejection from the entry zone.
━━━━━━━━━━━━━━━━
📊 MARKET OVERVIEW
Current Price: $0.04836
24H Change: +24.03%
24H High: $0.06065
EMA 7: 0.04912
EMA 25: 0.04516
EMA 99: 0.04122
RSI (6): 51.30
🔍 WHY I'M WATCHING THIS SHORT
• $KERNEL experienced a massive bullish breakout.
• Price faced strong rejection near $0.06065.
• Short-term momentum weakened below EMA 7.
• Selling pressure increased after the rally.
• RSI has cooled down toward neutral territory.
📉 BEARISH SCENARIO
If price retests 0.04880–0.05000 and gets rejected, another move toward 0.04600 and 0.04500 could develop.
🚀 BULLISH INVALIDATION
A strong 1H candle close above 0.05200 invalidates this short setup.
💡 MY FINAL VIEW
After such an aggressive rally, profit-taking and further correction remain possible.
I'm watching the resistance zone for a confirmed SHORT opportunity rather than chasing the market.
⚠️ Manage your risk. Never enter without confirmation. Risk only what you can afford to lose.
Are you Team LONG or Team SHORT on $KERNEL?
NFA | DYOR
#KERNEL #KERNELUSDT #BinanceSquare #CryptoTrading #TradingSignals #TechnicalAnalysis #ALTCOİNS $KERNEL
{future}(KERNELUSDT)
🚨 $KERNEL /USDT – VIP SHORT SIGNAL
🔴 TRADE: SHORT
🎯 Entry Zone: 0.04880 – 0.05000
🛑 Stop Loss: 0.05200
💰 TAKE PROFIT TARGETS:
🥇 TP1: 0.04600
🥈 TP2: 0.04500
🥉 TP3: 0.04120
⏳ Timeframe: 1H
⚠️ Entry only after bearish rejection from the entry zone.
━━━━━━━━━━━━━━━━
📊 MARKET OVERVIEW
Current Price: $0.04836
24H Change: +24.03%
24H High: $0.06065
EMA 7: 0.04912
EMA 25: 0.04516
EMA 99: 0.04122
RSI (6): 51.30
🔍 WHY I'M WATCHING THIS SHORT
• $KERNEL experienced a massive bullish breakout.
• Price faced strong rejection near $0.06065.
• Short-term momentum weakened below EMA 7.
• Selling pressure increased after the rally.
• RSI has cooled down toward neutral territory.
📉 BEARISH SCENARIO
If price retests 0.04880–0.05000 and gets rejected, another move toward 0.04600 and 0.04500 could develop.
🚀 BULLISH INVALIDATION
A strong 1H candle close above 0.05200 invalidates this short setup.
💡 MY FINAL VIEW
After such an aggressive rally, profit-taking and further correction remain possible.
I'm watching the resistance zone for a confirmed SHORT opportunity rather than chasing the market.
⚠️ Manage your risk. Never enter without confirmation. Risk only what you can afford to lose.
Are you Team LONG or Team SHORT on $KERNEL ?
NFA | DYOR
#KERNEL #KERNELUSDT #BinanceSquare #CryptoTrading #TradingSignals #TechnicalAnalysis #ALTCOİNS $KERNEL
🔴 TRADE: SHORT
🎯 Entry Zone: 0.04880 – 0.05000
🛑 Stop Loss: 0.05200
💰 TAKE PROFIT TARGETS:
🥇 TP1: 0.04600
🥈 TP2: 0.04500
🥉 TP3: 0.04120
⏳ Timeframe: 1H
⚠️ Entry only after bearish rejection from the entry zone.
━━━━━━━━━━━━━━━━
📊 MARKET OVERVIEW
Current Price: $0.04836
24H Change: +24.03%
24H High: $0.06065
EMA 7: 0.04912
EMA 25: 0.04516
EMA 99: 0.04122
RSI (6): 51.30
🔍 WHY I'M WATCHING THIS SHORT
• $KERNEL experienced a massive bullish breakout.
• Price faced strong rejection near $0.06065.
• Short-term momentum weakened below EMA 7.
• Selling pressure increased after the rally.
• RSI has cooled down toward neutral territory.
📉 BEARISH SCENARIO
If price retests 0.04880–0.05000 and gets rejected, another move toward 0.04600 and 0.04500 could develop.
🚀 BULLISH INVALIDATION
A strong 1H candle close above 0.05200 invalidates this short setup.
💡 MY FINAL VIEW
After such an aggressive rally, profit-taking and further correction remain possible.
I'm watching the resistance zone for a confirmed SHORT opportunity rather than chasing the market.
⚠️ Manage your risk. Never enter without confirmation. Risk only what you can afford to lose.
Are you Team LONG or Team SHORT on $KERNEL ?
NFA | DYOR
#KERNEL #KERNELUSDT #BinanceSquare #CryptoTrading #TradingSignals #TechnicalAnalysis #ALTCOİNS $KERNEL
111
$CYBER hit their target
big profit
follow me to print the money
$CYBER
{future}(CYBERUSDT)
$CYBER hit their target
big profit
follow me to print the money
$CYBER
big profit
follow me to print the money
$CYBER
176
$AKE usdt hit their first target
$AKE
{future}(AKEUSDT)
$AKE usdt hit their first target
$AKE
$AKE
376
$AKE — Whales Are Buying, But Shorts Are Crushing!
AKE has plunged 61% from $0.0181 to $0.00705. 📉
🐋 100 Long Whales: $541K in losses, only 7% profitable.
🔴 91 Short Whales: $705K in profits, 80% winning.
Interestingly, whale longs surged from 29% to 45% in just 7 days.
⚠️ My outlook:
* Below $0.00667 → Another brutal dump?
* Above $0.0083 → Potential bullish reversal.
Are whales catching the bottom or falling into another trap? 👀
$AKE — Whales Are Buying, But Shorts Are Crushing!
AKE has plunged 61% from $0.0181 to $0.00705. 📉
🐋 100 Long Whales: $541K in losses, only 7% profitable.
🔴 91 Short Whales: $705K in profits, 80% winning.
Interestingly, whale longs surged from 29% to 45% in just 7 days.
⚠️ My outlook:
* Below $0.00667 → Another brutal dump?
* Above $0.0083 → Potential bullish reversal.
Are whales catching the bottom or falling into another trap? 👀
AKE has plunged 61% from $0.0181 to $0.00705. 📉
🐋 100 Long Whales: $541K in losses, only 7% profitable.
🔴 91 Short Whales: $705K in profits, 80% winning.
Interestingly, whale longs surged from 29% to 45% in just 7 days.
⚠️ My outlook:
* Below $0.00667 → Another brutal dump?
* Above $0.0083 → Potential bullish reversal.
Are whales catching the bottom or falling into another trap? 👀
1
15
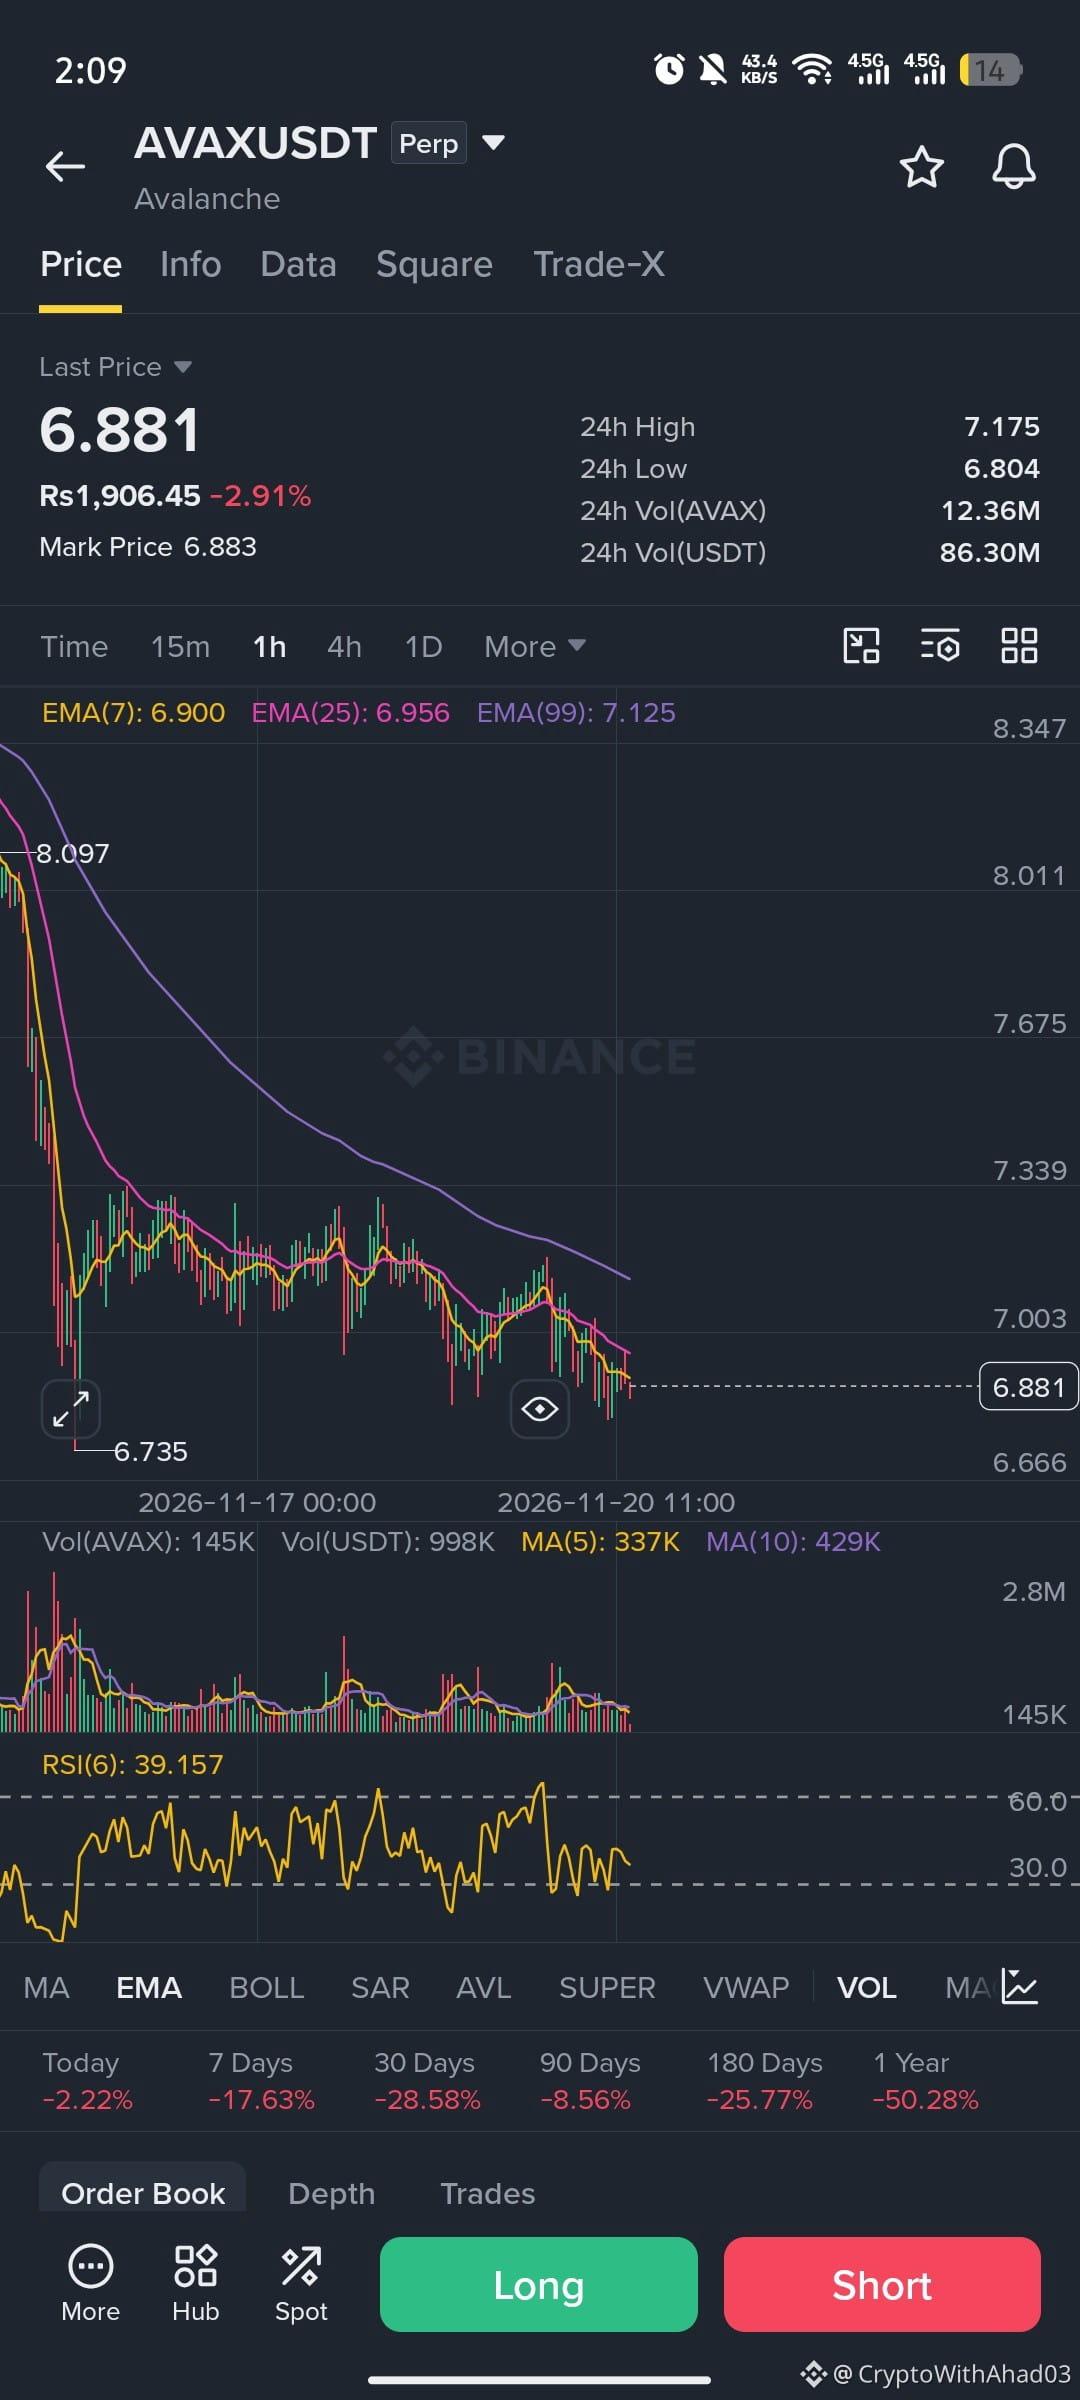
AVAX$AVAX – BEARISH MOMENTUM | VIP SHORT TRADE SETUP
Avalanche (AVAX) is showing continued bearish pressure on the 1H timeframe, with price struggling to reclaim its key moving averages.
📊 MARKET OVERVIEW
Current Price: $6.881
24H Change: -2.91%
EMA 7: $6.900
EMA 25: $6.956
EMA 99: $7.125
RSI (6): 39.15
🔍 TECHNICAL ANALYSIS
1️⃣ Price is trading below all three major EMAs, indicating a bearish market structure.
2️⃣ EMA 7 remains below EMA 25, showing continued short-term weakness.
3️⃣ EMA 99 at $7.125 acts as major dynamic resistance.
4️⃣ RSI at 39.15 reflects weak buying momentum.
5️⃣ Immediate support is located around $6.804, followed by $6.735.
🎯 VIP TRADE PLAN – SHORT
🔴 Entry Zone: $6.900 – $6.956
🛑 Stop Loss: $7.035
🎯 TAKE PROFIT TARGETS:
🥇 TP1: $6.804
🥈 TP2: $6.735
🥉 TP3: $6.666
⚡ TRADE EXECUTION
Wait for a bearish rejection from the entry zone before opening a SHORT position.
Avoid chasing the current price directly.
TRADE INVALIDATION: A strong 1H candle close above $7.035 weakens this short setup.
📌 MY MARKET VIEW
AVAX remains under bearish pressure as long as it trades below the EMA resistance structure.
A breakdown below $6.804 could open the door for another downward move toward $6.735 and $6.666.
$AVAX
{spot}(AVAXUSDT)
However, a recovery above $6.956 could change the short-term outlook.
⚠️ Trade with proper risk management. Never risk more than you can afford to lose.
Patience. Discipline. Smart Execution.
NFA | DYOR
#AVAX #AVAXUSDT #Avalanche #BinanceSquare #CryptoTrading #TechnicalAnalysis #TradingSignals #ALTCOİNS
AVAX$AVAX – BEARISH MOMENTUM | VIP SHORT TRADE SETUP
Avalanche (AVAX) is showing continued bearish pressure on the 1H timeframe, with price struggling to reclaim its key moving averages.
📊 MARKET OVERVIEW
Current Price: $6.881
24H Change: -2.91%
EMA 7: $6.900
EMA 25: $6.956
EMA 99: $7.125
RSI (6): 39.15
🔍 TECHNICAL ANALYSIS
1️⃣ Price is trading below all three major EMAs, indicating a bearish market structure.
2️⃣ EMA 7 remains below EMA 25, showing continued short-term weakness.
3️⃣ EMA 99 at $7.125 acts as major dynamic resistance.
4️⃣ RSI at 39.15 reflects weak buying momentum.
5️⃣ Immediate support is located around $6.804, followed by $6.735.
🎯 VIP TRADE PLAN – SHORT
🔴 Entry Zone: $6.900 – $6.956
🛑 Stop Loss: $7.035
🎯 TAKE PROFIT TARGETS:
🥇 TP1: $6.804
🥈 TP2: $6.735
🥉 TP3: $6.666
⚡ TRADE EXECUTION
Wait for a bearish rejection from the entry zone before opening a SHORT position.
Avoid chasing the current price directly.
TRADE INVALIDATION: A strong 1H candle close above $7.035 weakens this short setup.
📌 MY MARKET VIEW
AVAX remains under bearish pressure as long as it trades below the EMA resistance structure.
A breakdown below $6.804 could open the door for another downward move toward $6.735 and $6.666.
$AVAX
However, a recovery above $6.956 could change the short-term outlook.
⚠️ Trade with proper risk management. Never risk more than you can afford to lose.
Patience. Discipline. Smart Execution.
NFA | DYOR
#AVAX #AVAXUSDT #Avalanche #BinanceSquare #CryptoTrading #TechnicalAnalysis #TradingSignals #ALTCOİNS
Avalanche (AVAX) is showing continued bearish pressure on the 1H timeframe, with price struggling to reclaim its key moving averages.
📊 MARKET OVERVIEW
Current Price: $6.881
24H Change: -2.91%
EMA 7: $6.900
EMA 25: $6.956
EMA 99: $7.125
RSI (6): 39.15
🔍 TECHNICAL ANALYSIS
1️⃣ Price is trading below all three major EMAs, indicating a bearish market structure.
2️⃣ EMA 7 remains below EMA 25, showing continued short-term weakness.
3️⃣ EMA 99 at $7.125 acts as major dynamic resistance.
4️⃣ RSI at 39.15 reflects weak buying momentum.
5️⃣ Immediate support is located around $6.804, followed by $6.735.
🎯 VIP TRADE PLAN – SHORT
🔴 Entry Zone: $6.900 – $6.956
🛑 Stop Loss: $7.035
🎯 TAKE PROFIT TARGETS:
🥇 TP1: $6.804
🥈 TP2: $6.735
🥉 TP3: $6.666
⚡ TRADE EXECUTION
Wait for a bearish rejection from the entry zone before opening a SHORT position.
Avoid chasing the current price directly.
TRADE INVALIDATION: A strong 1H candle close above $7.035 weakens this short setup.
📌 MY MARKET VIEW
AVAX remains under bearish pressure as long as it trades below the EMA resistance structure.
A breakdown below $6.804 could open the door for another downward move toward $6.735 and $6.666.
$AVAX
However, a recovery above $6.956 could change the short-term outlook.
⚠️ Trade with proper risk management. Never risk more than you can afford to lose.
Patience. Discipline. Smart Execution.
NFA | DYOR
#AVAX #AVAXUSDT #Avalanche #BinanceSquare #CryptoTrading #TechnicalAnalysis #TradingSignals #ALTCOİNS
265
{spot}(HYPEUSDT)
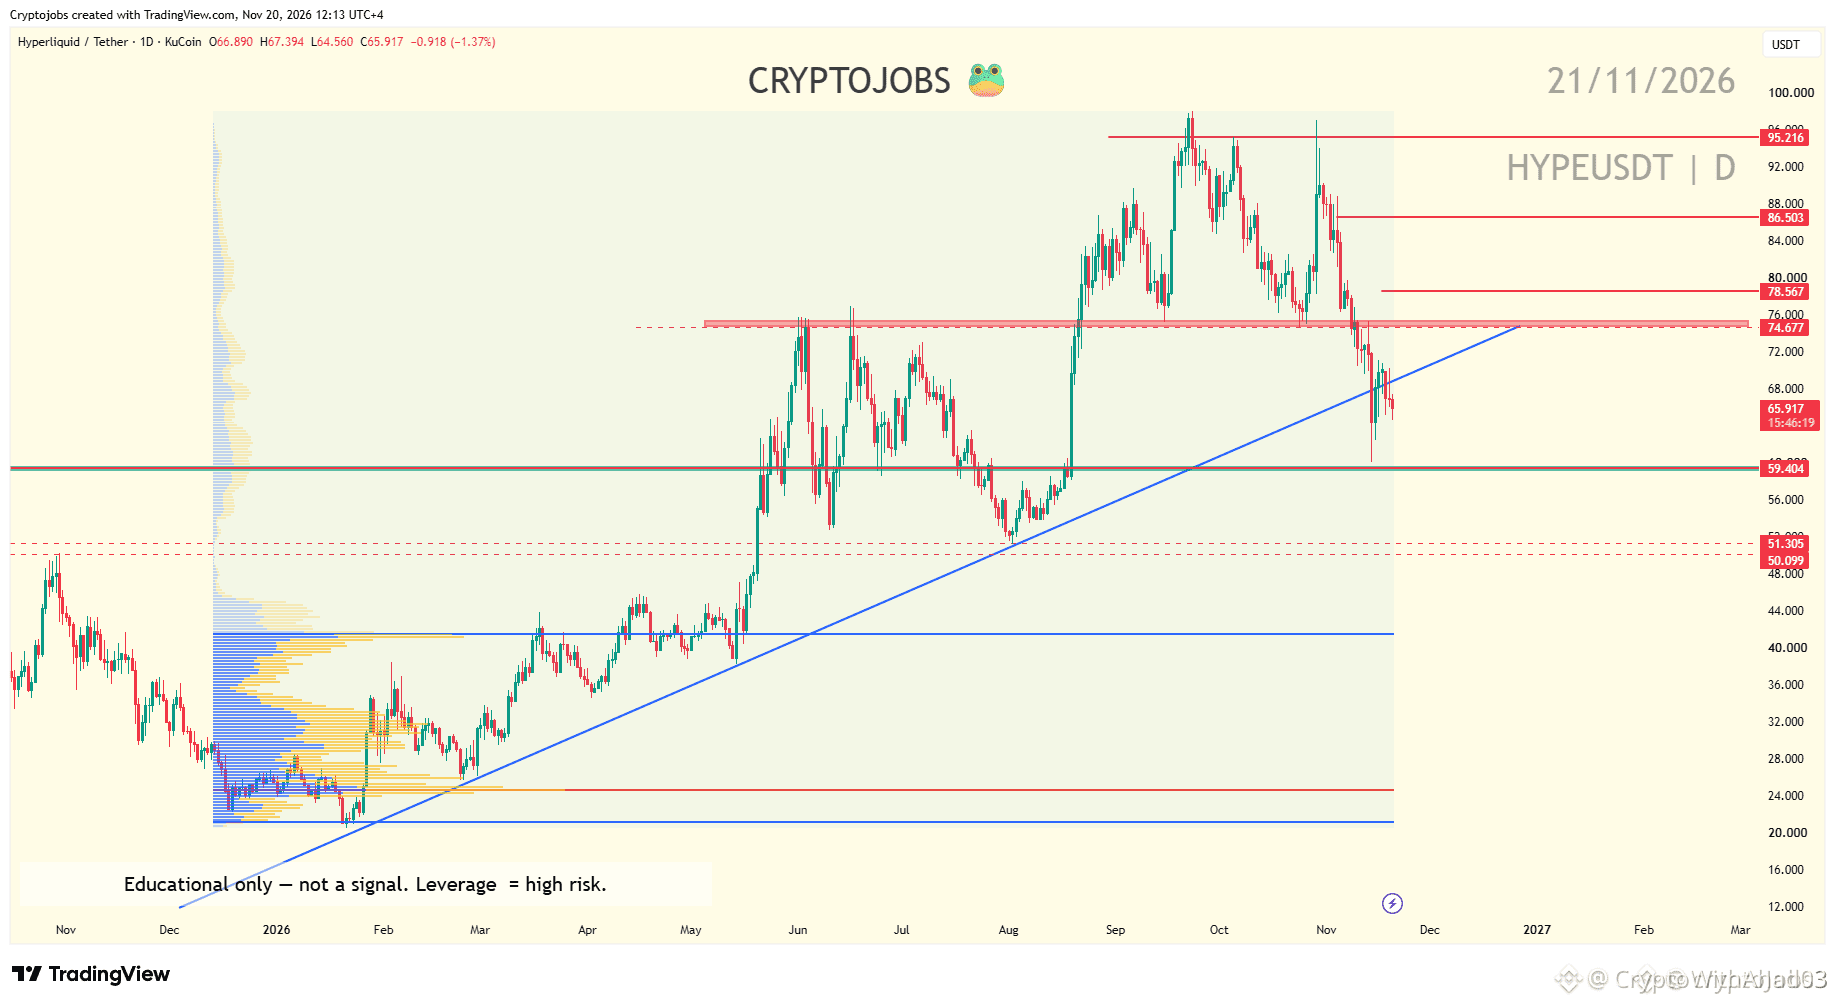
🐻 $HYPE – BEARISH CORRECTION OR THE NEXT BULLISH WAVE? | MARKET ANALYSIS
$HYPE is currently showing a sideways structure on the H1 timeframe, while the higher-timeframe market bias remains bearish.
The key question is whether buyers can defend the $60.00 weekly low or whether another major correction is coming.
📊 KEY MARKET LEVELS
🔴 Resistance Zone:
• $70.50 – Immediate H1 resistance
• $75.00 – Major trend reversal level
• $78.00 – Higher resistance
• $80.00 – Bullish expansion target
🟢 Support Zone:
• $64.70 – H1 range support
• $62.30 – Lower support
• $60.00 – Previous weekly low
• $50.00 – $48.00 – Major downside target (Weekly SSB)
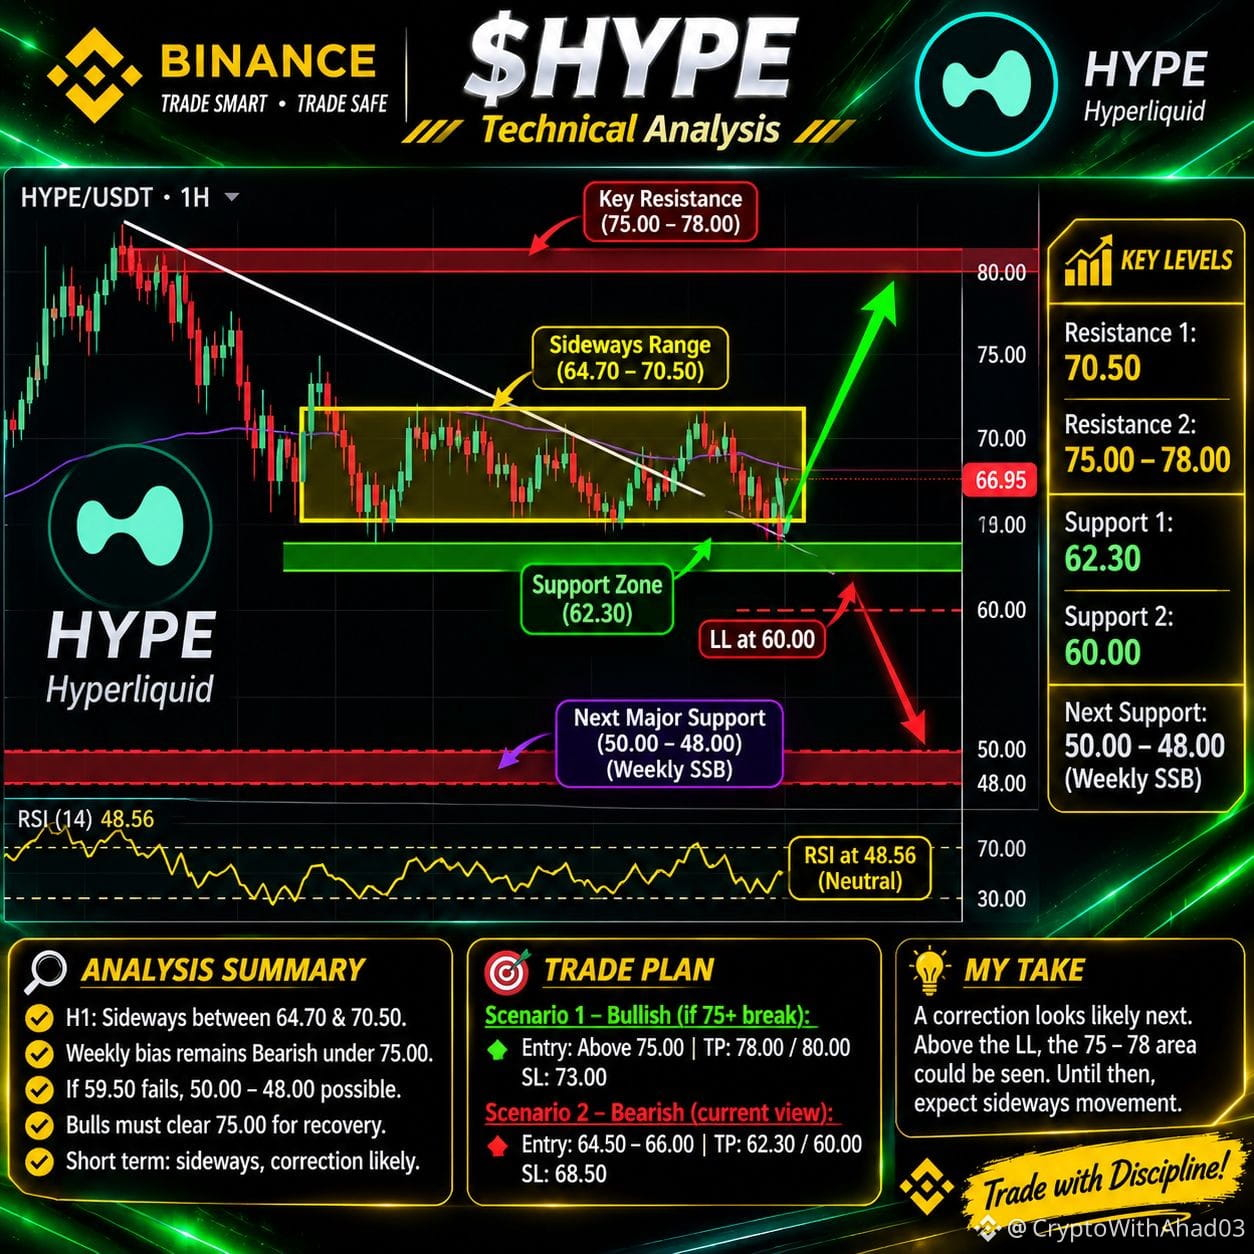
🔍 MY TECHNICAL OUTLOOK
1️⃣ H1 Structure:
Price is moving sideways between $64.70 and $70.50, indicating short-term consolidation.
2️⃣ Higher-Timeframe Trend:
The broader bias remains bearish below the $75.00 level, which previously acted as key support.
3️⃣ Bearish Scenario:
If $59.50 fails to hold, further downside toward $50.00–$48.00 becomes a possibility.
4️⃣ Bullish Scenario:
If buyers defend the $60.00 weekly low and reclaim $75.00, a recovery toward $78.00 and potentially $80.00 could develop.
🎯 IMPORTANT TRADE LEVELS
Bearish Confirmation: Below $59.50
Bullish Confirmation: Above $75.00
Major Bullish Target: $80.00
Major Downside Zone: $50.00–$48.00
⚡ MY PERSONAL MARKET VIEW
I currently favor a bearish correction while $HYPE remains below $75.00.
However, as long as the $60.00 weekly low holds, another bullish wave cannot be ruled out.
Short-term expectation: SIDEWAYS.
Higher-timeframe expectation: BEARISH CORRECTION.
Patience is essential. Let price confirm the next move instead of predicting it blindly.
⚠️ NFA | DYOR | Always manage your risk.
#HYPE #HYPEUSDT #Hyperliquid #CryptoAnalysis #BinanceSquare #TechnicalAnalysis #CryptoTrading #Altcoinseason2024
🐻 $HYPE – BEARISH CORRECTION OR THE NEXT BULLISH WAVE? | MARKET ANALYSIS
$HYPE is currently showing a sideways structure on the H1 timeframe, while the higher-timeframe market bias remains bearish.
The key question is whether buyers can defend the $60.00 weekly low or whether another major correction is coming.
📊 KEY MARKET LEVELS
🔴 Resistance Zone:
• $70.50 – Immediate H1 resistance
• $75.00 – Major trend reversal level
• $78.00 – Higher resistance
• $80.00 – Bullish expansion target
🟢 Support Zone:
• $64.70 – H1 range support
• $62.30 – Lower support
• $60.00 – Previous weekly low
• $50.00 – $48.00 – Major downside target (Weekly SSB)
🔍 MY TECHNICAL OUTLOOK
1️⃣ H1 Structure:
Price is moving sideways between $64.70 and $70.50, indicating short-term consolidation.
2️⃣ Higher-Timeframe Trend:
The broader bias remains bearish below the $75.00 level, which previously acted as key support.
3️⃣ Bearish Scenario:
If $59.50 fails to hold, further downside toward $50.00–$48.00 becomes a possibility.
4️⃣ Bullish Scenario:
If buyers defend the $60.00 weekly low and reclaim $75.00, a recovery toward $78.00 and potentially $80.00 could develop.
🎯 IMPORTANT TRADE LEVELS
Bearish Confirmation: Below $59.50
Bullish Confirmation: Above $75.00
Major Bullish Target: $80.00
Major Downside Zone: $50.00–$48.00
⚡ MY PERSONAL MARKET VIEW
I currently favor a bearish correction while $HYPE remains below $75.00.
However, as long as the $60.00 weekly low holds, another bullish wave cannot be ruled out.
Short-term expectation: SIDEWAYS.
Higher-timeframe expectation: BEARISH CORRECTION.
Patience is essential. Let price confirm the next move instead of predicting it blindly.
⚠️ NFA | DYOR | Always manage your risk.
#HYPE #HYPEUSDT #Hyperliquid #CryptoAnalysis #BinanceSquare #TechnicalAnalysis #CryptoTrading #Altcoinseason2024
$HYPE is currently showing a sideways structure on the H1 timeframe, while the higher-timeframe market bias remains bearish.
The key question is whether buyers can defend the $60.00 weekly low or whether another major correction is coming.
📊 KEY MARKET LEVELS
🔴 Resistance Zone:
• $70.50 – Immediate H1 resistance
• $75.00 – Major trend reversal level
• $78.00 – Higher resistance
• $80.00 – Bullish expansion target
🟢 Support Zone:
• $64.70 – H1 range support
• $62.30 – Lower support
• $60.00 – Previous weekly low
• $50.00 – $48.00 – Major downside target (Weekly SSB)
🔍 MY TECHNICAL OUTLOOK
1️⃣ H1 Structure:
Price is moving sideways between $64.70 and $70.50, indicating short-term consolidation.
2️⃣ Higher-Timeframe Trend:
The broader bias remains bearish below the $75.00 level, which previously acted as key support.
3️⃣ Bearish Scenario:
If $59.50 fails to hold, further downside toward $50.00–$48.00 becomes a possibility.
4️⃣ Bullish Scenario:
If buyers defend the $60.00 weekly low and reclaim $75.00, a recovery toward $78.00 and potentially $80.00 could develop.
🎯 IMPORTANT TRADE LEVELS
Bearish Confirmation: Below $59.50
Bullish Confirmation: Above $75.00
Major Bullish Target: $80.00
Major Downside Zone: $50.00–$48.00
⚡ MY PERSONAL MARKET VIEW
I currently favor a bearish correction while $HYPE remains below $75.00.
However, as long as the $60.00 weekly low holds, another bullish wave cannot be ruled out.
Short-term expectation: SIDEWAYS.
Higher-timeframe expectation: BEARISH CORRECTION.
Patience is essential. Let price confirm the next move instead of predicting it blindly.
⚠️ NFA | DYOR | Always manage your risk.
#HYPE #HYPEUSDT #Hyperliquid #CryptoAnalysis #BinanceSquare #TechnicalAnalysis #CryptoTrading #Altcoinseason2024
1
131
$PHAROS
Recovery Looks Promising!
$PHAROS is recovering strongly. I’m considering a long after a 1h candle closes above $0.6000 and a successful retest confirms support.
entry: 0.6000 – 0.6050
targets: 0.6240 / 0.6500 / 0.6800
sl: 0.5750
NFA. Trade carefully and manage risk.
$PHAROS
Recovery Looks Promising!
$PHAROS is recovering strongly. I’m considering a long after a 1h candle closes above $0.6000 and a successful retest confirms support.
entry: 0.6000 – 0.6050
targets: 0.6240 / 0.6500 / 0.6800
sl: 0.5750
NFA. Trade carefully and manage risk.
Recovery Looks Promising!
$PHAROS is recovering strongly. I’m considering a long after a 1h candle closes above $0.6000 and a successful retest confirms support.
entry: 0.6000 – 0.6050
targets: 0.6240 / 0.6500 / 0.6800
sl: 0.5750
NFA. Trade carefully and manage risk.
34
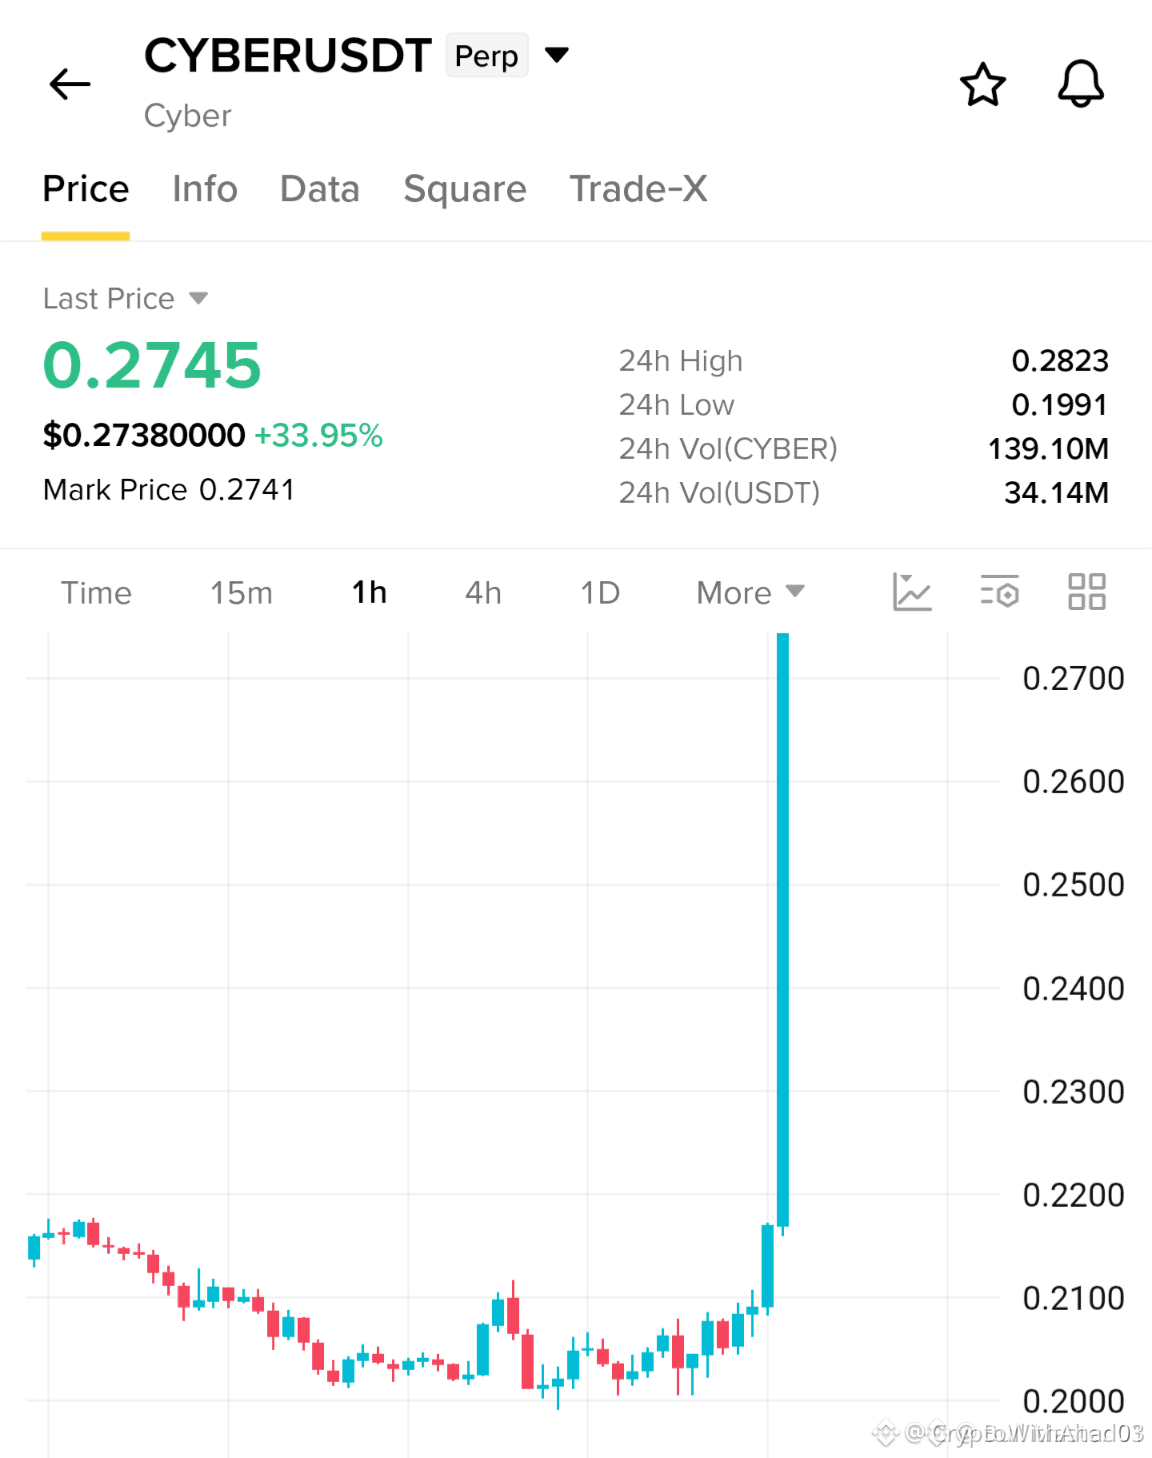
🚀 $CYBER – PARABOLIC BREAKOUT | HIGH-MOMENTUM LONG SETUP
$CYBER is showing impressive bullish momentum, recording a massive +33.95% surge on the 1H timeframe.
Price has aggressively broken out of its previous accumulation zone around $0.2000, signaling a potential shift in short-term market momentum.
📊 MARKET HIGHLIGHTS
🔥 1H Price Surge: +33.95%
💰 Trading Volume: 34M+ USDT
📈 Previous Accumulation Base: $0.2000
🟢 Market Structure: Strong Bullish Momentum
🎯 THE LONG TRADE PLAN
Potential Entry Zone:
$0.2700 – $0.2750
Take Profit Targets:
🥇 TP1: $0.2900
🥈 TP2: $0.3100
🥉 TP3: $0.3350
🛑 Stop Loss: $0.2500
🔍 WHY I'M WATCHING $CYBER
1️⃣ Strong bullish expansion following a prolonged accumulation phase.
2️⃣ A significant volume increase, with 34M+ USDT reported, suggesting increased market participation.
3️⃣ Price has pushed aggressively through previous resistance.
4️⃣ Bullish momentum could support another upward leg if buyers maintain control.
⚡ EXECUTION STRATEGY
• Maximum leverage: 3x–5x (if using leverage).
• Risk only 1–2% of trading capital.
• Avoid chasing an extended green candle.
• Wait for a controlled pullback into the entry zone.
• Secure partial profits at TP1.
• Adjust stop-loss responsibly as the trade develops.
⚠️ IMPORTANT RISK MANAGEMENT
A breakout does not guarantee continuation. If price loses momentum or falls below $0.2500, the bullish setup becomes invalid.
MY FINAL MARKET VIEW:
$CYBER is displaying an aggressive bullish breakout. The next opportunity could come from a healthy pullback followed by renewed buying pressure.
Don't chase the pump. Trade the setup.
🔥 Stay disciplined. Let the market confirm your entry.
NFA | DYOR
#CYBER #CYBERUSDT #CryptoTrading #BinanceSquare #Altcoins #Breakout #BullishMomentum #TradingSignals📞📞📞👇
{future}(CYBERUSDT)
🚀 $CYBER – PARABOLIC BREAKOUT | HIGH-MOMENTUM LONG SETUP
$CYBER is showing impressive bullish momentum, recording a massive +33.95% surge on the 1H timeframe.
Price has aggressively broken out of its previous accumulation zone around $0.2000, signaling a potential shift in short-term market momentum.
📊 MARKET HIGHLIGHTS
🔥 1H Price Surge: +33.95%
💰 Trading Volume: 34M+ USDT
📈 Previous Accumulation Base: $0.2000
🟢 Market Structure: Strong Bullish Momentum
🎯 THE LONG TRADE PLAN
Potential Entry Zone:
$0.2700 – $0.2750
Take Profit Targets:
🥇 TP1: $0.2900
🥈 TP2: $0.3100
🥉 TP3: $0.3350
🛑 Stop Loss: $0.2500
🔍 WHY I'M WATCHING $CYBER
1️⃣ Strong bullish expansion following a prolonged accumulation phase.
2️⃣ A significant volume increase, with 34M+ USDT reported, suggesting increased market participation.
3️⃣ Price has pushed aggressively through previous resistance.
4️⃣ Bullish momentum could support another upward leg if buyers maintain control.
⚡ EXECUTION STRATEGY
• Maximum leverage: 3x–5x (if using leverage).
• Risk only 1–2% of trading capital.
• Avoid chasing an extended green candle.
• Wait for a controlled pullback into the entry zone.
• Secure partial profits at TP1.
• Adjust stop-loss responsibly as the trade develops.
⚠️ IMPORTANT RISK MANAGEMENT
A breakout does not guarantee continuation. If price loses momentum or falls below $0.2500, the bullish setup becomes invalid.
MY FINAL MARKET VIEW:
$CYBER is displaying an aggressive bullish breakout. The next opportunity could come from a healthy pullback followed by renewed buying pressure.
Don't chase the pump. Trade the setup.
🔥 Stay disciplined. Let the market confirm your entry.
NFA | DYOR
#CYBER #CYBERUSDT #CryptoTrading #BinanceSquare #Altcoins #Breakout #BullishMomentum #TradingSignals📞📞📞👇
$CYBER is showing impressive bullish momentum, recording a massive +33.95% surge on the 1H timeframe.
Price has aggressively broken out of its previous accumulation zone around $0.2000, signaling a potential shift in short-term market momentum.
📊 MARKET HIGHLIGHTS
🔥 1H Price Surge: +33.95%
💰 Trading Volume: 34M+ USDT
📈 Previous Accumulation Base: $0.2000
🟢 Market Structure: Strong Bullish Momentum
🎯 THE LONG TRADE PLAN
Potential Entry Zone:
$0.2700 – $0.2750
Take Profit Targets:
🥇 TP1: $0.2900
🥈 TP2: $0.3100
🥉 TP3: $0.3350
🛑 Stop Loss: $0.2500
🔍 WHY I'M WATCHING $CYBER
1️⃣ Strong bullish expansion following a prolonged accumulation phase.
2️⃣ A significant volume increase, with 34M+ USDT reported, suggesting increased market participation.
3️⃣ Price has pushed aggressively through previous resistance.
4️⃣ Bullish momentum could support another upward leg if buyers maintain control.
⚡ EXECUTION STRATEGY
• Maximum leverage: 3x–5x (if using leverage).
• Risk only 1–2% of trading capital.
• Avoid chasing an extended green candle.
• Wait for a controlled pullback into the entry zone.
• Secure partial profits at TP1.
• Adjust stop-loss responsibly as the trade develops.
⚠️ IMPORTANT RISK MANAGEMENT
A breakout does not guarantee continuation. If price loses momentum or falls below $0.2500, the bullish setup becomes invalid.
MY FINAL MARKET VIEW:
$CYBER is displaying an aggressive bullish breakout. The next opportunity could come from a healthy pullback followed by renewed buying pressure.
Don't chase the pump. Trade the setup.
🔥 Stay disciplined. Let the market confirm your entry.
NFA | DYOR
#CYBER #CYBERUSDT #CryptoTrading #BinanceSquare #Altcoins #Breakout #BullishMomentum #TradingSignals📞📞📞👇
286
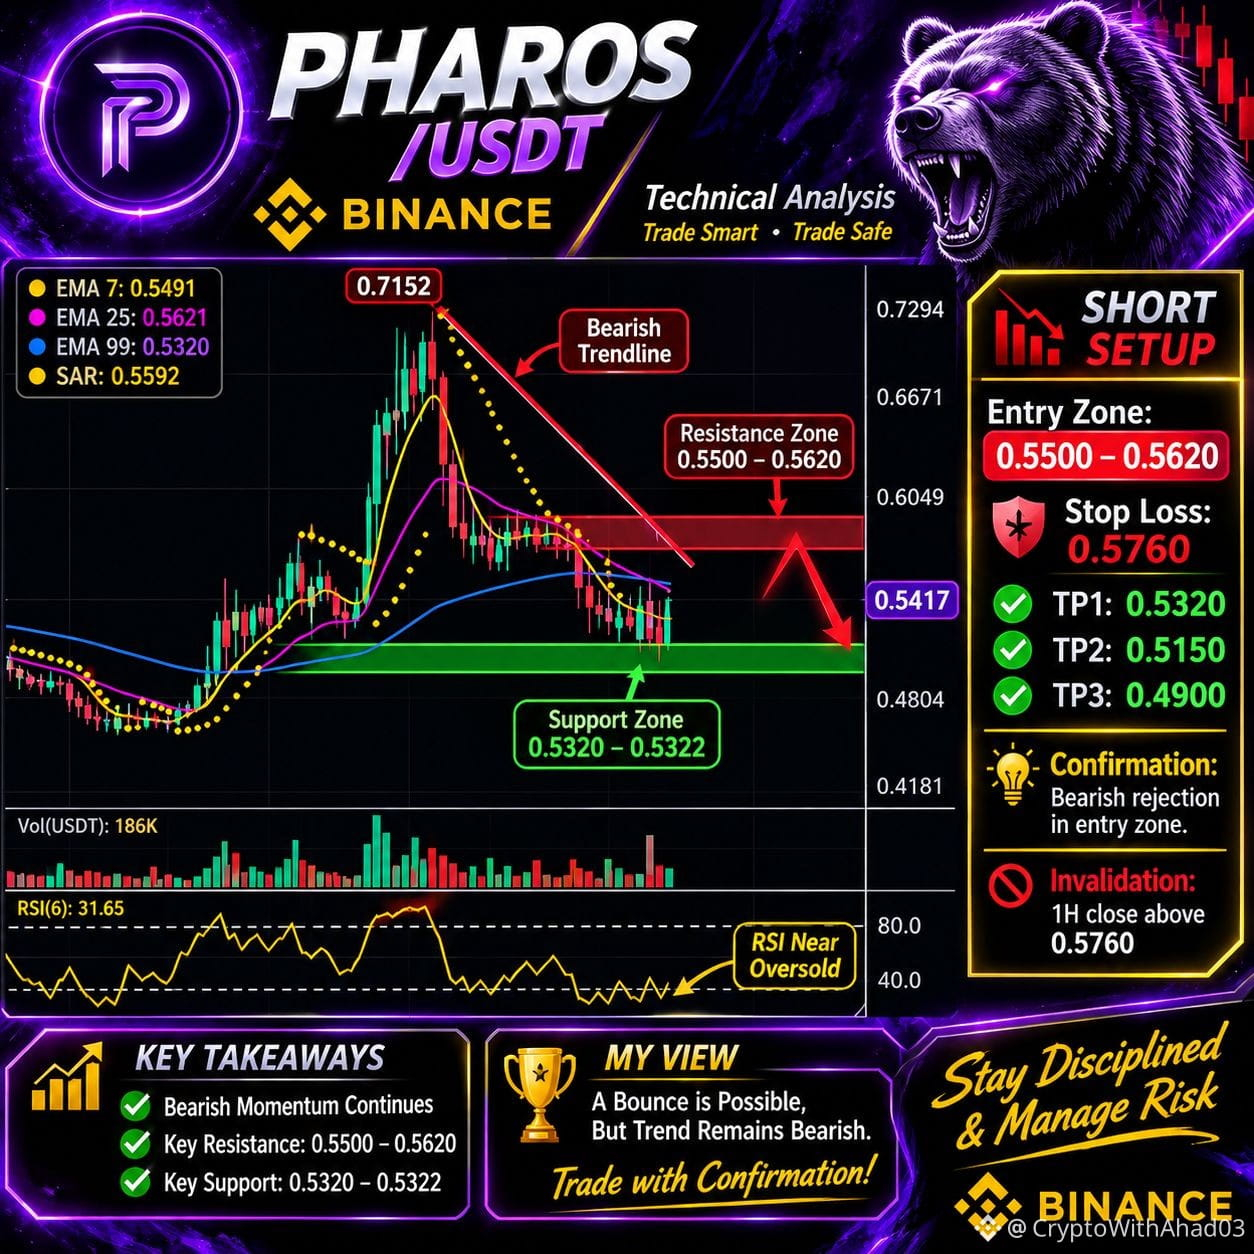
🔴 PHAROSUSDT – MAJOR CORRECTION | VIP SHORT SETUP
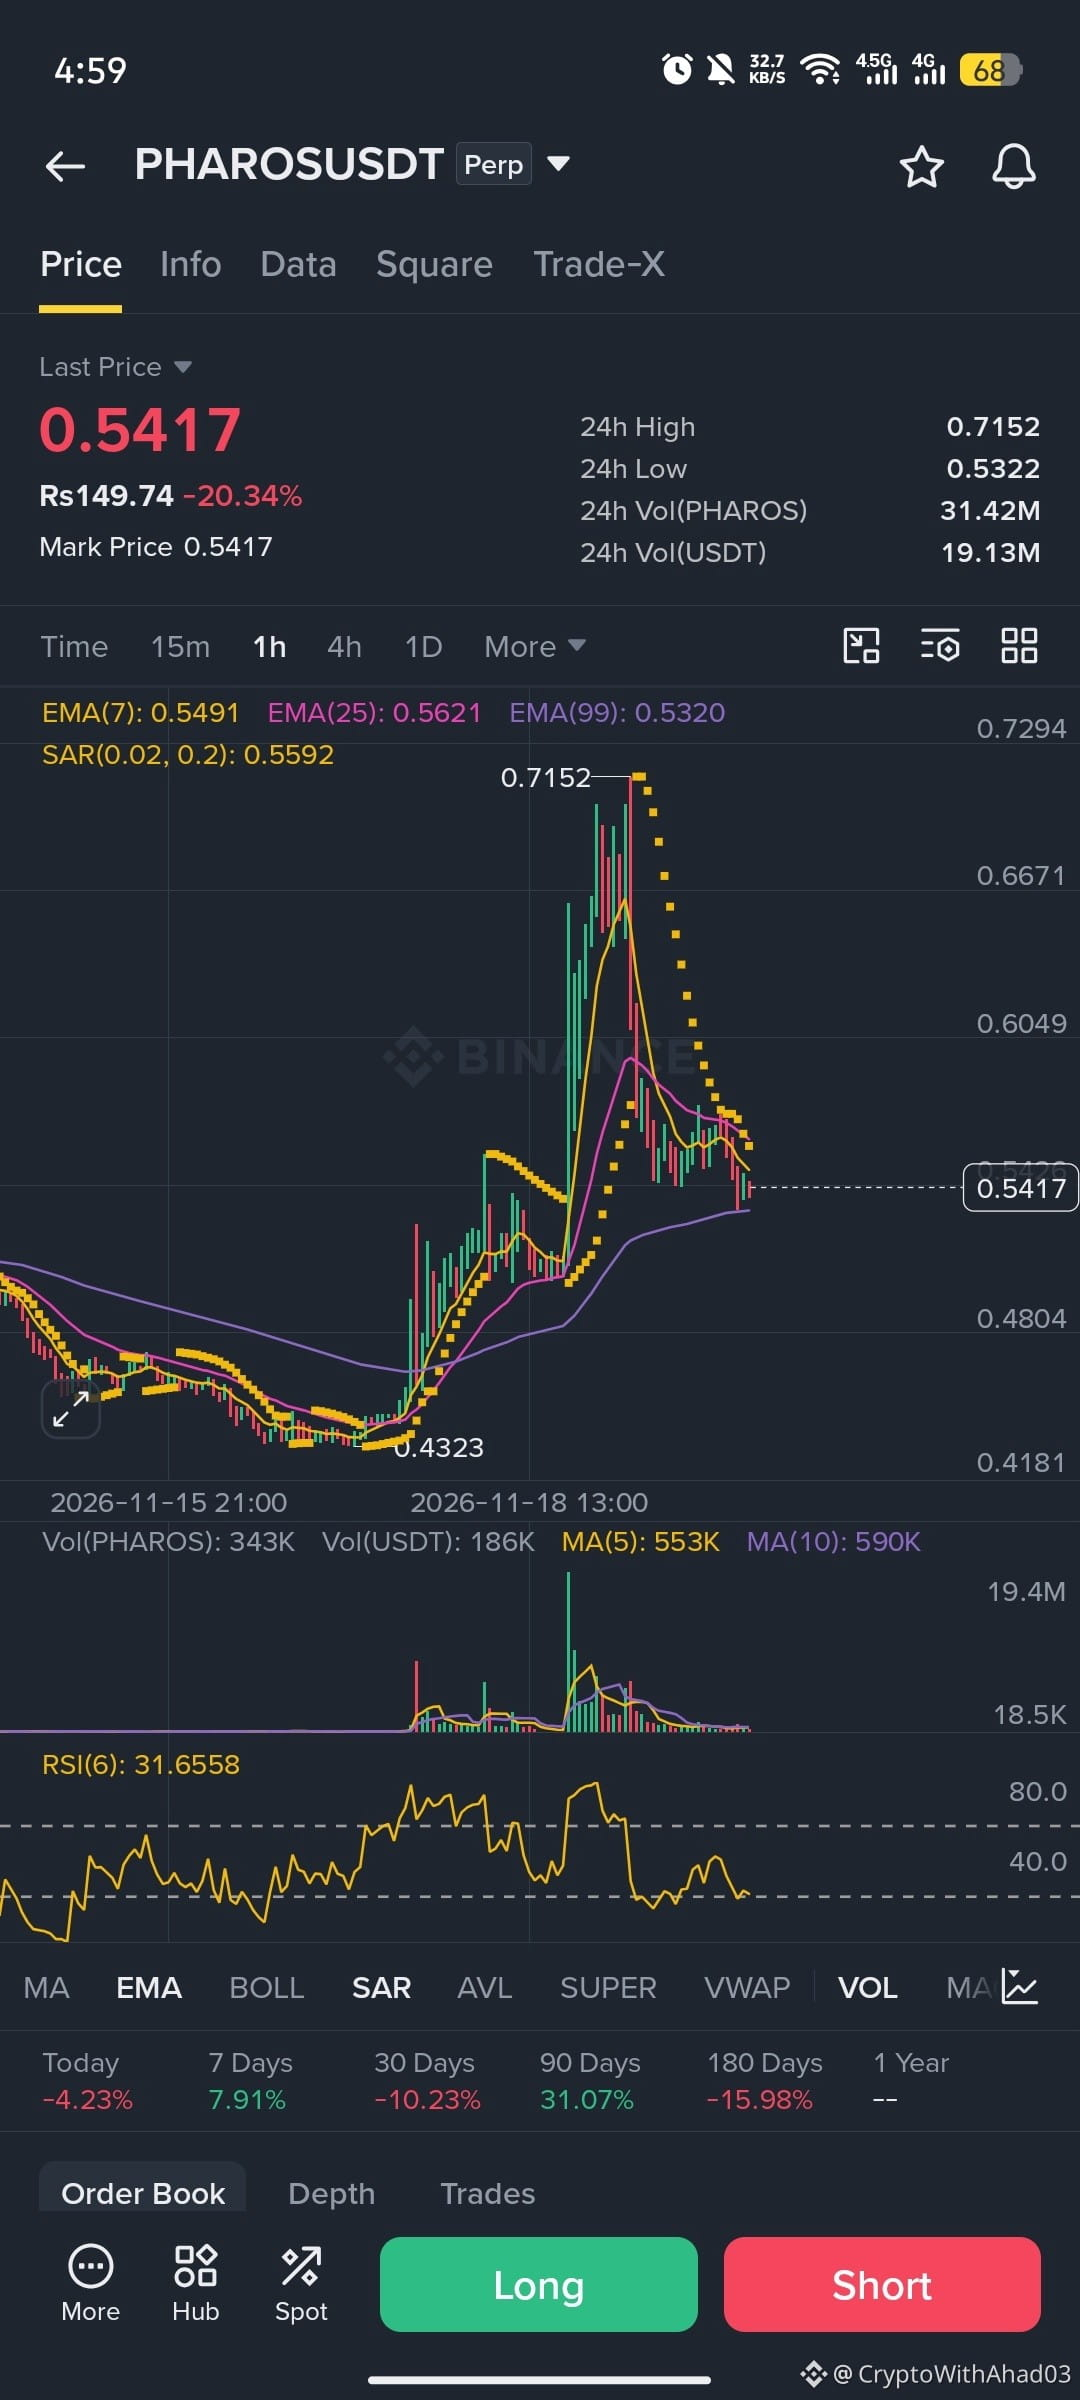
PHAROS is showing significant selling pressure after an aggressive rally toward $0.7152.
Let's break down the 1H chart.
📊 MARKET DATA
Current Price: $0.5417
24H Change: -20.34%
EMA 7: $0.5491
EMA 25: $0.5621
EMA 99: $0.5320
SAR: $0.5592
RSI (6): 31.65
🔍 TECHNICAL ANALYSIS
1. Price is trading below EMA 7 and EMA 25.
2. Parabolic SAR remains above the current price.
3. RSI indicates weak momentum and near-oversold conditions.
4. EMA 99 around $0.5320 is an important support.
5. The recent rally has experienced a strong correction.
🎯 VIP TRADE PLAN – SHORT
Entry Zone: $0.5500 – $0.5620
🛑 Stop Loss: $0.5760
Take Profit Targets:
🥇 TP1: $0.5320
🥈 TP2: $0.5150
🥉 TP3: $0.4900
IMPORTANT CONFIRMATION:
Wait for a relief bounce into the resistance zone and bearish rejection before considering a SHORT entry.
📌 KEY LEVELS
Resistance: $0.5491 – $0.5621
Major Support: $0.5320 – $0.5322
A strong 1H close above $0.5760 invalidates this short setup.
⚠️ MY FINAL MARKET VIEW
PHAROS remains under bearish pressure, but the RSI is approaching oversold territory. A temporary recovery is possible.
I prefer waiting for confirmation rather than chasing the current price.
Trade with discipline. Protect your capital. Manage your risk.
#PHAROS #PHAROSUSDT #CryptoTrading #BinanceSquare #TechnicalAnalysis #TradingSignals #ALTCOİNS
{future}(PHAROSUSDT)
🔴 PHAROSUSDT – MAJOR CORRECTION | VIP SHORT SETUP
PHAROS is showing significant selling pressure after an aggressive rally toward $0.7152.
Let's break down the 1H chart.
📊 MARKET DATA
Current Price: $0.5417
24H Change: -20.34%
EMA 7: $0.5491
EMA 25: $0.5621
EMA 99: $0.5320
SAR: $0.5592
RSI (6): 31.65
🔍 TECHNICAL ANALYSIS
1. Price is trading below EMA 7 and EMA 25.
2. Parabolic SAR remains above the current price.
3. RSI indicates weak momentum and near-oversold conditions.
4. EMA 99 around $0.5320 is an important support.
5. The recent rally has experienced a strong correction.
🎯 VIP TRADE PLAN – SHORT
Entry Zone: $0.5500 – $0.5620
🛑 Stop Loss: $0.5760
Take Profit Targets:
🥇 TP1: $0.5320
🥈 TP2: $0.5150
🥉 TP3: $0.4900
IMPORTANT CONFIRMATION:
Wait for a relief bounce into the resistance zone and bearish rejection before considering a SHORT entry.
📌 KEY LEVELS
Resistance: $0.5491 – $0.5621
Major Support: $0.5320 – $0.5322
A strong 1H close above $0.5760 invalidates this short setup.
⚠️ MY FINAL MARKET VIEW
PHAROS remains under bearish pressure, but the RSI is approaching oversold territory. A temporary recovery is possible.
I prefer waiting for confirmation rather than chasing the current price.
Trade with discipline. Protect your capital. Manage your risk.
#PHAROS #PHAROSUSDT #CryptoTrading #BinanceSquare #TechnicalAnalysis #TradingSignals #ALTCOİNS
PHAROS is showing significant selling pressure after an aggressive rally toward $0.7152.
Let's break down the 1H chart.
📊 MARKET DATA
Current Price: $0.5417
24H Change: -20.34%
EMA 7: $0.5491
EMA 25: $0.5621
EMA 99: $0.5320
SAR: $0.5592
RSI (6): 31.65
🔍 TECHNICAL ANALYSIS
1. Price is trading below EMA 7 and EMA 25.
2. Parabolic SAR remains above the current price.
3. RSI indicates weak momentum and near-oversold conditions.
4. EMA 99 around $0.5320 is an important support.
5. The recent rally has experienced a strong correction.
🎯 VIP TRADE PLAN – SHORT
Entry Zone: $0.5500 – $0.5620
🛑 Stop Loss: $0.5760
Take Profit Targets:
🥇 TP1: $0.5320
🥈 TP2: $0.5150
🥉 TP3: $0.4900
IMPORTANT CONFIRMATION:
Wait for a relief bounce into the resistance zone and bearish rejection before considering a SHORT entry.
📌 KEY LEVELS
Resistance: $0.5491 – $0.5621
Major Support: $0.5320 – $0.5322
A strong 1H close above $0.5760 invalidates this short setup.
⚠️ MY FINAL MARKET VIEW
PHAROS remains under bearish pressure, but the RSI is approaching oversold territory. A temporary recovery is possible.
I prefer waiting for confirmation rather than chasing the current price.
Trade with discipline. Protect your capital. Manage your risk.
#PHAROS #PHAROSUSDT #CryptoTrading #BinanceSquare #TechnicalAnalysis #TradingSignals #ALTCOİNS
1
147
hey everyone follow to join my free community I'll give you the best earning signals
hey everyone follow to join my free community I'll give you the best earning signals
4
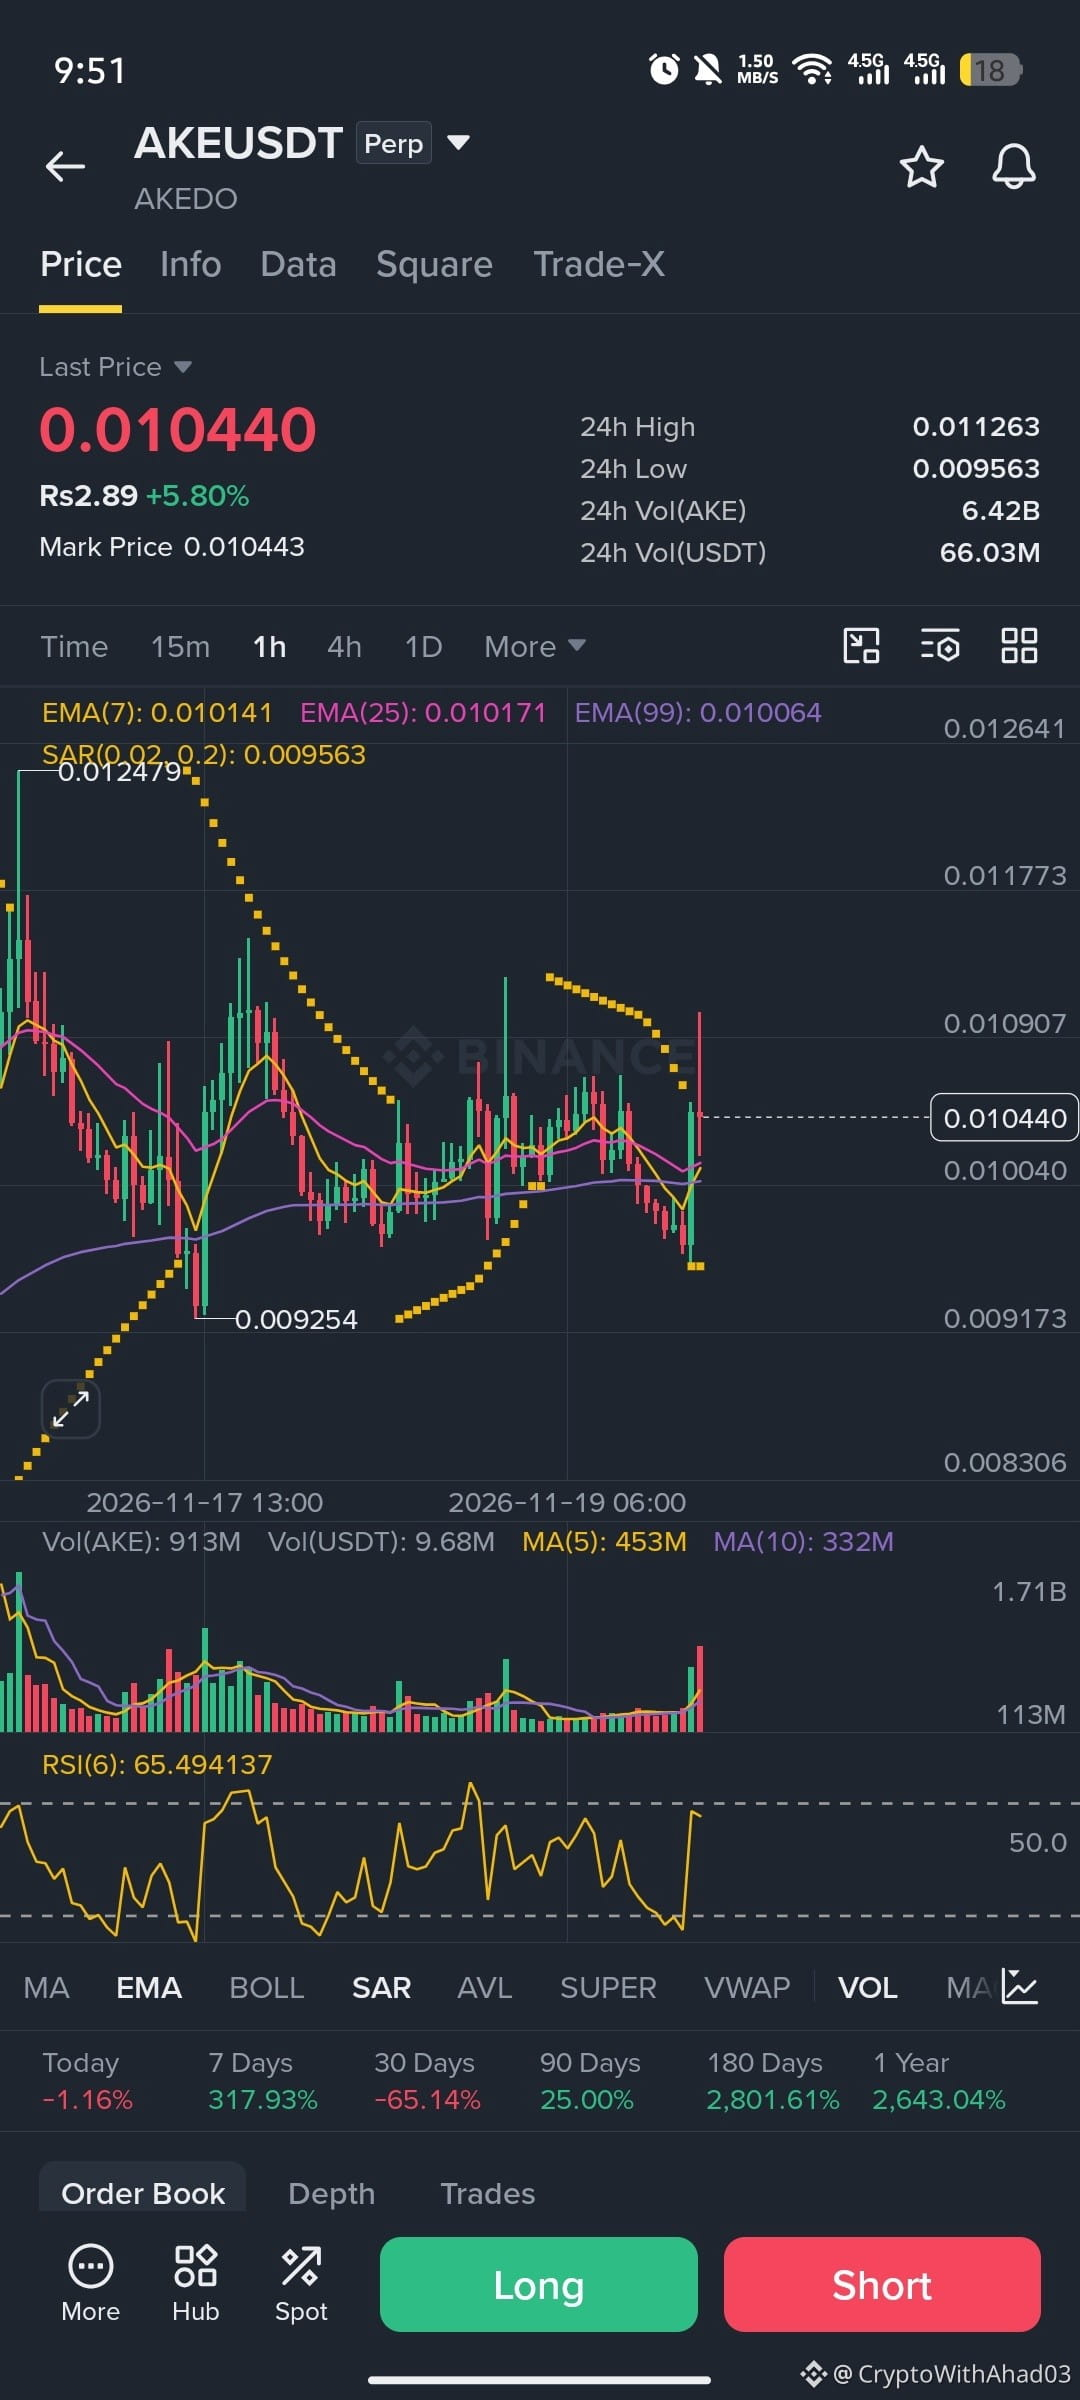
🚀 AKE/USDT – BULLISH REVERSAL SETUP | VIP TRADE ANALYSIS
AKE/USDT is showing interesting bullish momentum on the 1H timeframe.
📊 Technical Analysis:
• Current Price: 0.010440
• EMA 7: 0.010141
• EMA 25: 0.010171
• EMA 99: 0.010064
• RSI (6): 65.49
• SAR: 0.009563
Bullish Signals:
1. Price is trading above all three EMAs.
2. A strong bullish candle appeared with increased trading volume.
3. RSI indicates improving buying momentum.
4. The recent recovery suggests buyers are becoming more active.
🎯 POTENTIAL LONG TRADE PLAN
Entry Zone: 0.01035 – 0.01050
Confirmation: Wait for a 1H candle close above 0.01055 and a successful retest.
🟢 Take Profit Targets:
TP1: 0.01090
TP2: 0.01126
TP3: 0.01170
🔴 Stop Loss: 0.00995
Important Resistance: 0.01090 – 0.01126
Trade Invalidation: A confirmed 1H close below 0.01000 would weaken this bullish setup.
⚠️ My Trading Strategy:
I would prefer waiting for breakout confirmation instead of chasing the current price. Partial profits and proper risk management are essential.
This is a technical analysis scenario, not a guaranteed prediction. Always do your own research and manage risk.
#AKE #AKEUSDT #Binance #CryptoTrading #TechnicalAnalysis #Altcoins #TradingSignals
{future}(AKEUSDT)
{future}(BTCUSDT)
🚀 AKE/USDT – BULLISH REVERSAL SETUP | VIP TRADE ANALYSIS
AKE/USDT is showing interesting bullish momentum on the 1H timeframe.
📊 Technical Analysis:
• Current Price: 0.010440
• EMA 7: 0.010141
• EMA 25: 0.010171
• EMA 99: 0.010064
• RSI (6): 65.49
• SAR: 0.009563
Bullish Signals:
1. Price is trading above all three EMAs.
2. A strong bullish candle appeared with increased trading volume.
3. RSI indicates improving buying momentum.
4. The recent recovery suggests buyers are becoming more active.
🎯 POTENTIAL LONG TRADE PLAN
Entry Zone: 0.01035 – 0.01050
Confirmation: Wait for a 1H candle close above 0.01055 and a successful retest.
🟢 Take Profit Targets:
TP1: 0.01090
TP2: 0.01126
TP3: 0.01170
🔴 Stop Loss: 0.00995
Important Resistance: 0.01090 – 0.01126
Trade Invalidation: A confirmed 1H close below 0.01000 would weaken this bullish setup.
⚠️ My Trading Strategy:
I would prefer waiting for breakout confirmation instead of chasing the current price. Partial profits and proper risk management are essential.
This is a technical analysis scenario, not a guaranteed prediction. Always do your own research and manage risk.
#AKE #AKEUSDT #Binance #CryptoTrading #TechnicalAnalysis #Altcoins #TradingSignals
AKE/USDT is showing interesting bullish momentum on the 1H timeframe.
📊 Technical Analysis:
• Current Price: 0.010440
• EMA 7: 0.010141
• EMA 25: 0.010171
• EMA 99: 0.010064
• RSI (6): 65.49
• SAR: 0.009563
Bullish Signals:
1. Price is trading above all three EMAs.
2. A strong bullish candle appeared with increased trading volume.
3. RSI indicates improving buying momentum.
4. The recent recovery suggests buyers are becoming more active.
🎯 POTENTIAL LONG TRADE PLAN
Entry Zone: 0.01035 – 0.01050
Confirmation: Wait for a 1H candle close above 0.01055 and a successful retest.
🟢 Take Profit Targets:
TP1: 0.01090
TP2: 0.01126
TP3: 0.01170
🔴 Stop Loss: 0.00995
Important Resistance: 0.01090 – 0.01126
Trade Invalidation: A confirmed 1H close below 0.01000 would weaken this bullish setup.
⚠️ My Trading Strategy:
I would prefer waiting for breakout confirmation instead of chasing the current price. Partial profits and proper risk management are essential.
This is a technical analysis scenario, not a guaranteed prediction. Always do your own research and manage risk.
#AKE #AKEUSDT #Binance #CryptoTrading #TechnicalAnalysis #Altcoins #TradingSignals
475
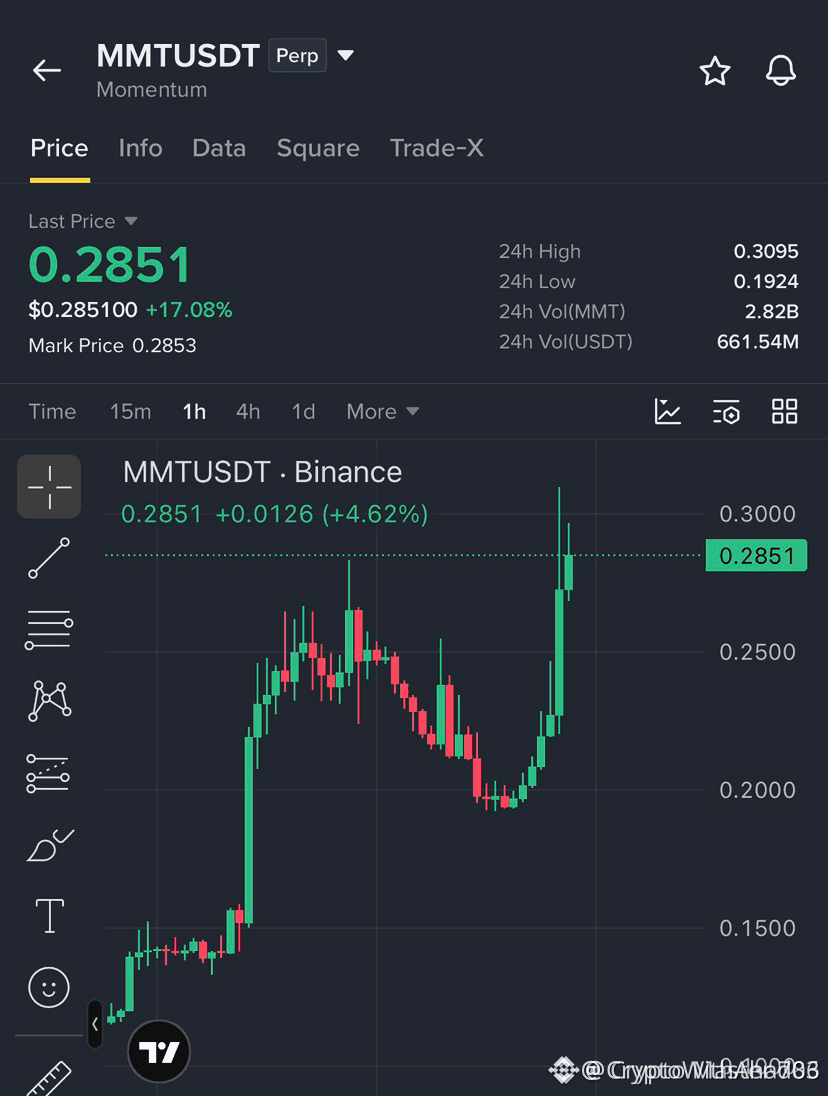
$MMT Rebounds Strongly — Is $0.32 Next???
$MMT is gaining bullish momentum after a sharp recovery. A confirmed breakout above $0.3100 could fuel another rally.
entry: $0.3100–$0.3120
targets: $0.3200 / $0.3350 / $0.3500
sl: $0.2950
confirmation: 1H close above $0.3100.
NFA. Manage risk
{future}(MMTUSDT)
$MSFTB $AAPLB $NVDAB
$MMT Rebounds Strongly — Is $0.32 Next???
$MMT is gaining bullish momentum after a sharp recovery. A confirmed breakout above $0.3100 could fuel another rally.
entry: $0.3100–$0.3120
targets: $0.3200 / $0.3350 / $0.3500
sl: $0.2950
confirmation: 1H close above $0.3100.
NFA. Manage risk
$MSFTB $AAPLB $NVDAB
$MMT is gaining bullish momentum after a sharp recovery. A confirmed breakout above $0.3100 could fuel another rally.
entry: $0.3100–$0.3120
targets: $0.3200 / $0.3350 / $0.3500
sl: $0.2950
confirmation: 1H close above $0.3100.
NFA. Manage risk
$MSFTB $AAPLB $NVDAB
48
{future}(RAVEUSDT)
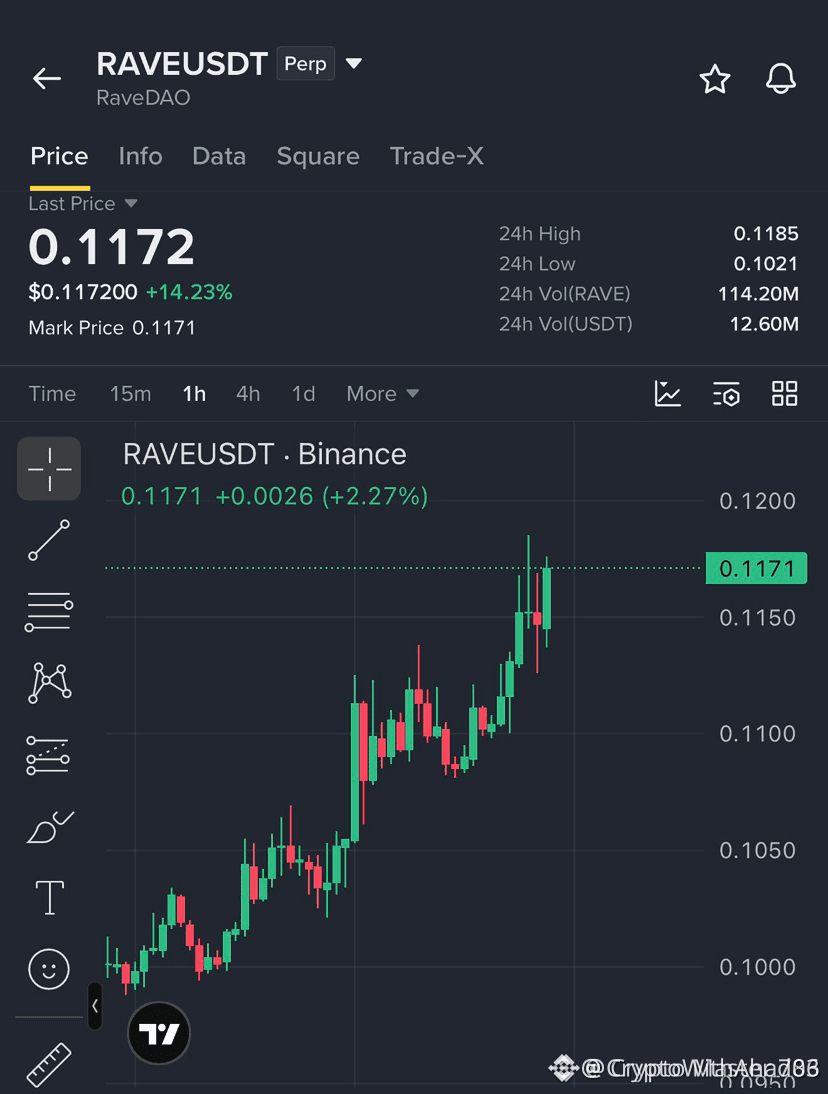
I’m eyeing a $RAVE long if the pullback holds at $0.1150.
TP $0.1200
SL $0.1125
I’m eyeing a $RAVE long if the pullback holds at $0.1150.
TP $0.1200
SL $0.1125
TP $0.1200
SL $0.1125
64
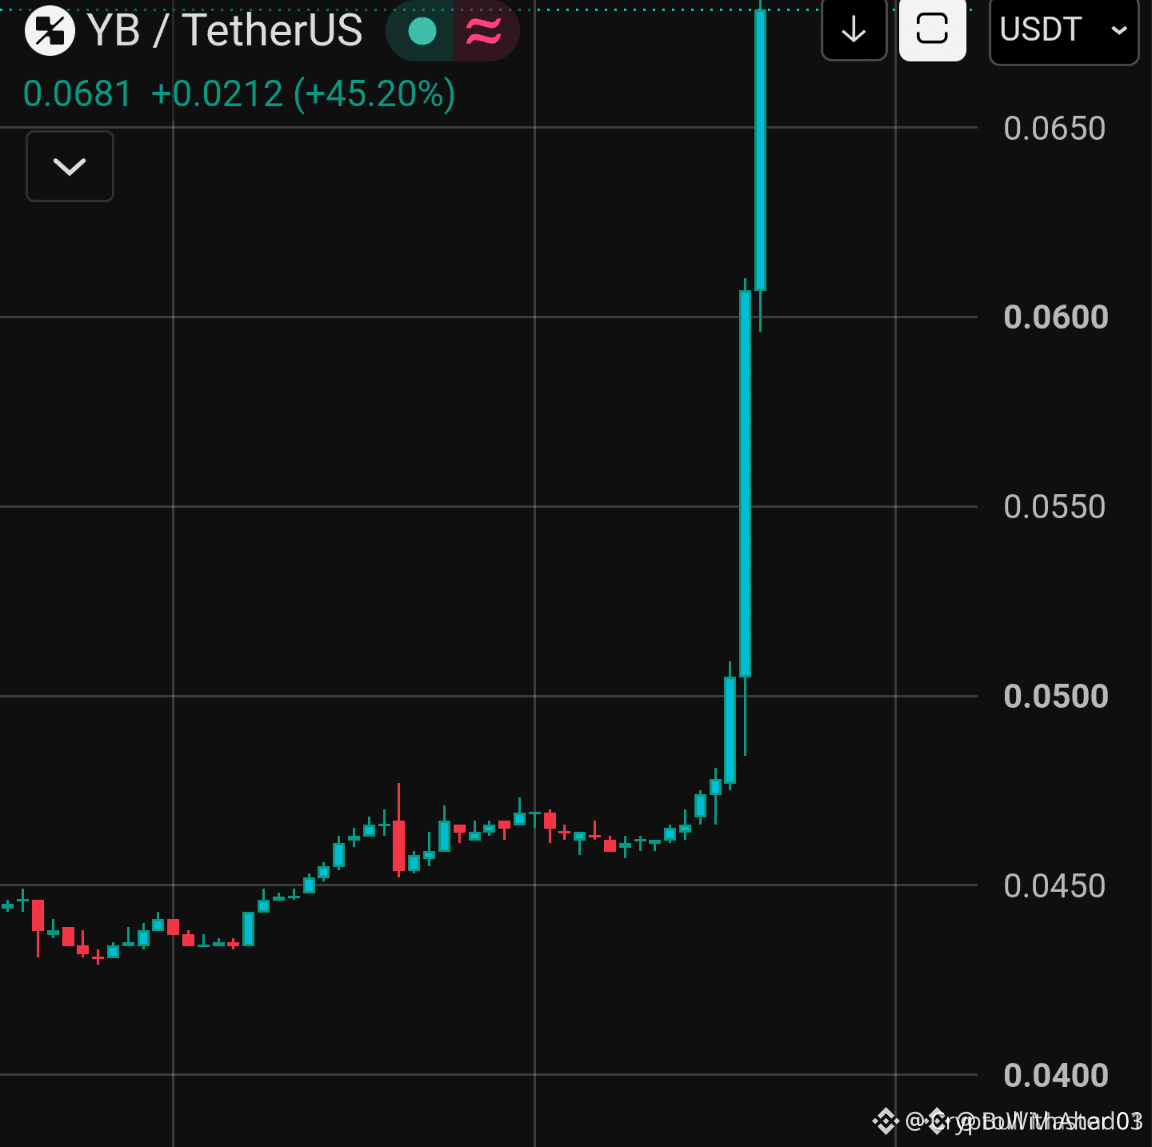
$YB Long Set-up Parabolic breakout incoming
Massive +45.20% vertical spike straight out of the consolidation base
Textbook explosive move buyers have completely taken over
THE LONG GAME PLAN
Entry: 0.0660 – 0.0680 (Current zone / micro-pullback)
• TP1: 0.0720
• TP2: 0.0780
• TP3: 0.0850
• SL: 0.0610
Why Long?
• Zero exhaustion on the chart this is pure momentum
• Price ripped through resistance with no hesitation
• Missing this entry means chasing the next leg up
{spot}(YBUSDT)
$YB Long Set-up Parabolic breakout incoming
Massive +45.20% vertical spike straight out of the consolidation base
Textbook explosive move buyers have completely taken over
THE LONG GAME PLAN
Entry: 0.0660 – 0.0680 (Current zone / micro-pullback)
• TP1: 0.0720
• TP2: 0.0780
• TP3: 0.0850
• SL: 0.0610
Why Long?
• Zero exhaustion on the chart this is pure momentum
• Price ripped through resistance with no hesitation
• Missing this entry means chasing the next leg up
Massive +45.20% vertical spike straight out of the consolidation base
Textbook explosive move buyers have completely taken over
THE LONG GAME PLAN
Entry: 0.0660 – 0.0680 (Current zone / micro-pullback)
• TP1: 0.0720
• TP2: 0.0780
• TP3: 0.0850
• SL: 0.0610
Why Long?
• Zero exhaustion on the chart this is pure momentum
• Price ripped through resistance with no hesitation
• Missing this entry means chasing the next leg up
78
{future}(SUNUSDT)
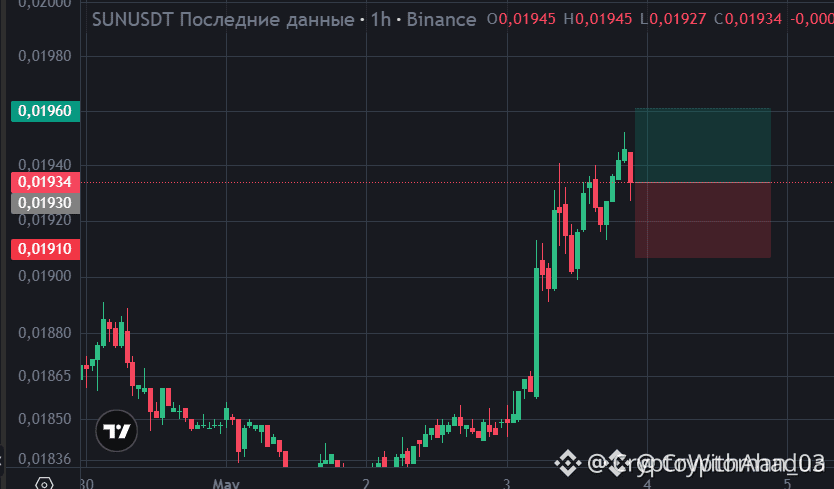
after the upward impulse, we're currently in the zone – this is a long for continuation
Long
Entry: $0.0191 – $0.0194
TP: $0.0198 – $0.0202 – $0.0210
SL: $0.0189
after the upward impulse, we're currently in the zone – this is a long for continuation
Long
Entry: $0.0191 – $0.0194
TP: $0.0198 – $0.0202 – $0.0210
SL: $0.0189
Long
Entry: $0.0191 – $0.0194
TP: $0.0198 – $0.0202 – $0.0210
SL: $0.0189
74
·
--
Bullish
$XRP
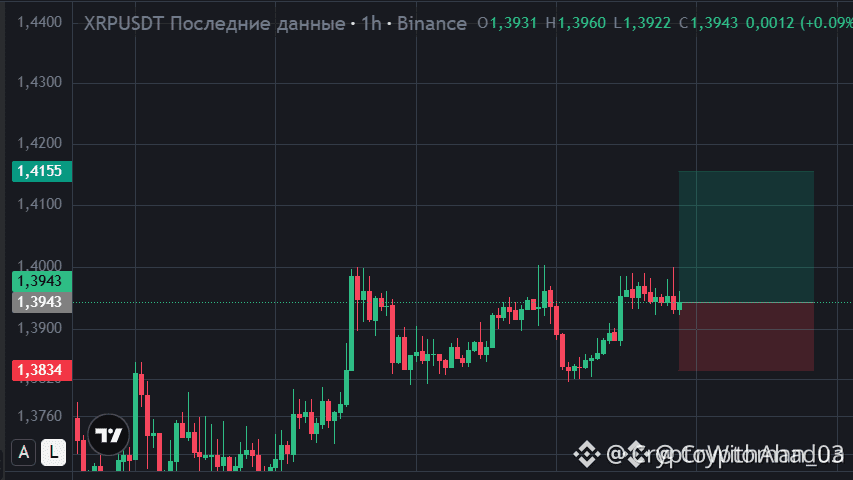
Right now, after the impulse, the price is in a zone — this is a continuation long.
Long
Entry: $1.38 – $1.395
TP: $1.42 – $1.45 – $1.48
SL: $1.36
{future}(XRPUSDT)
$XRP
Right now, after the impulse, the price is in a zone — this is a continuation long.
Long
Entry: $1.38 – $1.395
TP: $1.42 – $1.45 – $1.48
SL: $1.36
Right now, after the impulse, the price is in a zone — this is a continuation long.
Long
Entry: $1.38 – $1.395
TP: $1.42 – $1.45 – $1.48
SL: $1.36
68
Log in to explore more content
Join global crypto users on Binance Square
⚡️ Get latest and useful information about crypto.
💬 Trusted by the world’s largest crypto exchange.
👍 Discover real insights from verified creators.
Email / Phone number
Trending Topics
CanBTCReboundAfterFallingBelow60K?
0 views
414 Discussing
Bitcoin News | Bitcoin Falls Below $60,000 for the First Time Since July as IBIT Posts Record $541 Million Outflow
Binance News
·37 Likes
·60.6k views
GlobalStocksFaceLongestLosingStreakSince2023
0 views
445 Discussing
AnthropicPlungesTowardIPOPriceonDay2
0 views
153 Discussing