
月之心
256 Posts

月之心
Report
Block User
山寨之王-赛道拆解-盘面为尺-情绪为锚-放弃量变-便无质变
手续费返20%邀请码:YYZZXX
3 Following
596 Followers
1.1K+ Liked
Posts
All
Quotes
PINNED
·
--
Article
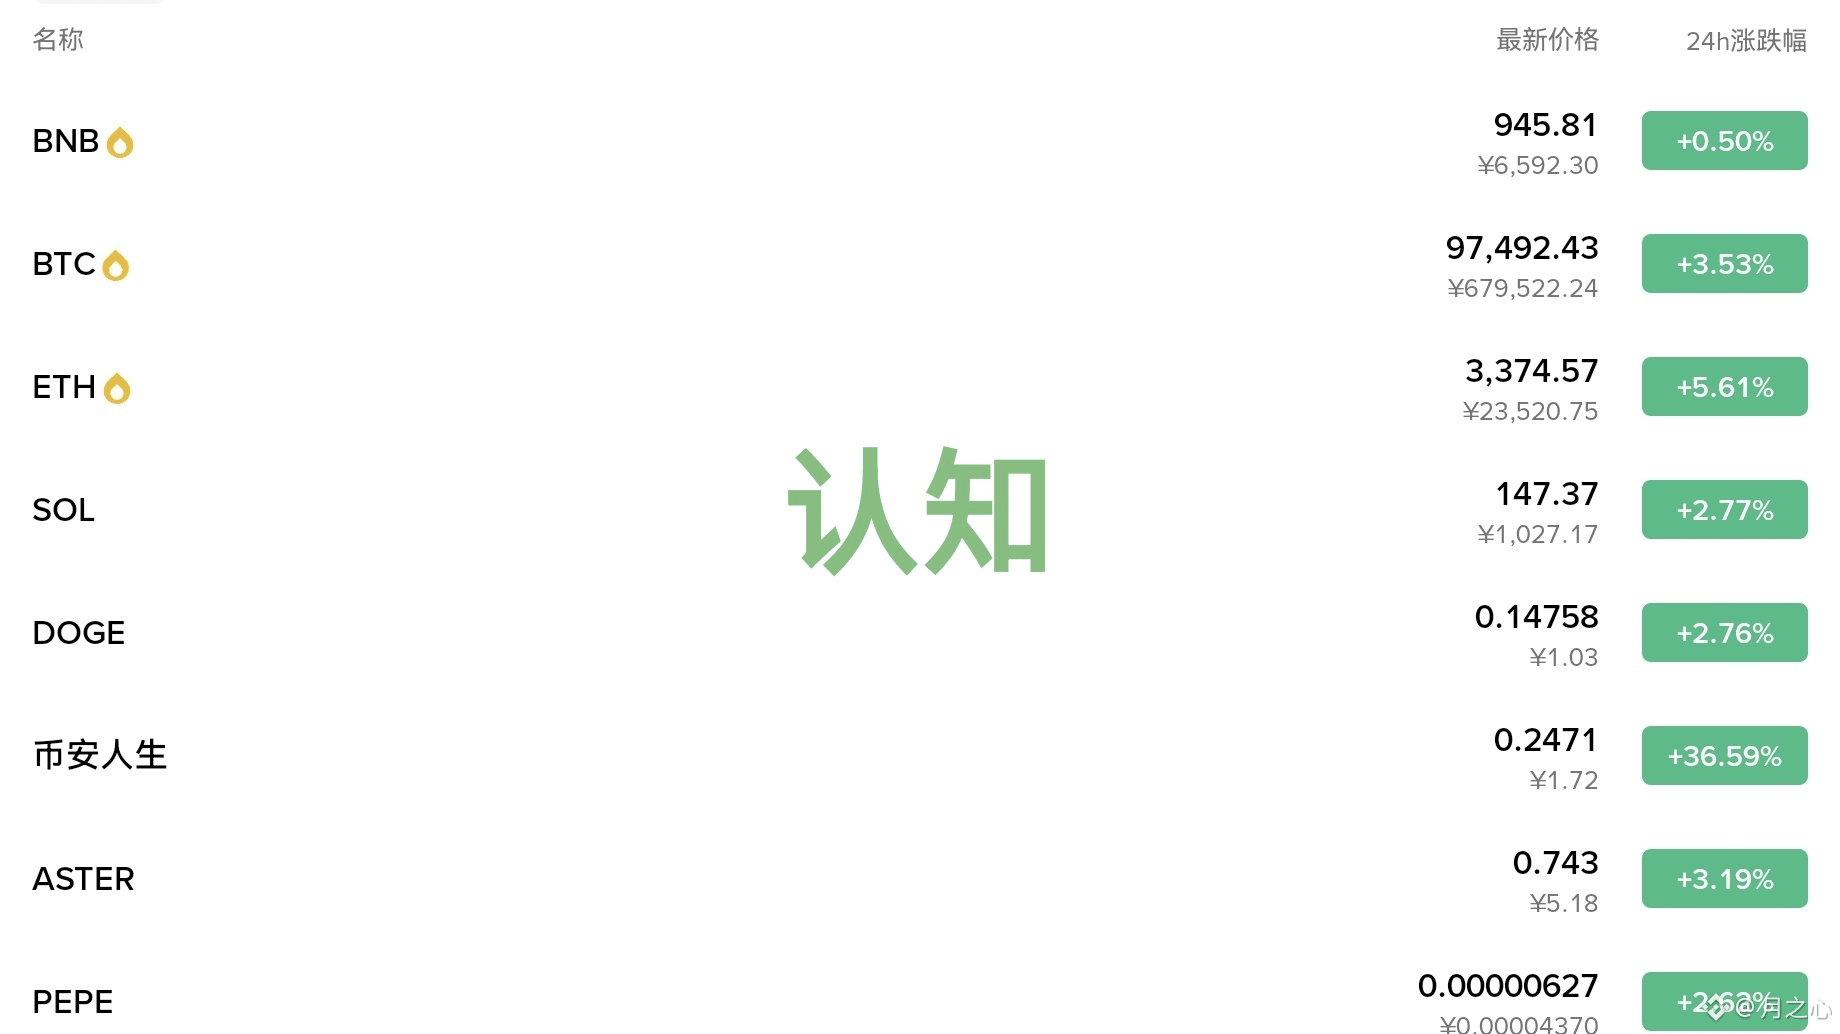
The Biggest Cognitive Trap in CryptocurrencyIn cryptocurrency trading, the biggest cognitive trap is equating trial and error with losing principal. What truly hinders short-term traders from making money is not trial and error itself, but using experts' trading rules to play one's own 'small capital survival game'.
Take many beginners, for example. Eager to make quick profits upon entering the market, they constantly watch live streams of various trading influencers, observing how these experts go all-in on trending coins, precisely time their take-profit points, and consistently make substantial gains. Over time, they develop a false impression: going all-in is the shortcut to wealth. They then imitate this behavior, pouring their limited capital entirely into high-volatility assets, chasing highs and selling lows. As a result, they either get trapped at the peak or cut losses at the bottom. After a few rounds, their principal is wiped out, and their confidence is shattered.
The Biggest Cognitive Trap in Cryptocurrency
In cryptocurrency trading, the biggest cognitive trap is equating trial and error with losing principal. What truly hinders short-term traders from making money is not trial and error itself, but using experts' trading rules to play one's own 'small capital survival game'.
Take many beginners, for example. Eager to make quick profits upon entering the market, they constantly watch live streams of various trading influencers, observing how these experts go all-in on trending coins, precisely time their take-profit points, and consistently make substantial gains. Over time, they develop a false impression: going all-in is the shortcut to wealth. They then imitate this behavior, pouring their limited capital entirely into high-volatility assets, chasing highs and selling lows. As a result, they either get trapped at the peak or cut losses at the bottom. After a few rounds, their principal is wiped out, and their confidence is shattered.
Take many beginners, for example. Eager to make quick profits upon entering the market, they constantly watch live streams of various trading influencers, observing how these experts go all-in on trending coins, precisely time their take-profit points, and consistently make substantial gains. Over time, they develop a false impression: going all-in is the shortcut to wealth. They then imitate this behavior, pouring their limited capital entirely into high-volatility assets, chasing highs and selling lows. As a result, they either get trapped at the peak or cut losses at the bottom. After a few rounds, their principal is wiped out, and their confidence is shattered.
2
1
2
254
·
--
Bullish
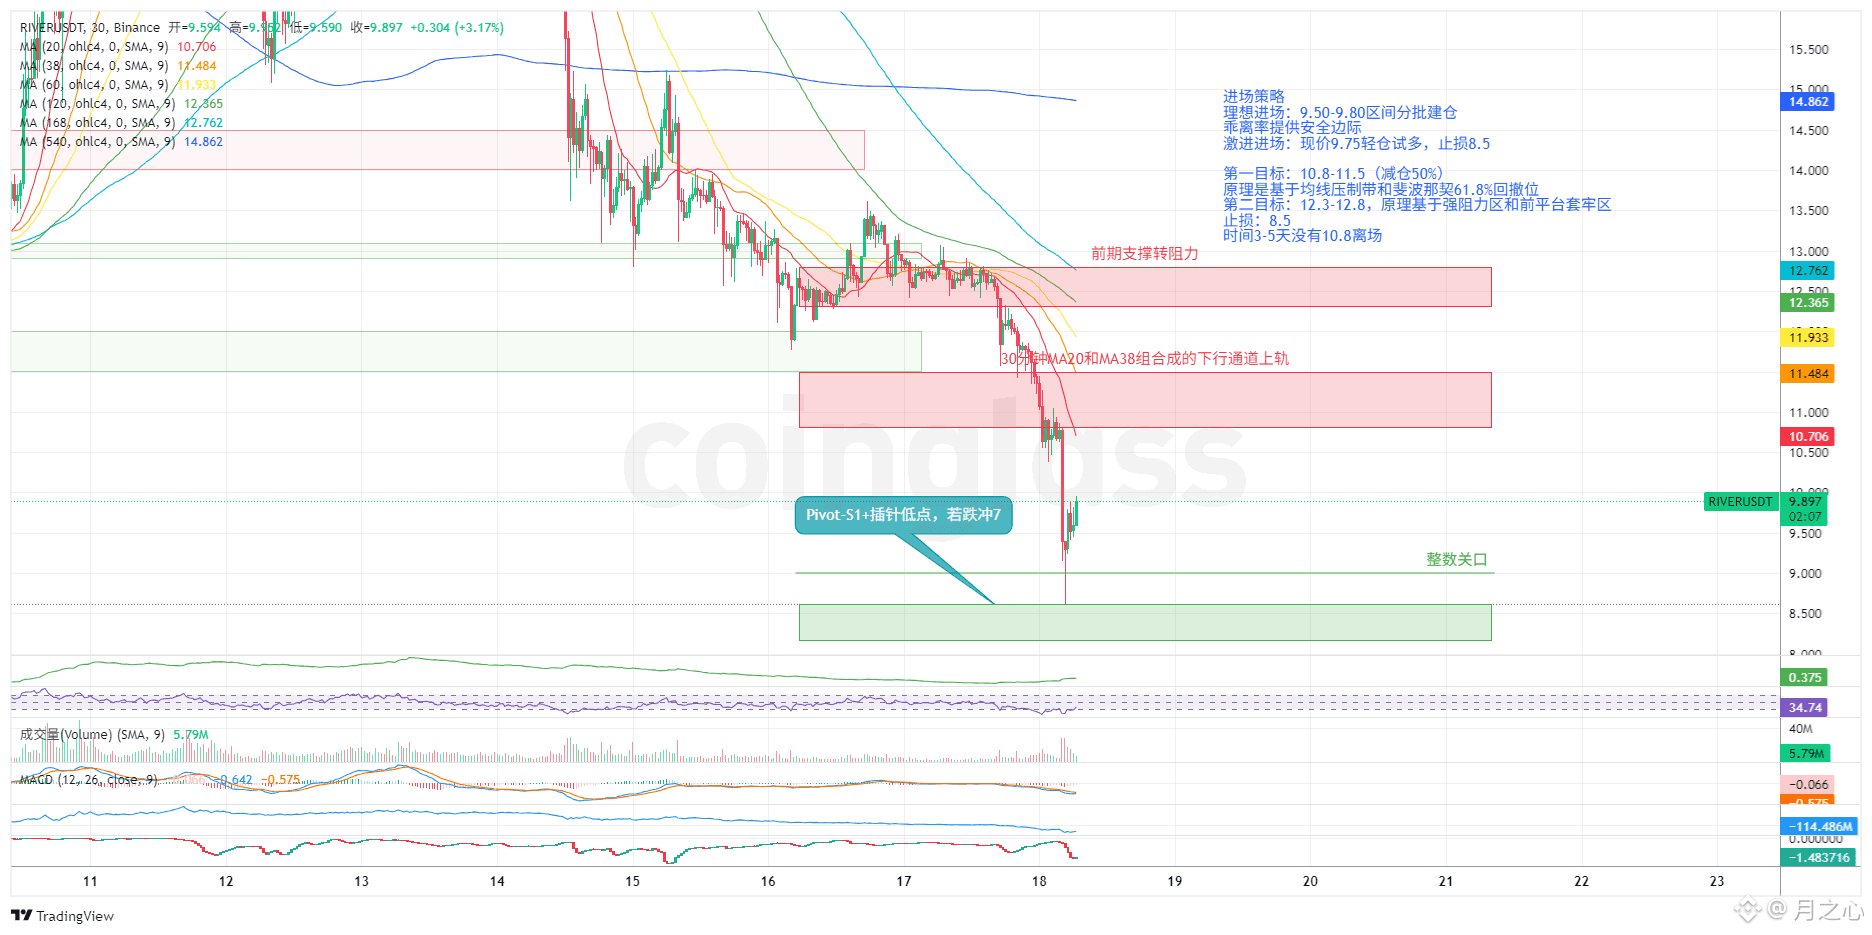
RIVER Divergence -48% has triggered mean reversion
The technical aspect has entered an extreme oversold resonance zone, with 1-hour RSI at 24.69 and 4-hour RSI at 23.14 both breaking below the 25 threshold, and the 30-minute MACD bearish momentum bars continuing to shrink
9.0 is the short-term defense line, 8.61 is a strong support resonance zone
First resistance at 1, with the 30-minute short-cycle moving average and the upper boundary of the downward channel forming
Second resistance at 12.3—12.8, 4hMA20 + previous trapped platform + Fibonacci resonance zone, also a reasonable target upper limit for a rebound
Stop loss should be below 8.5 to avoid pin bars
RIVER Divergence -48% has triggered mean reversion
The technical aspect has entered an extreme oversold resonance zone, with 1-hour RSI at 24.69 and 4-hour RSI at 23.14 both breaking below the 25 threshold, and the 30-minute MACD bearish momentum bars continuing to shrink
9.0 is the short-term defense line, 8.61 is a strong support resonance zone
First resistance at 1, with the 30-minute short-cycle moving average and the upper boundary of the downward channel forming
Second resistance at 12.3—12.8, 4hMA20 + previous trapped platform + Fibonacci resonance zone, also a reasonable target upper limit for a rebound
Stop loss should be below 8.5 to avoid pin bars
The technical aspect has entered an extreme oversold resonance zone, with 1-hour RSI at 24.69 and 4-hour RSI at 23.14 both breaking below the 25 threshold, and the 30-minute MACD bearish momentum bars continuing to shrink
9.0 is the short-term defense line, 8.61 is a strong support resonance zone
First resistance at 1, with the 30-minute short-cycle moving average and the upper boundary of the downward channel forming
Second resistance at 12.3—12.8, 4hMA20 + previous trapped platform + Fibonacci resonance zone, also a reasonable target upper limit for a rebound
Stop loss should be below 8.5 to avoid pin bars
1
1
5
2.1k
·
--
Bullish
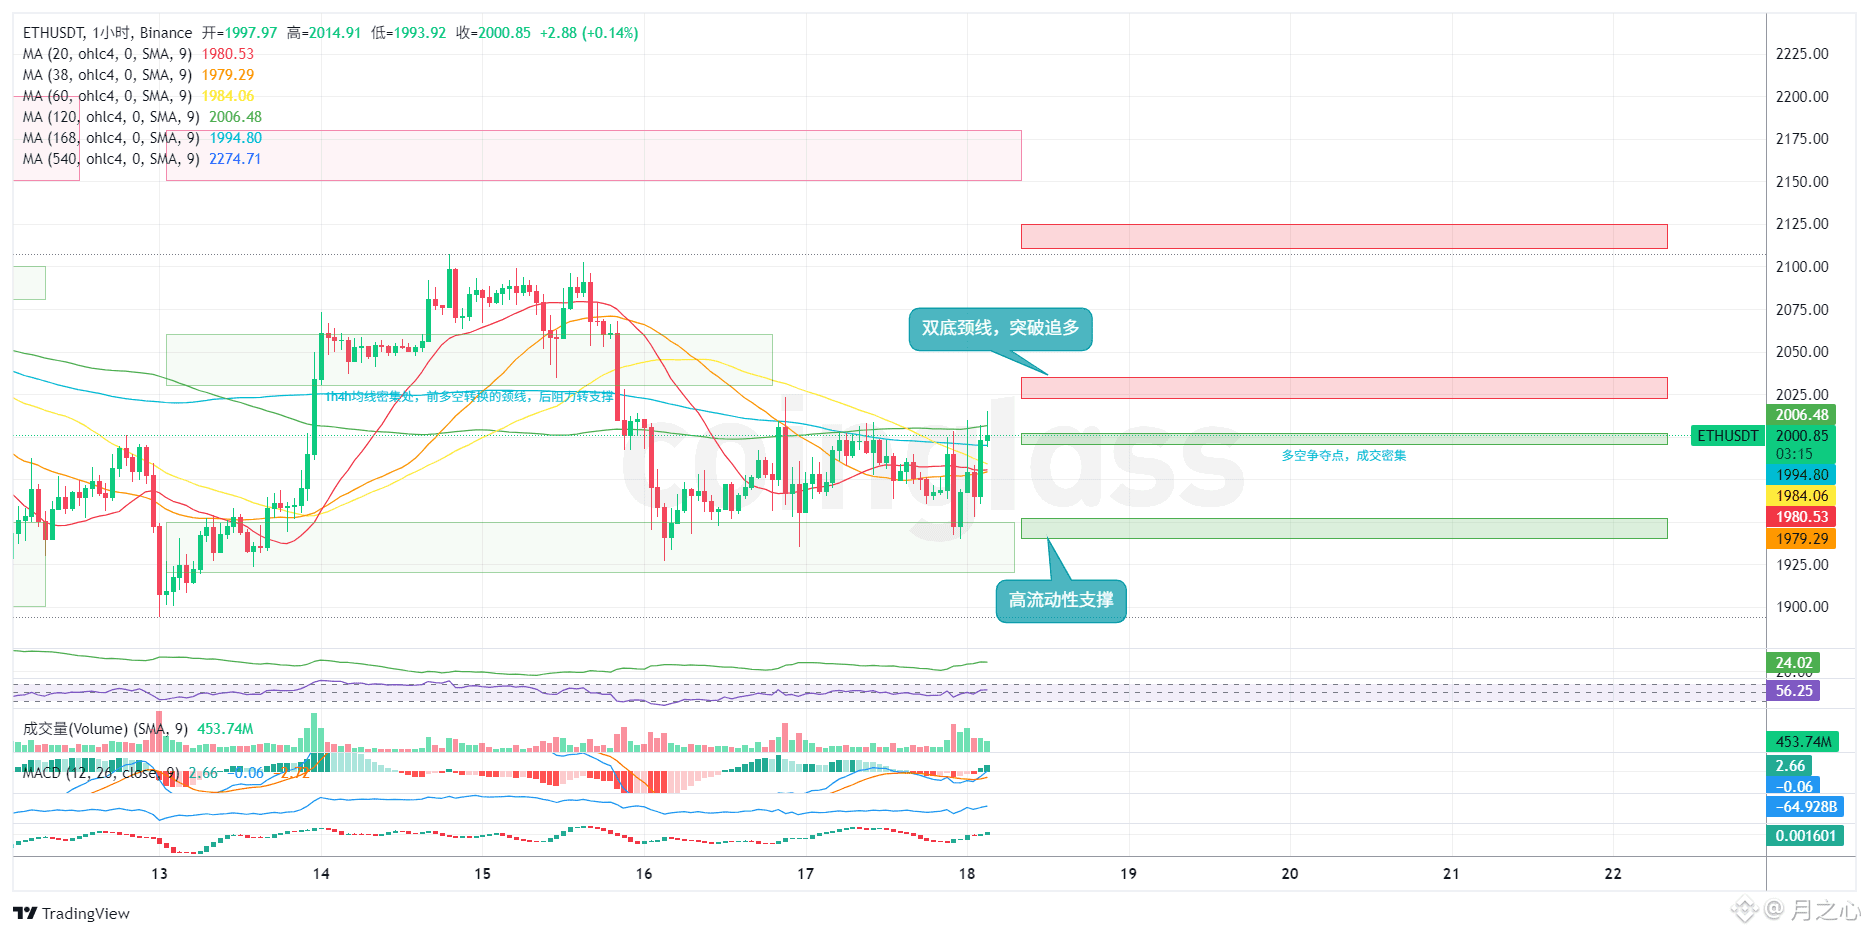
ETH only suitable for low long positions here, not advisable to short
The technical aspect is quite clear now, with a clear double bottom structure on the 4-hour chart, and the short-term moving averages are starting to turn, still a typical stop-loss recovery
The position for liquidity support is still being monitored for any break below, a break would invalidate the rebound logic
Next is 2030, where the 4hMA60 and the double bottom neckline resonate, it must break through with volume to confirm strength
The current logic is to go low long, stop loss below 1935, first target at 2030, if it breaks through, then look at 2110
Only trade based on structure
{future}(ETHUSDT)
ETH only suitable for low long positions here, not advisable to short
The technical aspect is quite clear now, with a clear double bottom structure on the 4-hour chart, and the short-term moving averages are starting to turn, still a typical stop-loss recovery
The position for liquidity support is still being monitored for any break below, a break would invalidate the rebound logic
Next is 2030, where the 4hMA60 and the double bottom neckline resonate, it must break through with volume to confirm strength
The current logic is to go low long, stop loss below 1935, first target at 2030, if it breaks through, then look at 2110
Only trade based on structure
The technical aspect is quite clear now, with a clear double bottom structure on the 4-hour chart, and the short-term moving averages are starting to turn, still a typical stop-loss recovery
The position for liquidity support is still being monitored for any break below, a break would invalidate the rebound logic
Next is 2030, where the 4hMA60 and the double bottom neckline resonate, it must break through with volume to confirm strength
The current logic is to go low long, stop loss below 1935, first target at 2030, if it breaks through, then look at 2110
Only trade based on structure
5
1.1k
·
--
Bullish
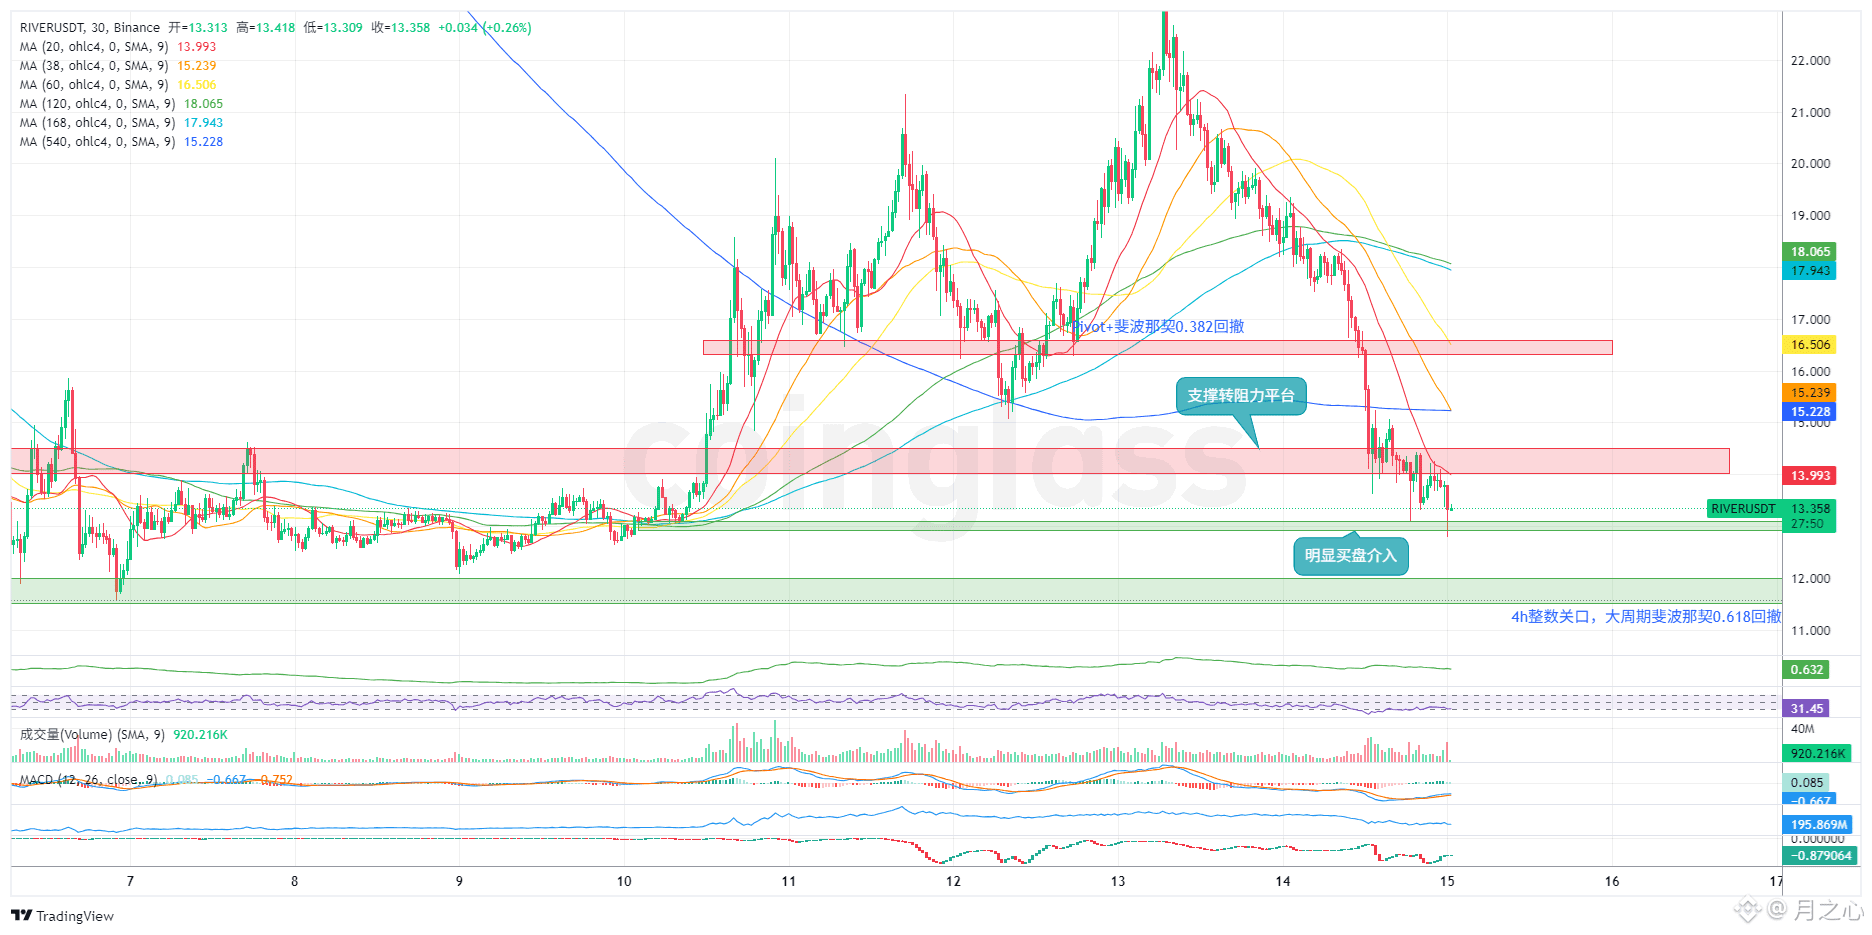
$RIVER Violent rebound countdown! Buy at 13, harvest shorts at 16!
Currently, the MA20/MA60 deviation rate is almost the highest in the past 30 days. If it stays flat without dropping, it’s a buildup before a surge.
If it breaks 12.8, just give up directly, then the first resistance is 14.00–14.50, and the ultimate target is 16.30–16.60.
In the current market, focus on buying at the bottom, do not short, do not fear heights.
$RIVER Violent rebound countdown! Buy at 13, harvest shorts at 16!
Currently, the MA20/MA60 deviation rate is almost the highest in the past 30 days. If it stays flat without dropping, it’s a buildup before a surge.
If it breaks 12.8, just give up directly, then the first resistance is 14.00–14.50, and the ultimate target is 16.30–16.60.
In the current market, focus on buying at the bottom, do not short, do not fear heights.
Currently, the MA20/MA60 deviation rate is almost the highest in the past 30 days. If it stays flat without dropping, it’s a buildup before a surge.
If it breaks 12.8, just give up directly, then the first resistance is 14.00–14.50, and the ultimate target is 16.30–16.60.
In the current market, focus on buying at the bottom, do not short, do not fear heights.
1
4
3k
·
--
Article
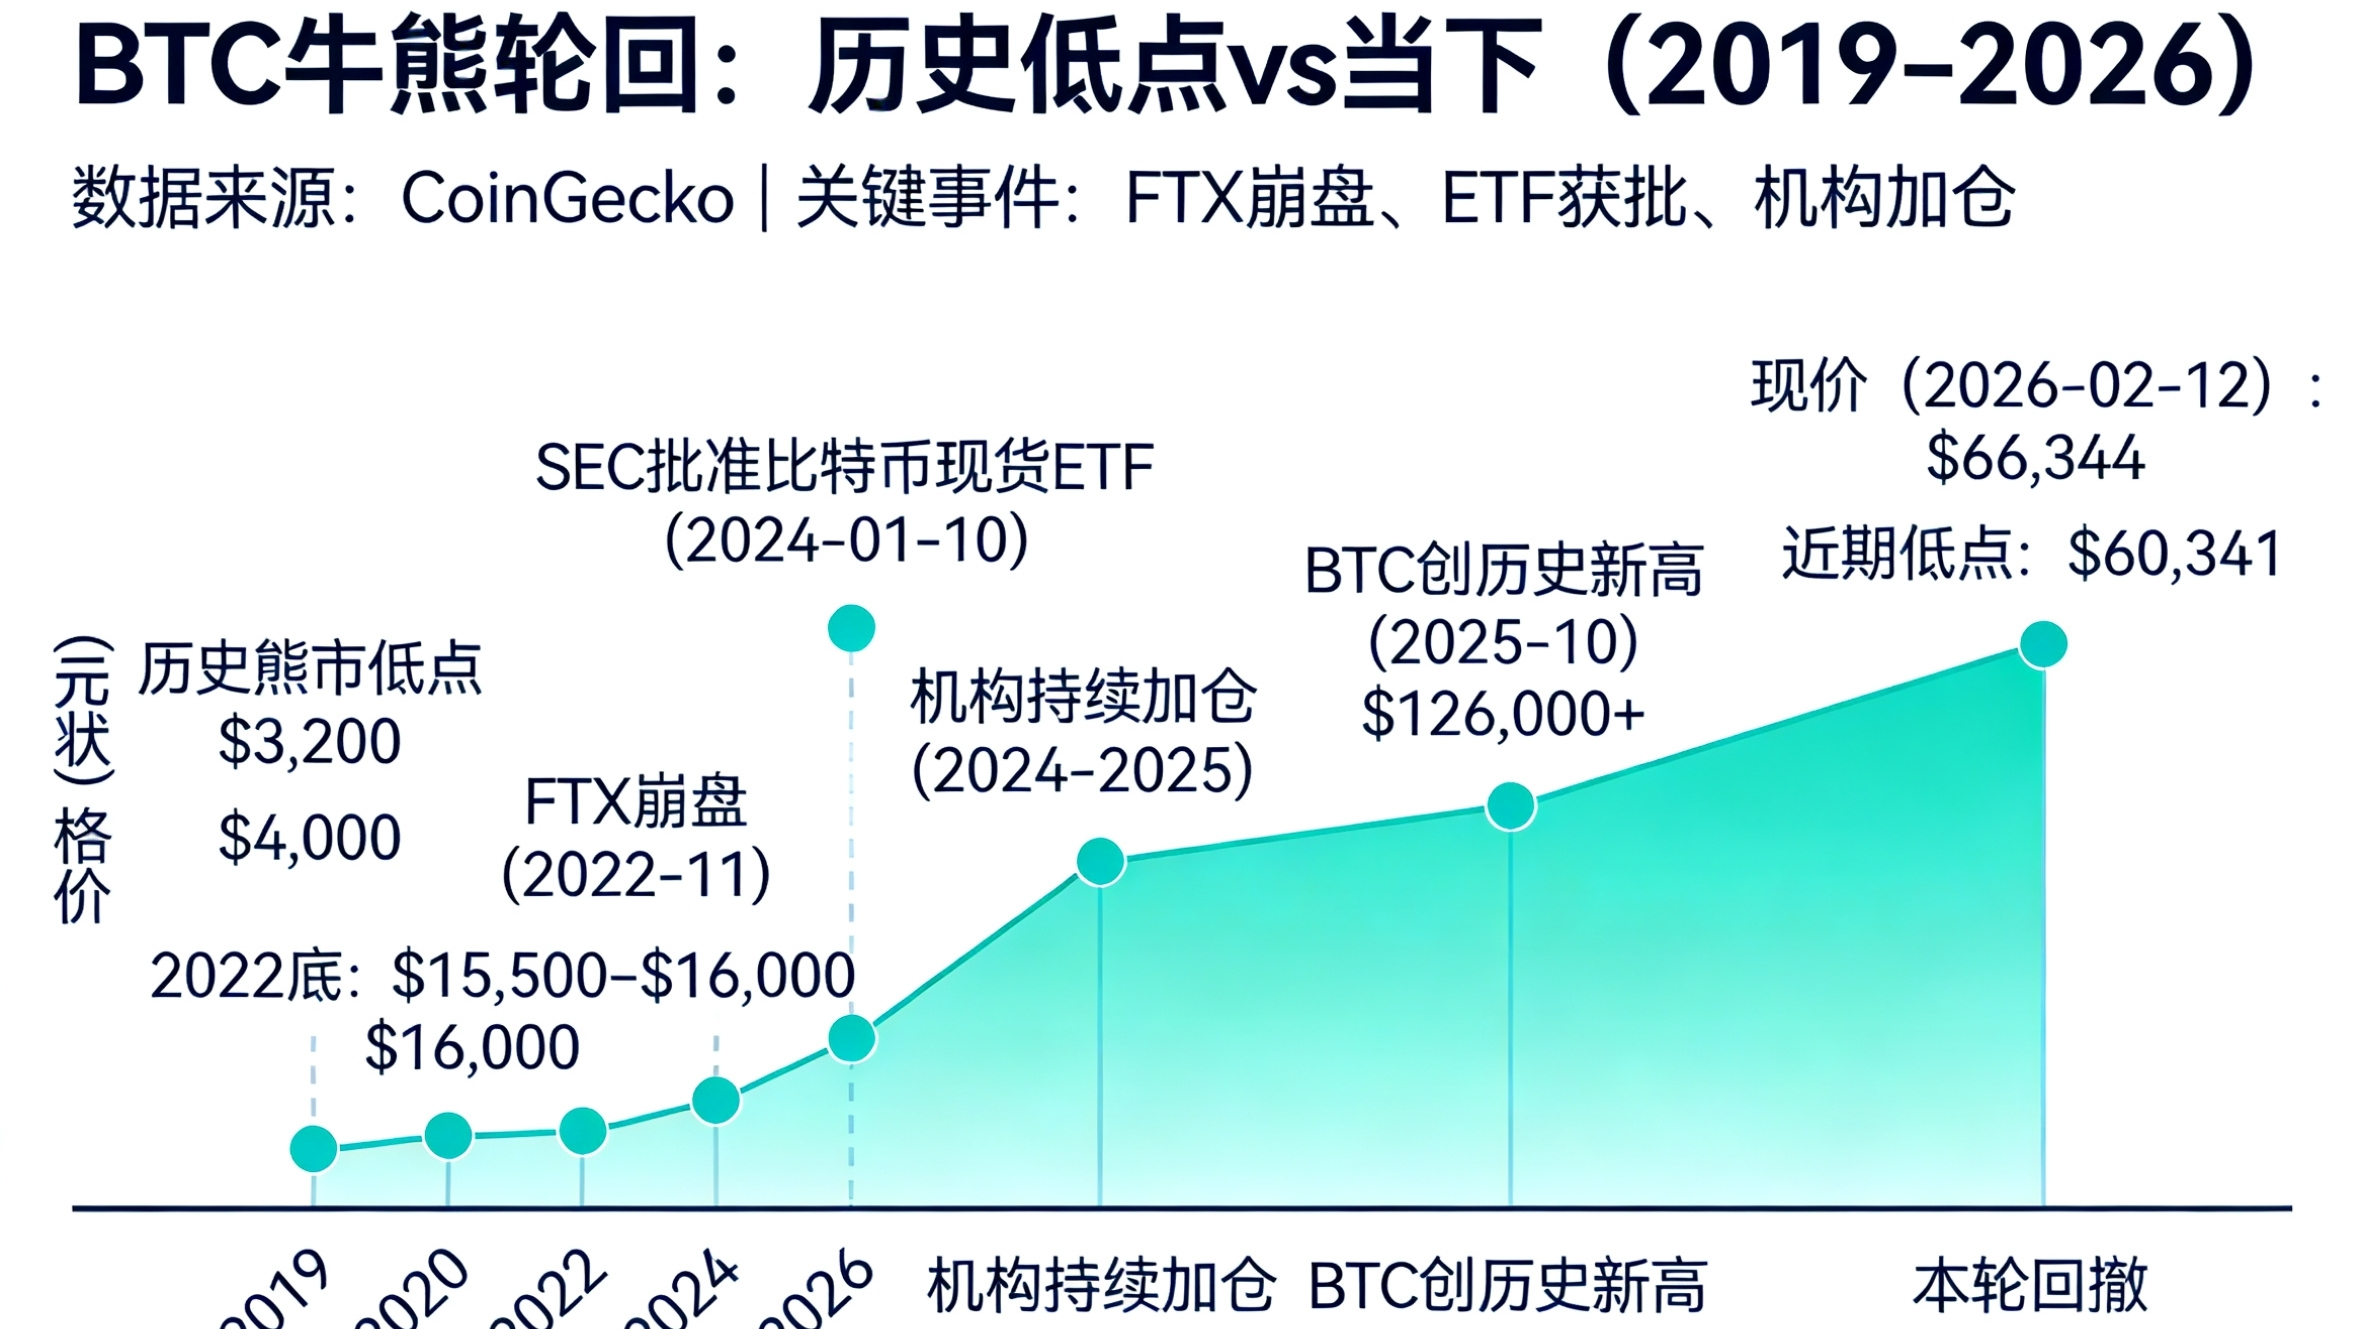
BTC This Round of Bear Market vs 2019/2020/2022 Bear MarketBrothers, can we stop trying to cut the sword with the boat? Many people like to use the mindset of cutting losses from 2022 in the present; isn't that just giving away money?
In this recent round of decline, I've seen some people shouting about replicating the crash of 2022. I am someone who always looks at the data because data doesn't lie. The underlying logic of this bear market is already different from that of 2019, 2020, and 2022. Today, I will talk about three core points that, if understood, could save you at least hundreds of thousands.
Talking about numbers is a bit boring, let's get straight to the picture👇
🔥Core 1: Market players are changing! A shift from 'retail panic' to 'institutional support'
BTC This Round of Bear Market vs 2019/2020/2022 Bear Market
Brothers, can we stop trying to cut the sword with the boat? Many people like to use the mindset of cutting losses from 2022 in the present; isn't that just giving away money?
In this recent round of decline, I've seen some people shouting about replicating the crash of 2022. I am someone who always looks at the data because data doesn't lie. The underlying logic of this bear market is already different from that of 2019, 2020, and 2022. Today, I will talk about three core points that, if understood, could save you at least hundreds of thousands.
Talking about numbers is a bit boring, let's get straight to the picture👇
🔥Core 1: Market players are changing! A shift from 'retail panic' to 'institutional support'
In this recent round of decline, I've seen some people shouting about replicating the crash of 2022. I am someone who always looks at the data because data doesn't lie. The underlying logic of this bear market is already different from that of 2019, 2020, and 2022. Today, I will talk about three core points that, if understood, could save you at least hundreds of thousands.
Talking about numbers is a bit boring, let's get straight to the picture👇
🔥Core 1: Market players are changing! A shift from 'retail panic' to 'institutional support'
2
589
·
--
Bearish
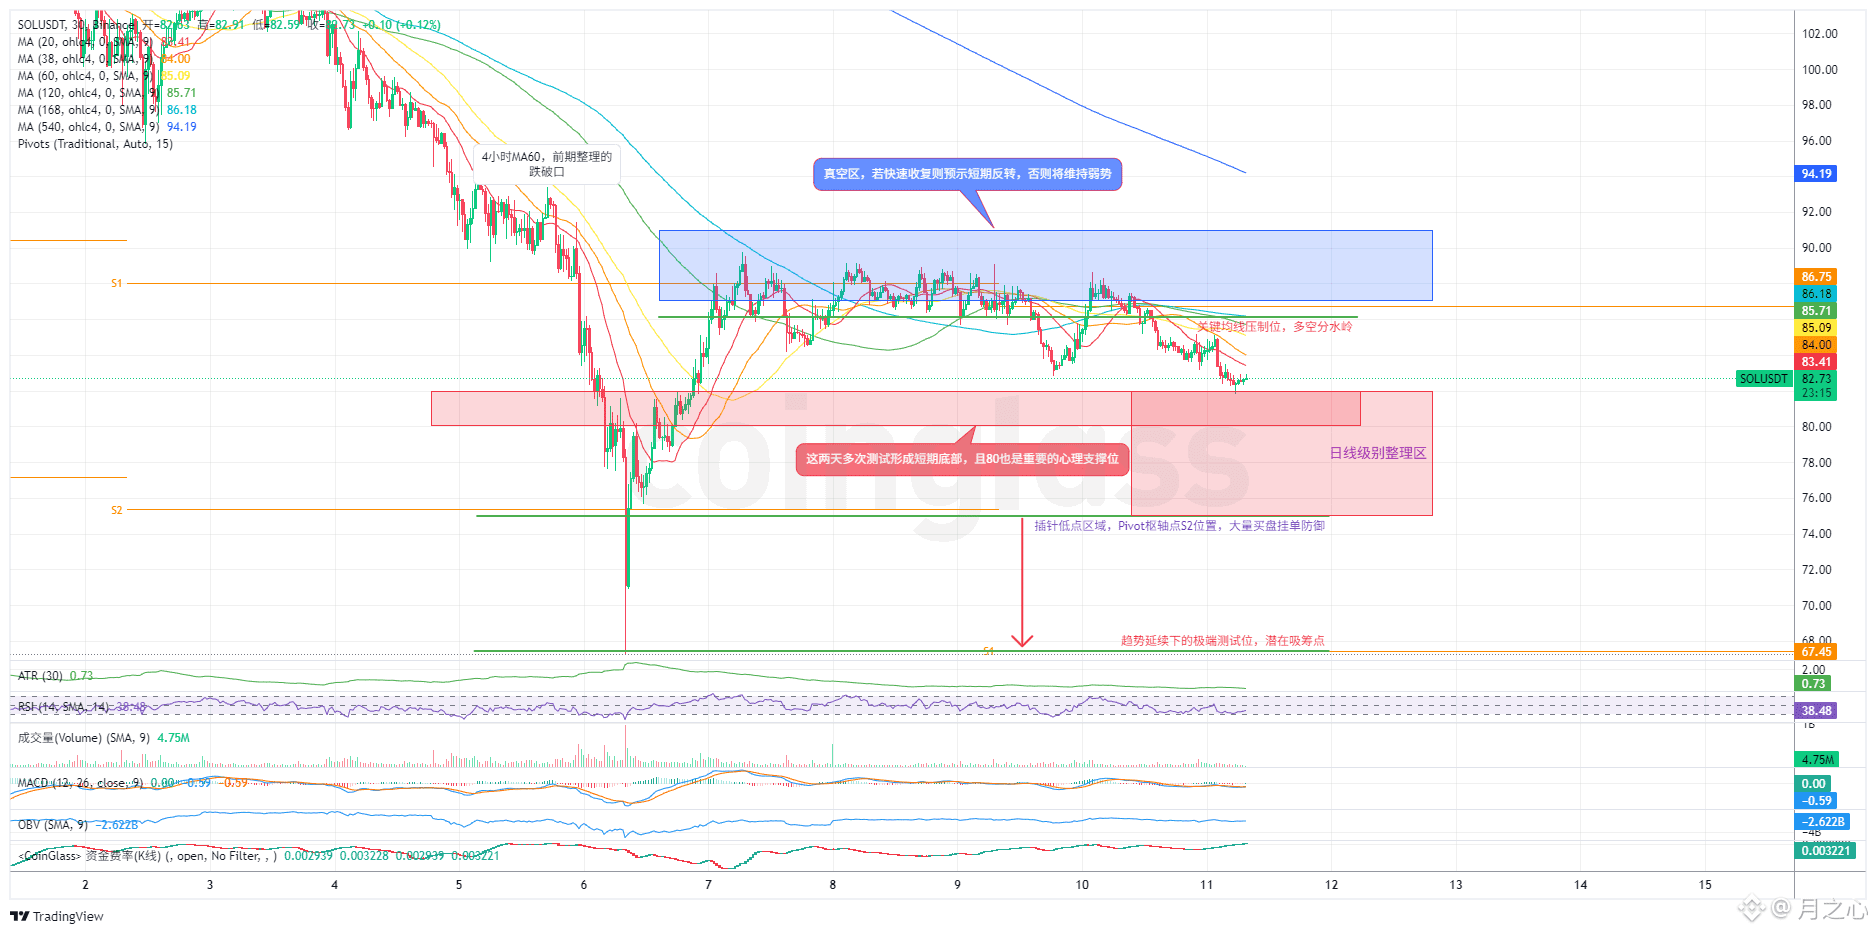
$SOL Don't shout about the reversal, the trend of all moving averages is dead! Enter short near 86, waiting for 76
The 4-hour moving average is firmly pressed around 86, rebound with no volume, MACD is weak, the current pullback is just a correction during the downtrend, not a reversal
Let's speak plainly
80–82 is the first line of defense, if broken, look at 76, if broken again, directly look at 67
86.6–88.1 is the death suppression zone, touching here will lead to a drop
Mainly play for rebound shorts, do not bottom fish, do not get attached to the battle
Short near 85.5–86.5, stop loss above 92, target first look at 76, then look at 67.
If you really want to try to turn a bicycle into a motorcycle, you can only try lightly near the support of 75–76, in and out quickly
Being oversold is false, bears are real
Rebound is short, breaking is down
{future}(SOLUSDT)
$SOL Don't shout about the reversal, the trend of all moving averages is dead! Enter short near 86, waiting for 76
The 4-hour moving average is firmly pressed around 86, rebound with no volume, MACD is weak, the current pullback is just a correction during the downtrend, not a reversal
Let's speak plainly
80–82 is the first line of defense, if broken, look at 76, if broken again, directly look at 67
86.6–88.1 is the death suppression zone, touching here will lead to a drop
Mainly play for rebound shorts, do not bottom fish, do not get attached to the battle
Short near 85.5–86.5, stop loss above 92, target first look at 76, then look at 67.
If you really want to try to turn a bicycle into a motorcycle, you can only try lightly near the support of 75–76, in and out quickly
Being oversold is false, bears are real
Rebound is short, breaking is down
The 4-hour moving average is firmly pressed around 86, rebound with no volume, MACD is weak, the current pullback is just a correction during the downtrend, not a reversal
Let's speak plainly
80–82 is the first line of defense, if broken, look at 76, if broken again, directly look at 67
86.6–88.1 is the death suppression zone, touching here will lead to a drop
Mainly play for rebound shorts, do not bottom fish, do not get attached to the battle
Short near 85.5–86.5, stop loss above 92, target first look at 76, then look at 67.
If you really want to try to turn a bicycle into a motorcycle, you can only try lightly near the support of 75–76, in and out quickly
Being oversold is false, bears are real
Rebound is short, breaking is down
5
1
4
344
·
--
Bullish
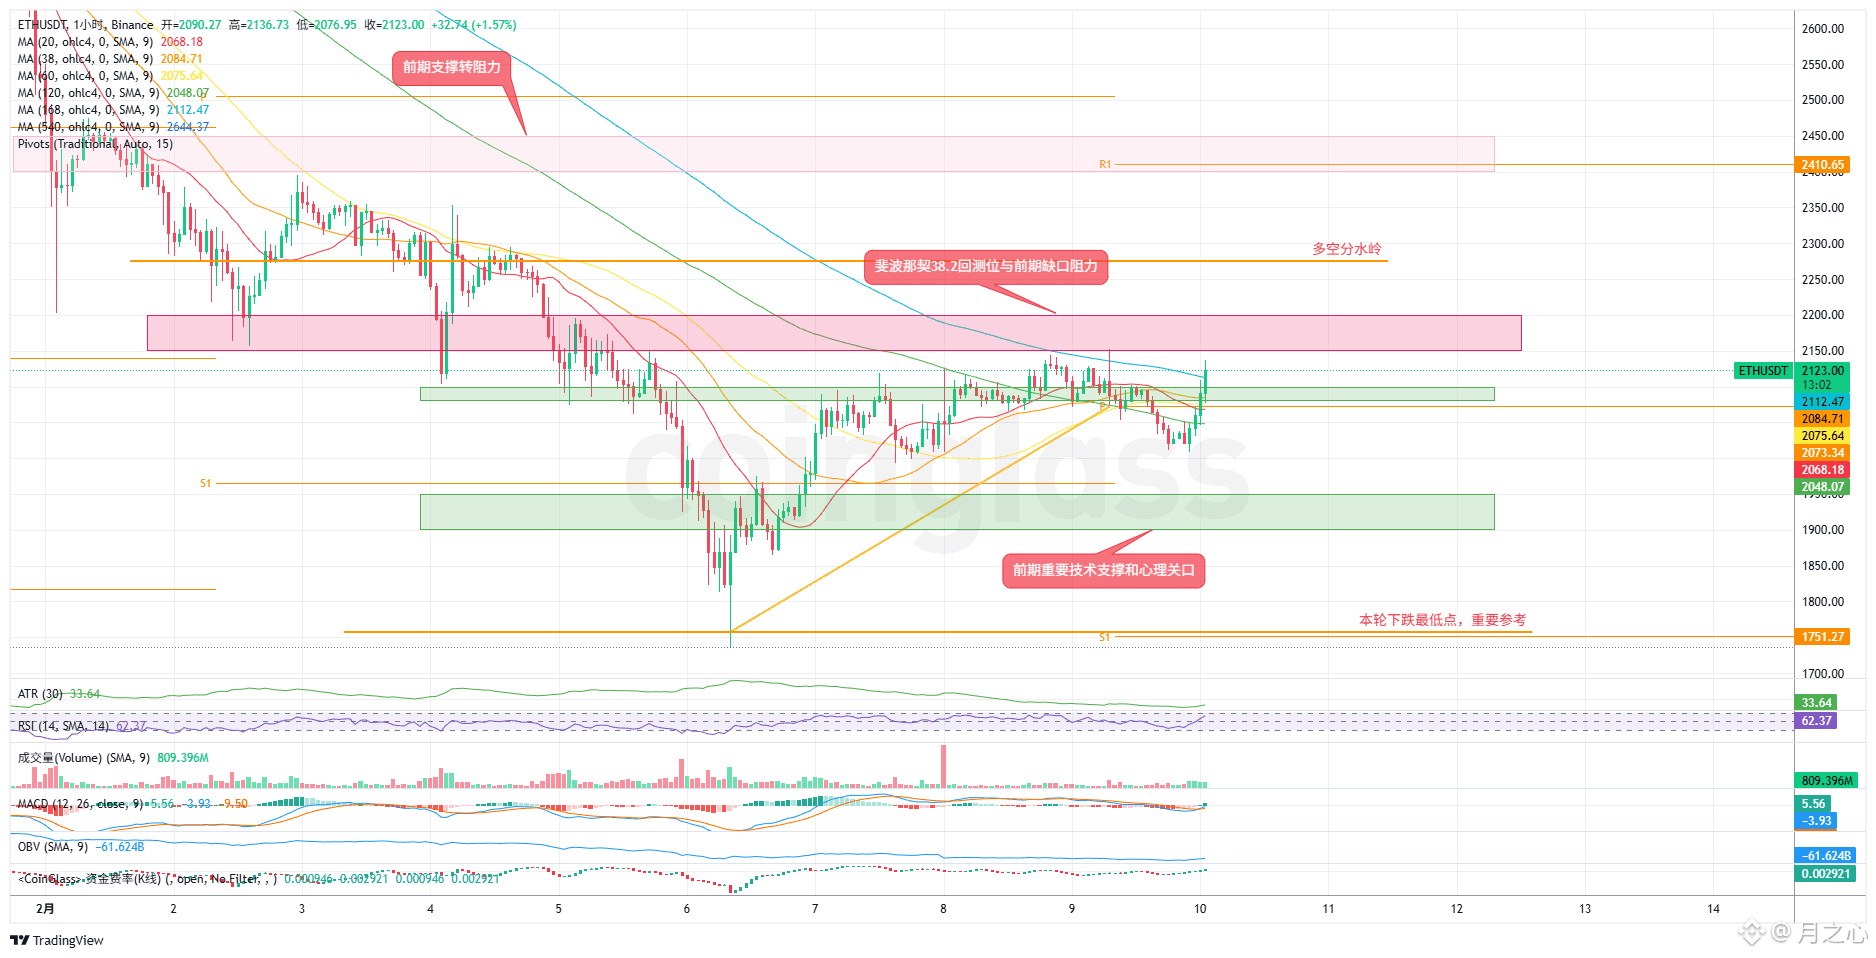
$ETH plummeted 22.5% to 1756 after hitting the ultimate iron bottom, then directly rebounded 18.8%!
Extremely oversold + hourly MACD golden cross, the downward momentum is completely dead, and in the next half week, a rebound is nailed on the technical front. A bear market rebound is also a big profit!
Bulls should pay attention to the 2040-2060 range; if it breaks below, abandon the rebound. If there is a rebound, first aim for 2150, and if it breaks, look for 2300. When reaching this area, directly reverse to short.
Short positions are roughly in the 2250-2300 area, with a stop loss at 2350 and a target to short back to 2100.
Don't be timid! Oversold divergence + liquidity refill, this rebound has a probability of over 70%. This wave of profit must be taken!
{future}(ETHUSDT)
$ETH plummeted 22.5% to 1756 after hitting the ultimate iron bottom, then directly rebounded 18.8%!
Extremely oversold + hourly MACD golden cross, the downward momentum is completely dead, and in the next half week, a rebound is nailed on the technical front. A bear market rebound is also a big profit!
Bulls should pay attention to the 2040-2060 range; if it breaks below, abandon the rebound. If there is a rebound, first aim for 2150, and if it breaks, look for 2300. When reaching this area, directly reverse to short.
Short positions are roughly in the 2250-2300 area, with a stop loss at 2350 and a target to short back to 2100.
Don't be timid! Oversold divergence + liquidity refill, this rebound has a probability of over 70%. This wave of profit must be taken!
Extremely oversold + hourly MACD golden cross, the downward momentum is completely dead, and in the next half week, a rebound is nailed on the technical front. A bear market rebound is also a big profit!
Bulls should pay attention to the 2040-2060 range; if it breaks below, abandon the rebound. If there is a rebound, first aim for 2150, and if it breaks, look for 2300. When reaching this area, directly reverse to short.
Short positions are roughly in the 2250-2300 area, with a stop loss at 2350 and a target to short back to 2100.
Don't be timid! Oversold divergence + liquidity refill, this rebound has a probability of over 70%. This wave of profit must be taken!
3
999
·
--
Bullish
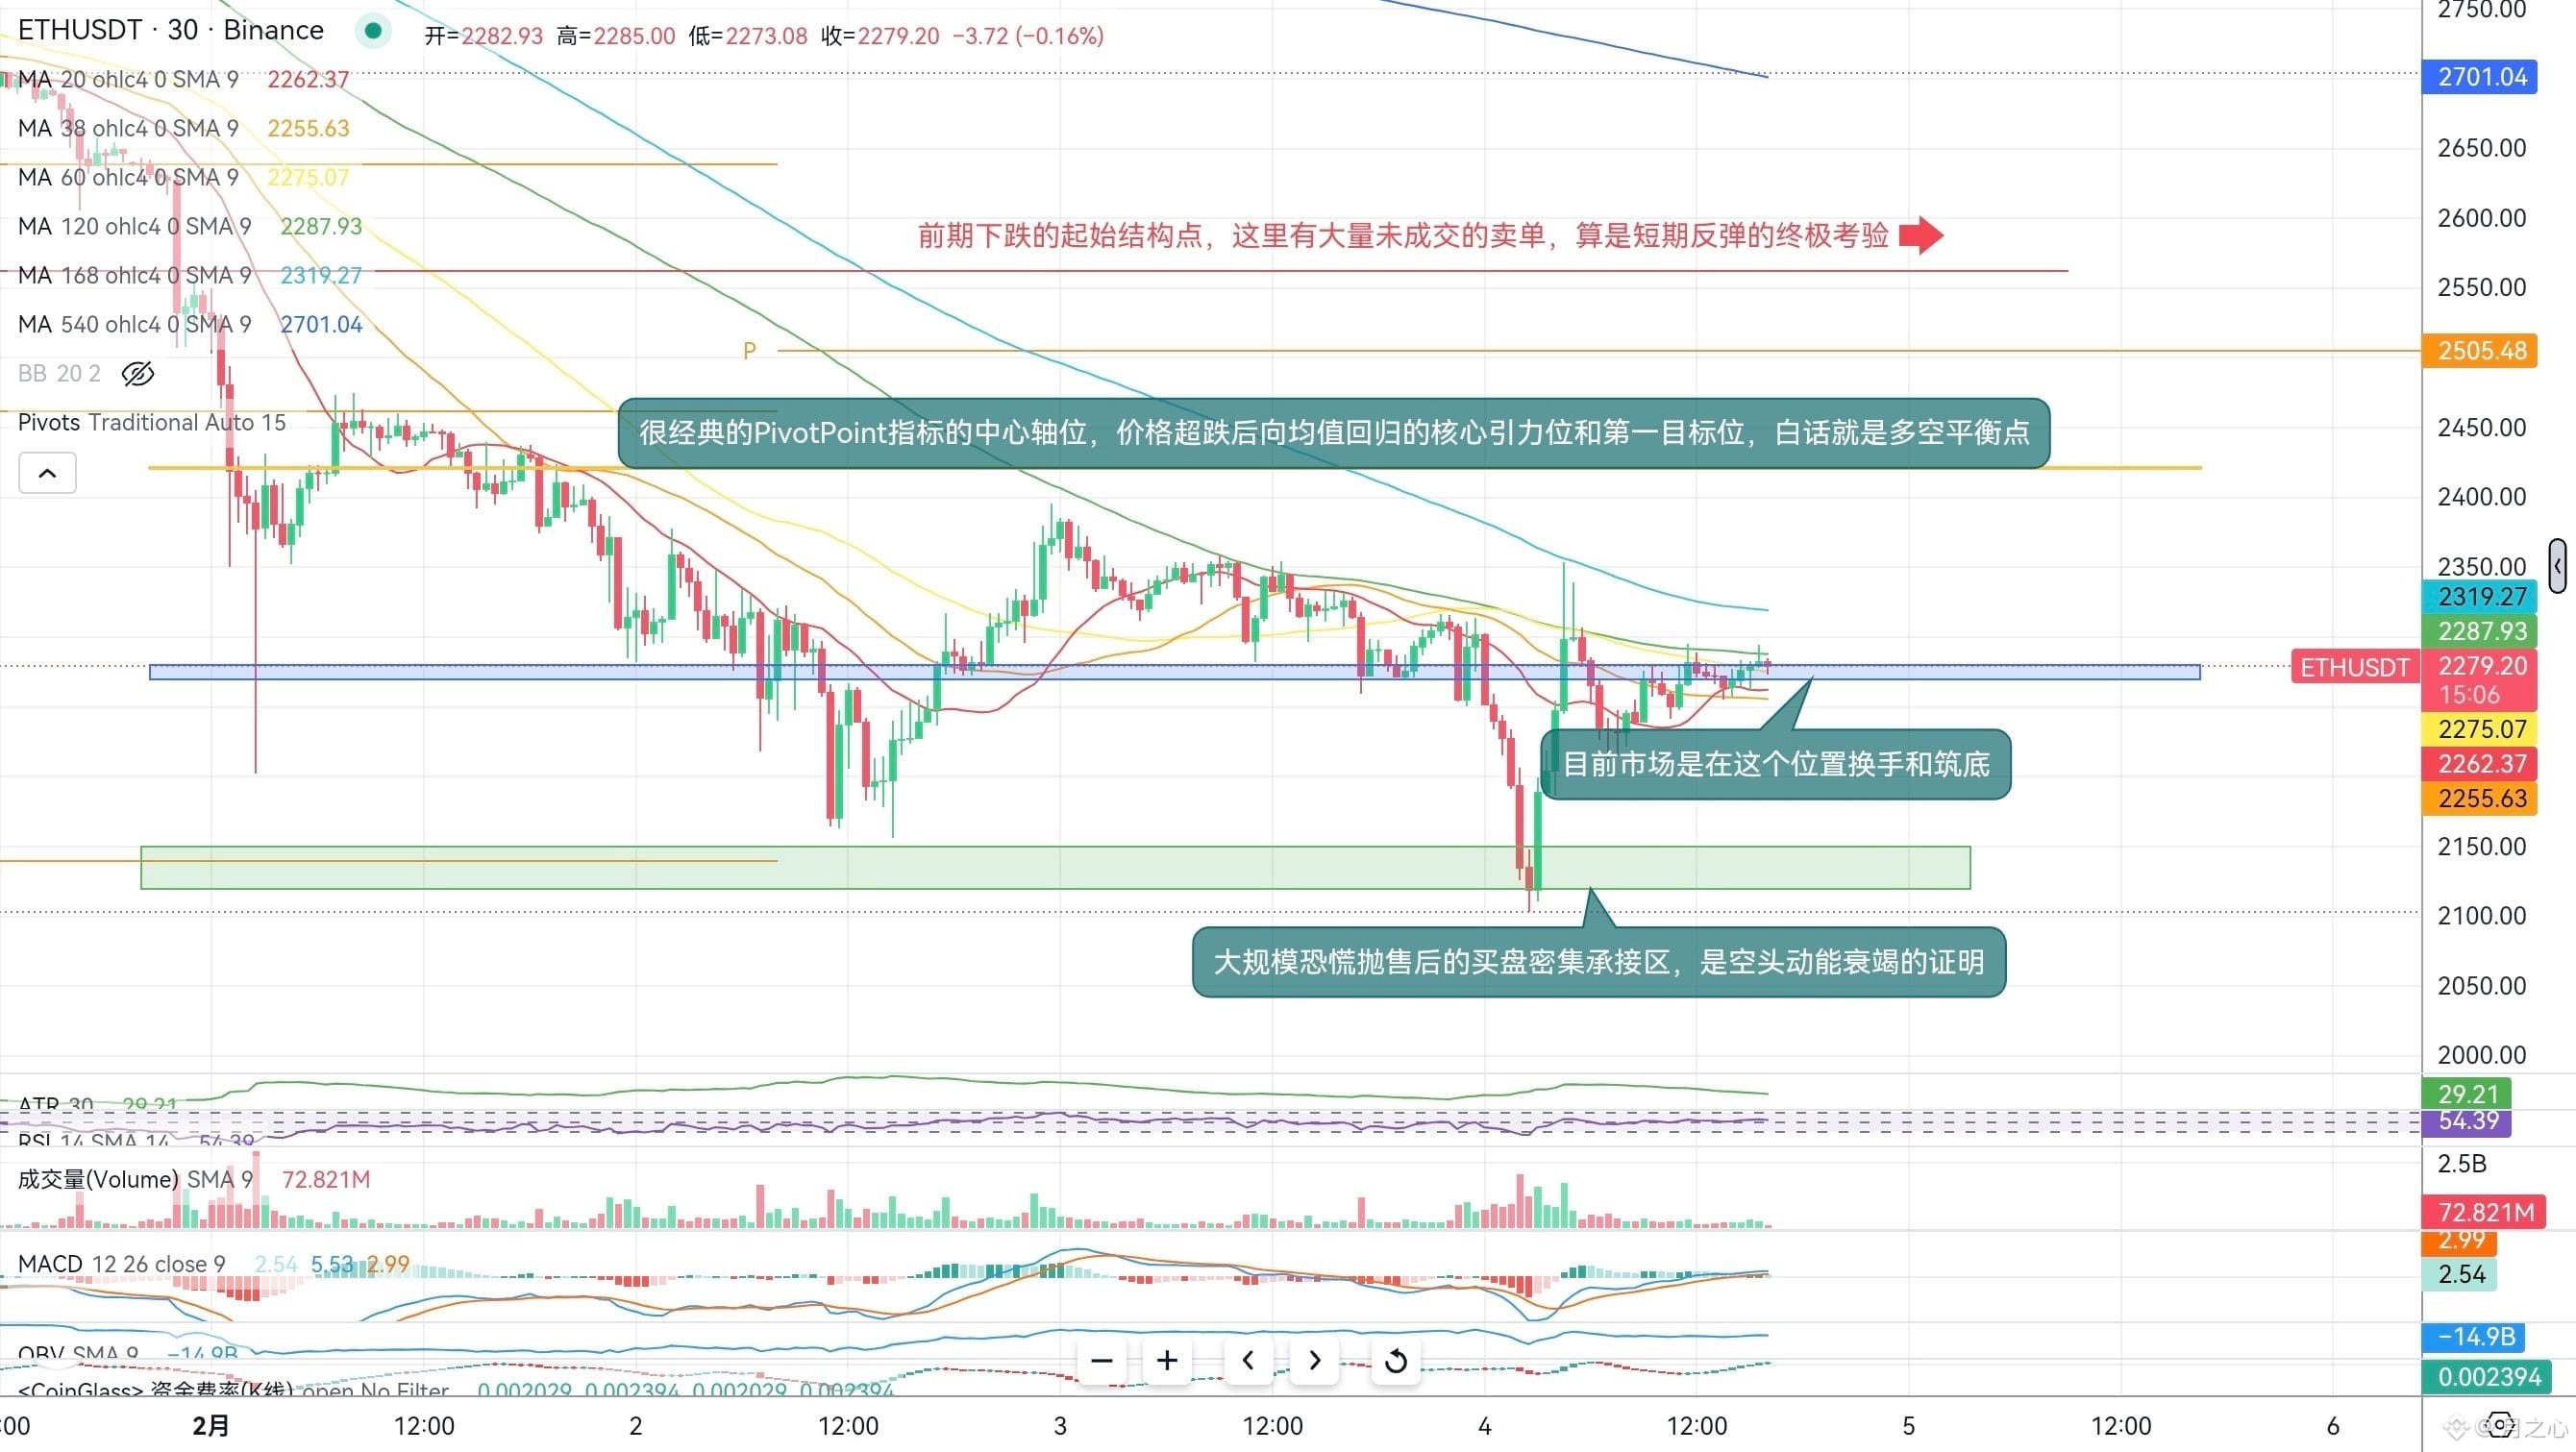
$ETH Short sellers are completely exhausted, hold at 2250 and go long directly, close your eyes and count the money!\n \nShort sellers directly liquidated 5.52 million dollars, while long positions only cleared 550,000; short sellers are completely exhausted!\nAlthough seeking a sword in the boat is a foolish thing in the cryptocurrency world, why not treat this position with a 70% chance of a rebound as an indicator? Now, the MACD green bars are shrinking + 1-hour golden cross, short-term funds have already entered the market, with a spike at 2110 forming a short-term liquidity grab for long positions, buy orders are flooding in, and in the short term, it seems unlikely to break down.\n \nTake 2250-2260 as a short-term dynamic iron bottom (1h-MA20), then 2120-2150 is the final defense line, with 2421 as the pivot balance point being the first resistance level; if surpassed, it will directly rush to 2534-2562, this range is the only pressure point!\n \nFor those who do not understand the technical explanation, look at the brainless points below.\nBuy the dip, go long with closed eyes.\nEntry: Enter directly when 2250-2260 stabilizes after a pullback, watch for bullish candlestick formations in 1 hour to increase positions!\nStop-loss: Below 2180 (if it breaks down, exit immediately based on rebound logic)\nTake profit: Reduce positions by 50% at 2420, liquidate at 2530.\nPosition: Within 5%, light positions for high returns.\n{future}(ETHUSDT)
$ETH Short sellers are completely exhausted, hold at 2250 and go long directly, close your eyes and count the money!\n \nShort sellers directly liquidated 5.52 million dollars, while long positions only cleared 550,000; short sellers are completely exhausted!\nAlthough seeking a sword in the boat is a foolish thing in the cryptocurrency world, why not treat this position with a 70% chance of a rebound as an indicator? Now, the MACD green bars are shrinking + 1-hour golden cross, short-term funds have already entered the market, with a spike at 2110 forming a short-term liquidity grab for long positions, buy orders are flooding in, and in the short term, it seems unlikely to break down.\n \nTake 2250-2260 as a short-term dynamic iron bottom (1h-MA20), then 2120-2150 is the final defense line, with 2421 as the pivot balance point being the first resistance level; if surpassed, it will directly rush to 2534-2562, this range is the only pressure point!\n \nFor those who do not understand the technical explanation, look at the brainless points below.\nBuy the dip, go long with closed eyes.\nEntry: Enter directly when 2250-2260 stabilizes after a pullback, watch for bullish candlestick formations in 1 hour to increase positions!\nStop-loss: Below 2180 (if it breaks down, exit immediately based on rebound logic)\nTake profit: Reduce positions by 50% at 2420, liquidate at 2530.\nPosition: Within 5%, light positions for high returns.\n
8
3
829
·
--
Bearish
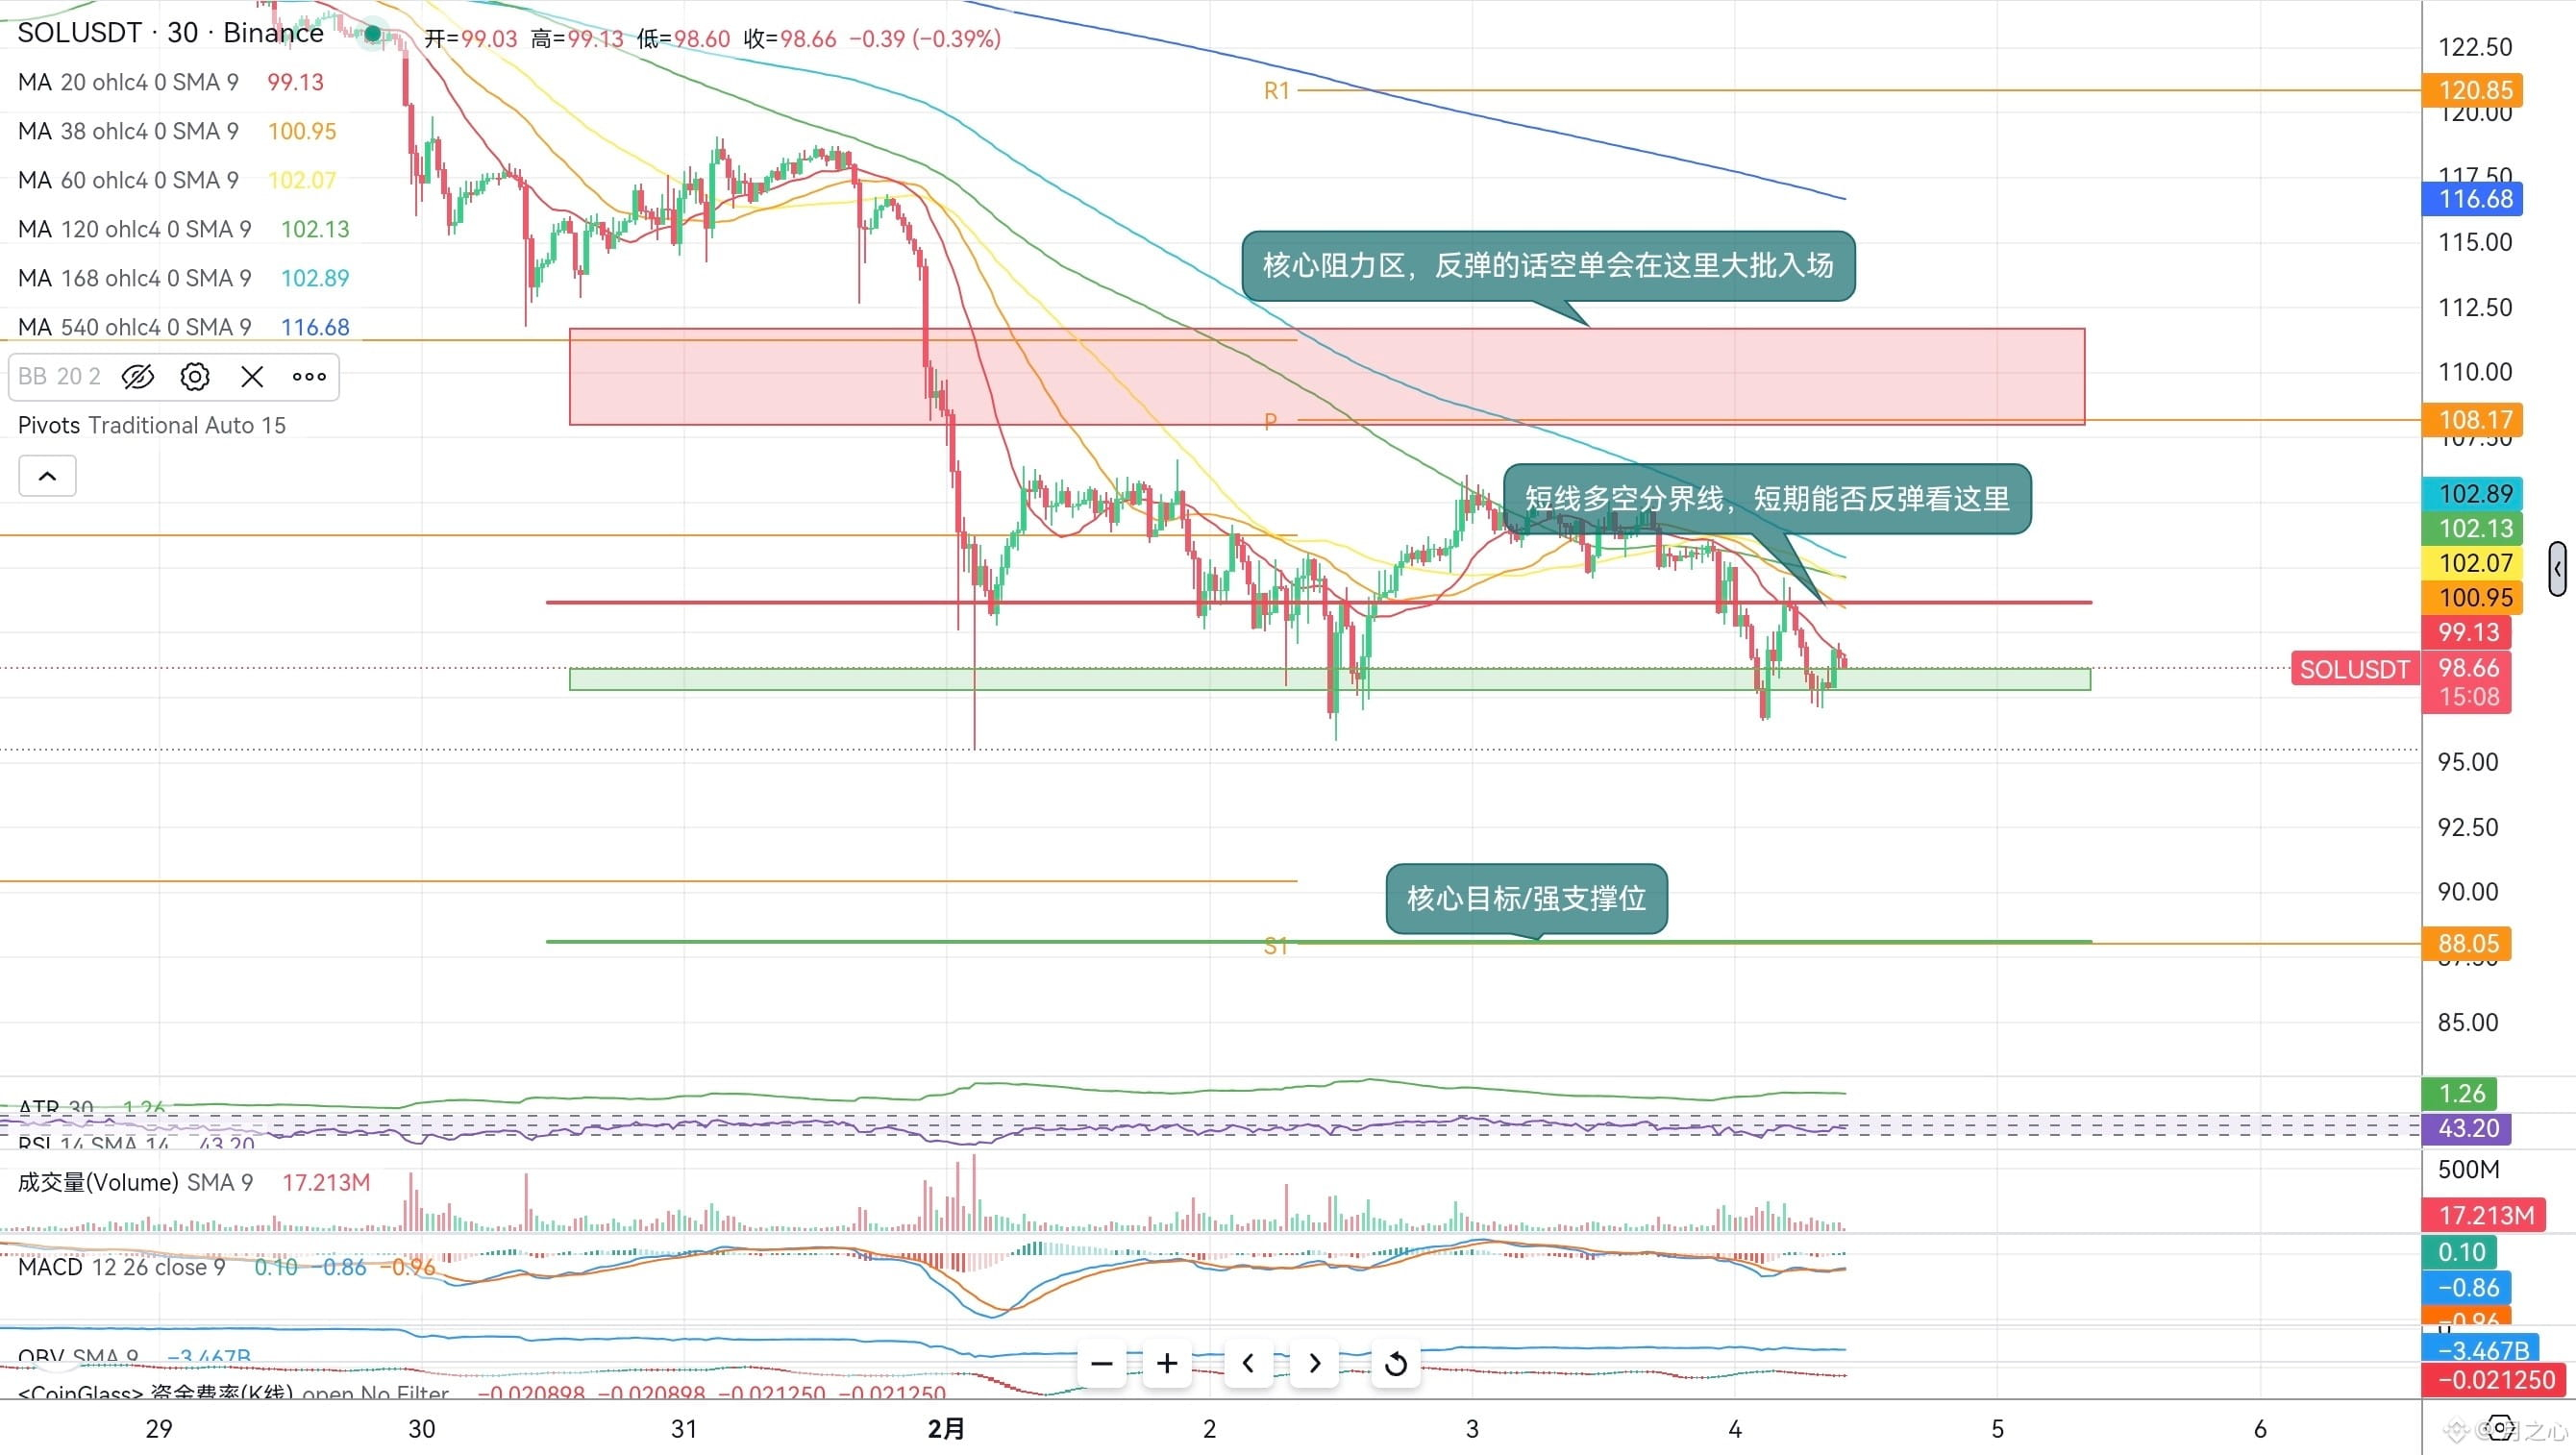
$SOL How does being oversold matter? The trend is bearish and is directly hammering you, copying will lead to loss.
Currently, the daily RSI has already plunged into the extremely oversold zone, with bulls slightly surpassing bears in liquidation, and it seems unable to drop further in the short term, wanting to stabilize and build a bottom.
However, all moving averages are bearish, and the MACD is under pressure at the zero line; what can we do when the overall trend is still bearish?
The expectation for the next 3-5 days is to bounce back before falling again, with all rebounds being opportunities to short, and short-term longs can only be bets on oversold recovery.
Moreover, if you look at derivatives, there is no extreme panic; the sentiment remains neutrally bearish, just corresponding to a situation where after a stabilization bounce, it continues to fall.
Right now, the core strategy is to short on rallies.
For light positions, directly enter around 101.15 on the bounce, with a stop loss above 102, targeting initially at 97.8-98.6, and if it breaks down, look to pursue at 88.1.
For heavy positions, weaken in the range of 108-111.7 on the bounce, with a stop loss above 112, directly targeting 88.1.
{future}(SOLUSDT)
$SOL How does being oversold matter? The trend is bearish and is directly hammering you, copying will lead to loss.
Currently, the daily RSI has already plunged into the extremely oversold zone, with bulls slightly surpassing bears in liquidation, and it seems unable to drop further in the short term, wanting to stabilize and build a bottom.
However, all moving averages are bearish, and the MACD is under pressure at the zero line; what can we do when the overall trend is still bearish?
The expectation for the next 3-5 days is to bounce back before falling again, with all rebounds being opportunities to short, and short-term longs can only be bets on oversold recovery.
Moreover, if you look at derivatives, there is no extreme panic; the sentiment remains neutrally bearish, just corresponding to a situation where after a stabilization bounce, it continues to fall.
Right now, the core strategy is to short on rallies.
For light positions, directly enter around 101.15 on the bounce, with a stop loss above 102, targeting initially at 97.8-98.6, and if it breaks down, look to pursue at 88.1.
For heavy positions, weaken in the range of 108-111.7 on the bounce, with a stop loss above 112, directly targeting 88.1.
Currently, the daily RSI has already plunged into the extremely oversold zone, with bulls slightly surpassing bears in liquidation, and it seems unable to drop further in the short term, wanting to stabilize and build a bottom.
However, all moving averages are bearish, and the MACD is under pressure at the zero line; what can we do when the overall trend is still bearish?
The expectation for the next 3-5 days is to bounce back before falling again, with all rebounds being opportunities to short, and short-term longs can only be bets on oversold recovery.
Moreover, if you look at derivatives, there is no extreme panic; the sentiment remains neutrally bearish, just corresponding to a situation where after a stabilization bounce, it continues to fall.
Right now, the core strategy is to short on rallies.
For light positions, directly enter around 101.15 on the bounce, with a stop loss above 102, targeting initially at 97.8-98.6, and if it breaks down, look to pursue at 88.1.
For heavy positions, weaken in the range of 108-111.7 on the bounce, with a stop loss above 112, directly targeting 88.1.
13
13
3.4k
·
--
Bearish
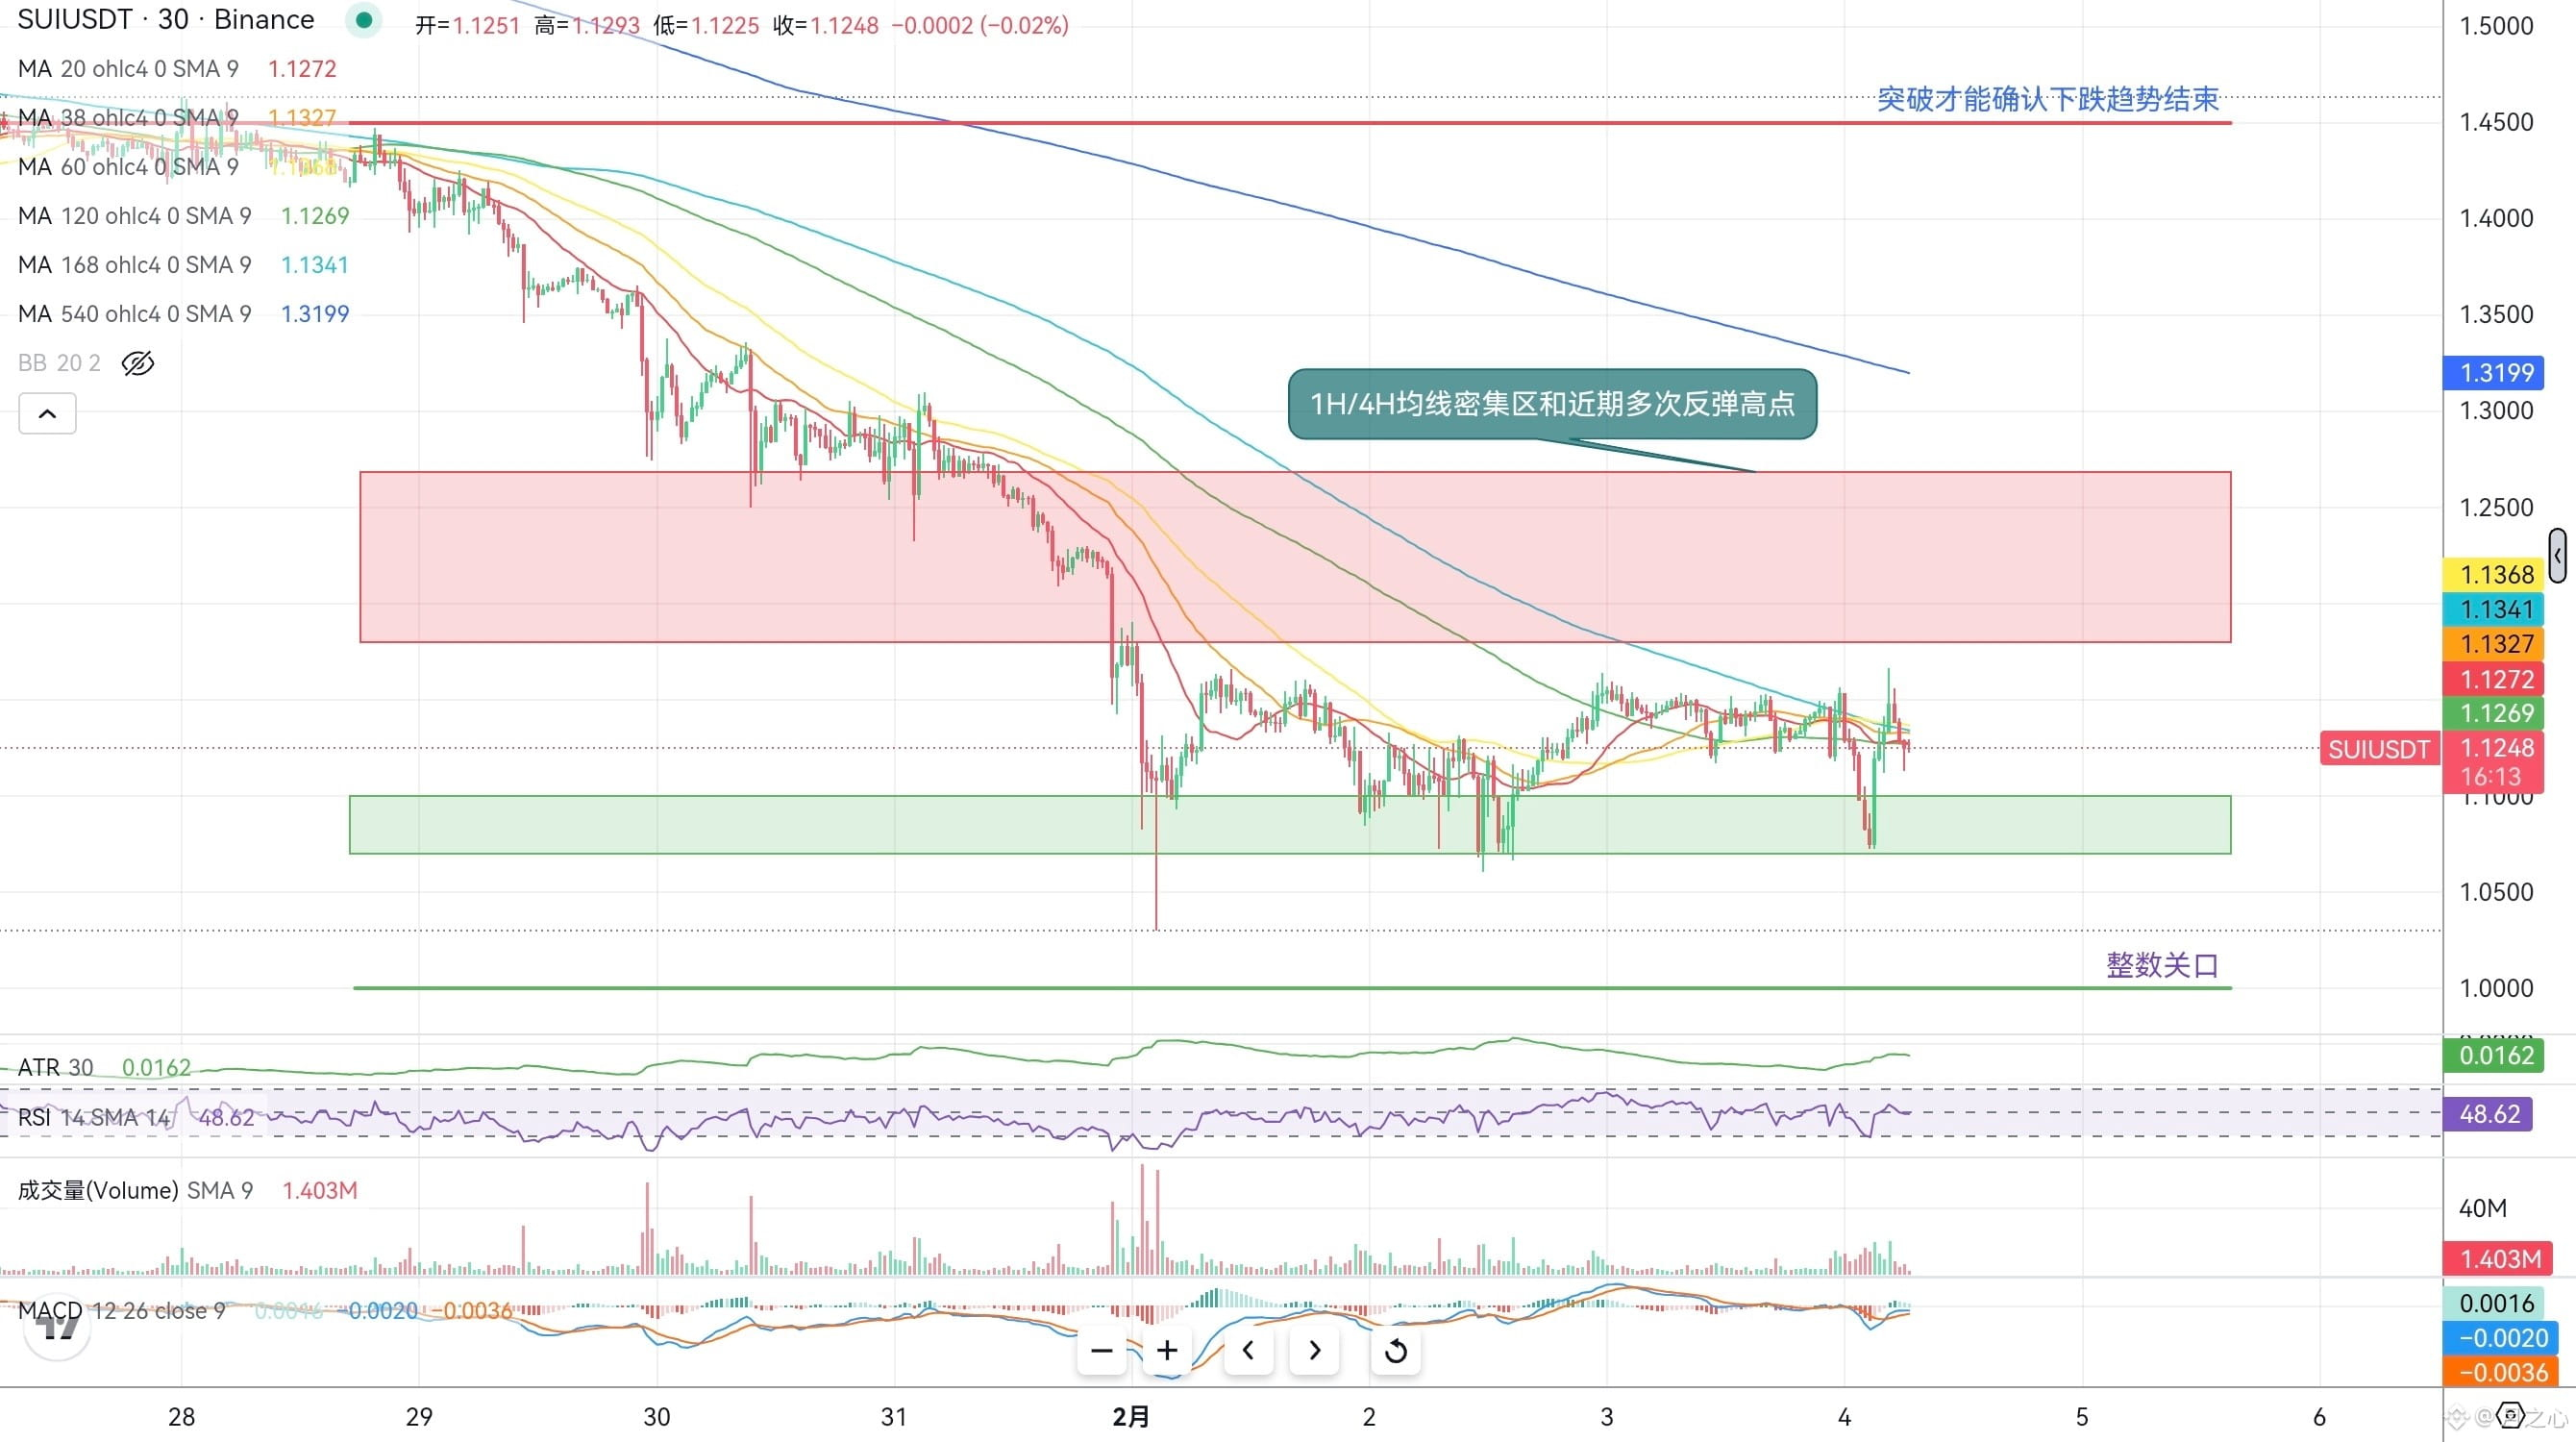
$SUI The bottom pants have all fallen off, the shorts are gathering! The rebound is just empty
SUI is now in a state of continuous decline, down 20% in 7 days, the bulls are being liquidated, and the entire market is short
Do not expect a reversal in 3-5 days; it’s just a bearish oscillation, and any rebound is just giving money to the shorts
Currently, SUI has clear resistance levels that are pressing down, the area above 1.132-1.18 is filled with moving averages and previous rebound trapped positions. Any rebound to 1.15-1.17 simply lacks the volume to break through, shorting directly is the right move
1.05, as long as it closes below in 1 hour, it will not stop at 1.00
The main issue is that the shorts have no intention of stopping, all the moving averages are in a bearish arrangement. Don’t be fooled by the RSI being oversold; in this trend, being oversold won’t lead to a rebound, only sideways grinding or continued decline
Two words: short
If you see weakness in the 1.15-1.17 range, directly open a light position to short, set the stop loss above 1.20, and first watch if 1.07 breaks, then continue to look down to 1.00
If 1.07 is directly pierced by a solid bearish candle, just follow the trend to short, and set the stop loss at 1.09
Going long to catch the bottom will definitely get trapped
{future}(SUIUSDT)
$SUI The bottom pants have all fallen off, the shorts are gathering! The rebound is just empty
SUI is now in a state of continuous decline, down 20% in 7 days, the bulls are being liquidated, and the entire market is short
Do not expect a reversal in 3-5 days; it’s just a bearish oscillation, and any rebound is just giving money to the shorts
Currently, SUI has clear resistance levels that are pressing down, the area above 1.132-1.18 is filled with moving averages and previous rebound trapped positions. Any rebound to 1.15-1.17 simply lacks the volume to break through, shorting directly is the right move
1.05, as long as it closes below in 1 hour, it will not stop at 1.00
The main issue is that the shorts have no intention of stopping, all the moving averages are in a bearish arrangement. Don’t be fooled by the RSI being oversold; in this trend, being oversold won’t lead to a rebound, only sideways grinding or continued decline
Two words: short
If you see weakness in the 1.15-1.17 range, directly open a light position to short, set the stop loss above 1.20, and first watch if 1.07 breaks, then continue to look down to 1.00
If 1.07 is directly pierced by a solid bearish candle, just follow the trend to short, and set the stop loss at 1.09
Going long to catch the bottom will definitely get trapped
SUI is now in a state of continuous decline, down 20% in 7 days, the bulls are being liquidated, and the entire market is short
Do not expect a reversal in 3-5 days; it’s just a bearish oscillation, and any rebound is just giving money to the shorts
Currently, SUI has clear resistance levels that are pressing down, the area above 1.132-1.18 is filled with moving averages and previous rebound trapped positions. Any rebound to 1.15-1.17 simply lacks the volume to break through, shorting directly is the right move
1.05, as long as it closes below in 1 hour, it will not stop at 1.00
The main issue is that the shorts have no intention of stopping, all the moving averages are in a bearish arrangement. Don’t be fooled by the RSI being oversold; in this trend, being oversold won’t lead to a rebound, only sideways grinding or continued decline
Two words: short
If you see weakness in the 1.15-1.17 range, directly open a light position to short, set the stop loss above 1.20, and first watch if 1.07 breaks, then continue to look down to 1.00
If 1.07 is directly pierced by a solid bearish candle, just follow the trend to short, and set the stop loss at 1.09
Going long to catch the bottom will definitely get trapped
6
5
1.3k
·
--
Bullish
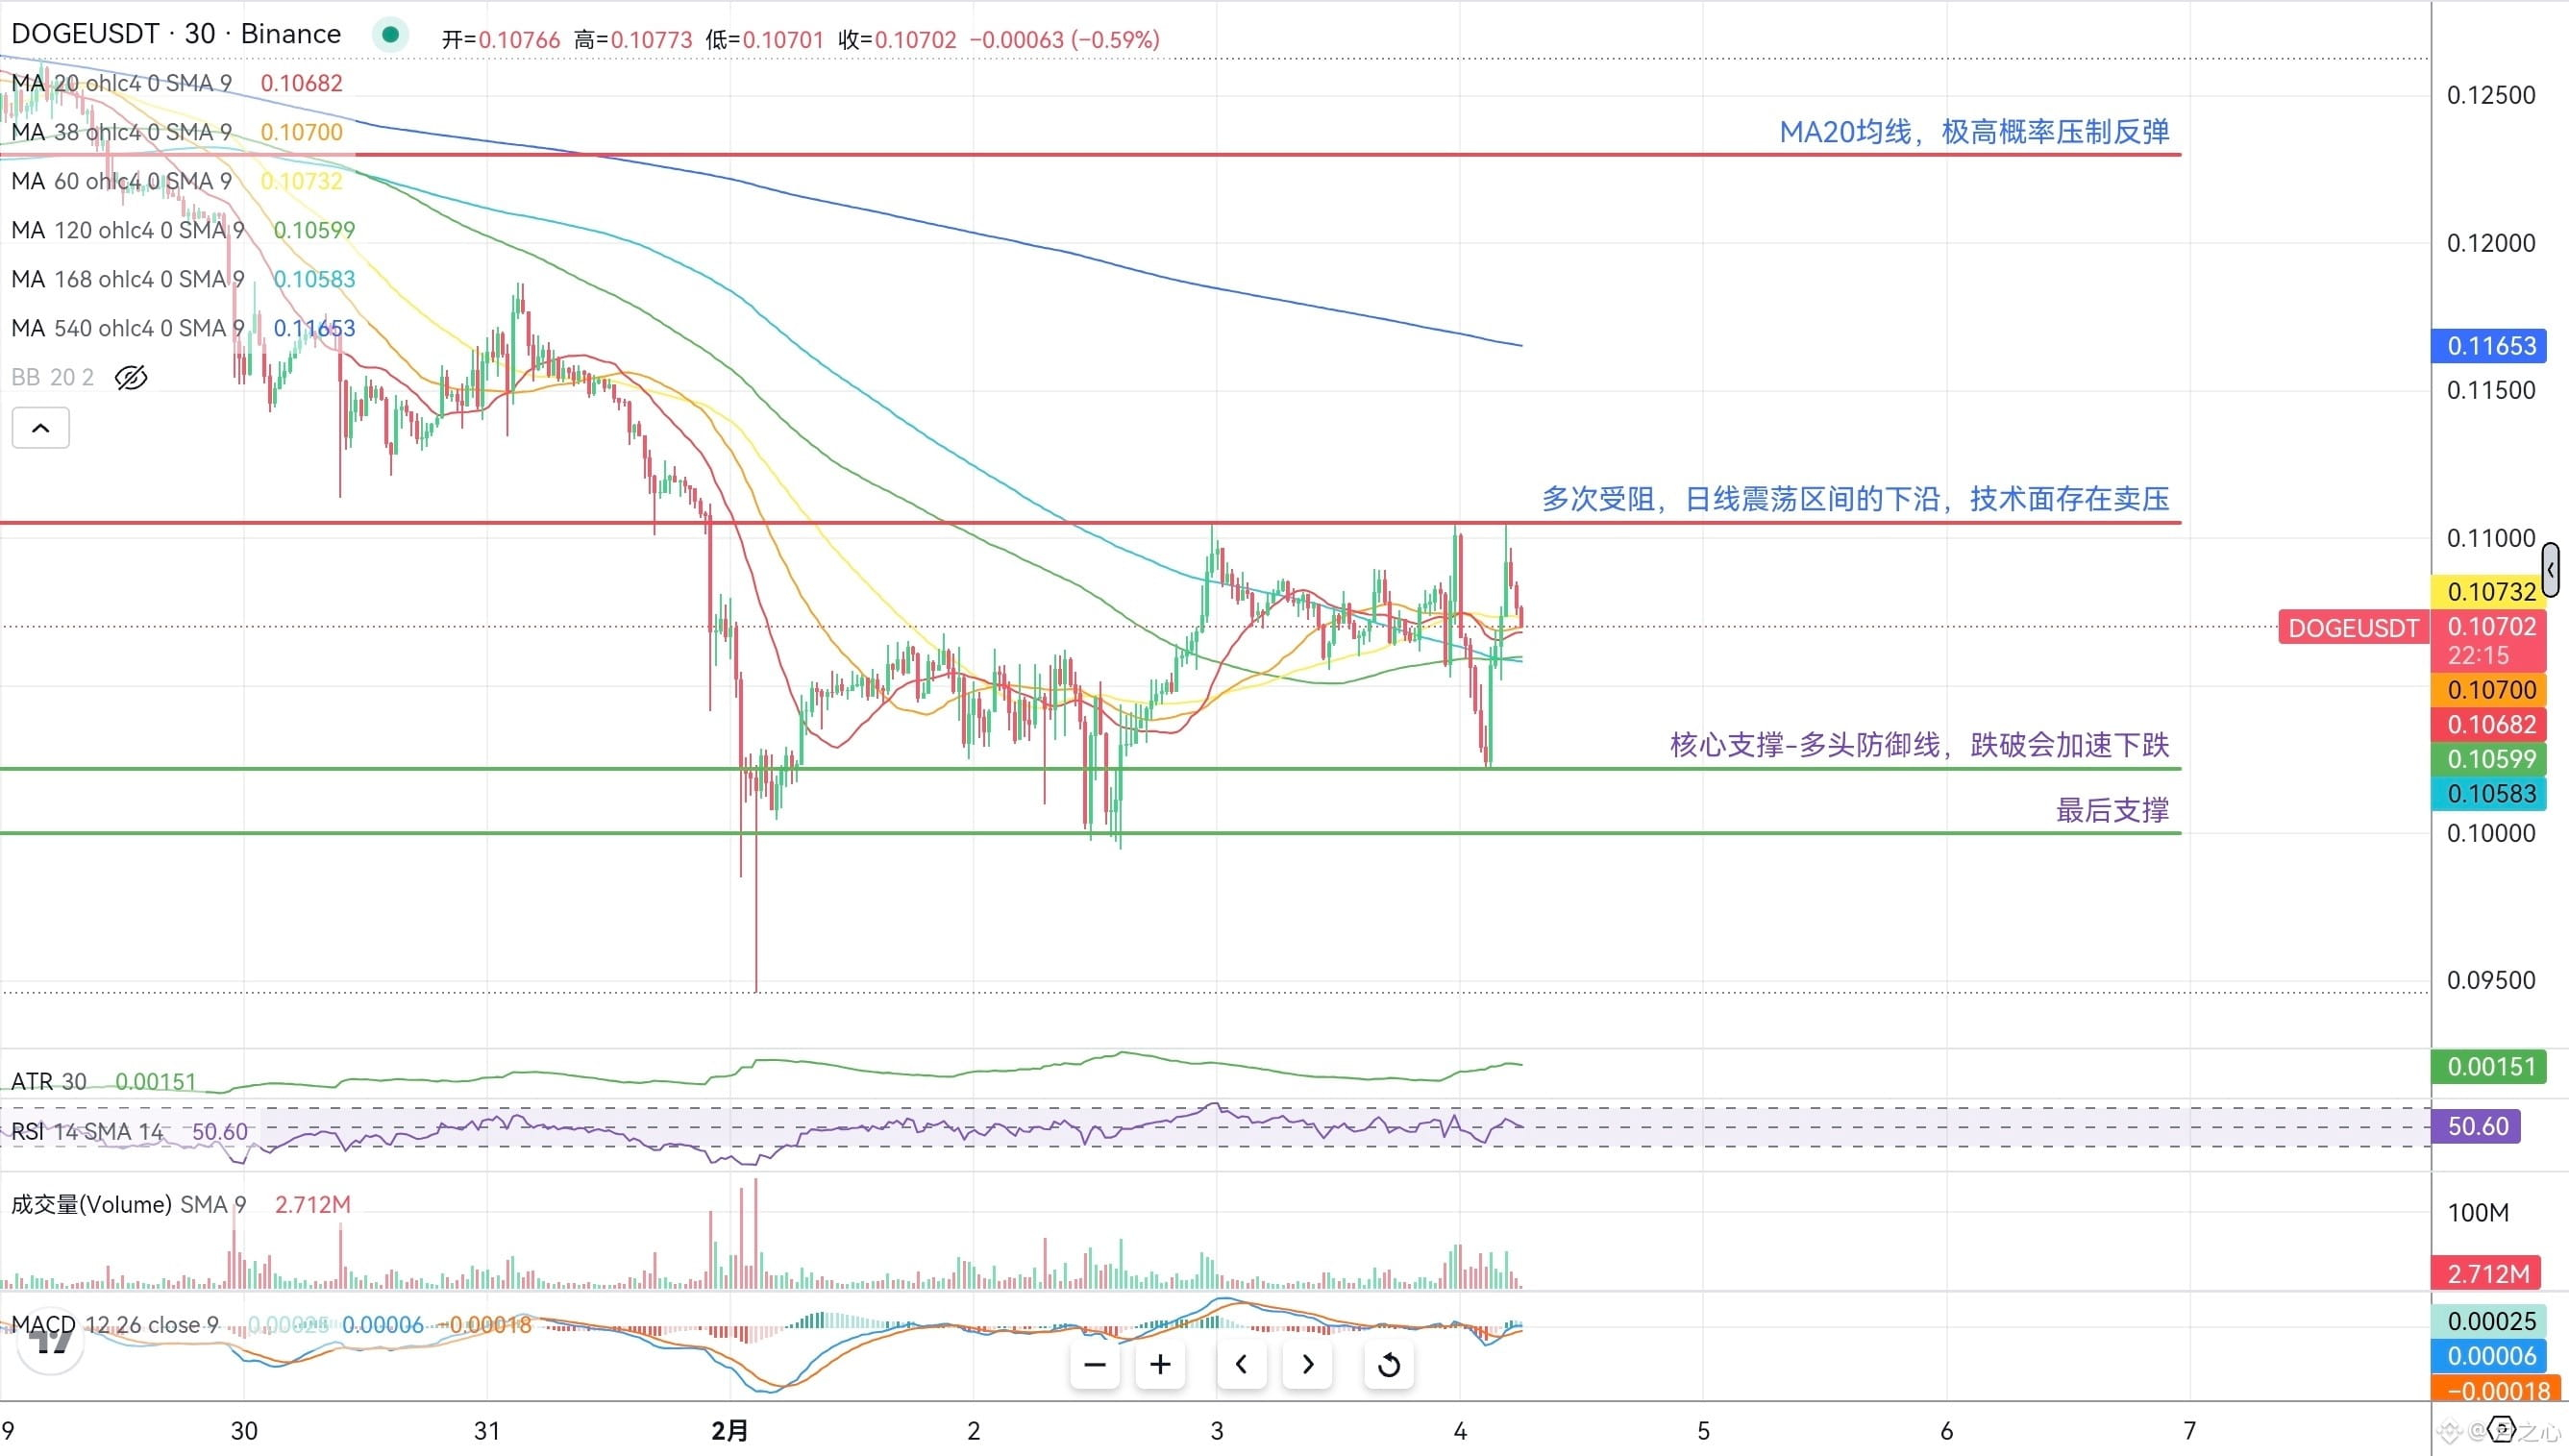
$DOGE The reversal is here, bottoming V reversal! Stop chasing shorts and giving away money!
Dogecoin has fallen 14.5% in 7 days and has now made a V-shaped rebound on the hourly chart. The bearish momentum is weakening, and the downside space is limited.
Going long on dips seems to be the best solution.
After a quick rebound following the bottom today, the support at the 0.102-0.1 level is quite critical, acting as the clearest defense line for bulls.
If it doesn't break down, it will undergo a low-level oscillation to build a bottom, with initial resistance at 0.1105, which is a recent pressure point. If it breaks through, then look for 0.115.
Currently, the strongest pressure is at the MA20 daily moving average, and it is difficult to break through in the short term.
Overall, the pattern is one of low-level oscillation, and market sentiment isn't showing any extreme reactions. There is a significant divergence between bulls and bears, making it suitable for light positions to bet on a rebound.
Enter light positions in the 0.103-0.105 range, with strict stop-loss below 0.102. The first target is 0.110.
The current price is near strong support, and the risk of chasing shorts is too high unless it breaks down and shifts back to a bearish mindset.
{future}(DOGEUSDT)
$DOGE The reversal is here, bottoming V reversal! Stop chasing shorts and giving away money!
Dogecoin has fallen 14.5% in 7 days and has now made a V-shaped rebound on the hourly chart. The bearish momentum is weakening, and the downside space is limited.
Going long on dips seems to be the best solution.
After a quick rebound following the bottom today, the support at the 0.102-0.1 level is quite critical, acting as the clearest defense line for bulls.
If it doesn't break down, it will undergo a low-level oscillation to build a bottom, with initial resistance at 0.1105, which is a recent pressure point. If it breaks through, then look for 0.115.
Currently, the strongest pressure is at the MA20 daily moving average, and it is difficult to break through in the short term.
Overall, the pattern is one of low-level oscillation, and market sentiment isn't showing any extreme reactions. There is a significant divergence between bulls and bears, making it suitable for light positions to bet on a rebound.
Enter light positions in the 0.103-0.105 range, with strict stop-loss below 0.102. The first target is 0.110.
The current price is near strong support, and the risk of chasing shorts is too high unless it breaks down and shifts back to a bearish mindset.
Dogecoin has fallen 14.5% in 7 days and has now made a V-shaped rebound on the hourly chart. The bearish momentum is weakening, and the downside space is limited.
Going long on dips seems to be the best solution.
After a quick rebound following the bottom today, the support at the 0.102-0.1 level is quite critical, acting as the clearest defense line for bulls.
If it doesn't break down, it will undergo a low-level oscillation to build a bottom, with initial resistance at 0.1105, which is a recent pressure point. If it breaks through, then look for 0.115.
Currently, the strongest pressure is at the MA20 daily moving average, and it is difficult to break through in the short term.
Overall, the pattern is one of low-level oscillation, and market sentiment isn't showing any extreme reactions. There is a significant divergence between bulls and bears, making it suitable for light positions to bet on a rebound.
Enter light positions in the 0.103-0.105 range, with strict stop-loss below 0.102. The first target is 0.110.
The current price is near strong support, and the risk of chasing shorts is too high unless it breaks down and shifts back to a bearish mindset.
5
3
903
·
--
$XAU Do you really understand gold? Do you know how to enter the market?
Come and see how the 'people' who understand play with gold
{future}(XAUUSDT)
$XAU Do you really understand gold? Do you know how to enter the market?
Come and see how the 'people' who understand play with gold
Come and see how the 'people' who understand play with gold

23
2
10
11.4k
·
--
Bearish
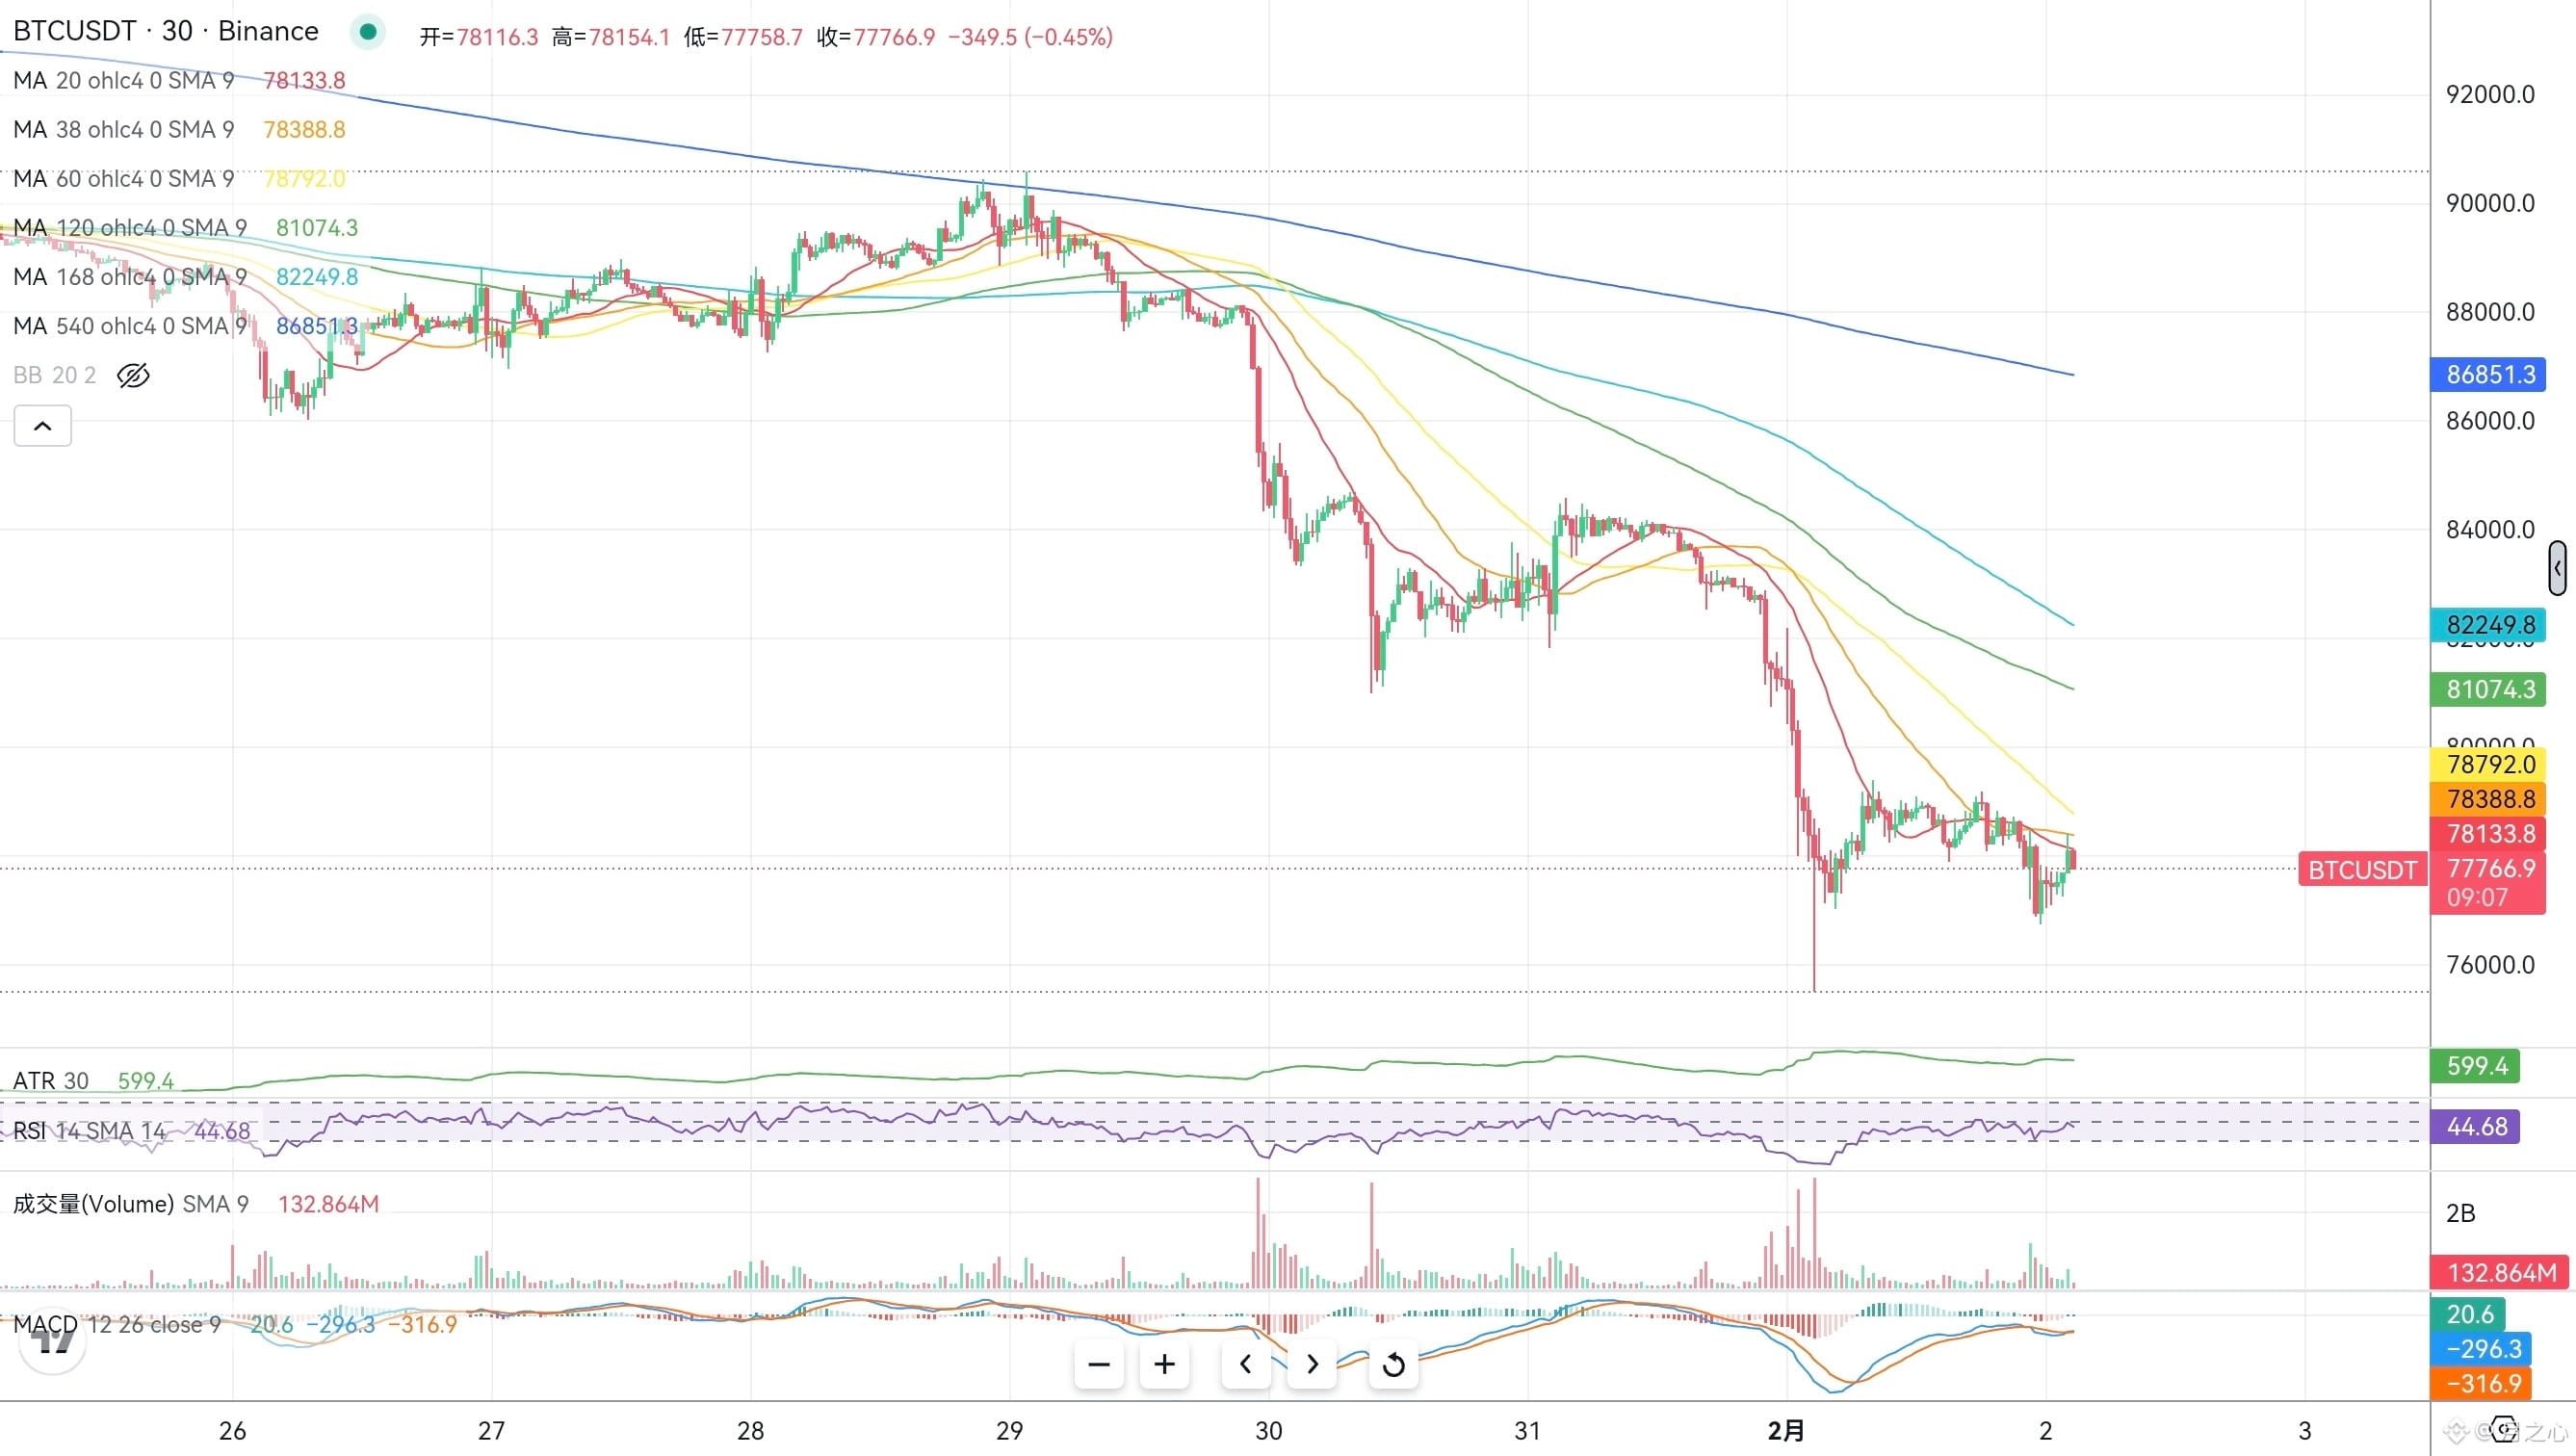
#BTC何时反弹? 78000 is the line between life and death
The current price of BTC is around 78000, and it dropped 6.4% in a single day yesterday, breaking through all support levels. The market is filled with panic selling, but in this extreme market, the conditions for a rebound have quietly brewed. However, to truly bounce back, it has to overcome several key obstacles. As for when the rebound will come, it all depends on the performance of the 78000 support level.
Currently, BTC is typically oversold but the trend hasn’t changed: the Fear and Greed Index has dropped to 15, firmly in the extreme fear zone. Historically, whenever this value is near, there has generally been a short-term technical rebound. The RSI has also fallen into the severely oversold range, and the bearish momentum has largely been released. This is why it is said that the short-term window for a rebound is most likely to occur within 24-72 hours. However, it must be clear that the current MACD has a dead cross pointing downwards, all moving averages have broken, and the bearish pattern still persists. Such an oversold rebound is likely the result of short sellers covering their positions, not a trend reversal, so don’t expect to get rich overnight.
Whether a rebound can occur and how high it can go, the 78000-77000 range is the first line of life and death. This is the low point that was broken on February 1, and it currently serves as technical support. As long as it holds and shows a volume increase, the rebound can basically be triggered. However, if it breaks down, it will test the 75000 range again, or even lower to 72000, at which point the idea of a rebound will be completely invalidated, and it will have to drop further.
If it holds and welcomes a rebound, be aware of the resistance above; don't have overly high expectations for the rebound magnitude. The first resistance is at the psychological barrier of 80000, which is also where the short-term moving averages converge. A rebound to this level will likely encounter pressure, and above that, it’s 83000-84000, where the previous low has now become a strong resistance level. Only if it can rise above 85000 will the possibility of a mid-term rebound increase. From a conservative perspective, the rebound target is between 83000-85000, which can rise 5%-8%. Without major catalysts like institutional buying, bouncing back to 90000+ is basically hopeless.
As for how to operate, different styles of traders have different methods, and I won't elaborate further since it has been discussed in the pinned post.
To clarify, a true rebound signal must satisfy these three conditions:
1. The 78000 support must hold firmly and show a significant rebound
2. The Fear and Greed Index must start to rise from 15
3. The price must effectively stand above the psychological barrier of 80000
All three signals are indispensable; do not mistake a short-term rebound for a reversal, and keep your hands steady.
{future}(BTCUSDT)
#BTC何时反弹? 78000 is the line between life and death
The current price of BTC is around 78000, and it dropped 6.4% in a single day yesterday, breaking through all support levels. The market is filled with panic selling, but in this extreme market, the conditions for a rebound have quietly brewed. However, to truly bounce back, it has to overcome several key obstacles. As for when the rebound will come, it all depends on the performance of the 78000 support level.
Currently, BTC is typically oversold but the trend hasn’t changed: the Fear and Greed Index has dropped to 15, firmly in the extreme fear zone. Historically, whenever this value is near, there has generally been a short-term technical rebound. The RSI has also fallen into the severely oversold range, and the bearish momentum has largely been released. This is why it is said that the short-term window for a rebound is most likely to occur within 24-72 hours. However, it must be clear that the current MACD has a dead cross pointing downwards, all moving averages have broken, and the bearish pattern still persists. Such an oversold rebound is likely the result of short sellers covering their positions, not a trend reversal, so don’t expect to get rich overnight.
Whether a rebound can occur and how high it can go, the 78000-77000 range is the first line of life and death. This is the low point that was broken on February 1, and it currently serves as technical support. As long as it holds and shows a volume increase, the rebound can basically be triggered. However, if it breaks down, it will test the 75000 range again, or even lower to 72000, at which point the idea of a rebound will be completely invalidated, and it will have to drop further.
If it holds and welcomes a rebound, be aware of the resistance above; don't have overly high expectations for the rebound magnitude. The first resistance is at the psychological barrier of 80000, which is also where the short-term moving averages converge. A rebound to this level will likely encounter pressure, and above that, it’s 83000-84000, where the previous low has now become a strong resistance level. Only if it can rise above 85000 will the possibility of a mid-term rebound increase. From a conservative perspective, the rebound target is between 83000-85000, which can rise 5%-8%. Without major catalysts like institutional buying, bouncing back to 90000+ is basically hopeless.
As for how to operate, different styles of traders have different methods, and I won't elaborate further since it has been discussed in the pinned post.
To clarify, a true rebound signal must satisfy these three conditions:
1. The 78000 support must hold firmly and show a significant rebound
2. The Fear and Greed Index must start to rise from 15
3. The price must effectively stand above the psychological barrier of 80000
All three signals are indispensable; do not mistake a short-term rebound for a reversal, and keep your hands steady.
The current price of BTC is around 78000, and it dropped 6.4% in a single day yesterday, breaking through all support levels. The market is filled with panic selling, but in this extreme market, the conditions for a rebound have quietly brewed. However, to truly bounce back, it has to overcome several key obstacles. As for when the rebound will come, it all depends on the performance of the 78000 support level.
Currently, BTC is typically oversold but the trend hasn’t changed: the Fear and Greed Index has dropped to 15, firmly in the extreme fear zone. Historically, whenever this value is near, there has generally been a short-term technical rebound. The RSI has also fallen into the severely oversold range, and the bearish momentum has largely been released. This is why it is said that the short-term window for a rebound is most likely to occur within 24-72 hours. However, it must be clear that the current MACD has a dead cross pointing downwards, all moving averages have broken, and the bearish pattern still persists. Such an oversold rebound is likely the result of short sellers covering their positions, not a trend reversal, so don’t expect to get rich overnight.
Whether a rebound can occur and how high it can go, the 78000-77000 range is the first line of life and death. This is the low point that was broken on February 1, and it currently serves as technical support. As long as it holds and shows a volume increase, the rebound can basically be triggered. However, if it breaks down, it will test the 75000 range again, or even lower to 72000, at which point the idea of a rebound will be completely invalidated, and it will have to drop further.
If it holds and welcomes a rebound, be aware of the resistance above; don't have overly high expectations for the rebound magnitude. The first resistance is at the psychological barrier of 80000, which is also where the short-term moving averages converge. A rebound to this level will likely encounter pressure, and above that, it’s 83000-84000, where the previous low has now become a strong resistance level. Only if it can rise above 85000 will the possibility of a mid-term rebound increase. From a conservative perspective, the rebound target is between 83000-85000, which can rise 5%-8%. Without major catalysts like institutional buying, bouncing back to 90000+ is basically hopeless.
As for how to operate, different styles of traders have different methods, and I won't elaborate further since it has been discussed in the pinned post.
To clarify, a true rebound signal must satisfy these three conditions:
1. The 78000 support must hold firmly and show a significant rebound
2. The Fear and Greed Index must start to rise from 15
3. The price must effectively stand above the psychological barrier of 80000
All three signals are indispensable; do not mistake a short-term rebound for a reversal, and keep your hands steady.
1
3
1.1k
·
--
Bearish
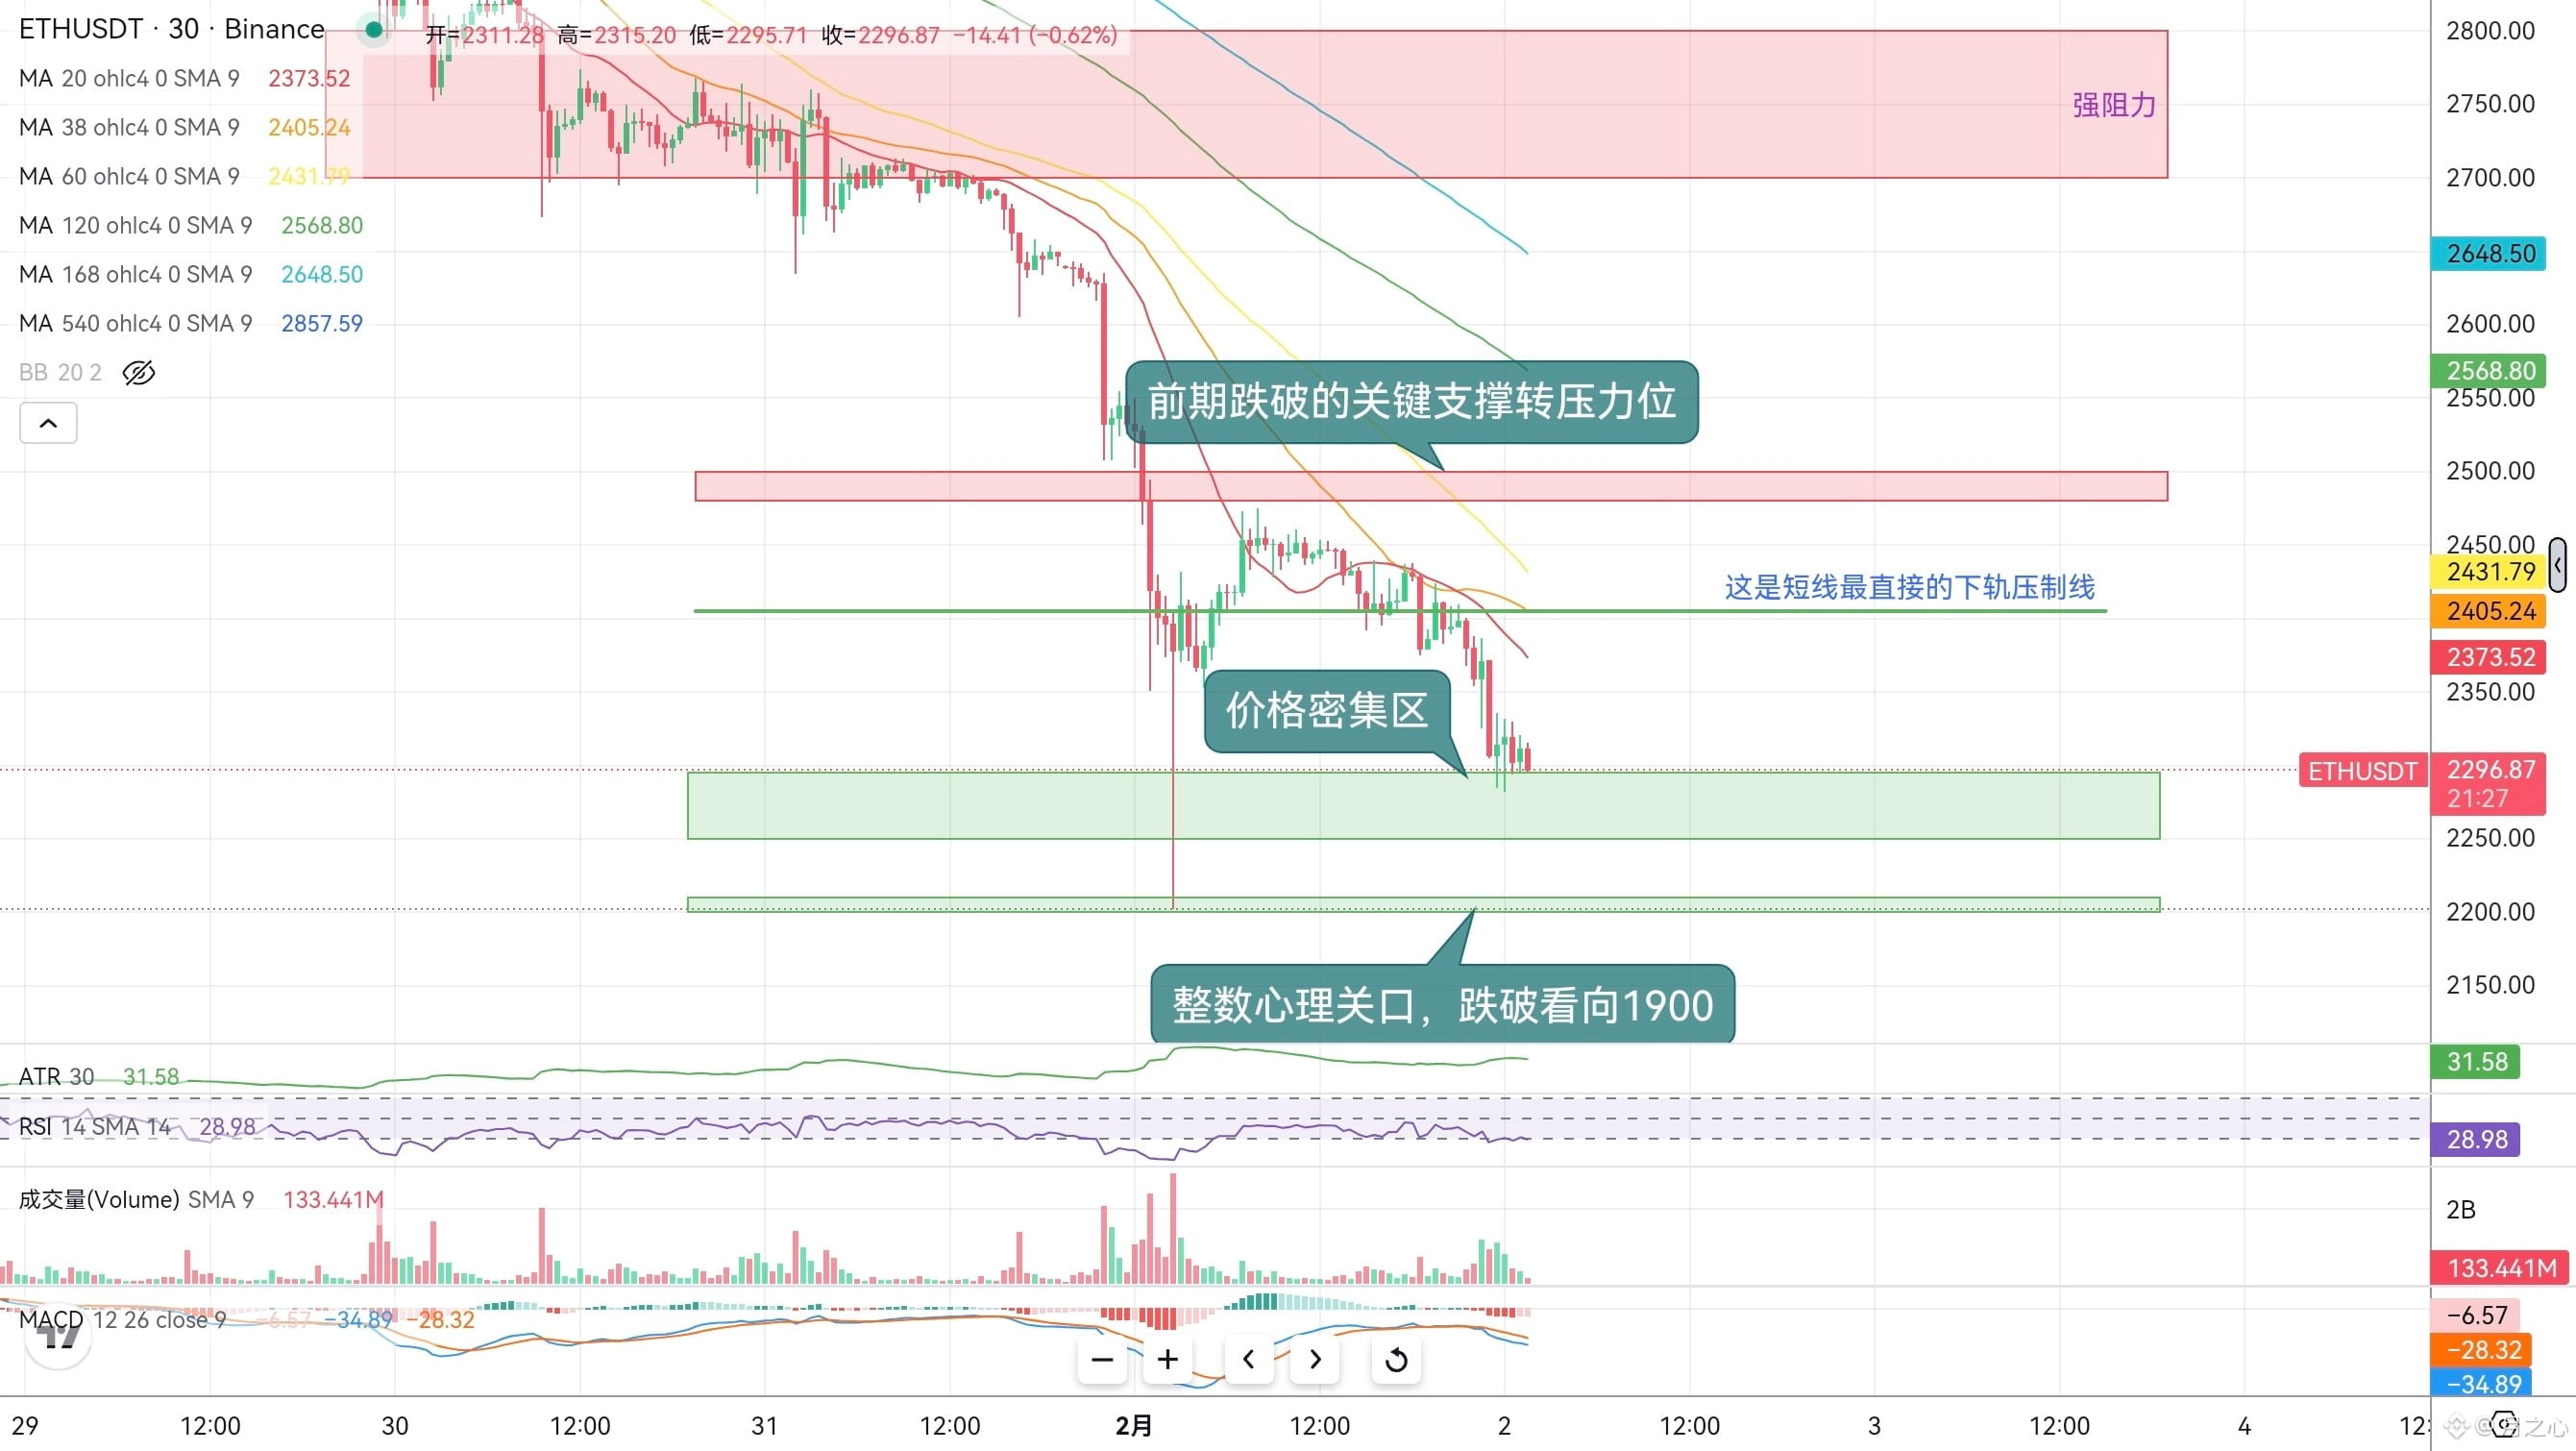
$ETH 2297 overselling inducement, rebound 2400 directly short
Daily plunge of 10%, RSI appears oversold, but is actually a trap after breaking position, the current trend is still bearish, bottom fishing is just giving away money
After the symmetrical triangle pattern breaks down, it is pushing towards 22, 2295 is just weak support, 2200-2210 is the last line of defense, breaking down directly looks at 1900
Resistance now is firmly held at 2400-2480, previous support has turned into pressure, and it is difficult for the rebound to break through
It is recommended to lightly short at the rebound 2400-2480, with a stop loss above 2500, and a target of 2250-2300
If testing the market for long, strict stop loss at 2250, target 2400-2450 take profit
ETH is currently dominated by breakdown + negative news, oversold rebound is just an opportunity for bears, bulls should not blindly bottom fish!
{future}(ETHUSDT)
$ETH 2297 overselling inducement, rebound 2400 directly short
Daily plunge of 10%, RSI appears oversold, but is actually a trap after breaking position, the current trend is still bearish, bottom fishing is just giving away money
After the symmetrical triangle pattern breaks down, it is pushing towards 22, 2295 is just weak support, 2200-2210 is the last line of defense, breaking down directly looks at 1900
Resistance now is firmly held at 2400-2480, previous support has turned into pressure, and it is difficult for the rebound to break through
It is recommended to lightly short at the rebound 2400-2480, with a stop loss above 2500, and a target of 2250-2300
If testing the market for long, strict stop loss at 2250, target 2400-2450 take profit
ETH is currently dominated by breakdown + negative news, oversold rebound is just an opportunity for bears, bulls should not blindly bottom fish!
Daily plunge of 10%, RSI appears oversold, but is actually a trap after breaking position, the current trend is still bearish, bottom fishing is just giving away money
After the symmetrical triangle pattern breaks down, it is pushing towards 22, 2295 is just weak support, 2200-2210 is the last line of defense, breaking down directly looks at 1900
Resistance now is firmly held at 2400-2480, previous support has turned into pressure, and it is difficult for the rebound to break through
It is recommended to lightly short at the rebound 2400-2480, with a stop loss above 2500, and a target of 2250-2300
If testing the market for long, strict stop loss at 2250, target 2400-2450 take profit
ETH is currently dominated by breakdown + negative news, oversold rebound is just an opportunity for bears, bulls should not blindly bottom fish!
5
1
3
1.6k
·
--
Article
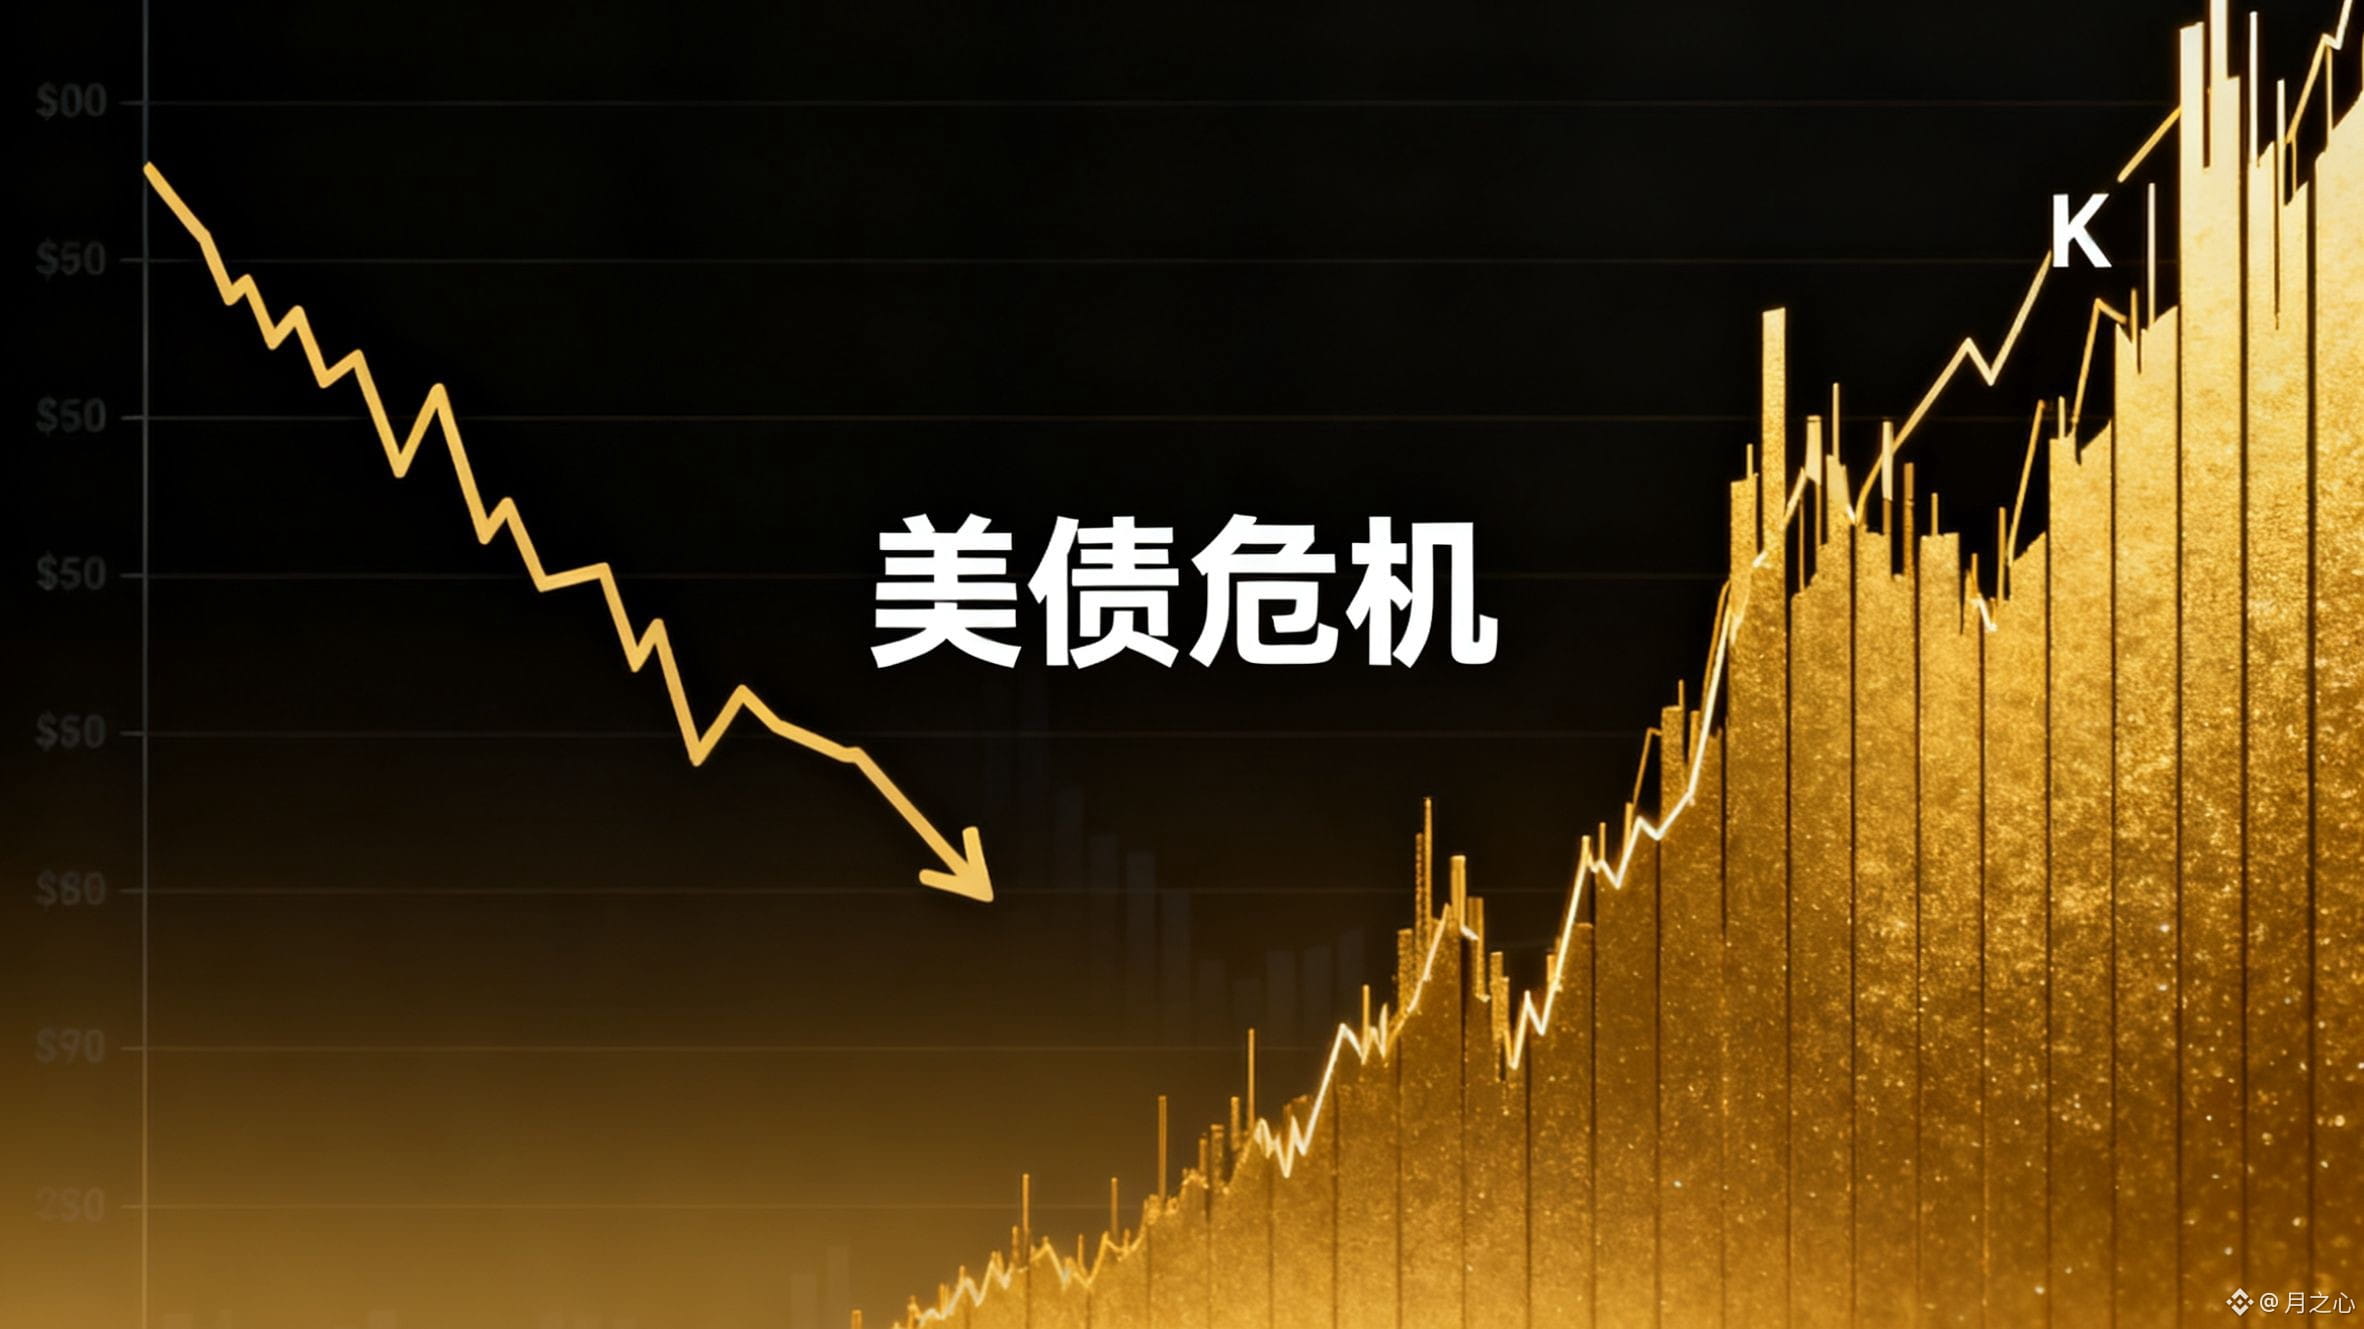
The Last Judgment of the Global Credit SystemThe soft-hearted, scared by a few hawkish remarks from the Federal Reserve, is not worthy of surviving this century's wealth reshuffle—history only rewards those brave enough to see through the essence and mercilessly tramples all the hesitant fools underfoot.
After the collapse of the Bretton Woods system, the US dollar shifted its credit anchor from gold to US Treasury bonds, a change that supported for decades but has now completely backfired. By 2026, the maturing debt will reach 9 trillion, with annual net interest payments exceeding 1 trillion dollars for the first time, needing to repay 2.6 billion daily, directly surpassing the 892.6 billion military spending in 2025. The upper limit for the US Treasury to meet interest payments healthily is only 1 trillion, which is already at the threshold. Lowering interest rates back to below 2.5% is a dead end, and even strict control over the scale of Treasury bonds leaves no options. US Treasuries are the lifeblood of the dollar; if the lifeblood bursts, dollar credit becomes a house of cards, while gold, the 'primitive currency' expelled by the dollar for half a century, is returning as the only trustworthy final settlement tool for global funds. This is fate, and no one can stop it.
The Last Judgment of the Global Credit System
The soft-hearted, scared by a few hawkish remarks from the Federal Reserve, is not worthy of surviving this century's wealth reshuffle—history only rewards those brave enough to see through the essence and mercilessly tramples all the hesitant fools underfoot.
After the collapse of the Bretton Woods system, the US dollar shifted its credit anchor from gold to US Treasury bonds, a change that supported for decades but has now completely backfired. By 2026, the maturing debt will reach 9 trillion, with annual net interest payments exceeding 1 trillion dollars for the first time, needing to repay 2.6 billion daily, directly surpassing the 892.6 billion military spending in 2025. The upper limit for the US Treasury to meet interest payments healthily is only 1 trillion, which is already at the threshold. Lowering interest rates back to below 2.5% is a dead end, and even strict control over the scale of Treasury bonds leaves no options. US Treasuries are the lifeblood of the dollar; if the lifeblood bursts, dollar credit becomes a house of cards, while gold, the 'primitive currency' expelled by the dollar for half a century, is returning as the only trustworthy final settlement tool for global funds. This is fate, and no one can stop it.
After the collapse of the Bretton Woods system, the US dollar shifted its credit anchor from gold to US Treasury bonds, a change that supported for decades but has now completely backfired. By 2026, the maturing debt will reach 9 trillion, with annual net interest payments exceeding 1 trillion dollars for the first time, needing to repay 2.6 billion daily, directly surpassing the 892.6 billion military spending in 2025. The upper limit for the US Treasury to meet interest payments healthily is only 1 trillion, which is already at the threshold. Lowering interest rates back to below 2.5% is a dead end, and even strict control over the scale of Treasury bonds leaves no options. US Treasuries are the lifeblood of the dollar; if the lifeblood bursts, dollar credit becomes a house of cards, while gold, the 'primitive currency' expelled by the dollar for half a century, is returning as the only trustworthy final settlement tool for global funds. This is fate, and no one can stop it.
4
5
2.3k
·
--
Bullish
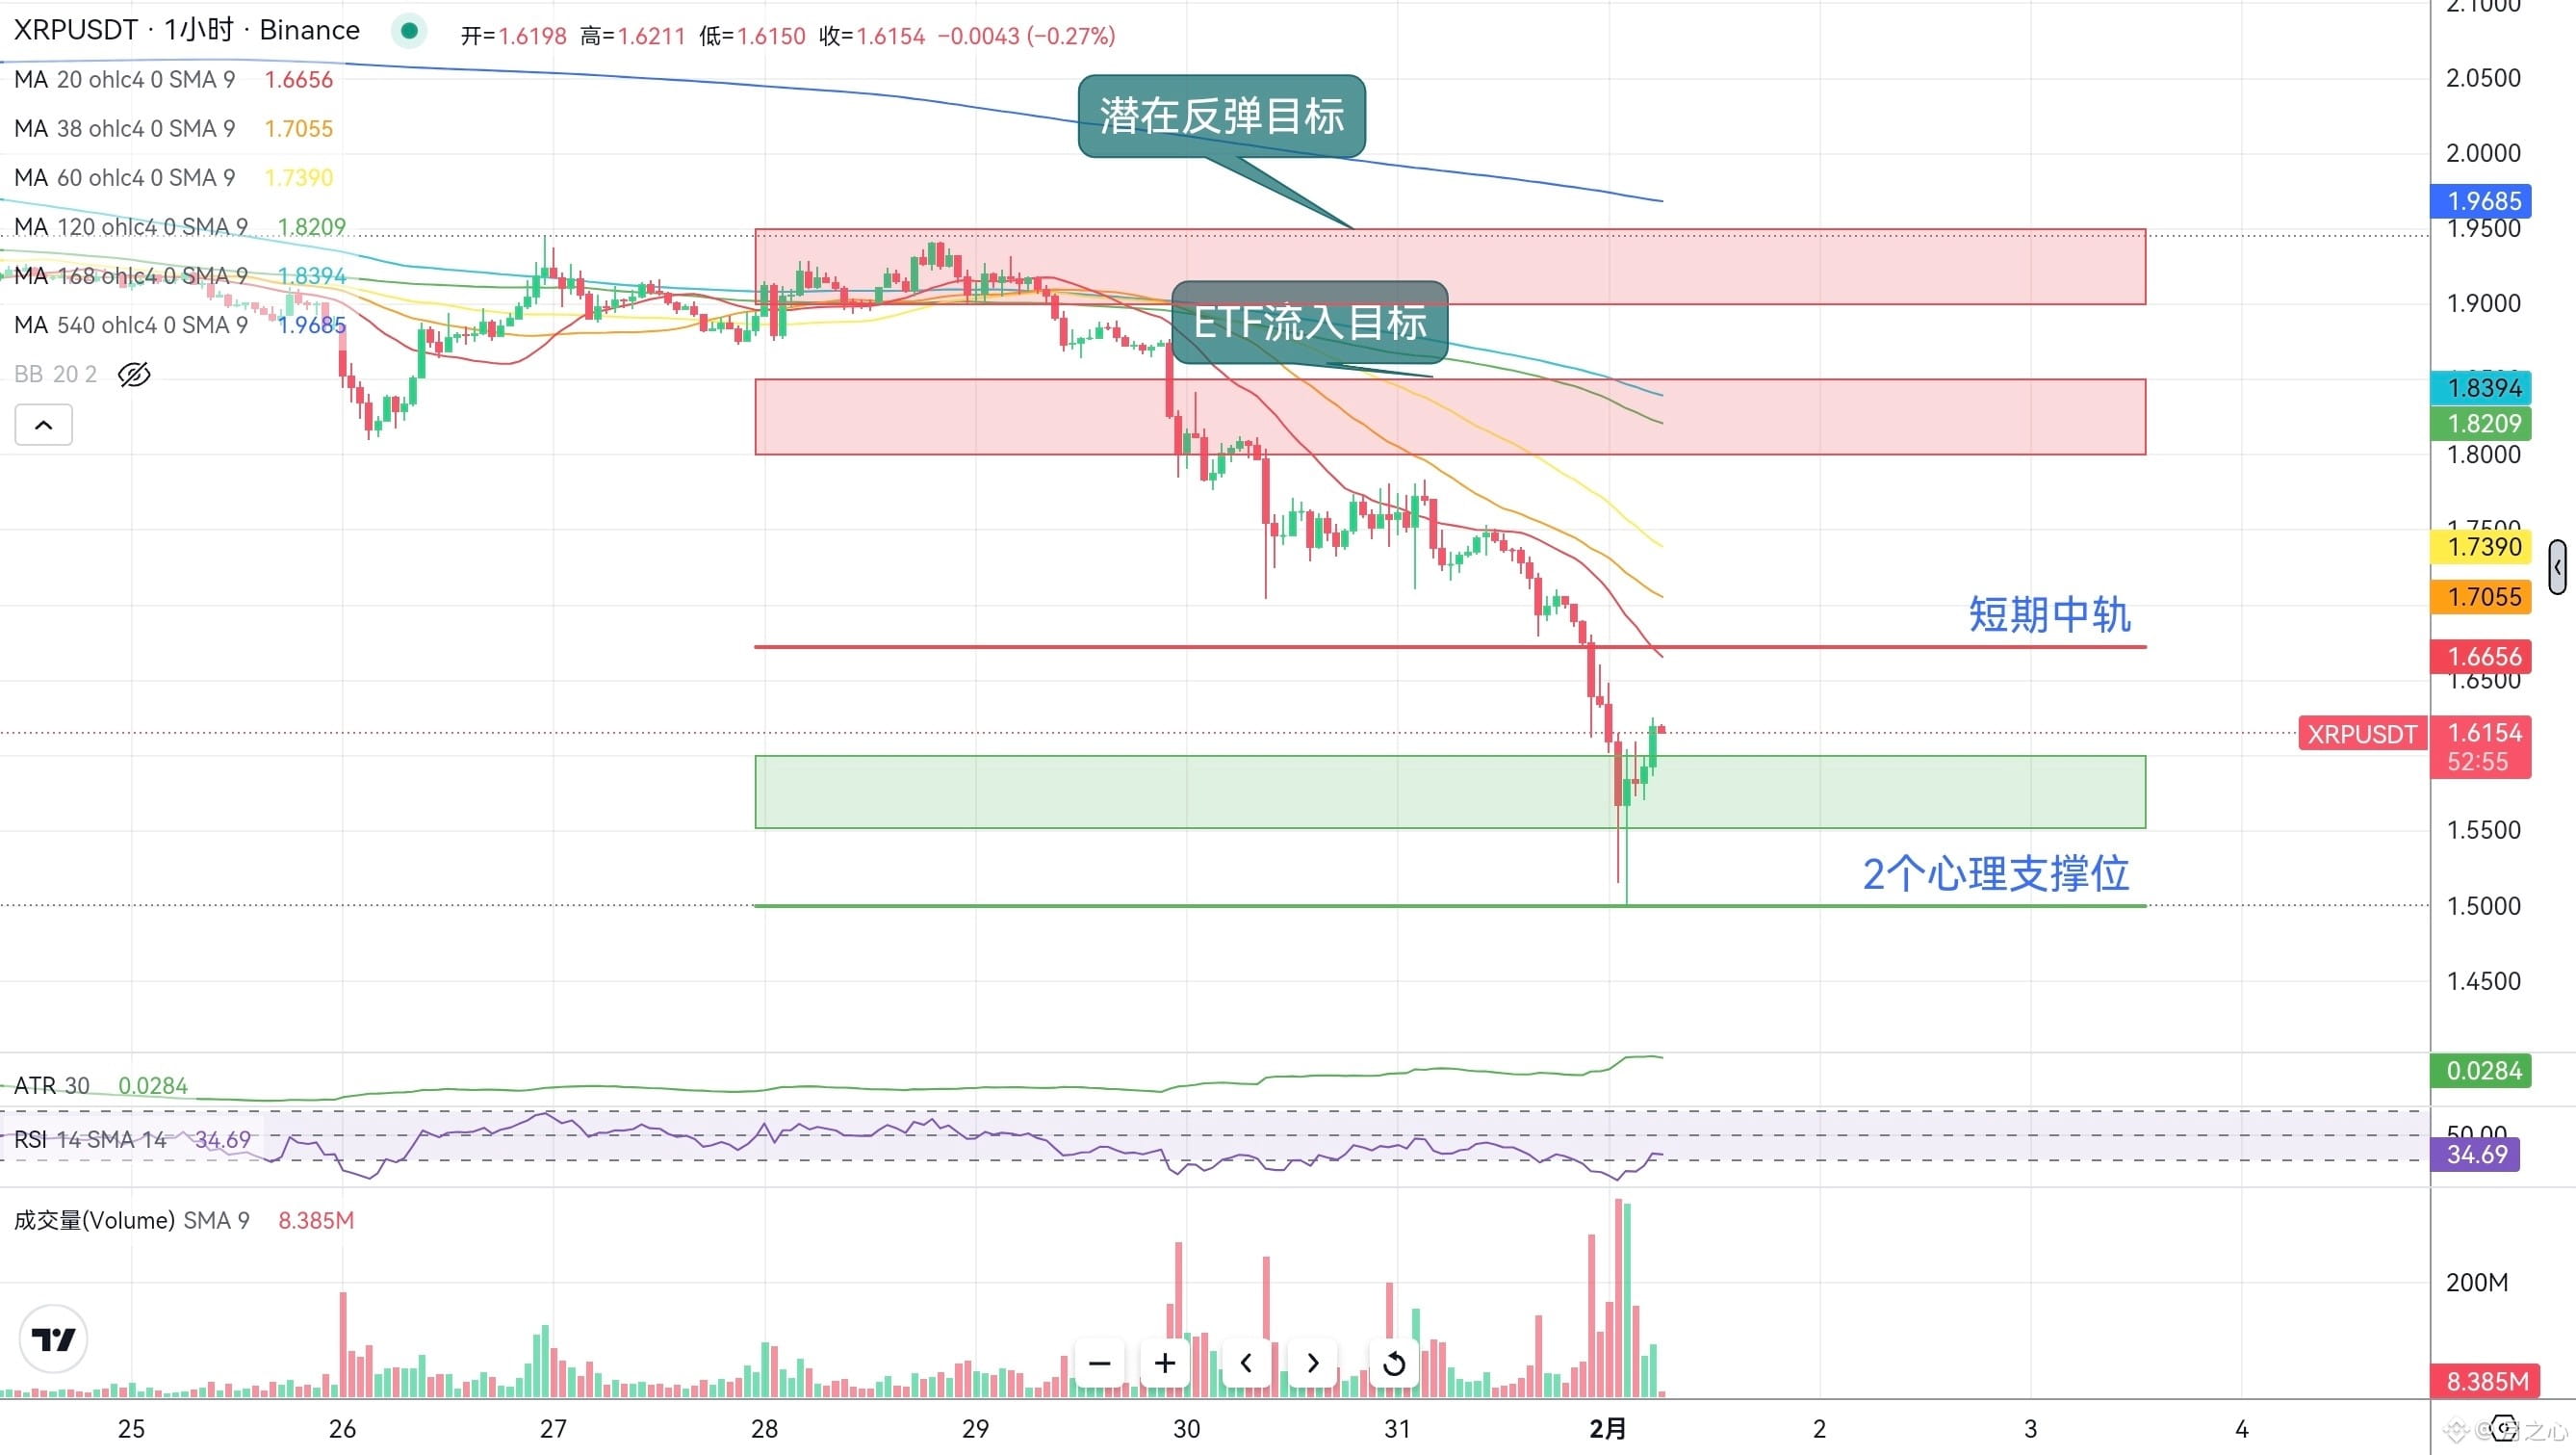
$XRP Pure short's final madness, a group of cowards scared stiff by 99% long liquidation
I directly reveal the cards, this wave is the ultimate washout, 1.55-1.60 is the iron bottom set in stone
RSI 35.23 oversold + TD sequence 9 counting the bottom, if not bottom fishing now, chasing highs won't even get a sip of soup
Technically all signals are bullish: when the price hits the lower Bollinger Band at 1.55 it rebounds immediately, this position is the last line for shorts, breaking below means I lose! The rebound after being oversold has always been fast, accurate, and fierce, 5-10% profit can be easily taken! For varieties with ample liquidity, a drop is money being handed out, only fools will cut losses at the bottom
Bulls go for it directly
Lightly long at market price, set stop loss at 1.55, target 1.67 (MA20) take half profit directly, let the rest see 1.80-1.85
Short positions just seek torture (only for the strong-willed)
If you must short, wait for a rebound at 1.67-1.71 to hit resistance before moving, stop loss at 1.75, target 1.55, don't mindlessly short at the bottom
{future}(XRPUSDT)
$XRP Pure short's final madness, a group of cowards scared stiff by 99% long liquidation
I directly reveal the cards, this wave is the ultimate washout, 1.55-1.60 is the iron bottom set in stone
RSI 35.23 oversold + TD sequence 9 counting the bottom, if not bottom fishing now, chasing highs won't even get a sip of soup
Technically all signals are bullish: when the price hits the lower Bollinger Band at 1.55 it rebounds immediately, this position is the last line for shorts, breaking below means I lose! The rebound after being oversold has always been fast, accurate, and fierce, 5-10% profit can be easily taken! For varieties with ample liquidity, a drop is money being handed out, only fools will cut losses at the bottom
Bulls go for it directly
Lightly long at market price, set stop loss at 1.55, target 1.67 (MA20) take half profit directly, let the rest see 1.80-1.85
Short positions just seek torture (only for the strong-willed)
If you must short, wait for a rebound at 1.67-1.71 to hit resistance before moving, stop loss at 1.75, target 1.55, don't mindlessly short at the bottom
I directly reveal the cards, this wave is the ultimate washout, 1.55-1.60 is the iron bottom set in stone
RSI 35.23 oversold + TD sequence 9 counting the bottom, if not bottom fishing now, chasing highs won't even get a sip of soup
Technically all signals are bullish: when the price hits the lower Bollinger Band at 1.55 it rebounds immediately, this position is the last line for shorts, breaking below means I lose! The rebound after being oversold has always been fast, accurate, and fierce, 5-10% profit can be easily taken! For varieties with ample liquidity, a drop is money being handed out, only fools will cut losses at the bottom
Bulls go for it directly
Lightly long at market price, set stop loss at 1.55, target 1.67 (MA20) take half profit directly, let the rest see 1.80-1.85
Short positions just seek torture (only for the strong-willed)
If you must short, wait for a rebound at 1.67-1.71 to hit resistance before moving, stop loss at 1.75, target 1.55, don't mindlessly short at the bottom
15
7
2.5k
·
--
Bearish
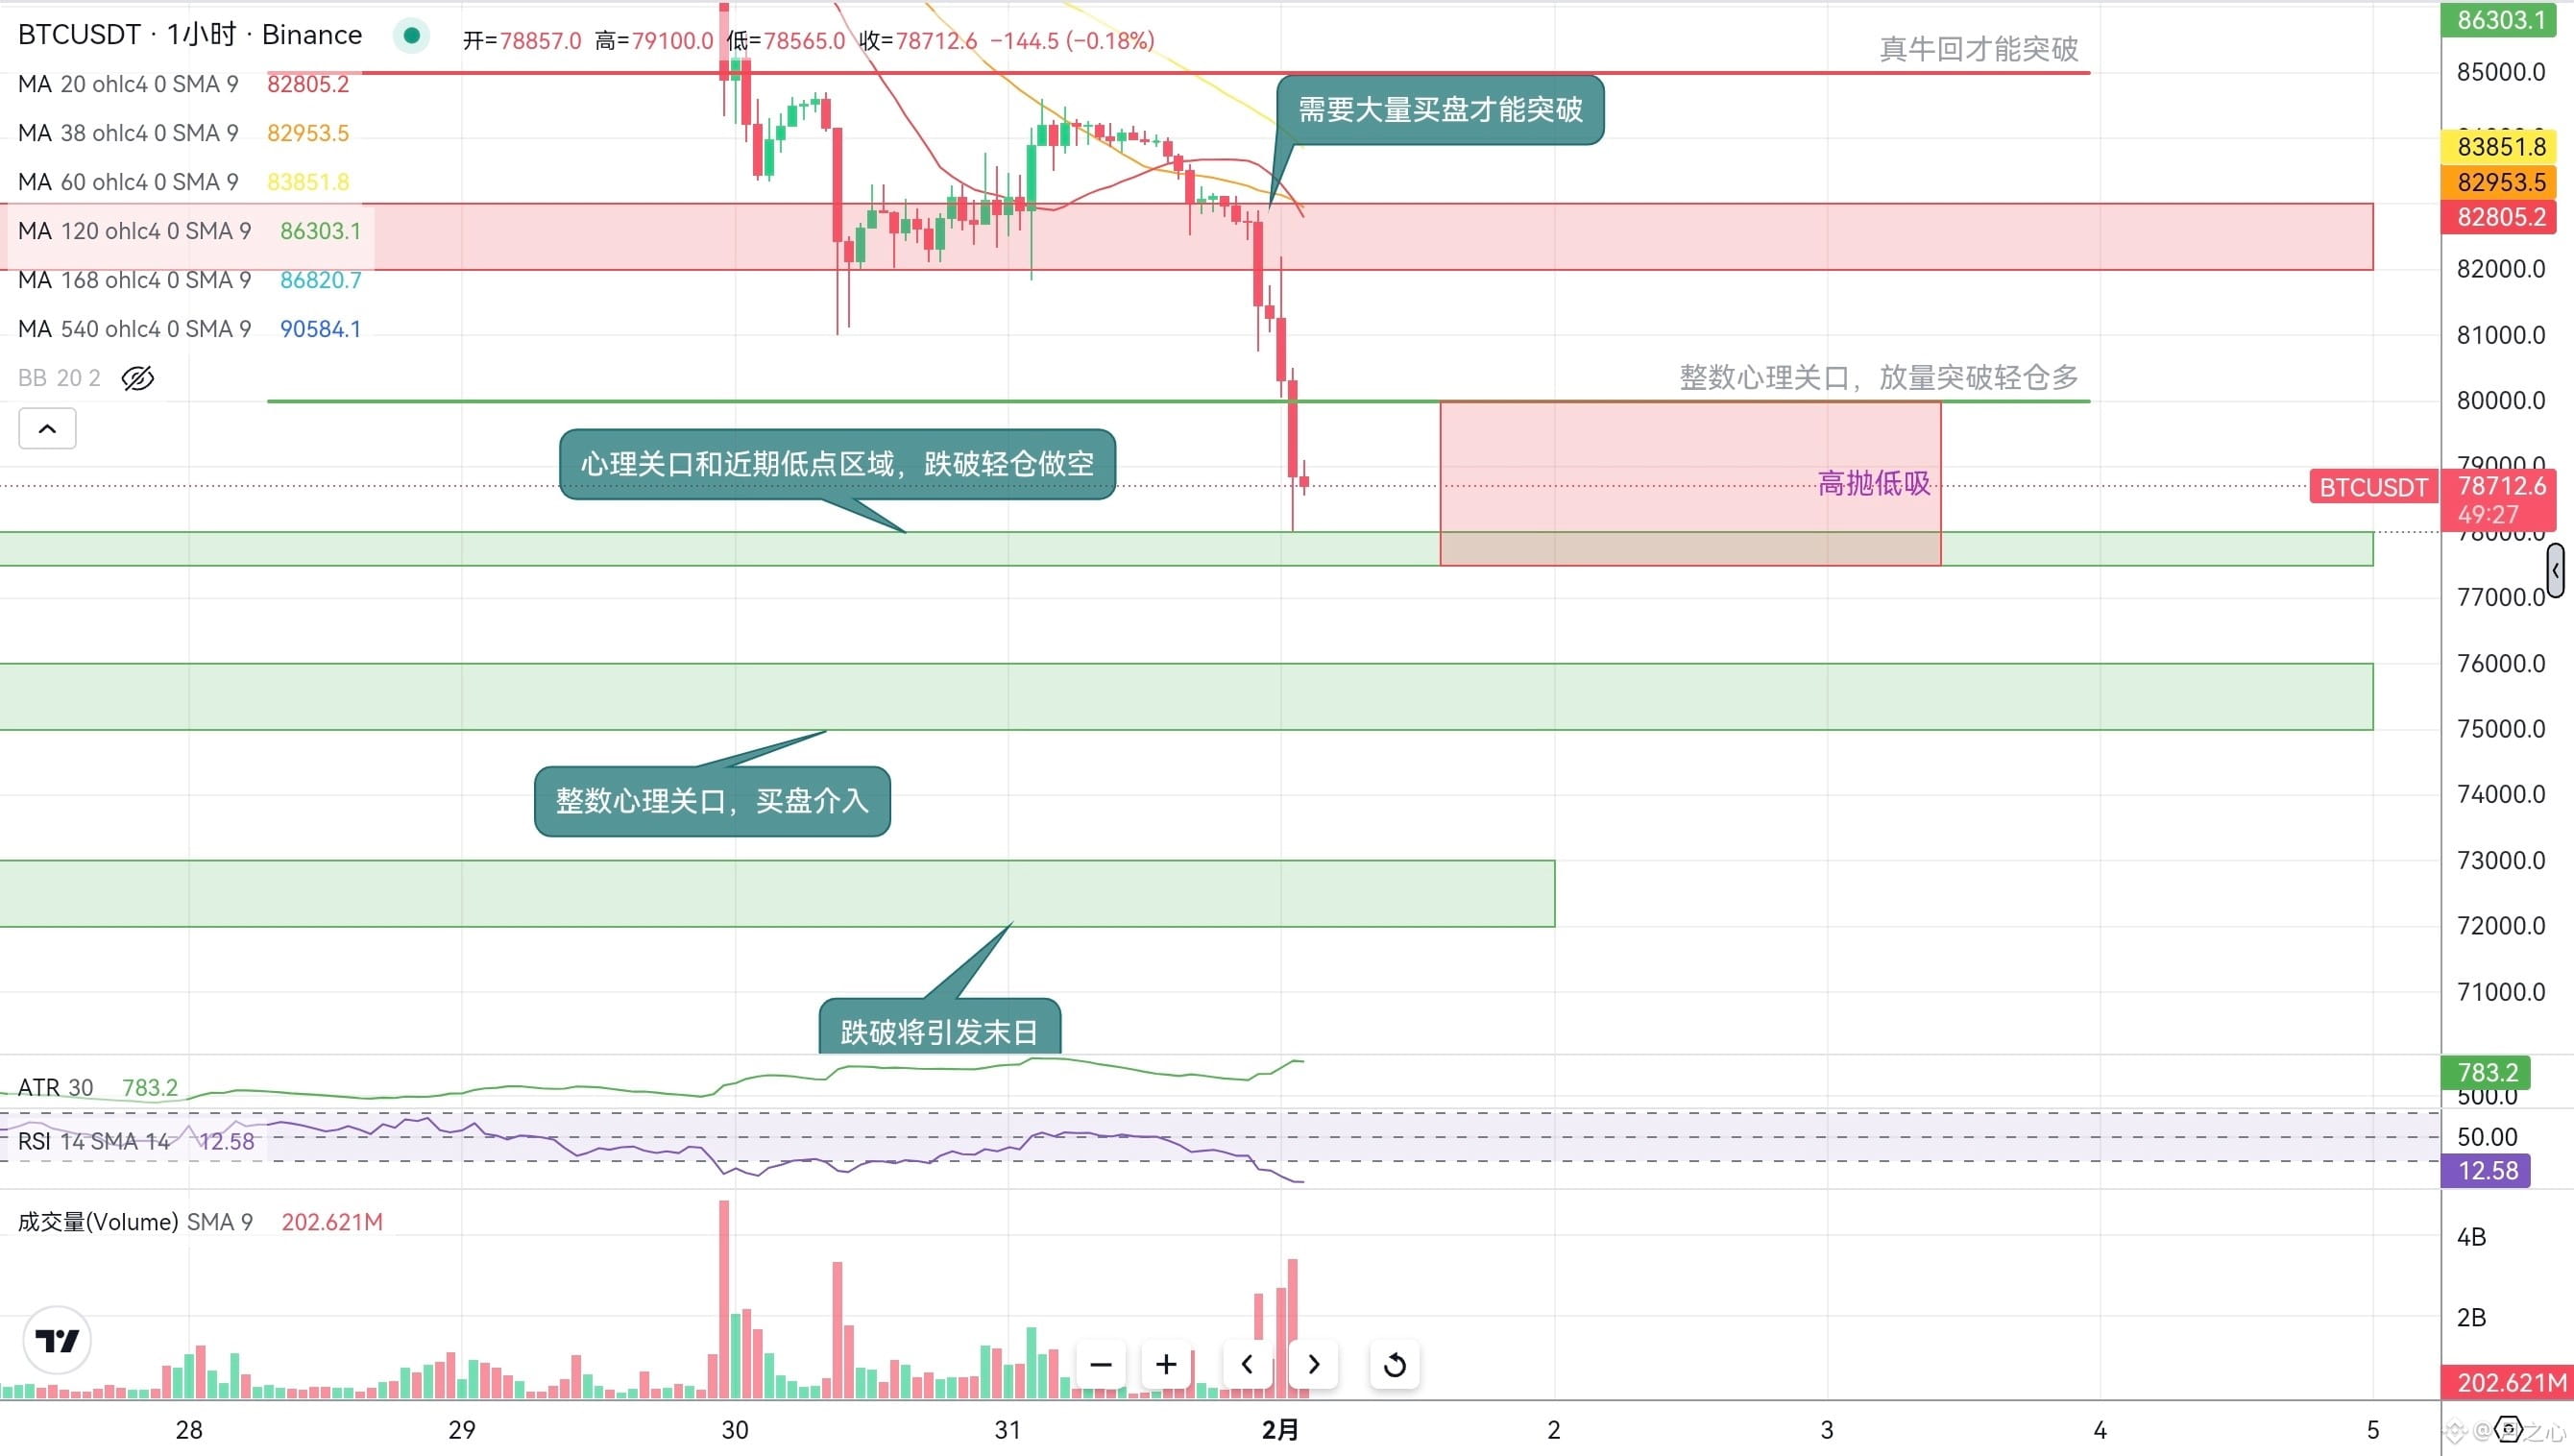
$BTC likes to make money by doing more? It has been said that if it doesn't break above 85, don't go long. Don't listen? You're dead!
Some funds in precious metals have flowed back, do you really think the bull market has returned?
Well, it seems that those who are stubborn have probably all perished.
The only regret is that my 844 short position was closed too early, missing out on half.
The current situation is that the direction is completely unclear; there is no breakout, just guessing.
The real signals only look at two key levels: 77500 support and 80000 resistance.
77500-78000 is the lifeline; if it breaks down, it will directly test the 75000 level. 72000-73000 is the last line of defense; if it breaks, it will be a major correction with no buffer.
80000 is the first resistance; if there is no volume breakout, it will all be a rebound to lure more longs. After the breakout, then look at 82000-83000; don't bother with 85000 for now, it's simply impossible at the moment. 🤣
#BTC走势分析
{future}(BTCUSDT)
$BTC likes to make money by doing more? It has been said that if it doesn't break above 85, don't go long. Don't listen? You're dead!
Some funds in precious metals have flowed back, do you really think the bull market has returned?
Well, it seems that those who are stubborn have probably all perished.
The only regret is that my 844 short position was closed too early, missing out on half.
The current situation is that the direction is completely unclear; there is no breakout, just guessing.
The real signals only look at two key levels: 77500 support and 80000 resistance.
77500-78000 is the lifeline; if it breaks down, it will directly test the 75000 level. 72000-73000 is the last line of defense; if it breaks, it will be a major correction with no buffer.
80000 is the first resistance; if there is no volume breakout, it will all be a rebound to lure more longs. After the breakout, then look at 82000-83000; don't bother with 85000 for now, it's simply impossible at the moment. 🤣
#BTC走势分析
Some funds in precious metals have flowed back, do you really think the bull market has returned?
Well, it seems that those who are stubborn have probably all perished.
The only regret is that my 844 short position was closed too early, missing out on half.
The current situation is that the direction is completely unclear; there is no breakout, just guessing.
The real signals only look at two key levels: 77500 support and 80000 resistance.
77500-78000 is the lifeline; if it breaks down, it will directly test the 75000 level. 72000-73000 is the last line of defense; if it breaks, it will be a major correction with no buffer.
80000 is the first resistance; if there is no volume breakout, it will all be a rebound to lure more longs. After the breakout, then look at 82000-83000; don't bother with 85000 for now, it's simply impossible at the moment. 🤣
#BTC走势分析
2
4
1.5k
·
--
Bearish
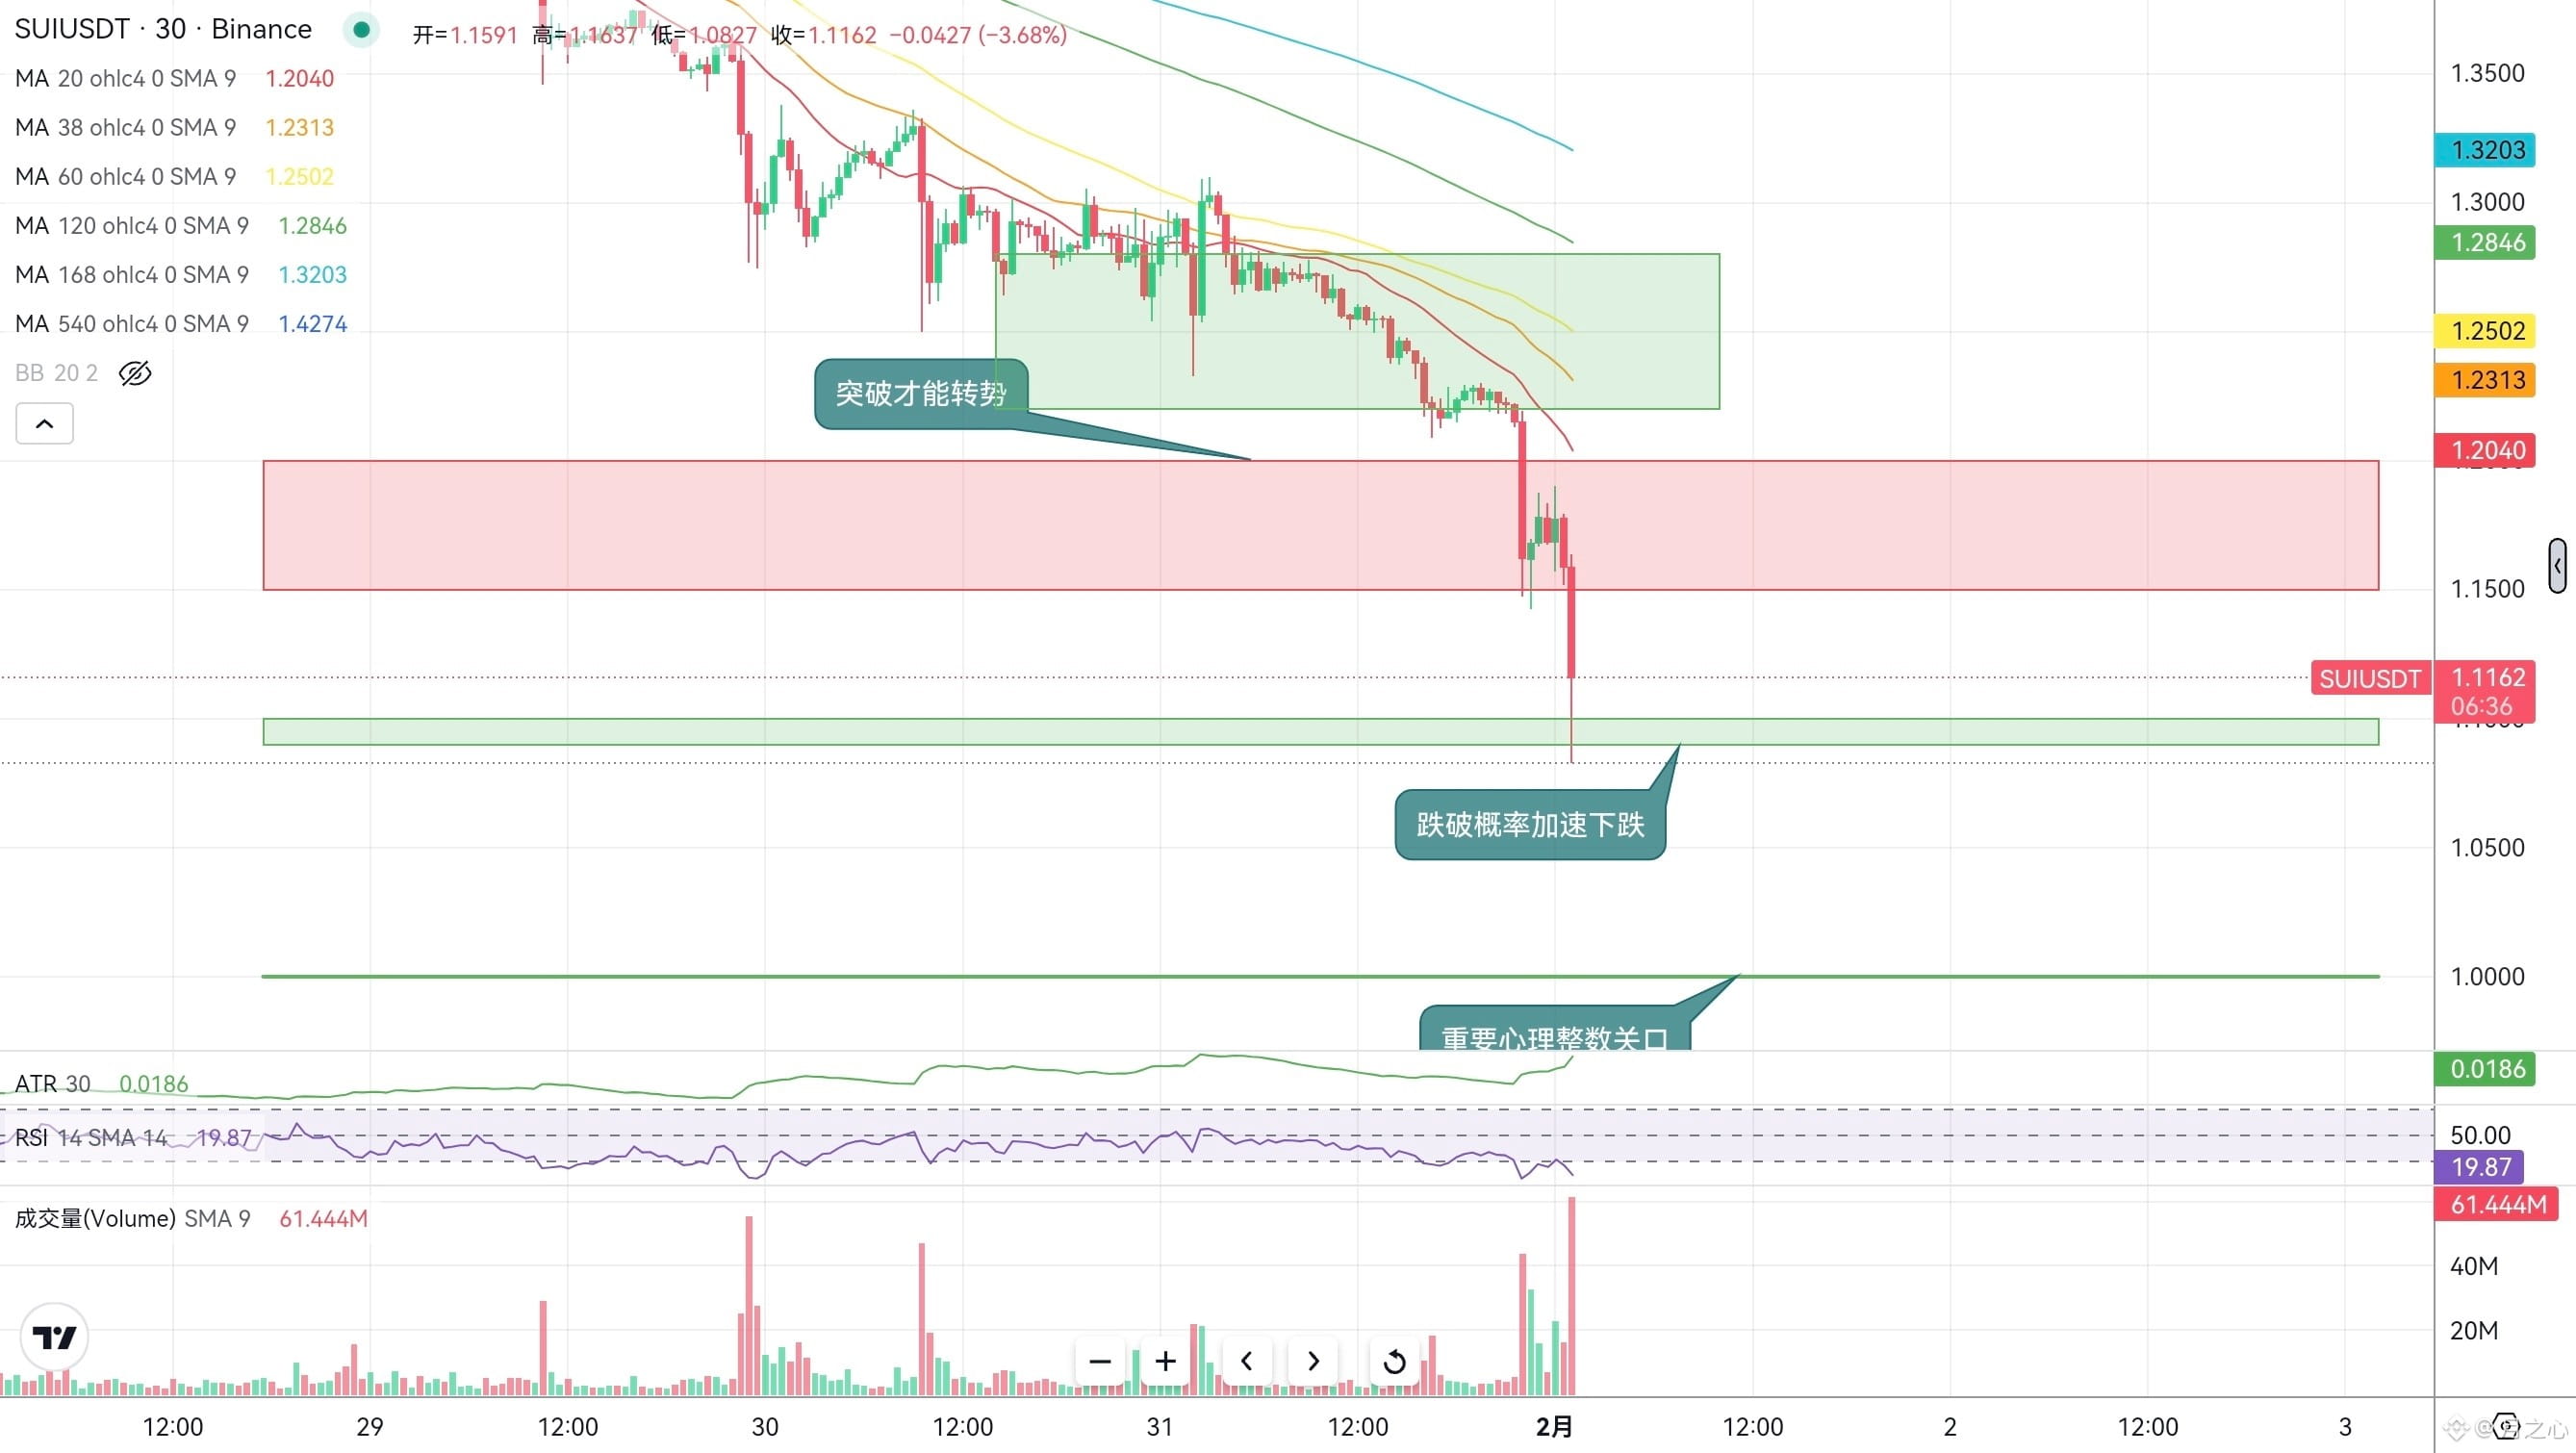
$SUI Air Force Feifei should eat, now it breaks through 1.10, large volume drop rebound directly short!
The current selling pressure has no bottom line, this wave of decline has not yet reached the end.
Looking at the tool data, it is still stuck at 1.15 while the actual price has already been smashed to 1.10, which shows how fierce the bears are. The psychological barrier of 1.10 has been broken, and next it will undoubtedly rush to the integer level of 1.00, do not hold any illusions.
1.15-1.20 is the strong pressure zone turned from previous support, any rebound is just a trap for bulls. Touching this area is an opportunity for shorting money, just short without thinking. Now those who are bottom-fishing are all catching flying knives, the bulls are lying flat, do not seek death.
The operation is to short lightly around 1.15 on the rebound, stop loss at 1.25, target first look at 1.00, if it breaks directly hold it dead, profit from the downward trend.
{future}(SUIUSDT)
$SUI Air Force Feifei should eat, now it breaks through 1.10, large volume drop rebound directly short!
The current selling pressure has no bottom line, this wave of decline has not yet reached the end.
Looking at the tool data, it is still stuck at 1.15 while the actual price has already been smashed to 1.10, which shows how fierce the bears are. The psychological barrier of 1.10 has been broken, and next it will undoubtedly rush to the integer level of 1.00, do not hold any illusions.
1.15-1.20 is the strong pressure zone turned from previous support, any rebound is just a trap for bulls. Touching this area is an opportunity for shorting money, just short without thinking. Now those who are bottom-fishing are all catching flying knives, the bulls are lying flat, do not seek death.
The operation is to short lightly around 1.15 on the rebound, stop loss at 1.25, target first look at 1.00, if it breaks directly hold it dead, profit from the downward trend.
The current selling pressure has no bottom line, this wave of decline has not yet reached the end.
Looking at the tool data, it is still stuck at 1.15 while the actual price has already been smashed to 1.10, which shows how fierce the bears are. The psychological barrier of 1.10 has been broken, and next it will undoubtedly rush to the integer level of 1.00, do not hold any illusions.
1.15-1.20 is the strong pressure zone turned from previous support, any rebound is just a trap for bulls. Touching this area is an opportunity for shorting money, just short without thinking. Now those who are bottom-fishing are all catching flying knives, the bulls are lying flat, do not seek death.
The operation is to short lightly around 1.15 on the rebound, stop loss at 1.25, target first look at 1.00, if it breaks directly hold it dead, profit from the downward trend.
2
1
3
1.2k
·
--
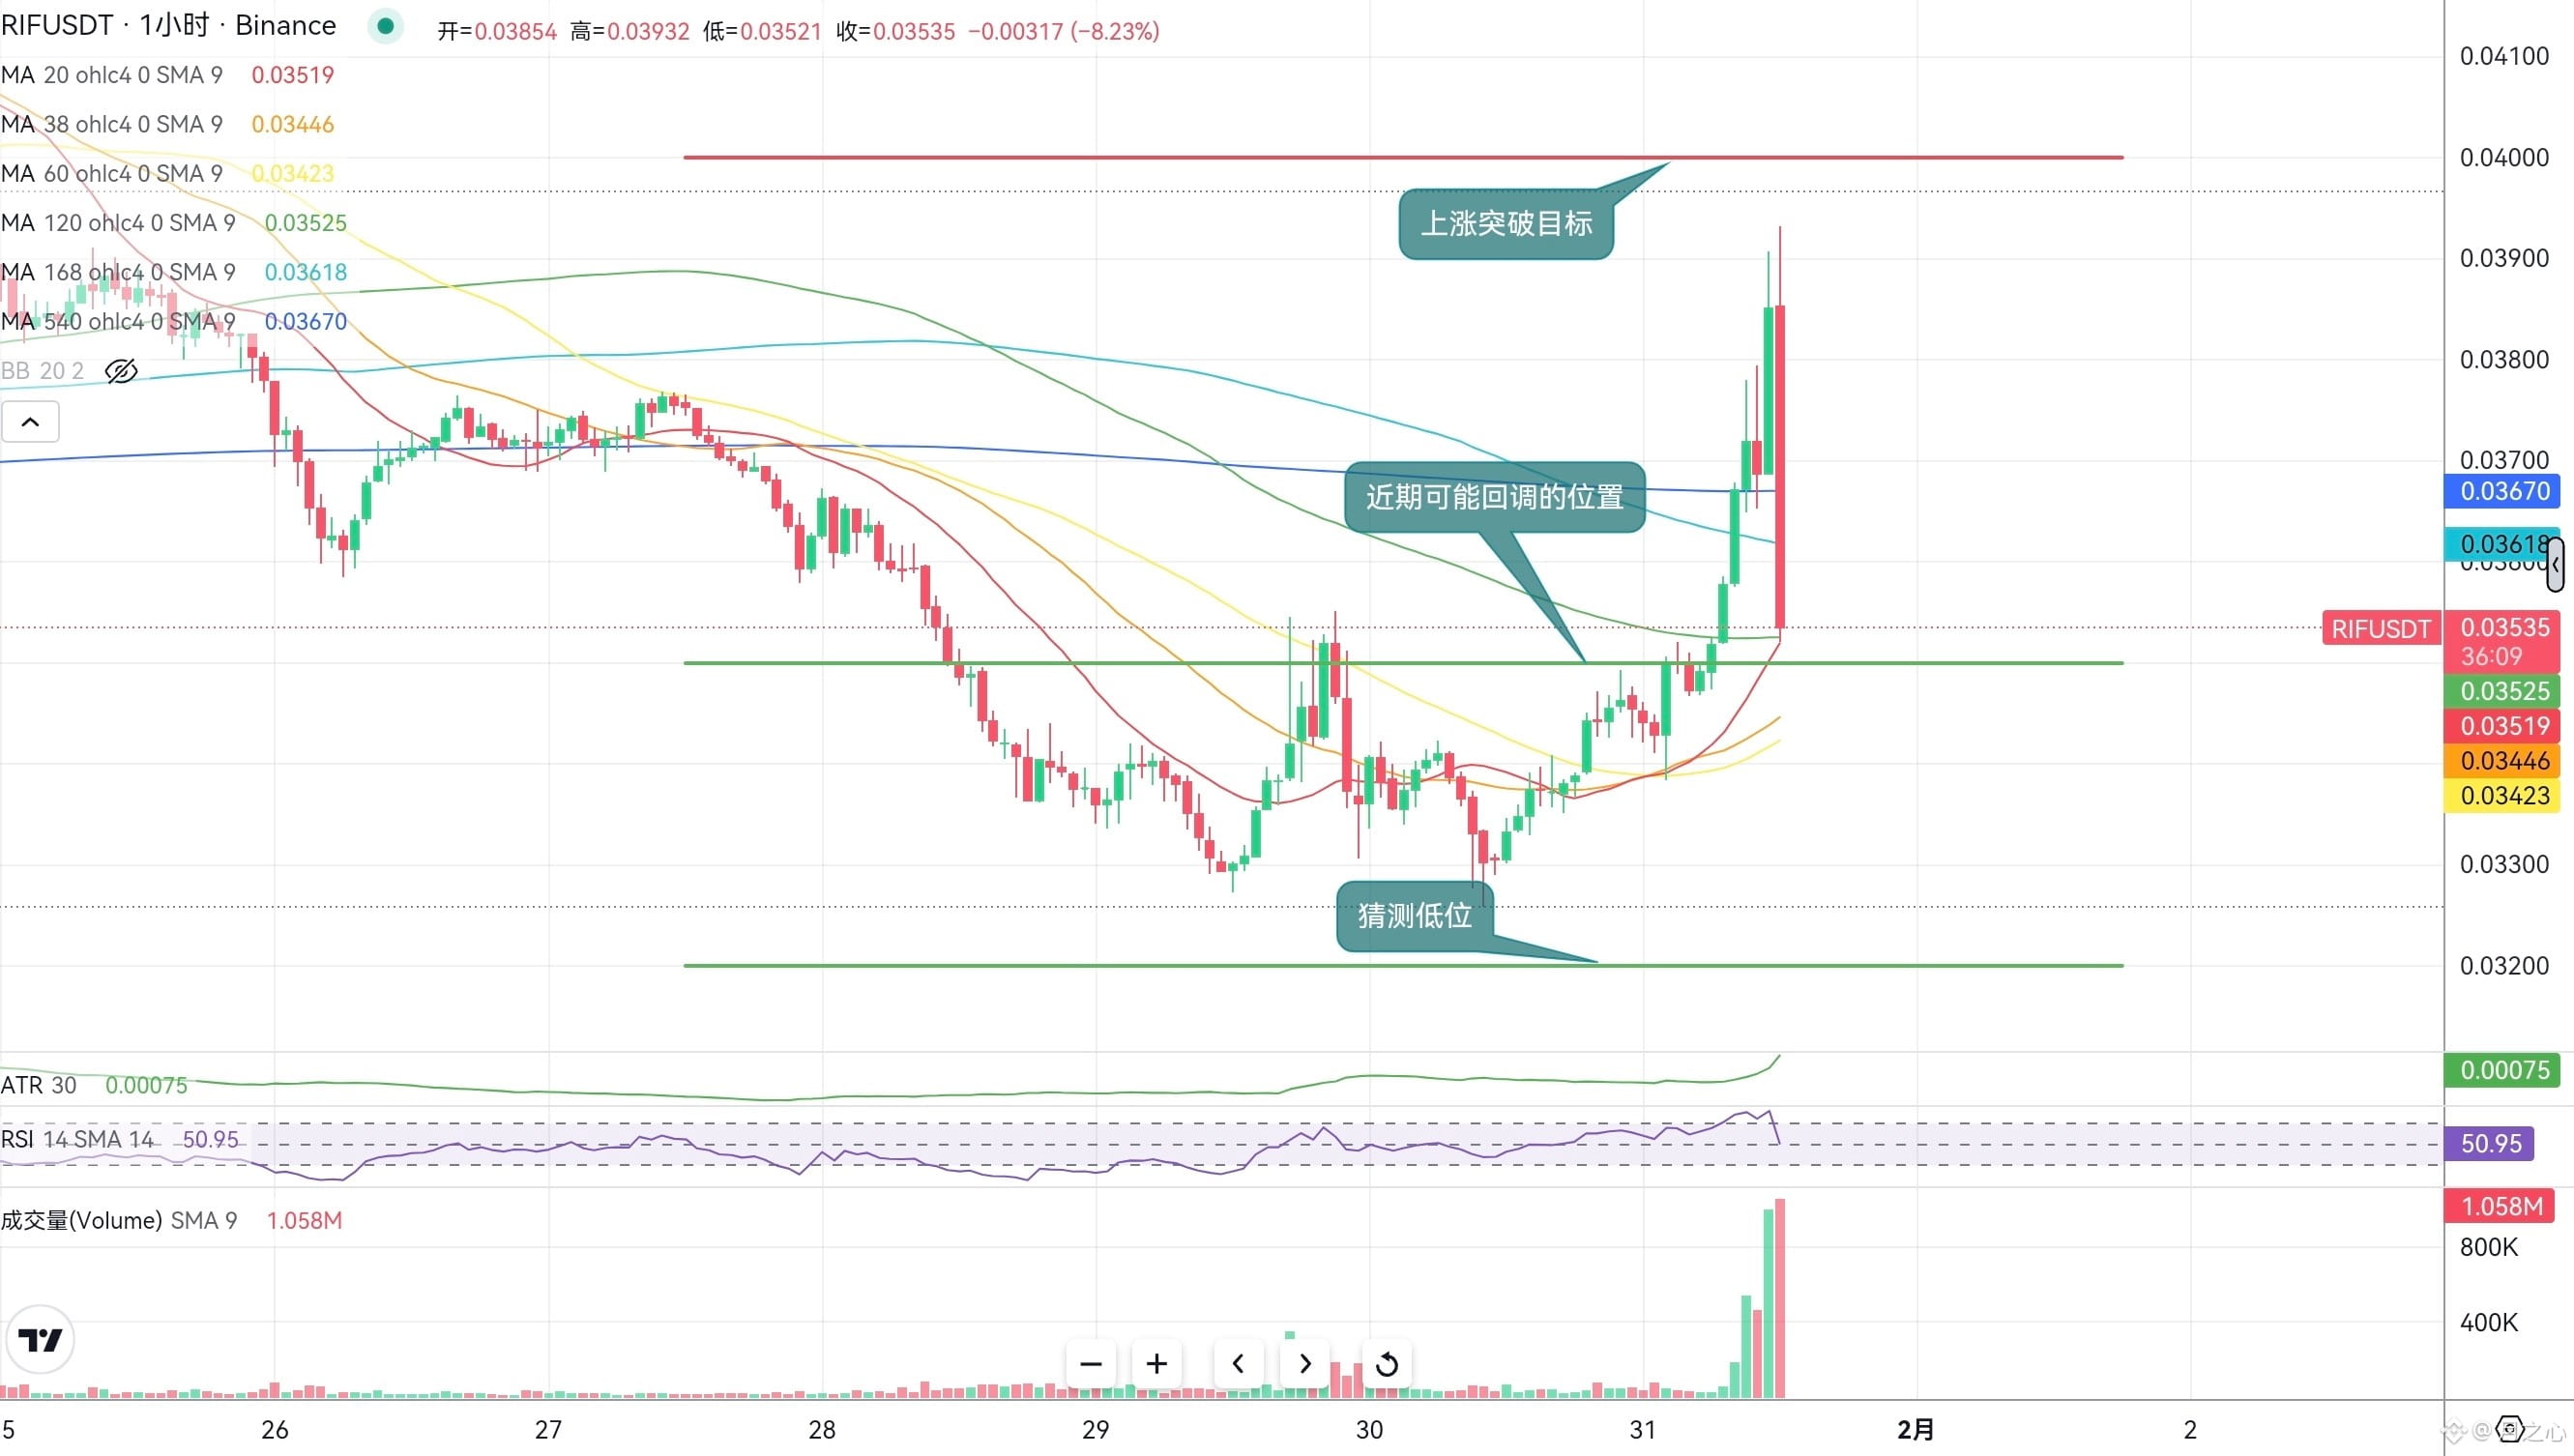
$RIF 0.035-0.036 Buy low, 0.04 is the key resistance level
Short-term bullish trend is strong, but don't blindly chase after it; this surge has seen clear inflows of funds, and for small-cap coins, the elasticity is sufficient. The current bias is bullish, but today it is a bit overbought, and chasing high directly may lead to a pullback.
The current view is to wait for a pullback to 0.035-0.036, this key psychological support level is still an integer point. If there is a pullback, it may stabilize here.
The resistance levels are clear. The first target is directly at 0.04 psychological level, which is a strong resistance for short-term rebounds. If it can break through with volume, then continue to look at 0.042; if it can't break through, it will be a short-term profit-taking point, and for stop-loss, look at 0.034. If it breaks below, exit directly, with a stop-loss of 4-5%.
For shorting, wait for a rebound to 0.04, observe if the volume decreases and bearish signals appear before taking action. Stop-loss at 0.041, target pullback to 0.035. A small position to bet on the pullback is sufficient.
$RIF 0.035-0.036 Buy low, 0.04 is the key resistance level
Short-term bullish trend is strong, but don't blindly chase after it; this surge has seen clear inflows of funds, and for small-cap coins, the elasticity is sufficient. The current bias is bullish, but today it is a bit overbought, and chasing high directly may lead to a pullback.
The current view is to wait for a pullback to 0.035-0.036, this key psychological support level is still an integer point. If there is a pullback, it may stabilize here.
The resistance levels are clear. The first target is directly at 0.04 psychological level, which is a strong resistance for short-term rebounds. If it can break through with volume, then continue to look at 0.042; if it can't break through, it will be a short-term profit-taking point, and for stop-loss, look at 0.034. If it breaks below, exit directly, with a stop-loss of 4-5%.
For shorting, wait for a rebound to 0.04, observe if the volume decreases and bearish signals appear before taking action. Stop-loss at 0.041, target pullback to 0.035. A small position to bet on the pullback is sufficient.
Short-term bullish trend is strong, but don't blindly chase after it; this surge has seen clear inflows of funds, and for small-cap coins, the elasticity is sufficient. The current bias is bullish, but today it is a bit overbought, and chasing high directly may lead to a pullback.
The current view is to wait for a pullback to 0.035-0.036, this key psychological support level is still an integer point. If there is a pullback, it may stabilize here.
The resistance levels are clear. The first target is directly at 0.04 psychological level, which is a strong resistance for short-term rebounds. If it can break through with volume, then continue to look at 0.042; if it can't break through, it will be a short-term profit-taking point, and for stop-loss, look at 0.034. If it breaks below, exit directly, with a stop-loss of 4-5%.
For shorting, wait for a rebound to 0.04, observe if the volume decreases and bearish signals appear before taking action. Stop-loss at 0.041, target pullback to 0.035. A small position to bet on the pullback is sufficient.
2
166
·
--
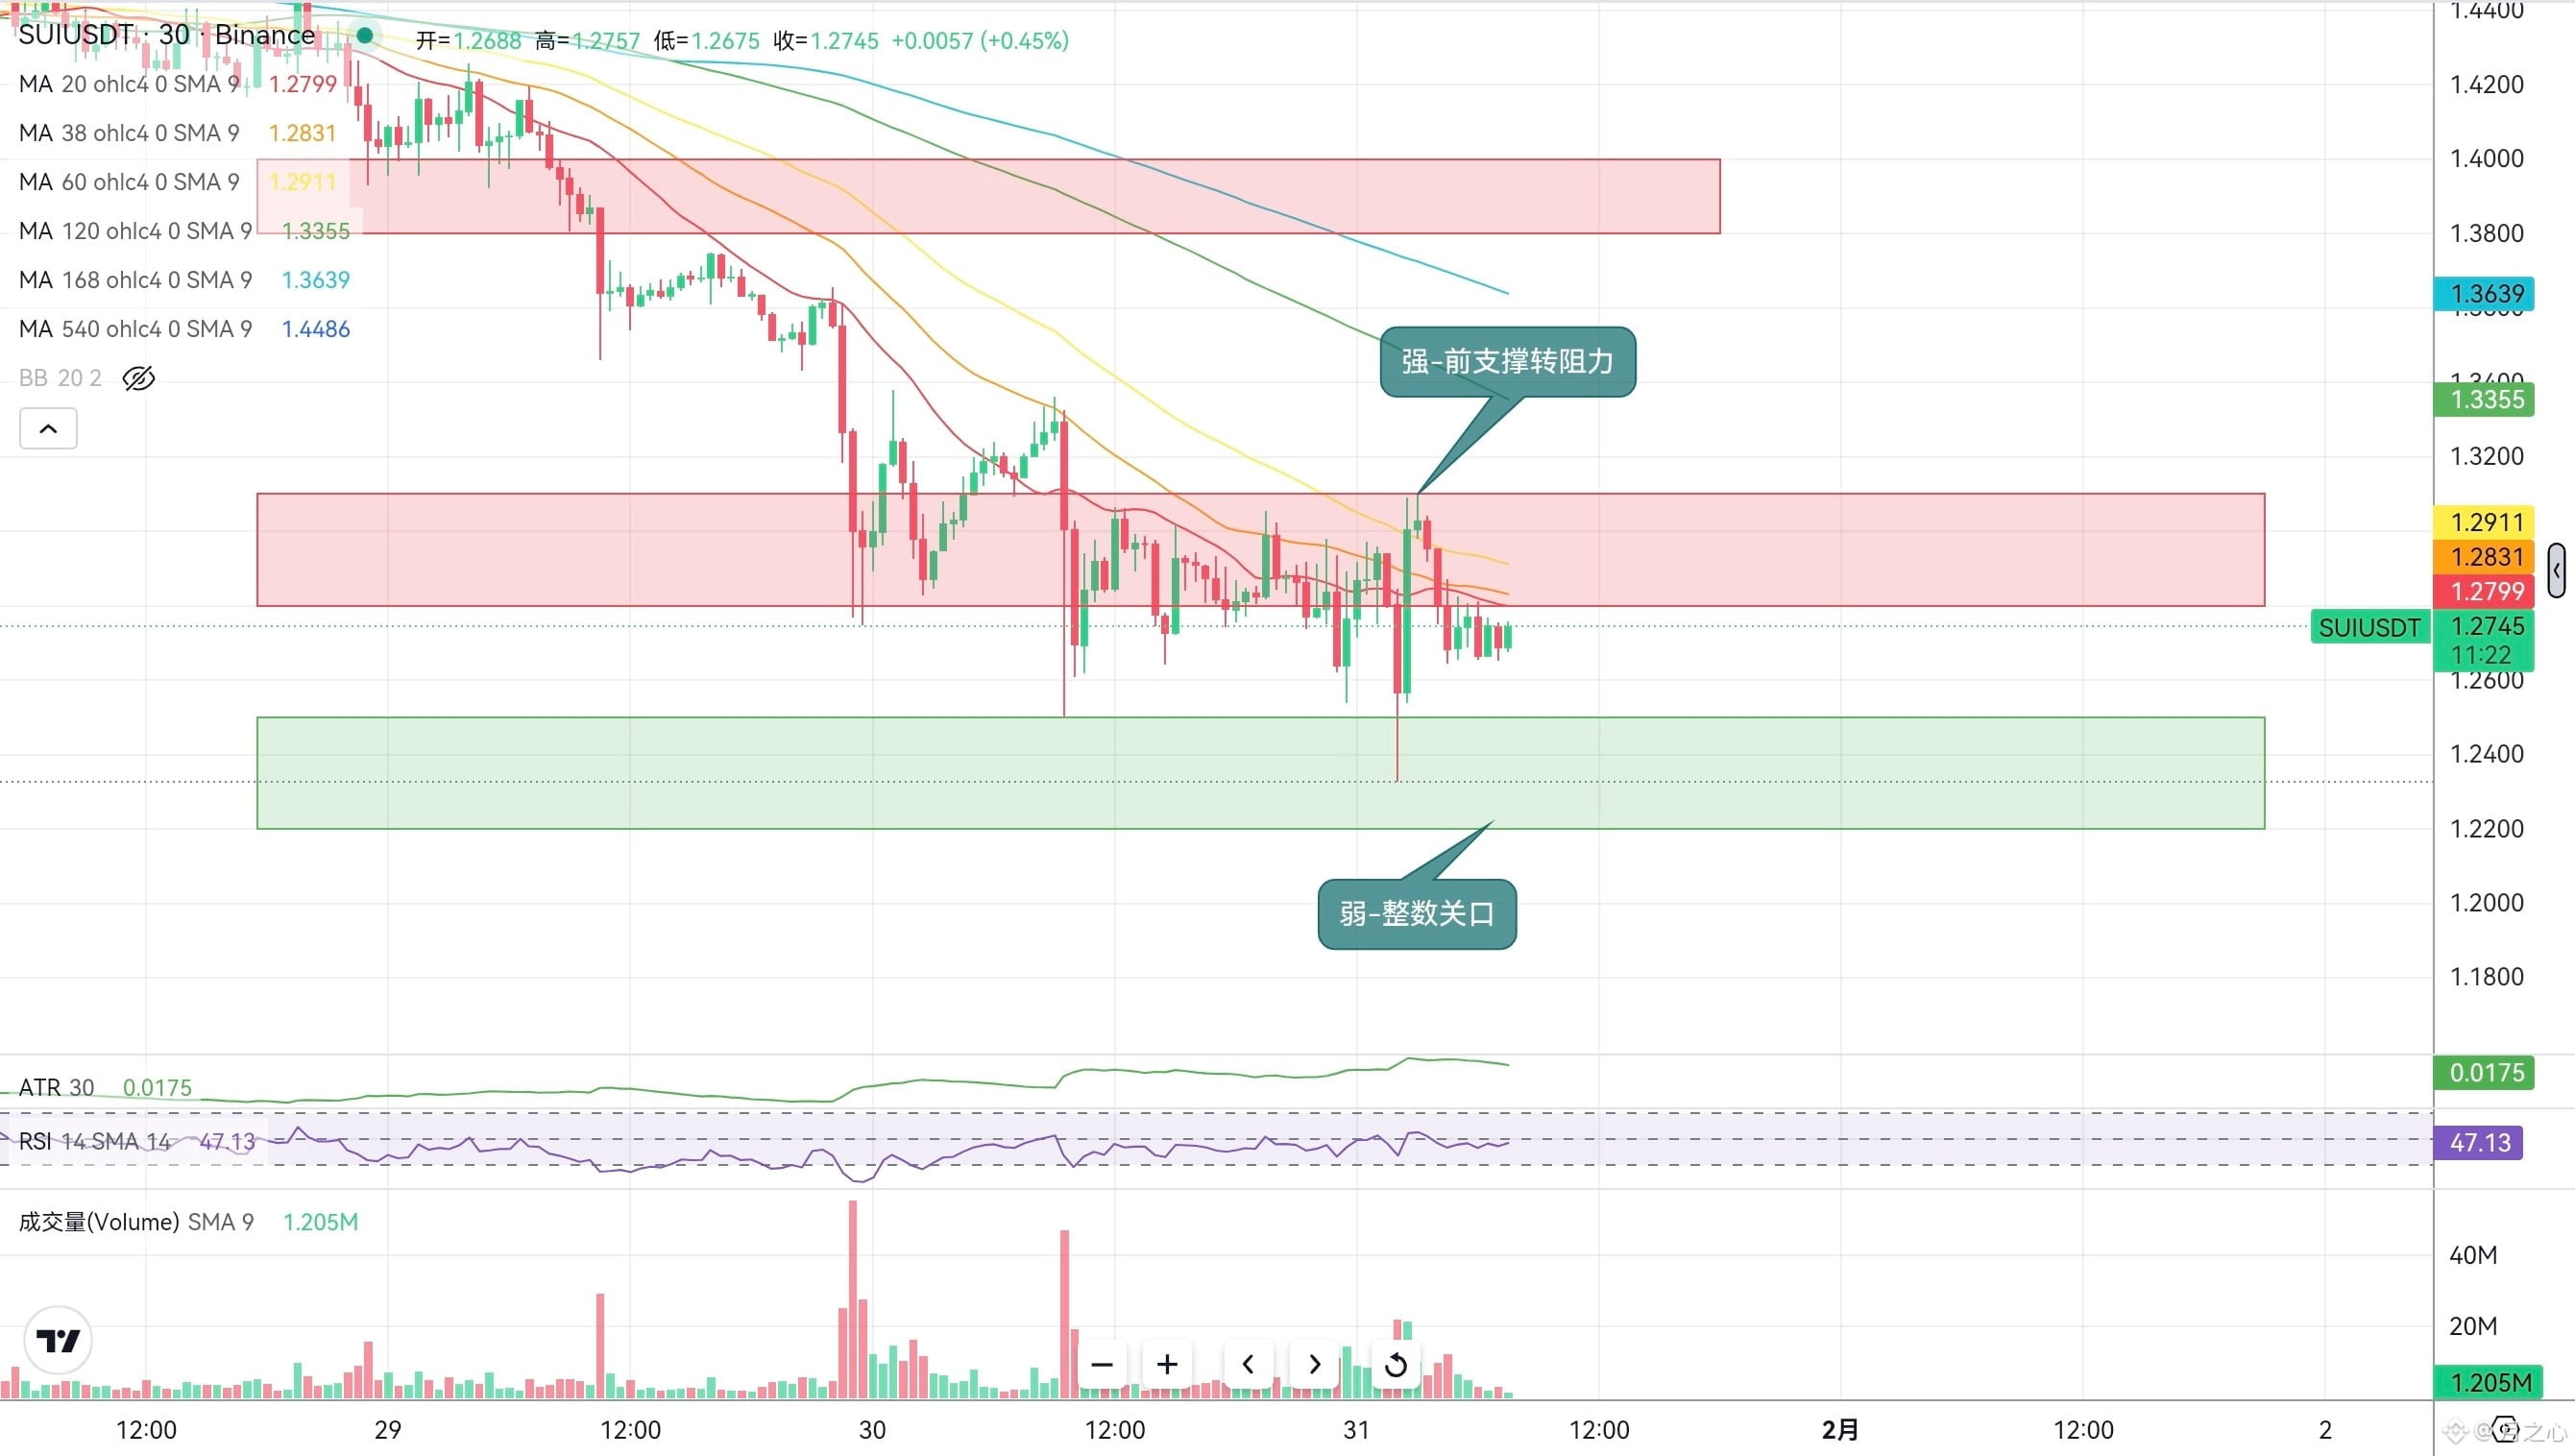
$SUI The breakout has collapsed, the 1.28 support has been breached, and the bearish outlook is fully loaded; any rebound is a selling opportunity!
Sui has completely weakened, and the technical indicators have deteriorated across the board! The key support zone of 1.28-1.31 that was mentioned before has been directly broken, with the current price at 1.276. This breakdown is not a false dip; it is a genuine acceleration of the downward trend, leaving no room for bulls!
After 13 consecutive trading days of decline, there has only been a weak rebound. All moving averages have formed a bearish arrangement, with the 20-day, 60-day, and 120-day lines all acting as resistance. This previous support has directly turned into a resistance level, and any rebound that touches this area will be under pressure to fall back.
The new support level is initially seen at 1.22-1.25; this is just a weak psychological support level. Whether it can hold depends entirely on market sentiment. Don't think about bottom fishing; otherwise, you might end up buying at the mid-point and should abandon any bullish thinking!
Aggressive market price at 1.276 with a light short position, stop-loss at 1.32, target initially at 1.22.
A conservative approach would be to wait for a rebound to the 1.30-1.31 resistance zone before going short, with a risk-reward ratio of 1:3, which is the best short entry point.
Follow the trend and short; if the trend is downward, do not go against the market.
{future}(SUIUSDT)
$SUI The breakout has collapsed, the 1.28 support has been breached, and the bearish outlook is fully loaded; any rebound is a selling opportunity!
Sui has completely weakened, and the technical indicators have deteriorated across the board! The key support zone of 1.28-1.31 that was mentioned before has been directly broken, with the current price at 1.276. This breakdown is not a false dip; it is a genuine acceleration of the downward trend, leaving no room for bulls!
After 13 consecutive trading days of decline, there has only been a weak rebound. All moving averages have formed a bearish arrangement, with the 20-day, 60-day, and 120-day lines all acting as resistance. This previous support has directly turned into a resistance level, and any rebound that touches this area will be under pressure to fall back.
The new support level is initially seen at 1.22-1.25; this is just a weak psychological support level. Whether it can hold depends entirely on market sentiment. Don't think about bottom fishing; otherwise, you might end up buying at the mid-point and should abandon any bullish thinking!
Aggressive market price at 1.276 with a light short position, stop-loss at 1.32, target initially at 1.22.
A conservative approach would be to wait for a rebound to the 1.30-1.31 resistance zone before going short, with a risk-reward ratio of 1:3, which is the best short entry point.
Follow the trend and short; if the trend is downward, do not go against the market.
Sui has completely weakened, and the technical indicators have deteriorated across the board! The key support zone of 1.28-1.31 that was mentioned before has been directly broken, with the current price at 1.276. This breakdown is not a false dip; it is a genuine acceleration of the downward trend, leaving no room for bulls!
After 13 consecutive trading days of decline, there has only been a weak rebound. All moving averages have formed a bearish arrangement, with the 20-day, 60-day, and 120-day lines all acting as resistance. This previous support has directly turned into a resistance level, and any rebound that touches this area will be under pressure to fall back.
The new support level is initially seen at 1.22-1.25; this is just a weak psychological support level. Whether it can hold depends entirely on market sentiment. Don't think about bottom fishing; otherwise, you might end up buying at the mid-point and should abandon any bullish thinking!
Aggressive market price at 1.276 with a light short position, stop-loss at 1.32, target initially at 1.22.
A conservative approach would be to wait for a rebound to the 1.30-1.31 resistance zone before going short, with a risk-reward ratio of 1:3, which is the best short entry point.
Follow the trend and short; if the trend is downward, do not go against the market.
5
2
3
1.5k
Log in to explore more content
Join global crypto users on Binance Square
⚡️ Get latest and useful information about crypto.
💬 Trusted by the world’s largest crypto exchange.
👍 Discover real insights from verified creators.
Email / Phone number
Trending Topics
CPIWatch
86.2M views
499,741 Discussing
Share & Win Traffic Reward in our Trending Hashtag Campaign
✨Topic: Will CPI Trigger Rate Hike?
👉How to Join:
Publish a short post or article with hashtag #CPIWatch
Create content based on the below two angles:
- Nonfarm payrolls beat expectations and CPI is around the corner, do you think the Fed will hike or hold the rate?
- Bullish or bearish? Share your take and showcase your stocks or gold trade/holdings with our trade sharing widget.
🚀Campaign Period:
- 2026-09-11 3:00 - 2026-09-12 9:00 UTC
🎁Reward:
- Qualified posts that comply with the above guidelines and contain more than 100 words will be reviewed and may receive a random traffic boost of 500 to 3,000 views. You will receive a notification from your feed secretary if your post is selected.
- Get a chance to have your article featured on Binance Square Official
Need ideas for your post? Visit the topic page #CPIWatch or the Square Guide on How to Post for Better Reach.
Binance Square Official
·288 Likes
·502.4k views
CLARITYActRevisionToRuleNonDeFiControllers
0 views
7 Discussing
TencentBackedEnflameToStartTradingAfter$911MIPO
155 views
7 Discussing