

crypto元哥
317 Posts

crypto元哥
Report
Block User
Frequent Trader
1 Years
1 Following
22 Followers
30 Liked
Posts
·
--
See translation
$BTC 85150第一目标兑现,短线继续看多到85470
兄弟们,上次帖子里我原话是「84950是关键位,只要不丢,短线就偏多。上方先看85150」。刚看了一眼盘面,这波节奏咱们又踩准了——截至本轮跟踪,价格最高触及85150上方,第一目标兑现,方向跟咱们之前的判断一致。
现在再看盘面,过去四小时BTC在85094上方窄幅震荡,收盘85244只微跌0.04%,低点85094被人快速接回,没给空头太多机会。更关键的是量能:后两小时成交量比前两小时多了26%,价格没创新低,这是回踩不破后的温和蓄势,不是放量出货的走法。最近几根15分钟K线收盘都稳在85243上方,低点一步步抬到85208,短线结构还是偏强。
所以我的思路不变:短线继续看多,关键支撑上移到85094,只要不破就继续拿住这波节奏。上方先看85470,站稳了再看下一步。反过来,若跌破85094,那我就撤回短线看多,不硬扛。
别追高,回踩关键位企稳才是机会。$BTC
原帖:https://www.binance.com/zh-CN/square/post/373595847810033
$BTC 85150第一目标兑现,短线继续看多到85470
兄弟们,上次帖子里我原话是「84950是关键位,只要不丢,短线就偏多。上方先看85150」。刚看了一眼盘面,这波节奏咱们又踩准了——截至本轮跟踪,价格最高触及85150上方,第一目标兑现,方向跟咱们之前的判断一致。
现在再看盘面,过去四小时BTC在85094上方窄幅震荡,收盘85244只微跌0.04%,低点85094被人快速接回,没给空头太多机会。更关键的是量能:后两小时成交量比前两小时多了26%,价格没创新低,这是回踩不破后的温和蓄势,不是放量出货的走法。最近几根15分钟K线收盘都稳在85243上方,低点一步步抬到85208,短线结构还是偏强。
所以我的思路不变:短线继续看多,关键支撑上移到85094,只要不破就继续拿住这波节奏。上方先看85470,站稳了再看下一步。反过来,若跌破85094,那我就撤回短线看多,不硬扛。
别追高,回踩关键位企稳才是机会。$BTC
原帖:https://www.binance.com/zh-CN/square/post/373595847810033
兄弟们,上次帖子里我原话是「84950是关键位,只要不丢,短线就偏多。上方先看85150」。刚看了一眼盘面,这波节奏咱们又踩准了——截至本轮跟踪,价格最高触及85150上方,第一目标兑现,方向跟咱们之前的判断一致。
现在再看盘面,过去四小时BTC在85094上方窄幅震荡,收盘85244只微跌0.04%,低点85094被人快速接回,没给空头太多机会。更关键的是量能:后两小时成交量比前两小时多了26%,价格没创新低,这是回踩不破后的温和蓄势,不是放量出货的走法。最近几根15分钟K线收盘都稳在85243上方,低点一步步抬到85208,短线结构还是偏强。
所以我的思路不变:短线继续看多,关键支撑上移到85094,只要不破就继续拿住这波节奏。上方先看85470,站稳了再看下一步。反过来,若跌破85094,那我就撤回短线看多,不硬扛。
别追高,回踩关键位企稳才是机会。$BTC
原帖:https://www.binance.com/zh-CN/square/post/373595847810033
9
·
--
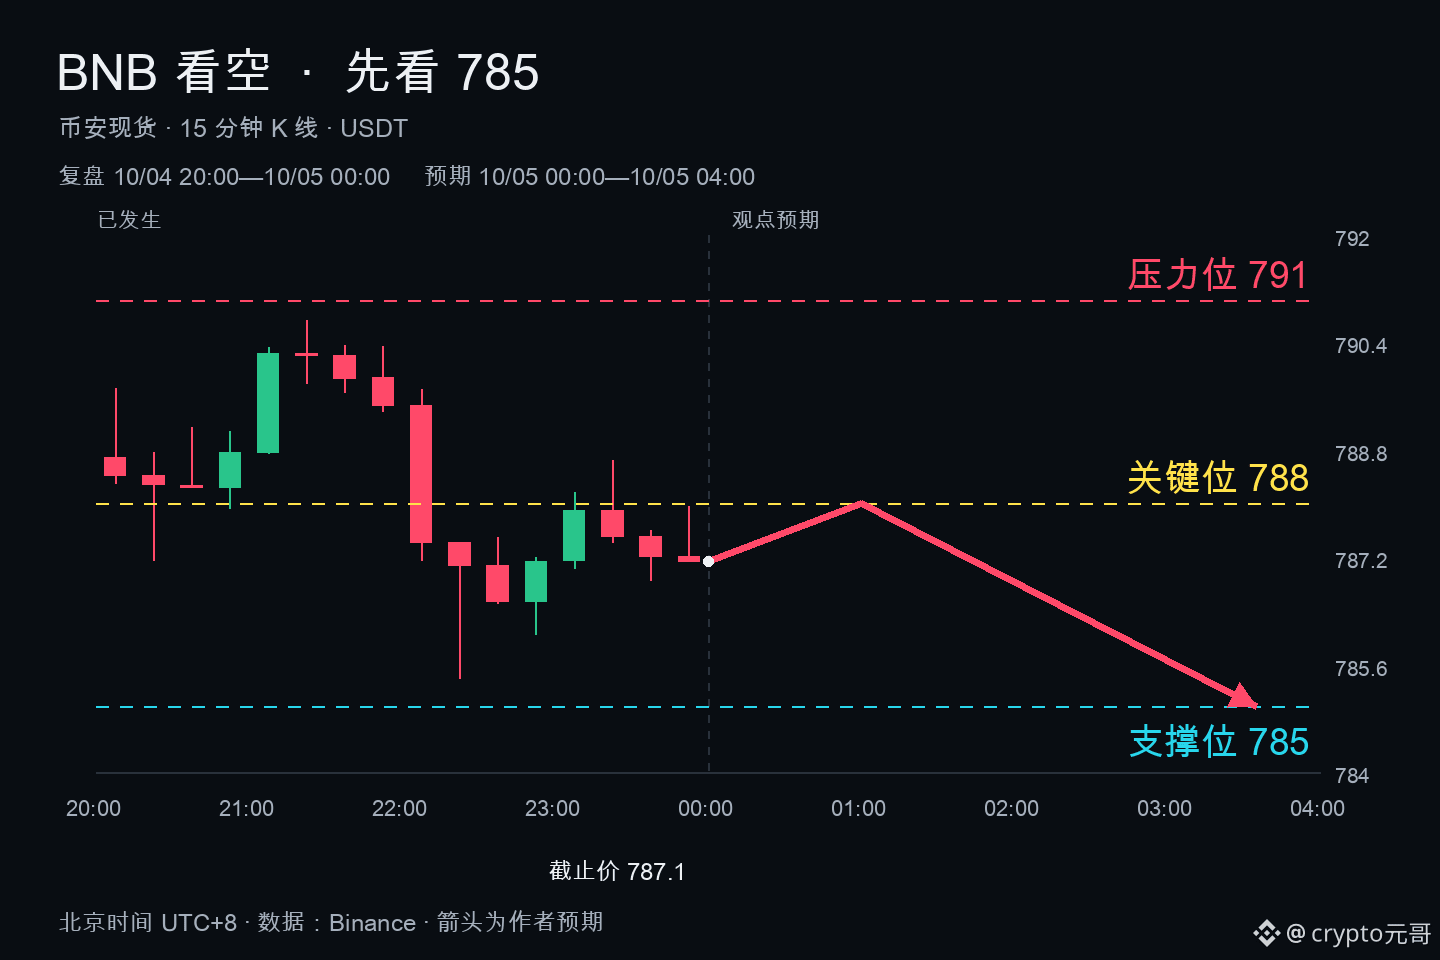
BNB 788 can’t hold; in the short term it still looks like it needs to grind lower. I’m bearish on $BNB.
The 4-hour candle has just closed: it opened at 788.68 and closed at 787.14, down 0.2%. The high at 790.7 was pushed up but got knocked back. The low was 785.42. In plain terms, it can’t get up; the 791 level is pressing down hard.
Now look at the recent 15-minute candles: over the last hour there are four bars. The highs have been stepping down from 788.64 to 787.96. The lows are also edging lower. The closing prices are 787.89, 787.51, 787.22, and 787.14—each one lower than the last. This kind of movement is classic “slow drift lower”; rebounds don’t have strength, and bids can’t catch.
Volume says even more: over the recent 4 hours, the volume in the last two hours is more than 20% lower than the first two. As price moves down, volume keeps shrinking—meaning nobody is willing to step in and bottom-buy at this level. Selling pressure isn’t overly fierce, but there’s also nobody willing to hold it up.
My view is very direct: if 788 can’t hold, I expect the short-term move to continue toward 785. If it really manages to reclaim and hold above 791, then I’ll admit I was wrong and withdraw my bearish stance. At this level, don’t rush to buy—wait until it has fully sold off.
BNB 788 can’t hold; in the short term it still looks like it needs to grind lower. I’m bearish on $BNB .
The 4-hour candle has just closed: it opened at 788.68 and closed at 787.14, down 0.2%. The high at 790.7 was pushed up but got knocked back. The low was 785.42. In plain terms, it can’t get up; the 791 level is pressing down hard.
Now look at the recent 15-minute candles: over the last hour there are four bars. The highs have been stepping down from 788.64 to 787.96. The lows are also edging lower. The closing prices are 787.89, 787.51, 787.22, and 787.14—each one lower than the last. This kind of movement is classic “slow drift lower”; rebounds don’t have strength, and bids can’t catch.
Volume says even more: over the recent 4 hours, the volume in the last two hours is more than 20% lower than the first two. As price moves down, volume keeps shrinking—meaning nobody is willing to step in and bottom-buy at this level. Selling pressure isn’t overly fierce, but there’s also nobody willing to hold it up.
My view is very direct: if 788 can’t hold, I expect the short-term move to continue toward 785. If it really manages to reclaim and hold above 791, then I’ll admit I was wrong and withdraw my bearish stance. At this level, don’t rush to buy—wait until it has fully sold off.
The 4-hour candle has just closed: it opened at 788.68 and closed at 787.14, down 0.2%. The high at 790.7 was pushed up but got knocked back. The low was 785.42. In plain terms, it can’t get up; the 791 level is pressing down hard.
Now look at the recent 15-minute candles: over the last hour there are four bars. The highs have been stepping down from 788.64 to 787.96. The lows are also edging lower. The closing prices are 787.89, 787.51, 787.22, and 787.14—each one lower than the last. This kind of movement is classic “slow drift lower”; rebounds don’t have strength, and bids can’t catch.
Volume says even more: over the recent 4 hours, the volume in the last two hours is more than 20% lower than the first two. As price moves down, volume keeps shrinking—meaning nobody is willing to step in and bottom-buy at this level. Selling pressure isn’t overly fierce, but there’s also nobody willing to hold it up.
My view is very direct: if 788 can’t hold, I expect the short-term move to continue toward 785. If it really manages to reclaim and hold above 791, then I’ll admit I was wrong and withdraw my bearish stance. At this level, don’t rush to buy—wait until it has fully sold off.
24
·
--
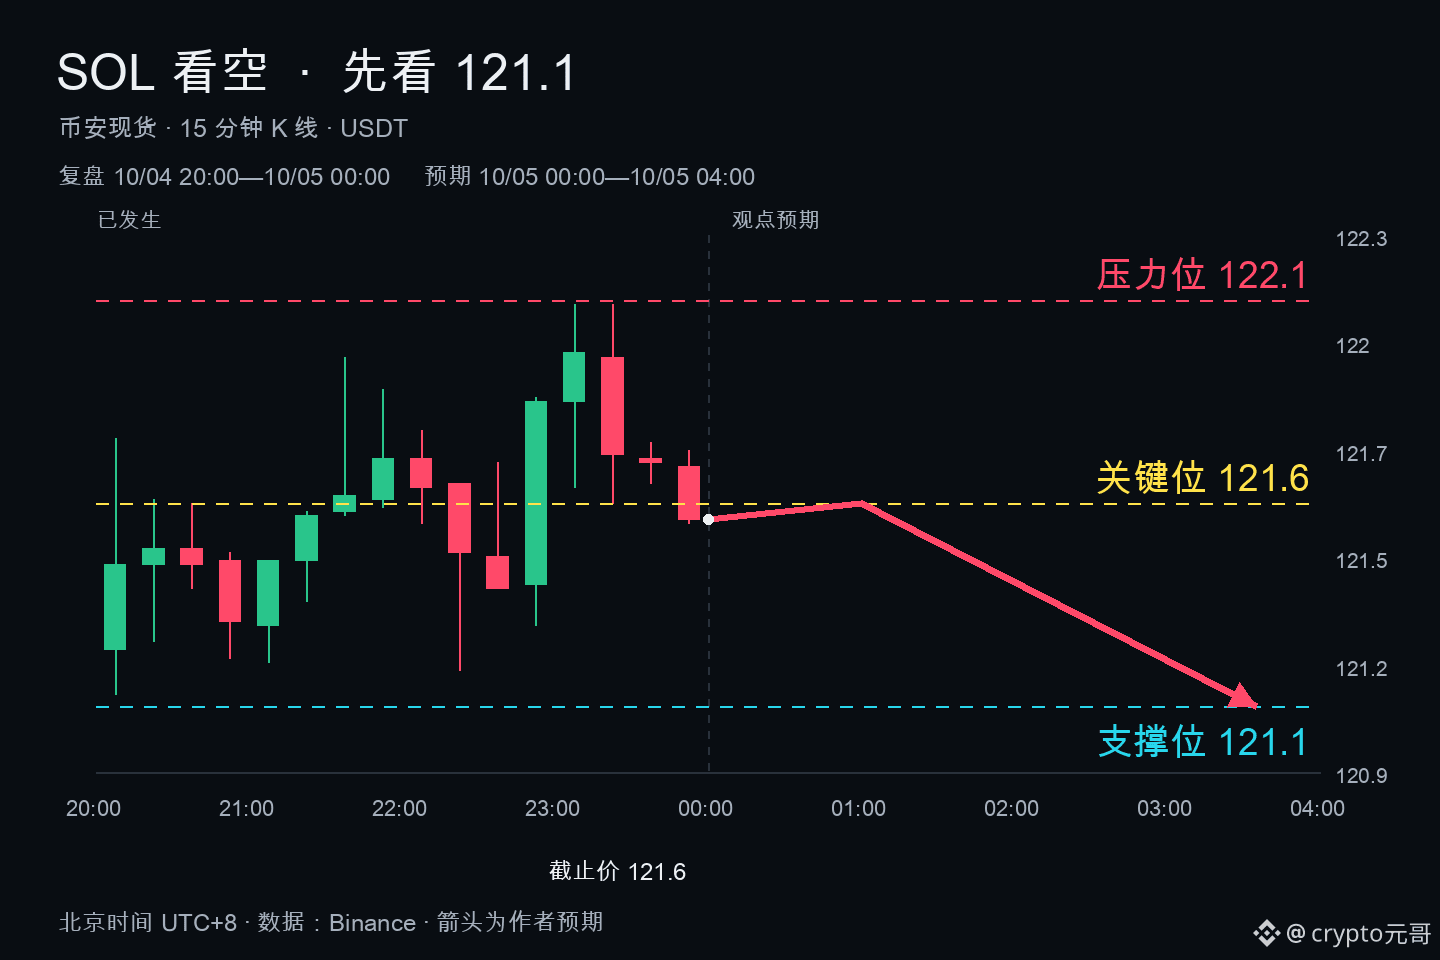
SOL can’t push anymore—122.1 is holding it down tightly. For a short-term view, I’m bearish on $SOL.
On the 4-hour timeframe, it just closed a small bullish candle of about +0.26%. It looks calm and uneventful at first glance, but if you look closely at the 15-minute chart, it gives itself away.
Over the past hour, the last four 15-minute candles’ highs have been stepping down: 122.09, 122.09, 121.75, 121.73—an obvious stair-step decline. The lows are also quietly breaking down: 121.64, 121.6, 121.65, 121.55. The closing prices are even more direct: 121.97, 121.72, 121.7, 121.56—each one lower than the last.
Most important is volume. In the last four hours, the total volume in the latter two hours is up 27.31% compared with the first two hours. Volume is increasing but the price isn’t rising—this suggests the sell pressure overhead is truly heavy, and the bulls can’t absorb at around 122.
So my conclusion is simple: 122.1 is the short-term life-or-death line. As long as it can’t stand above that level on increased volume, then any rebound is an opportunity to short. For downside levels, first watch 121.6; if that breaks, then look at 121.1.
The target for this move is 121.1. The stop-loss logic is also clear: if price reclaims and holds above 122.1, then it means I’m wrong—my short-term bearish thesis is immediately withdrawn.
No guarantees of any profit—just speaking based on the chart structure. At SOL’s current position, chasing a long doesn’t have a good cost-performance ratio.
SOL can’t push anymore—122.1 is holding it down tightly. For a short-term view, I’m bearish on $SOL .
On the 4-hour timeframe, it just closed a small bullish candle of about +0.26%. It looks calm and uneventful at first glance, but if you look closely at the 15-minute chart, it gives itself away.
Over the past hour, the last four 15-minute candles’ highs have been stepping down: 122.09, 122.09, 121.75, 121.73—an obvious stair-step decline. The lows are also quietly breaking down: 121.64, 121.6, 121.65, 121.55. The closing prices are even more direct: 121.97, 121.72, 121.7, 121.56—each one lower than the last.
Most important is volume. In the last four hours, the total volume in the latter two hours is up 27.31% compared with the first two hours. Volume is increasing but the price isn’t rising—this suggests the sell pressure overhead is truly heavy, and the bulls can’t absorb at around 122.
So my conclusion is simple: 122.1 is the short-term life-or-death line. As long as it can’t stand above that level on increased volume, then any rebound is an opportunity to short. For downside levels, first watch 121.6; if that breaks, then look at 121.1.
The target for this move is 121.1. The stop-loss logic is also clear: if price reclaims and holds above 122.1, then it means I’m wrong—my short-term bearish thesis is immediately withdrawn.
No guarantees of any profit—just speaking based on the chart structure. At SOL’s current position, chasing a long doesn’t have a good cost-performance ratio.
On the 4-hour timeframe, it just closed a small bullish candle of about +0.26%. It looks calm and uneventful at first glance, but if you look closely at the 15-minute chart, it gives itself away.
Over the past hour, the last four 15-minute candles’ highs have been stepping down: 122.09, 122.09, 121.75, 121.73—an obvious stair-step decline. The lows are also quietly breaking down: 121.64, 121.6, 121.65, 121.55. The closing prices are even more direct: 121.97, 121.72, 121.7, 121.56—each one lower than the last.
Most important is volume. In the last four hours, the total volume in the latter two hours is up 27.31% compared with the first two hours. Volume is increasing but the price isn’t rising—this suggests the sell pressure overhead is truly heavy, and the bulls can’t absorb at around 122.
So my conclusion is simple: 122.1 is the short-term life-or-death line. As long as it can’t stand above that level on increased volume, then any rebound is an opportunity to short. For downside levels, first watch 121.6; if that breaks, then look at 121.1.
The target for this move is 121.1. The stop-loss logic is also clear: if price reclaims and holds above 122.1, then it means I’m wrong—my short-term bearish thesis is immediately withdrawn.
No guarantees of any profit—just speaking based on the chart structure. At SOL’s current position, chasing a long doesn’t have a good cost-performance ratio.
29
·
--
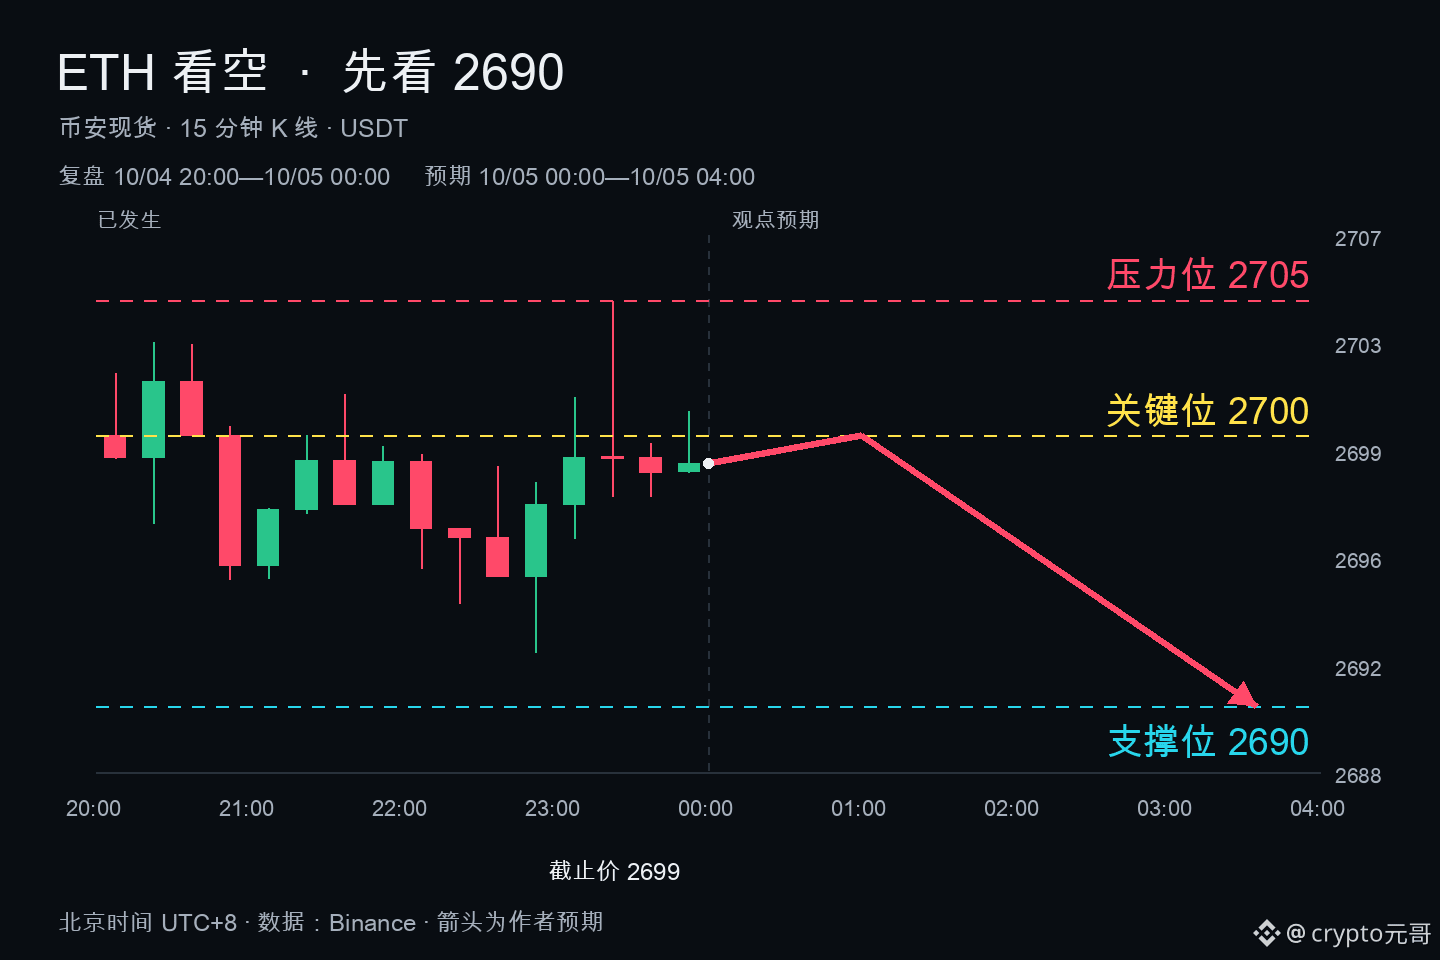
ETH Defends 2700? Buy-side Pressure Can’t Hold—Short-Term Bearish to 2690
$ETH on the four-hour chart nearly closed flat, down just 0.04%, but the order book looks weak.
In the most recent hour, there are four 15-minute K-lines: two times price surged to 2701 and 2704, but both were pushed back. The closes all ended below 2700—buyers simply can’t push it up.
Volume is also revealing: the total trading volume in the last two hours is only 0.61% higher than in the first two, yet the price has been grinding downward. With this kind of volume, it can’t move price up—more like there’s nobody stepping in to buy.
2705 above is a hard ceiling, and 2690 below is the short-term target. As long as it doesn’t reclaim 2705, I’ll keep a bearish bias.
Don’t rush to bottom-fish—wait until around 2690 to see.
ETH Defends 2700? Buy-side Pressure Can’t Hold—Short-Term Bearish to 2690
$ETH on the four-hour chart nearly closed flat, down just 0.04%, but the order book looks weak.
In the most recent hour, there are four 15-minute K-lines: two times price surged to 2701 and 2704, but both were pushed back. The closes all ended below 2700—buyers simply can’t push it up.
Volume is also revealing: the total trading volume in the last two hours is only 0.61% higher than in the first two, yet the price has been grinding downward. With this kind of volume, it can’t move price up—more like there’s nobody stepping in to buy.
2705 above is a hard ceiling, and 2690 below is the short-term target. As long as it doesn’t reclaim 2705, I’ll keep a bearish bias.
Don’t rush to bottom-fish—wait until around 2690 to see.
$ETH on the four-hour chart nearly closed flat, down just 0.04%, but the order book looks weak.
In the most recent hour, there are four 15-minute K-lines: two times price surged to 2701 and 2704, but both were pushed back. The closes all ended below 2700—buyers simply can’t push it up.
Volume is also revealing: the total trading volume in the last two hours is only 0.61% higher than in the first two, yet the price has been grinding downward. With this kind of volume, it can’t move price up—more like there’s nobody stepping in to buy.
2705 above is a hard ceiling, and 2690 below is the short-term target. As long as it doesn’t reclaim 2705, I’ll keep a bearish bias.
Don’t rush to bottom-fish—wait until around 2690 to see.
9
·
--
Brothers, $HYPE —this wave is bullish and timed perfectly. The first target is arriving soon!
Last time I explained it clearly: “At this position of $HYPE , the chips are in the hands of the strong. Don’t get scared off by a single recharge record. Go long.”
Looking back now, the rhythm this time really is solid. As of this round, $HYPE has moved from 89.64 to 90.26, matching my original judgment—the move is up 0.69%. Don’t dismiss it as small. The key is that none of the conditions were broken: the support at 90.17 was not smashed through, and the lows are still gradually lifting. In the last two hours, the trading volume dropped by nearly 68%, and selling pressure has clearly weakened. This kind of low-volume consolidation is often a signal that the bulls are building strength.
The first target at 90.96 is right above us. The execution rhythm for taking profit has already shown up. Whether you can bite into this piece in one go depends on whether you can reclaim the key level at 90.56 with strong volume.
After that, I’m still bullish. The reasons are simple: support hasn’t broken, volume is shrinking, and the lows are rising. This structure doesn’t look like it’s about to collapse—it feels more like waiting for a trigger for a volume expansion.
Of course, I’ll say it upfront: if it breaks below 90.17, I’ll withdraw my short-term long view. I won’t stubbornly hold on.
The original post for $HYPE is here—go back and check it yourself: https://www.binance.com/zh-CN/square/post/373512302147663
Brothers, $HYPE —this wave is bullish and timed perfectly. The first target is arriving soon!
Last time I explained it clearly: “At this position of $HYPE , the chips are in the hands of the strong. Don’t get scared off by a single recharge record. Go long.”
Looking back now, the rhythm this time really is solid. As of this round, $HYPE has moved from 89.64 to 90.26, matching my original judgment—the move is up 0.69%. Don’t dismiss it as small. The key is that none of the conditions were broken: the support at 90.17 was not smashed through, and the lows are still gradually lifting. In the last two hours, the trading volume dropped by nearly 68%, and selling pressure has clearly weakened. This kind of low-volume consolidation is often a signal that the bulls are building strength.
The first target at 90.96 is right above us. The execution rhythm for taking profit has already shown up. Whether you can bite into this piece in one go depends on whether you can reclaim the key level at 90.56 with strong volume.
After that, I’m still bullish. The reasons are simple: support hasn’t broken, volume is shrinking, and the lows are rising. This structure doesn’t look like it’s about to collapse—it feels more like waiting for a trigger for a volume expansion.
Of course, I’ll say it upfront: if it breaks below 90.17, I’ll withdraw my short-term long view. I won’t stubbornly hold on.
The original post for $HYPE is here—go back and check it yourself: https://www.binance.com/zh-CN/square/post/373512302147663
Last time I explained it clearly: “At this position of $HYPE , the chips are in the hands of the strong. Don’t get scared off by a single recharge record. Go long.”
Looking back now, the rhythm this time really is solid. As of this round, $HYPE has moved from 89.64 to 90.26, matching my original judgment—the move is up 0.69%. Don’t dismiss it as small. The key is that none of the conditions were broken: the support at 90.17 was not smashed through, and the lows are still gradually lifting. In the last two hours, the trading volume dropped by nearly 68%, and selling pressure has clearly weakened. This kind of low-volume consolidation is often a signal that the bulls are building strength.
The first target at 90.96 is right above us. The execution rhythm for taking profit has already shown up. Whether you can bite into this piece in one go depends on whether you can reclaim the key level at 90.56 with strong volume.
After that, I’m still bullish. The reasons are simple: support hasn’t broken, volume is shrinking, and the lows are rising. This structure doesn’t look like it’s about to collapse—it feels more like waiting for a trigger for a volume expansion.
Of course, I’ll say it upfront: if it breaks below 90.17, I’ll withdraw my short-term long view. I won’t stubbornly hold on.
The original post for $HYPE is here—go back and check it yourself: https://www.binance.com/zh-CN/square/post/373512302147663
37
·
--
BNB, this round 789 first target gets cashed; short-term I turn to bearish
Brothers, do you still remember my last line: “BNB steadily stands above 786, bulls are still adding positions, and this time I’m looking at 789”? Today at 16:35, the price touched 789—first target hit. This round’s rhythm was spot on. The profit isn’t huge, but the direction was taken.
That said, I only stand by the short-term call being right—it doesn’t mean I can predict the long term. Price action is made by the market, not by hype.
Now I turn the steering wheel for the short-term in the other direction: bearish. The reason isn’t complicated—after BNB surged to 795 on the 4-hour chart, it fell directly, closing around 788, basically giving back almost all the gains and leaving a long upper shadow. More importantly, the last two hours’ trading volume is 53% less than the first two hours. It surged on expansion and then dropped on contraction—buy-side strength can’t hold, so the push up turns out to be hollow.
In recent four 15-minute candles, each recent high is lower than the last, and the focus has also drifted toward 788. Bullish momentum is fading.
So this round I’m watching 795.2 as overhead resistance. Downside I’m looking at 786.6. If price breaks below this level, the short-term pullback opens up. If it manages to reclaim and hold above 795.2 again, I’ll admit I’m wrong and撤回 (withdraw) the bearish view.
This isn’t flip-flopping for the sake of it—this is a change in tempo. The previous round was taking profits on the bullish side; this round is a relay on bearish. Brothers, follow your own judgment.
Original post here: https://www.binance.com/zh-CN/square/post/373596094941279
BNB, this round 789 first target gets cashed; short-term I turn to bearish
Brothers, do you still remember my last line: “BNB steadily stands above 786, bulls are still adding positions, and this time I’m looking at 789”? Today at 16:35, the price touched 789—first target hit. This round’s rhythm was spot on. The profit isn’t huge, but the direction was taken.
That said, I only stand by the short-term call being right—it doesn’t mean I can predict the long term. Price action is made by the market, not by hype.
Now I turn the steering wheel for the short-term in the other direction: bearish. The reason isn’t complicated—after BNB surged to 795 on the 4-hour chart, it fell directly, closing around 788, basically giving back almost all the gains and leaving a long upper shadow. More importantly, the last two hours’ trading volume is 53% less than the first two hours. It surged on expansion and then dropped on contraction—buy-side strength can’t hold, so the push up turns out to be hollow.
In recent four 15-minute candles, each recent high is lower than the last, and the focus has also drifted toward 788. Bullish momentum is fading.
So this round I’m watching 795.2 as overhead resistance. Downside I’m looking at 786.6. If price breaks below this level, the short-term pullback opens up. If it manages to reclaim and hold above 795.2 again, I’ll admit I’m wrong and撤回 (withdraw) the bearish view.
This isn’t flip-flopping for the sake of it—this is a change in tempo. The previous round was taking profits on the bullish side; this round is a relay on bearish. Brothers, follow your own judgment.
Original post here: https://www.binance.com/zh-CN/square/post/373596094941279
Brothers, do you still remember my last line: “BNB steadily stands above 786, bulls are still adding positions, and this time I’m looking at 789”? Today at 16:35, the price touched 789—first target hit. This round’s rhythm was spot on. The profit isn’t huge, but the direction was taken.
That said, I only stand by the short-term call being right—it doesn’t mean I can predict the long term. Price action is made by the market, not by hype.
Now I turn the steering wheel for the short-term in the other direction: bearish. The reason isn’t complicated—after BNB surged to 795 on the 4-hour chart, it fell directly, closing around 788, basically giving back almost all the gains and leaving a long upper shadow. More importantly, the last two hours’ trading volume is 53% less than the first two hours. It surged on expansion and then dropped on contraction—buy-side strength can’t hold, so the push up turns out to be hollow.
In recent four 15-minute candles, each recent high is lower than the last, and the focus has also drifted toward 788. Bullish momentum is fading.
So this round I’m watching 795.2 as overhead resistance. Downside I’m looking at 786.6. If price breaks below this level, the short-term pullback opens up. If it manages to reclaim and hold above 795.2 again, I’ll admit I’m wrong and撤回 (withdraw) the bearish view.
This isn’t flip-flopping for the sake of it—this is a change in tempo. The previous round was taking profits on the bullish side; this round is a relay on bearish. Brothers, follow your own judgment.
Original post here: https://www.binance.com/zh-CN/square/post/373596094941279
51
·
--
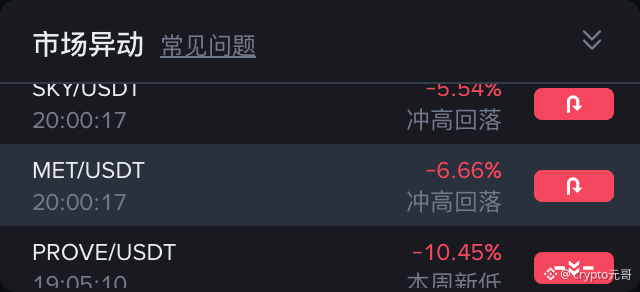
$MET surged and then reversed lower; the bulls were cut down by 6.66% in a single day. You can’t get past this level at 0.31.
$MET today’s move is exactly the kind of “bulls busy for nothing.”
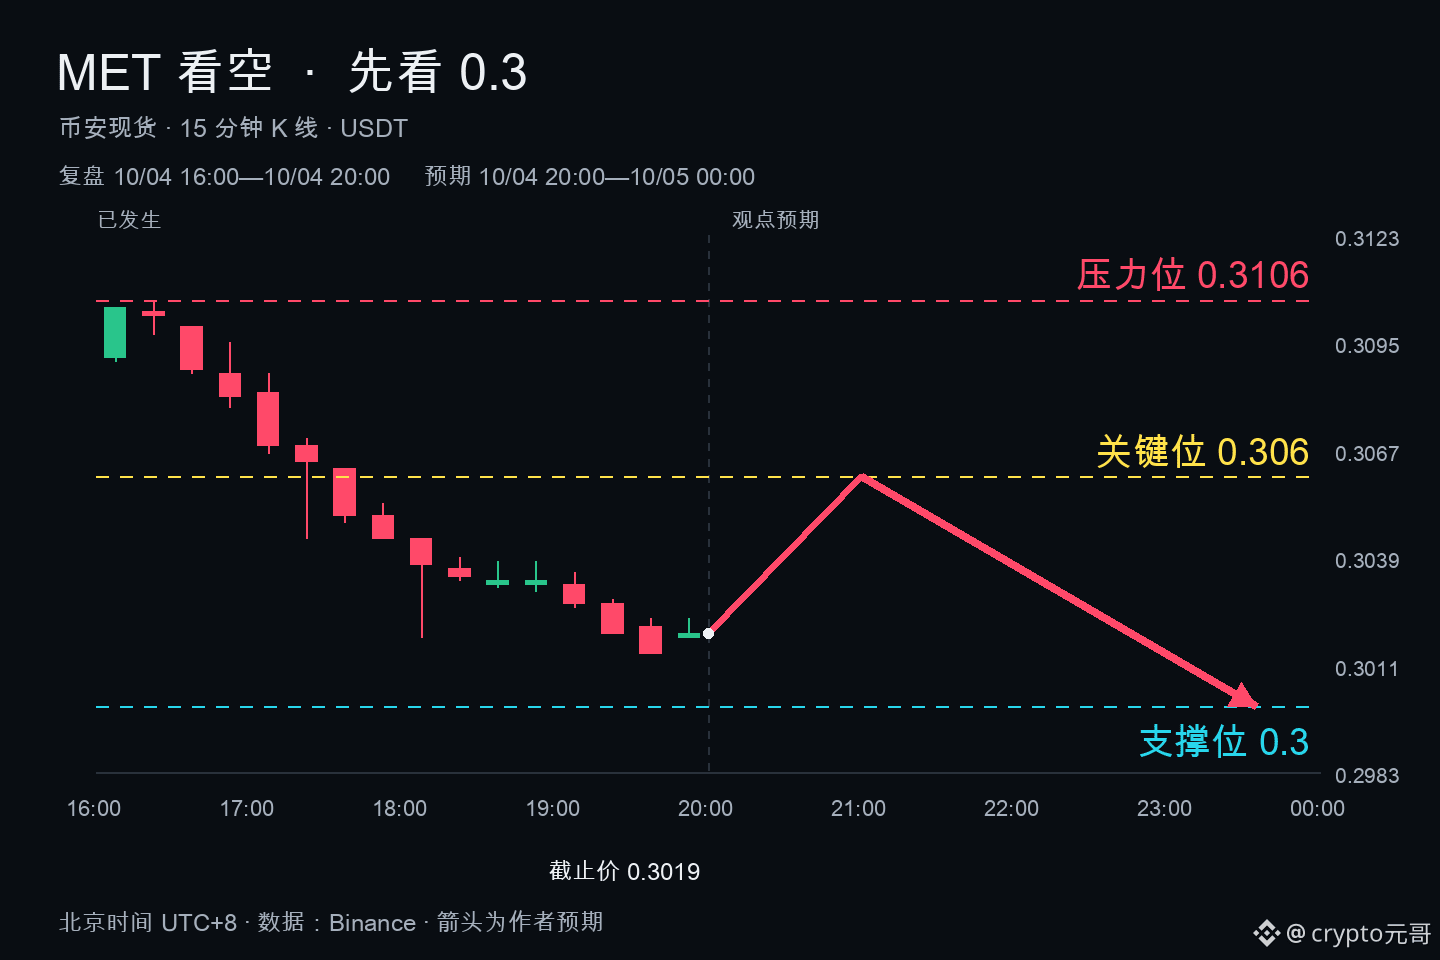
On the daily chart, it spiked up and then fell back, dropping 6.66% straight away. The four-hour chart is also green-to-red: it opened at 0.3091, closed at 0.3019, down 2.33%. Looks like a small drop, right? The key is it never even managed to break through—its high at 0.3106 was just tapped and then got smashed back.
Zoom in further: in the most recent hour, there were four consecutive 15-minute candlesticks. The highs kept stepping down: 0.3035, 0.3028, 0.3023, 0.3023. The lows are trending lower too: 0.3026, 0.3019, 0.3014, 0.3018. Even the closes lack conviction: 0.3027, 0.3019, 0.3014, 0.3019. This is the textbook pattern of a weak rebound—each wave is lower than the last.
What’s even more painful is the volume. Over the last four hours, the total traded volume in the second two hours is 50.27% less than in the first two hours. The drop is one thing, but nobody is stepping in to buy. A declining move on shrinking volume means the buyers are genuinely scared—no one wants to hold at this level.
The key levels are very clear: the line at 0.306 is pressing down overhead. Above that, 0.3106 is today’s high—the ceiling for this bullish push. Below is the 0.3 integer support level. The current price is 0.3019—only one step away.
My take is very straightforward: bearish in the short term. The target is that integer level at 0.3. After it breaks down, panic selling will very likely come in for another round.
The only condition for a turnaround is equally clear: unless it can regain and hold above 0.3106, this bearish thesis won’t change. But based on the current volume-and-candlestick structure, it looks unlikely.
Don’t rush to bottom-fish—0.3 might not hold.
$MET surged and then reversed lower; the bulls were cut down by 6.66% in a single day. You can’t get past this level at 0.31.
$MET today’s move is exactly the kind of “bulls busy for nothing.”
On the daily chart, it spiked up and then fell back, dropping 6.66% straight away. The four-hour chart is also green-to-red: it opened at 0.3091, closed at 0.3019, down 2.33%. Looks like a small drop, right? The key is it never even managed to break through—its high at 0.3106 was just tapped and then got smashed back.
Zoom in further: in the most recent hour, there were four consecutive 15-minute candlesticks. The highs kept stepping down: 0.3035, 0.3028, 0.3023, 0.3023. The lows are trending lower too: 0.3026, 0.3019, 0.3014, 0.3018. Even the closes lack conviction: 0.3027, 0.3019, 0.3014, 0.3019. This is the textbook pattern of a weak rebound—each wave is lower than the last.
What’s even more painful is the volume. Over the last four hours, the total traded volume in the second two hours is 50.27% less than in the first two hours. The drop is one thing, but nobody is stepping in to buy. A declining move on shrinking volume means the buyers are genuinely scared—no one wants to hold at this level.
The key levels are very clear: the line at 0.306 is pressing down overhead. Above that, 0.3106 is today’s high—the ceiling for this bullish push. Below is the 0.3 integer support level. The current price is 0.3019—only one step away.
My take is very straightforward: bearish in the short term. The target is that integer level at 0.3. After it breaks down, panic selling will very likely come in for another round.
The only condition for a turnaround is equally clear: unless it can regain and hold above 0.3106, this bearish thesis won’t change. But based on the current volume-and-candlestick structure, it looks unlikely.
Don’t rush to bottom-fish—0.3 might not hold.
$MET today’s move is exactly the kind of “bulls busy for nothing.”
On the daily chart, it spiked up and then fell back, dropping 6.66% straight away. The four-hour chart is also green-to-red: it opened at 0.3091, closed at 0.3019, down 2.33%. Looks like a small drop, right? The key is it never even managed to break through—its high at 0.3106 was just tapped and then got smashed back.
Zoom in further: in the most recent hour, there were four consecutive 15-minute candlesticks. The highs kept stepping down: 0.3035, 0.3028, 0.3023, 0.3023. The lows are trending lower too: 0.3026, 0.3019, 0.3014, 0.3018. Even the closes lack conviction: 0.3027, 0.3019, 0.3014, 0.3019. This is the textbook pattern of a weak rebound—each wave is lower than the last.
What’s even more painful is the volume. Over the last four hours, the total traded volume in the second two hours is 50.27% less than in the first two hours. The drop is one thing, but nobody is stepping in to buy. A declining move on shrinking volume means the buyers are genuinely scared—no one wants to hold at this level.
The key levels are very clear: the line at 0.306 is pressing down overhead. Above that, 0.3106 is today’s high—the ceiling for this bullish push. Below is the 0.3 integer support level. The current price is 0.3019—only one step away.
My take is very straightforward: bearish in the short term. The target is that integer level at 0.3. After it breaks down, panic selling will very likely come in for another round.
The only condition for a turnaround is equally clear: unless it can regain and hold above 0.3106, this bearish thesis won’t change. But based on the current volume-and-candlestick structure, it looks unlikely.
Don’t rush to bottom-fish—0.3 might not hold.
4
·
--
BNB firmly stands above 786, and the longs are still adding—this wave, I’m watching 789
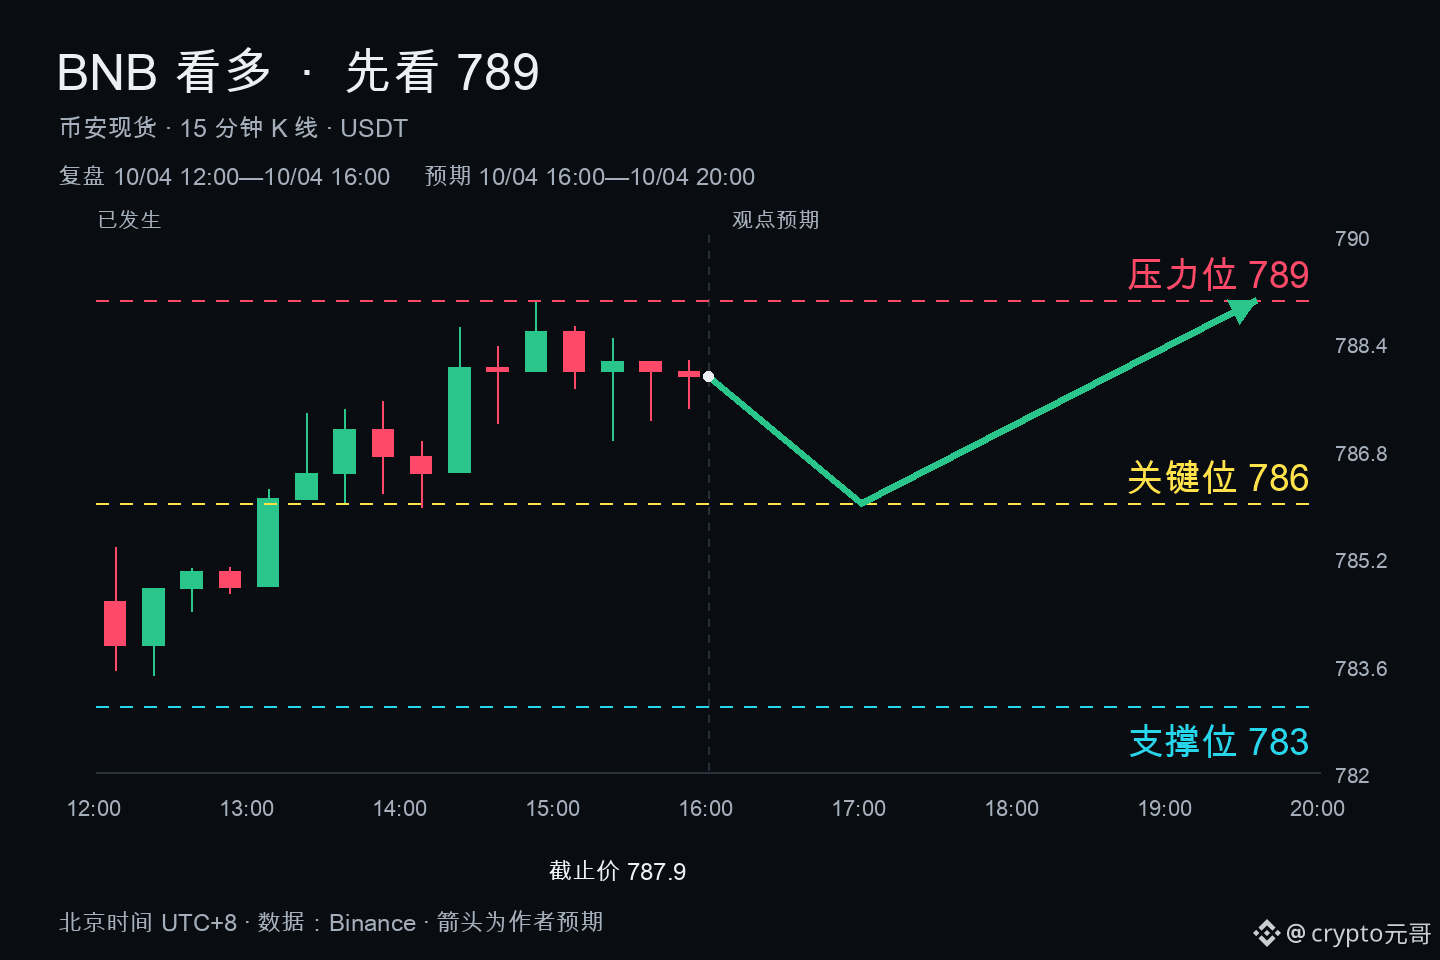
From the 15-minute candles, it looks like in BNB’s most recent hour, the four local highs have all been around 788, while each low has been higher than the last. 786 hasn’t even given the bears a chance to test it.
The 4-hour close is 787.87, up 0.42%. It doesn’t look like much, but the key is this— the volume in the last two hours is up nearly 85% compared to the first two hours.
So what does that mean? Buyers are quietly entering, not doing a pump-and-dump fake breakout kind of volume—this is increasingly thick support.
Resistance is at 789; it’s just one step from the current price. This kind of sideways consolidation right under the resistance zone usually isn’t a sign it can’t go up—it’s more like building up energy. 786 is the key support, and 783 is the floor. As long as it doesn’t break 783, the short-term bullish logic holds.
The industry side also has supportive background. In September, the number of crypto job postings tripled to over 1,200, and talent demand is starting to warm up—showing that this space is still moving forward.
My take is simple: as long as 786 holds, 789 is likely to be tested. If it drops and breaks through 783, I’ll admit my mistake and get out.
$BNB
BNB firmly stands above 786, and the longs are still adding—this wave, I’m watching 789
From the 15-minute candles, it looks like in BNB’s most recent hour, the four local highs have all been around 788, while each low has been higher than the last. 786 hasn’t even given the bears a chance to test it.
The 4-hour close is 787.87, up 0.42%. It doesn’t look like much, but the key is this— the volume in the last two hours is up nearly 85% compared to the first two hours.
So what does that mean? Buyers are quietly entering, not doing a pump-and-dump fake breakout kind of volume—this is increasingly thick support.
Resistance is at 789; it’s just one step from the current price. This kind of sideways consolidation right under the resistance zone usually isn’t a sign it can’t go up—it’s more like building up energy. 786 is the key support, and 783 is the floor. As long as it doesn’t break 783, the short-term bullish logic holds.
The industry side also has supportive background. In September, the number of crypto job postings tripled to over 1,200, and talent demand is starting to warm up—showing that this space is still moving forward.
My take is simple: as long as 786 holds, 789 is likely to be tested. If it drops and breaks through 783, I’ll admit my mistake and get out.
$BNB
From the 15-minute candles, it looks like in BNB’s most recent hour, the four local highs have all been around 788, while each low has been higher than the last. 786 hasn’t even given the bears a chance to test it.
The 4-hour close is 787.87, up 0.42%. It doesn’t look like much, but the key is this— the volume in the last two hours is up nearly 85% compared to the first two hours.
So what does that mean? Buyers are quietly entering, not doing a pump-and-dump fake breakout kind of volume—this is increasingly thick support.
Resistance is at 789; it’s just one step from the current price. This kind of sideways consolidation right under the resistance zone usually isn’t a sign it can’t go up—it’s more like building up energy. 786 is the key support, and 783 is the floor. As long as it doesn’t break 783, the short-term bullish logic holds.
The industry side also has supportive background. In September, the number of crypto job postings tripled to over 1,200, and talent demand is starting to warm up—showing that this space is still moving forward.
My take is simple: as long as 786 holds, 789 is likely to be tested. If it drops and breaks through 783, I’ll admit my mistake and get out.
$BNB
1
27
·
--
As the SOL lows keep rising and higher lows form, the bulls are gathering strength and waiting to break through 121.4!
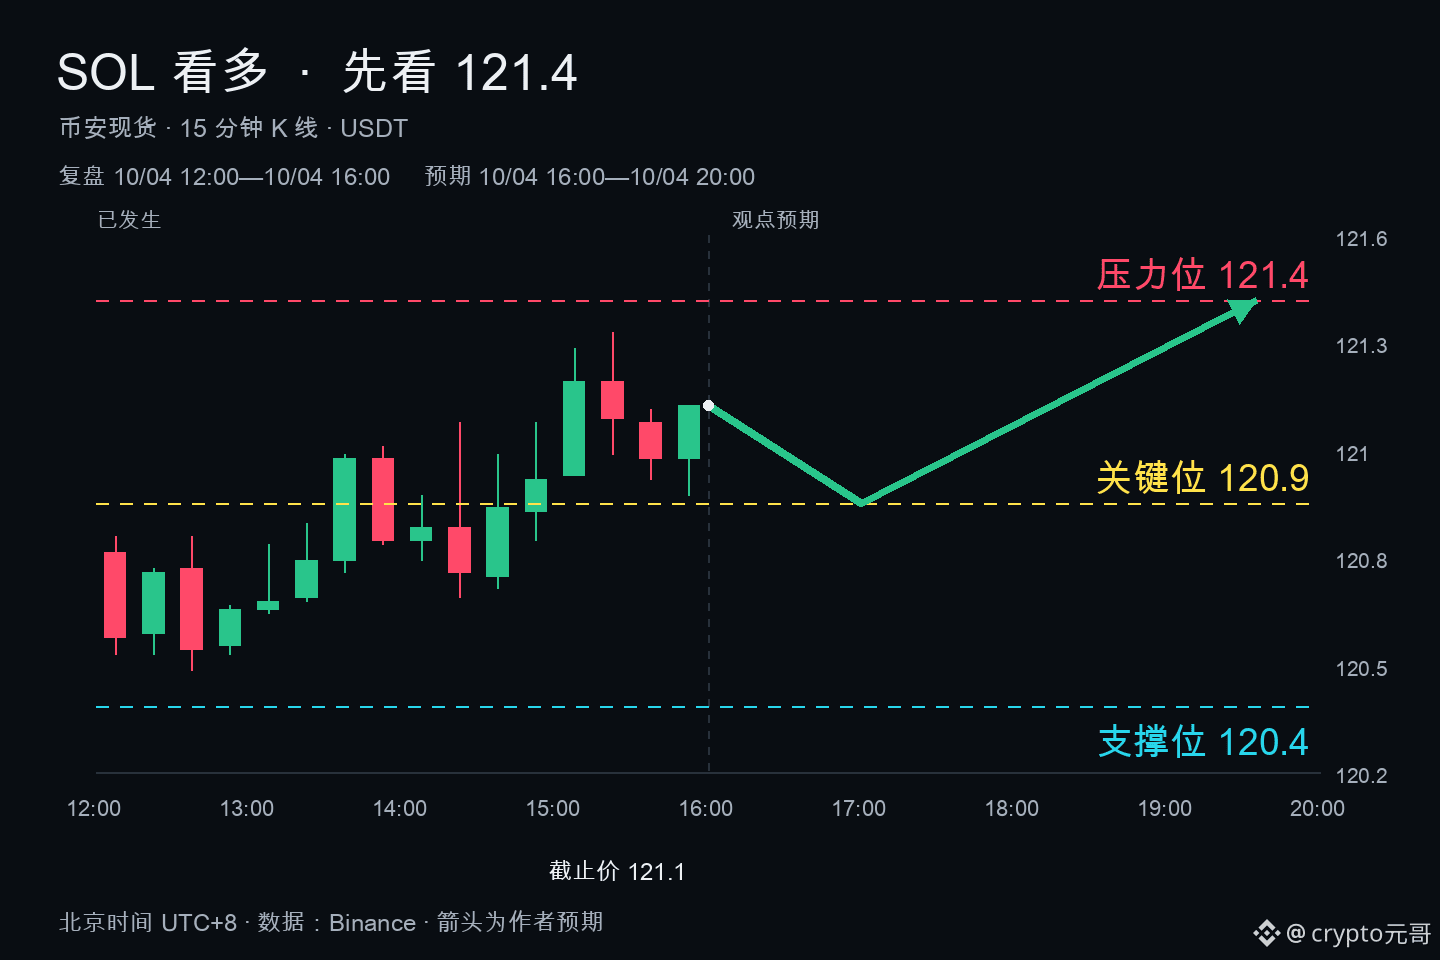
In the last 4 fifteen-minute K-lines over the most recent 1 hour ($SOL ), the lows were 120.97, 121.02, 120.96, and 120.92 respectively. Overall, price has held steadily above 120.9—so the bears can’t slam it down anymore. Now look at volume: in the last two hours, total trading volume jumped 64.93% compared with the first two hours. The increased volume is absorbing sell pressure—who’s doing the buying doesn’t need me to spell it out.
On the 4-hour chart, it opened at 120.78 and closed at 121.14, up 0.3%. The high reached 121.32, and it basically closed near the upper end. This kind of volume-backed pullback that doesn’t break support is the textbook “shakeout and build-up” pattern.
The news flow also helps: CoinDesk reported that in September, the number of posted positions in the crypto space increased. Solana is listed as one of the blockchain skills with the highest demand, indicating the ecosystem is still expanding—there’s no issue with the long-term thesis.
My view is simple: 120.9 is the key support. As long as it holds and isn’t broken, the bulls remain in control. The resistance is at 121.4—once there’s a breakout on increased volume, it will open up room to move. If price breaks below 120.4, then the short-term long setup fails; step aside if you need to.
At this level, there’s no need to chase. A pullback is the opportunity. SOL, go!
As the SOL lows keep rising and higher lows form, the bulls are gathering strength and waiting to break through 121.4!
In the last 4 fifteen-minute K-lines over the most recent 1 hour ($SOL ), the lows were 120.97, 121.02, 120.96, and 120.92 respectively. Overall, price has held steadily above 120.9—so the bears can’t slam it down anymore. Now look at volume: in the last two hours, total trading volume jumped 64.93% compared with the first two hours. The increased volume is absorbing sell pressure—who’s doing the buying doesn’t need me to spell it out.
On the 4-hour chart, it opened at 120.78 and closed at 121.14, up 0.3%. The high reached 121.32, and it basically closed near the upper end. This kind of volume-backed pullback that doesn’t break support is the textbook “shakeout and build-up” pattern.
The news flow also helps: CoinDesk reported that in September, the number of posted positions in the crypto space increased. Solana is listed as one of the blockchain skills with the highest demand, indicating the ecosystem is still expanding—there’s no issue with the long-term thesis.
My view is simple: 120.9 is the key support. As long as it holds and isn’t broken, the bulls remain in control. The resistance is at 121.4—once there’s a breakout on increased volume, it will open up room to move. If price breaks below 120.4, then the short-term long setup fails; step aside if you need to.
At this level, there’s no need to chase. A pullback is the opportunity. SOL, go!
In the last 4 fifteen-minute K-lines over the most recent 1 hour ($SOL ), the lows were 120.97, 121.02, 120.96, and 120.92 respectively. Overall, price has held steadily above 120.9—so the bears can’t slam it down anymore. Now look at volume: in the last two hours, total trading volume jumped 64.93% compared with the first two hours. The increased volume is absorbing sell pressure—who’s doing the buying doesn’t need me to spell it out.
On the 4-hour chart, it opened at 120.78 and closed at 121.14, up 0.3%. The high reached 121.32, and it basically closed near the upper end. This kind of volume-backed pullback that doesn’t break support is the textbook “shakeout and build-up” pattern.
The news flow also helps: CoinDesk reported that in September, the number of posted positions in the crypto space increased. Solana is listed as one of the blockchain skills with the highest demand, indicating the ecosystem is still expanding—there’s no issue with the long-term thesis.
My view is simple: 120.9 is the key support. As long as it holds and isn’t broken, the bulls remain in control. The resistance is at 121.4—once there’s a breakout on increased volume, it will open up room to move. If price breaks below 120.4, then the short-term long setup fails; step aside if you need to.
At this level, there’s no need to chase. A pullback is the opportunity. SOL, go!
7
·
--
ETH just surged past 2700 on heavy volume—next stop, let's see 2710!
Brothers, $ETH this move is kind of interesting.
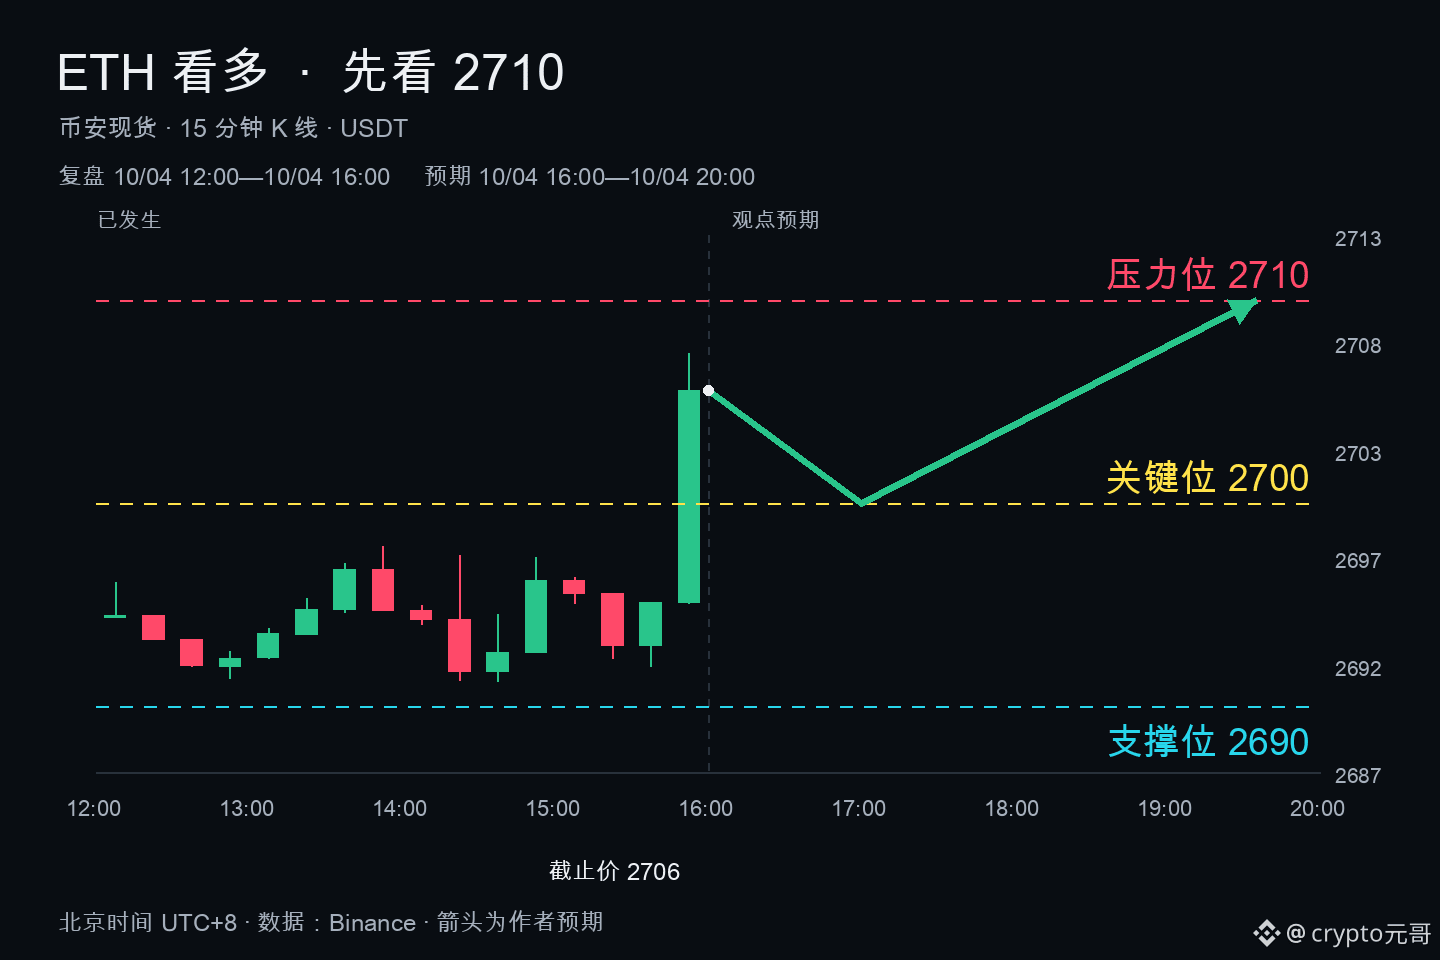
On the four-hour chart, it ran from 2694 to 2706—looks like the increase isn’t that big, right? But look at the last four 15-minute candles in the past hour: the very last one blasted straight up to 2707 and closed at 2705. The first three were all stuck between 2692 and 2696 grinding—this is the classic “squeeze for a long time, then sudden momentum.”
The most crucial signal is volume—over the last two hours of these four, the total traded volume jumped by more than 185% compared to the first two hours. Price moves up, and volume follows with a breakout—this isn’t a fake pump; real money is coming in.
That 2700 level has been suppressing things before, but now it’s finally held above it. My take is simple: as long as it doesn’t fall below 2690, we’ll keep looking long in the short term, and the first target is 2710.
Of course, you can’t call it in stone. If 2690 can’t hold, then this breakout is fake—if that happens, withdraw.
At this point, I’m choosing to stand with the bulls. ETH, go!
ETH just surged past 2700 on heavy volume—next stop, let's see 2710!
Brothers, $ETH this move is kind of interesting.
On the four-hour chart, it ran from 2694 to 2706—looks like the increase isn’t that big, right? But look at the last four 15-minute candles in the past hour: the very last one blasted straight up to 2707 and closed at 2705. The first three were all stuck between 2692 and 2696 grinding—this is the classic “squeeze for a long time, then sudden momentum.”
The most crucial signal is volume—over the last two hours of these four, the total traded volume jumped by more than 185% compared to the first two hours. Price moves up, and volume follows with a breakout—this isn’t a fake pump; real money is coming in.
That 2700 level has been suppressing things before, but now it’s finally held above it. My take is simple: as long as it doesn’t fall below 2690, we’ll keep looking long in the short term, and the first target is 2710.
Of course, you can’t call it in stone. If 2690 can’t hold, then this breakout is fake—if that happens, withdraw.
At this point, I’m choosing to stand with the bulls. ETH, go!
Brothers, $ETH this move is kind of interesting.
On the four-hour chart, it ran from 2694 to 2706—looks like the increase isn’t that big, right? But look at the last four 15-minute candles in the past hour: the very last one blasted straight up to 2707 and closed at 2705. The first three were all stuck between 2692 and 2696 grinding—this is the classic “squeeze for a long time, then sudden momentum.”
The most crucial signal is volume—over the last two hours of these four, the total traded volume jumped by more than 185% compared to the first two hours. Price moves up, and volume follows with a breakout—this isn’t a fake pump; real money is coming in.
That 2700 level has been suppressing things before, but now it’s finally held above it. My take is simple: as long as it doesn’t fall below 2690, we’ll keep looking long in the short term, and the first target is 2710.
Of course, you can’t call it in stone. If 2690 can’t hold, then this breakout is fake—if that happens, withdraw.
At this point, I’m choosing to stand with the bulls. ETH, go!
27
·
--
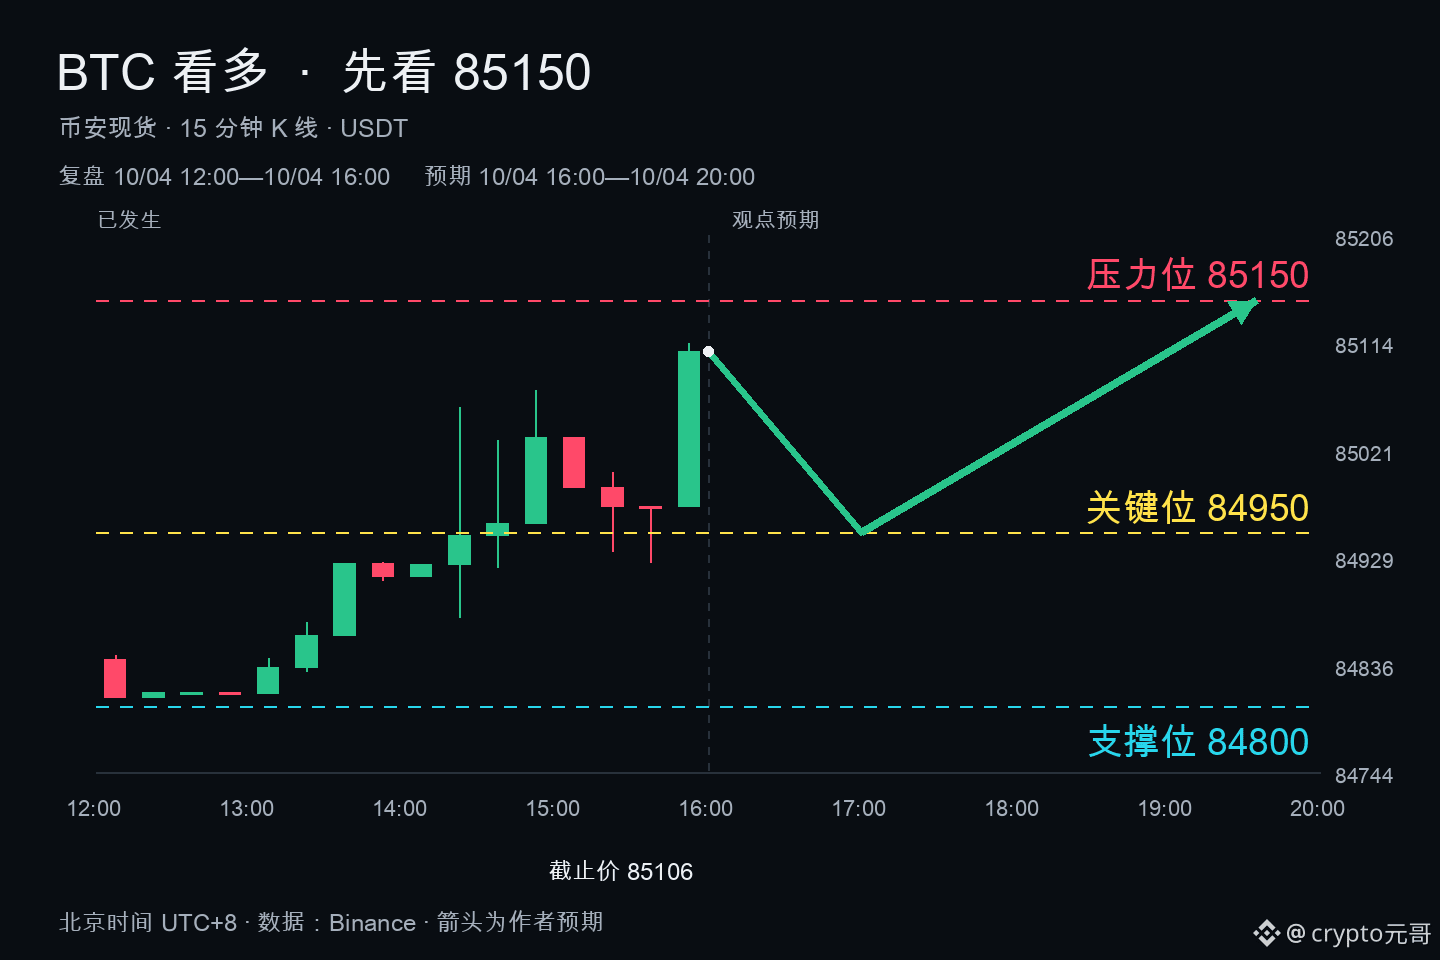
$BTC 缩量回踩后突然放量拉升,短线继续看多到85150
On the 4-hour timeframe: BTC opened at 84841 and closed at 85106, up 0.31%. The low only dipped to 84808 before buyers stepped in. This price action feels great—downward momentum can’t get traction, and price slowly grinds higher.
On the 15-minute chart, the most recent 4 candles are even more interesting. The first three candles kept chopping between 84924 and 85031, with the closing price drifting down in small steps from 84989 to 84972, looking like it might break down. Then the last candle surged directly to 85112.65 and closed at 85106—effectively reclaiming the entire downside move from the prior hour.
The key is volume. In the last four hours, the total volume in the latter two hours is 78.47% higher than in the first two hours. This isn’t “distribute while pushing” volume—it’s real money flowing in. With a new high and rising volume, the short-term bullish signal is very clear.
Now look at the news: CoinDesk reported that the number of crypto-industry job postings in September tripled, exceeding 1200. Even though the number of applicants is declining, hiring is concentrated in core roles like finance, engineering, and trading. The industry is quietly expanding—suggesting institutions are still building positions, which provides support for market sentiment.
My plan is simple: 84950 is the key level. As long as it holds, the short-term bias remains bullish. First target: 85150, near the high of this 4-hour move. Only once it holds above that level do we look for the next step.
Conversely, if price breaks below 84800, that would indicate this breakout rally on increased volume is false. In that case, the short-term long thesis should be withdrawn—don’t force it.
At this point, the longs’ rhythm is still intact. Don’t chase higher; a pullback that stabilizes around 84950 is the opportunity. $BTC
$BTC 缩量回踩后突然放量拉升,短线继续看多到85150
On the 4-hour timeframe: BTC opened at 84841 and closed at 85106, up 0.31%. The low only dipped to 84808 before buyers stepped in. This price action feels great—downward momentum can’t get traction, and price slowly grinds higher.
On the 15-minute chart, the most recent 4 candles are even more interesting. The first three candles kept chopping between 84924 and 85031, with the closing price drifting down in small steps from 84989 to 84972, looking like it might break down. Then the last candle surged directly to 85112.65 and closed at 85106—effectively reclaiming the entire downside move from the prior hour.
The key is volume. In the last four hours, the total volume in the latter two hours is 78.47% higher than in the first two hours. This isn’t “distribute while pushing” volume—it’s real money flowing in. With a new high and rising volume, the short-term bullish signal is very clear.
Now look at the news: CoinDesk reported that the number of crypto-industry job postings in September tripled, exceeding 1200. Even though the number of applicants is declining, hiring is concentrated in core roles like finance, engineering, and trading. The industry is quietly expanding—suggesting institutions are still building positions, which provides support for market sentiment.
My plan is simple: 84950 is the key level. As long as it holds, the short-term bias remains bullish. First target: 85150, near the high of this 4-hour move. Only once it holds above that level do we look for the next step.
Conversely, if price breaks below 84800, that would indicate this breakout rally on increased volume is false. In that case, the short-term long thesis should be withdrawn—don’t force it.
At this point, the longs’ rhythm is still intact. Don’t chase higher; a pullback that stabilizes around 84950 is the opportunity. $BTC
On the 4-hour timeframe: BTC opened at 84841 and closed at 85106, up 0.31%. The low only dipped to 84808 before buyers stepped in. This price action feels great—downward momentum can’t get traction, and price slowly grinds higher.
On the 15-minute chart, the most recent 4 candles are even more interesting. The first three candles kept chopping between 84924 and 85031, with the closing price drifting down in small steps from 84989 to 84972, looking like it might break down. Then the last candle surged directly to 85112.65 and closed at 85106—effectively reclaiming the entire downside move from the prior hour.
The key is volume. In the last four hours, the total volume in the latter two hours is 78.47% higher than in the first two hours. This isn’t “distribute while pushing” volume—it’s real money flowing in. With a new high and rising volume, the short-term bullish signal is very clear.
Now look at the news: CoinDesk reported that the number of crypto-industry job postings in September tripled, exceeding 1200. Even though the number of applicants is declining, hiring is concentrated in core roles like finance, engineering, and trading. The industry is quietly expanding—suggesting institutions are still building positions, which provides support for market sentiment.
My plan is simple: 84950 is the key level. As long as it holds, the short-term bias remains bullish. First target: 85150, near the high of this 4-hour move. Only once it holds above that level do we look for the next step.
Conversely, if price breaks below 84800, that would indicate this breakout rally on increased volume is false. In that case, the short-term long thesis should be withdrawn—don’t force it.
At this point, the longs’ rhythm is still intact. Don’t chase higher; a pullback that stabilizes around 84950 is the opportunity. $BTC
84
·
--
BNB 784 First Target Achieved! The Slow Grind Down on Low Volume—We Got This Meat
Brothers, what did that last post say again? $BNB 788 can’t hold—stay bearish in the short term, and first look at 784 below. Today around 09:15, the price already dipped to 784.56, so the first target has been realized. The timing was on point—this portion was comfortably taken.
Looking back, the logic is actually simple: each rebound high is lower than the last. You can’t even reach 791, and the volume is still shrinking. Over the past four hours, price dropped from 786.4 to 784.8. In the most recent hour, the volume on the two segments is more than 12% lower than the previous segment. And every time 784.5 is tested, it can’t hold—this shows nobody really wants to take delivery at this level. The bears still have the initiative.
Next, I’ll remain biased to the downside. First, I’m watching 782.1, the four-hour low support. If it breaks down, sentiment will get worse, and only then will the downside space open up. On the other hand, if it manages to reclaim 786.9, then I’ll admit I’m wrong—short-term bearishness will be撤(I’ll withdraw). This stop-loss line is consistent with the logic from last time; the conditions haven’t changed.
One more emphasis: this is only about the directional alignment up to this current round. Achieving the short-term call doesn’t mean it’ll always stay correct. The market can change at any time—manage your position size yourself.
The original post is here—if you’re interested, go back and check it: https://www.binance.com/zh-CN/square/post/373477950338702
(The above is only personal observation of the chart and does not constitute any investment advice.)
BNB 784 First Target Achieved! The Slow Grind Down on Low Volume—We Got This Meat
Brothers, what did that last post say again? $BNB 788 can’t hold—stay bearish in the short term, and first look at 784 below. Today around 09:15, the price already dipped to 784.56, so the first target has been realized. The timing was on point—this portion was comfortably taken.
Looking back, the logic is actually simple: each rebound high is lower than the last. You can’t even reach 791, and the volume is still shrinking. Over the past four hours, price dropped from 786.4 to 784.8. In the most recent hour, the volume on the two segments is more than 12% lower than the previous segment. And every time 784.5 is tested, it can’t hold—this shows nobody really wants to take delivery at this level. The bears still have the initiative.
Next, I’ll remain biased to the downside. First, I’m watching 782.1, the four-hour low support. If it breaks down, sentiment will get worse, and only then will the downside space open up. On the other hand, if it manages to reclaim 786.9, then I’ll admit I’m wrong—short-term bearishness will be撤(I’ll withdraw). This stop-loss line is consistent with the logic from last time; the conditions haven’t changed.
One more emphasis: this is only about the directional alignment up to this current round. Achieving the short-term call doesn’t mean it’ll always stay correct. The market can change at any time—manage your position size yourself.
The original post is here—if you’re interested, go back and check it: https://www.binance.com/zh-CN/square/post/373477950338702
(The above is only personal observation of the chart and does not constitute any investment advice.)
Brothers, what did that last post say again? $BNB 788 can’t hold—stay bearish in the short term, and first look at 784 below. Today around 09:15, the price already dipped to 784.56, so the first target has been realized. The timing was on point—this portion was comfortably taken.
Looking back, the logic is actually simple: each rebound high is lower than the last. You can’t even reach 791, and the volume is still shrinking. Over the past four hours, price dropped from 786.4 to 784.8. In the most recent hour, the volume on the two segments is more than 12% lower than the previous segment. And every time 784.5 is tested, it can’t hold—this shows nobody really wants to take delivery at this level. The bears still have the initiative.
Next, I’ll remain biased to the downside. First, I’m watching 782.1, the four-hour low support. If it breaks down, sentiment will get worse, and only then will the downside space open up. On the other hand, if it manages to reclaim 786.9, then I’ll admit I’m wrong—short-term bearishness will be撤(I’ll withdraw). This stop-loss line is consistent with the logic from last time; the conditions haven’t changed.
One more emphasis: this is only about the directional alignment up to this current round. Achieving the short-term call doesn’t mean it’ll always stay correct. The market can change at any time—manage your position size yourself.
The original post is here—if you’re interested, go back and check it: https://www.binance.com/zh-CN/square/post/373477950338702
(The above is only personal observation of the chart and does not constitute any investment advice.)
41
·
--
$GNS First target at 0.414—lock in profits; for the short term, keep bearish and continue to follow the rhythm
Brothers, I still remember what I said last time: “$GNS don’t rush to chase after the dip rebounds; even if it rebounds on lower volume, I’ll still look bearish.” The target was written directly at 0.414, and I also reminded everyone not to get fooled by the rebound bullish candle and end up catching the falling knife.
Now looking at the chart, $GNS has been grinding from 0.416 down to 0.414. The first target has been realized. The timing for the directional call was spot on: this is a low-volume rebound that can’t really gain strength, and the 0.422 resistance has been unable to be broken through.
For the next short term, I’m still leaning bearish for a simple reason: the 4-hour timeframe has surged and then pulled back. The high at 0.422 is pressing down hard, and the low has already shifted down to 0.413. Over the most recent four 15-minute candles, the center of gravity has moved from 0.416 to 0.414. In the last two hours, volume also shrank by about 4.1%, with no rebound volume to back it up. The next support to watch is 0.4121; if that breaks, we’ll continue to look lower.
Let me put it this way: if price manages to reclaim and hold above 0.422, I’ll admit I’m wrong and withdraw the bearish view. This is only about whether the direction matches for this current short-term cycle, not a long-term prediction victory. Don’t assume one perfectly timed call means you’ll always be perfectly right.
Personal opinion only, not investment advice. Crypto markets are volatile—manage your risk yourself.
Original post: https://www.binance.com/zh-CN/square/post/373536135902571
$GNS First target at 0.414—lock in profits; for the short term, keep bearish and continue to follow the rhythm
Brothers, I still remember what I said last time: “$GNS don’t rush to chase after the dip rebounds; even if it rebounds on lower volume, I’ll still look bearish.” The target was written directly at 0.414, and I also reminded everyone not to get fooled by the rebound bullish candle and end up catching the falling knife.
Now looking at the chart, $GNS has been grinding from 0.416 down to 0.414. The first target has been realized. The timing for the directional call was spot on: this is a low-volume rebound that can’t really gain strength, and the 0.422 resistance has been unable to be broken through.
For the next short term, I’m still leaning bearish for a simple reason: the 4-hour timeframe has surged and then pulled back. The high at 0.422 is pressing down hard, and the low has already shifted down to 0.413. Over the most recent four 15-minute candles, the center of gravity has moved from 0.416 to 0.414. In the last two hours, volume also shrank by about 4.1%, with no rebound volume to back it up. The next support to watch is 0.4121; if that breaks, we’ll continue to look lower.
Let me put it this way: if price manages to reclaim and hold above 0.422, I’ll admit I’m wrong and withdraw the bearish view. This is only about whether the direction matches for this current short-term cycle, not a long-term prediction victory. Don’t assume one perfectly timed call means you’ll always be perfectly right.
Personal opinion only, not investment advice. Crypto markets are volatile—manage your risk yourself.
Original post: https://www.binance.com/zh-CN/square/post/373536135902571
Brothers, I still remember what I said last time: “$GNS don’t rush to chase after the dip rebounds; even if it rebounds on lower volume, I’ll still look bearish.” The target was written directly at 0.414, and I also reminded everyone not to get fooled by the rebound bullish candle and end up catching the falling knife.
Now looking at the chart, $GNS has been grinding from 0.416 down to 0.414. The first target has been realized. The timing for the directional call was spot on: this is a low-volume rebound that can’t really gain strength, and the 0.422 resistance has been unable to be broken through.
For the next short term, I’m still leaning bearish for a simple reason: the 4-hour timeframe has surged and then pulled back. The high at 0.422 is pressing down hard, and the low has already shifted down to 0.413. Over the most recent four 15-minute candles, the center of gravity has moved from 0.416 to 0.414. In the last two hours, volume also shrank by about 4.1%, with no rebound volume to back it up. The next support to watch is 0.4121; if that breaks, we’ll continue to look lower.
Let me put it this way: if price manages to reclaim and hold above 0.422, I’ll admit I’m wrong and withdraw the bearish view. This is only about whether the direction matches for this current short-term cycle, not a long-term prediction victory. Don’t assume one perfectly timed call means you’ll always be perfectly right.
Personal opinion only, not investment advice. Crypto markets are volatile—manage your risk yourself.
Original post: https://www.binance.com/zh-CN/square/post/373536135902571
4
·
--
$GNS Bottoming out and bouncing back—don’t rush to chase. On a low-volume rebound, I’m still bearish.
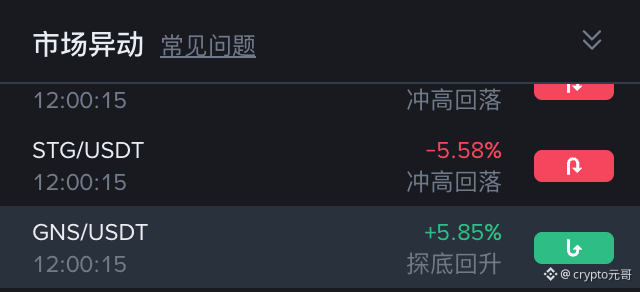
On $GNS , within the day it has risen by +5.85%. As soon as the “bottoming-out rebound” label appeared, people in the square immediately started shouting that it’s a reversal. I suggest you first read the order book and the chart before making any move.
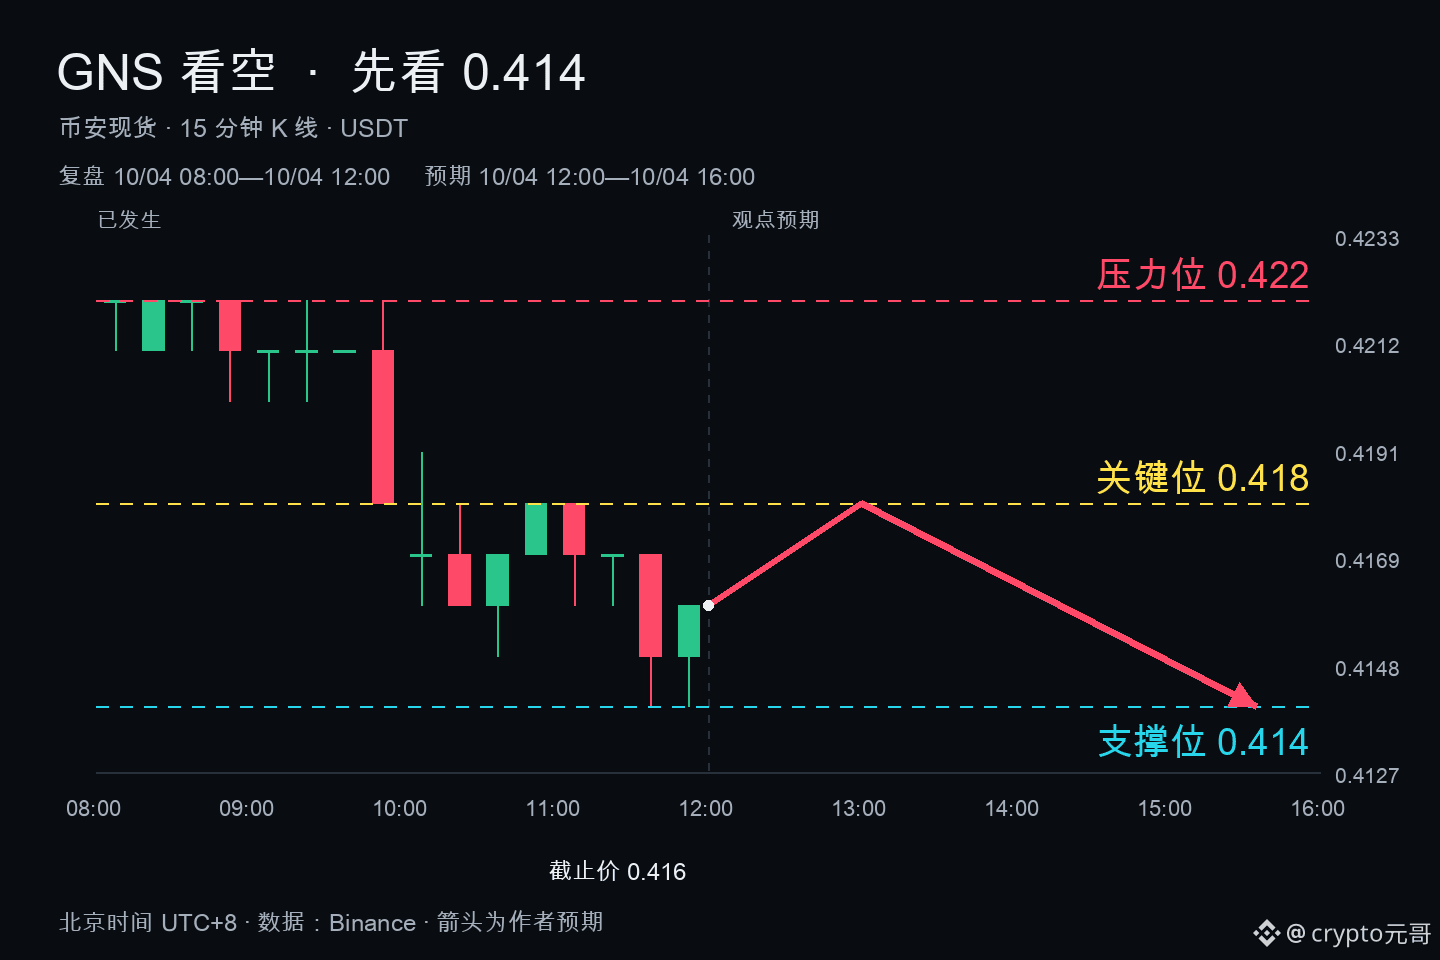
On the four-hour timeframe, the candle that closed is a bearish one: it opened at 0.422 and closed at 0.416. After pushing higher, everything was sold back down. The intraday high is 0.422, and attempts to go up multiple times have failed to hold.
Now look at the most recent four 15-minute candles within the last hour: the highs at 0.418 kept pressing down to 0.416, while the lows slid from 0.416 down to 0.414. The closes went 0.417 → 0.417 → 0.415 → 0.416. The center of gravity is clearly drifting downward. This isn’t a strong pullback—it can’t seem to lift its head.
Most importantly, it’s about volume. In the recent four hours, the trading volume in the last two hours has shrunk by 7.7% compared with the first two hours. Yet the price is rebounding while volume is contracting. That means fewer and fewer people are willing to buy in. The rally is being propped up only by existing liquidity. Such a rebound doesn’t have staying power.
0.422 overhead is a hard resistance level. Without an effective breakout, don’t talk about a reversal. The key level at 0.418 also can’t hold right now. Support below to watch is 0.414.
My short-term view is straightforward: bearish. Target 0.414; if it breaks, keep looking lower.
If the price can regain and hold above 0.422, I’ll admit I’m wrong and withdraw my bearish stance. But until then, don’t get tricked into catching a falling knife by a single rebound bullish candle.
Personal opinion only—this isn’t investment advice. Crypto markets are volatile, so be sure to manage risk yourself.
$GNS Bottoming out and bouncing back—don’t rush to chase. On a low-volume rebound, I’m still bearish.
On $GNS , within the day it has risen by +5.85%. As soon as the “bottoming-out rebound” label appeared, people in the square immediately started shouting that it’s a reversal. I suggest you first read the order book and the chart before making any move.
On the four-hour timeframe, the candle that closed is a bearish one: it opened at 0.422 and closed at 0.416. After pushing higher, everything was sold back down. The intraday high is 0.422, and attempts to go up multiple times have failed to hold.
Now look at the most recent four 15-minute candles within the last hour: the highs at 0.418 kept pressing down to 0.416, while the lows slid from 0.416 down to 0.414. The closes went 0.417 → 0.417 → 0.415 → 0.416. The center of gravity is clearly drifting downward. This isn’t a strong pullback—it can’t seem to lift its head.
Most importantly, it’s about volume. In the recent four hours, the trading volume in the last two hours has shrunk by 7.7% compared with the first two hours. Yet the price is rebounding while volume is contracting. That means fewer and fewer people are willing to buy in. The rally is being propped up only by existing liquidity. Such a rebound doesn’t have staying power.
0.422 overhead is a hard resistance level. Without an effective breakout, don’t talk about a reversal. The key level at 0.418 also can’t hold right now. Support below to watch is 0.414.
My short-term view is straightforward: bearish. Target 0.414; if it breaks, keep looking lower.
If the price can regain and hold above 0.422, I’ll admit I’m wrong and withdraw my bearish stance. But until then, don’t get tricked into catching a falling knife by a single rebound bullish candle.
Personal opinion only—this isn’t investment advice. Crypto markets are volatile, so be sure to manage risk yourself.
On $GNS , within the day it has risen by +5.85%. As soon as the “bottoming-out rebound” label appeared, people in the square immediately started shouting that it’s a reversal. I suggest you first read the order book and the chart before making any move.
On the four-hour timeframe, the candle that closed is a bearish one: it opened at 0.422 and closed at 0.416. After pushing higher, everything was sold back down. The intraday high is 0.422, and attempts to go up multiple times have failed to hold.
Now look at the most recent four 15-minute candles within the last hour: the highs at 0.418 kept pressing down to 0.416, while the lows slid from 0.416 down to 0.414. The closes went 0.417 → 0.417 → 0.415 → 0.416. The center of gravity is clearly drifting downward. This isn’t a strong pullback—it can’t seem to lift its head.
Most importantly, it’s about volume. In the recent four hours, the trading volume in the last two hours has shrunk by 7.7% compared with the first two hours. Yet the price is rebounding while volume is contracting. That means fewer and fewer people are willing to buy in. The rally is being propped up only by existing liquidity. Such a rebound doesn’t have staying power.
0.422 overhead is a hard resistance level. Without an effective breakout, don’t talk about a reversal. The key level at 0.418 also can’t hold right now. Support below to watch is 0.414.
My short-term view is straightforward: bearish. Target 0.414; if it breaks, keep looking lower.
If the price can regain and hold above 0.422, I’ll admit I’m wrong and withdraw my bearish stance. But until then, don’t get tricked into catching a falling knife by a single rebound bullish candle.
Personal opinion only—this isn’t investment advice. Crypto markets are volatile, so be sure to manage risk yourself.
2
·
--
Andrew Tate just sent $1.87 million worth of $HYPE to Binance—do you understand what this means?
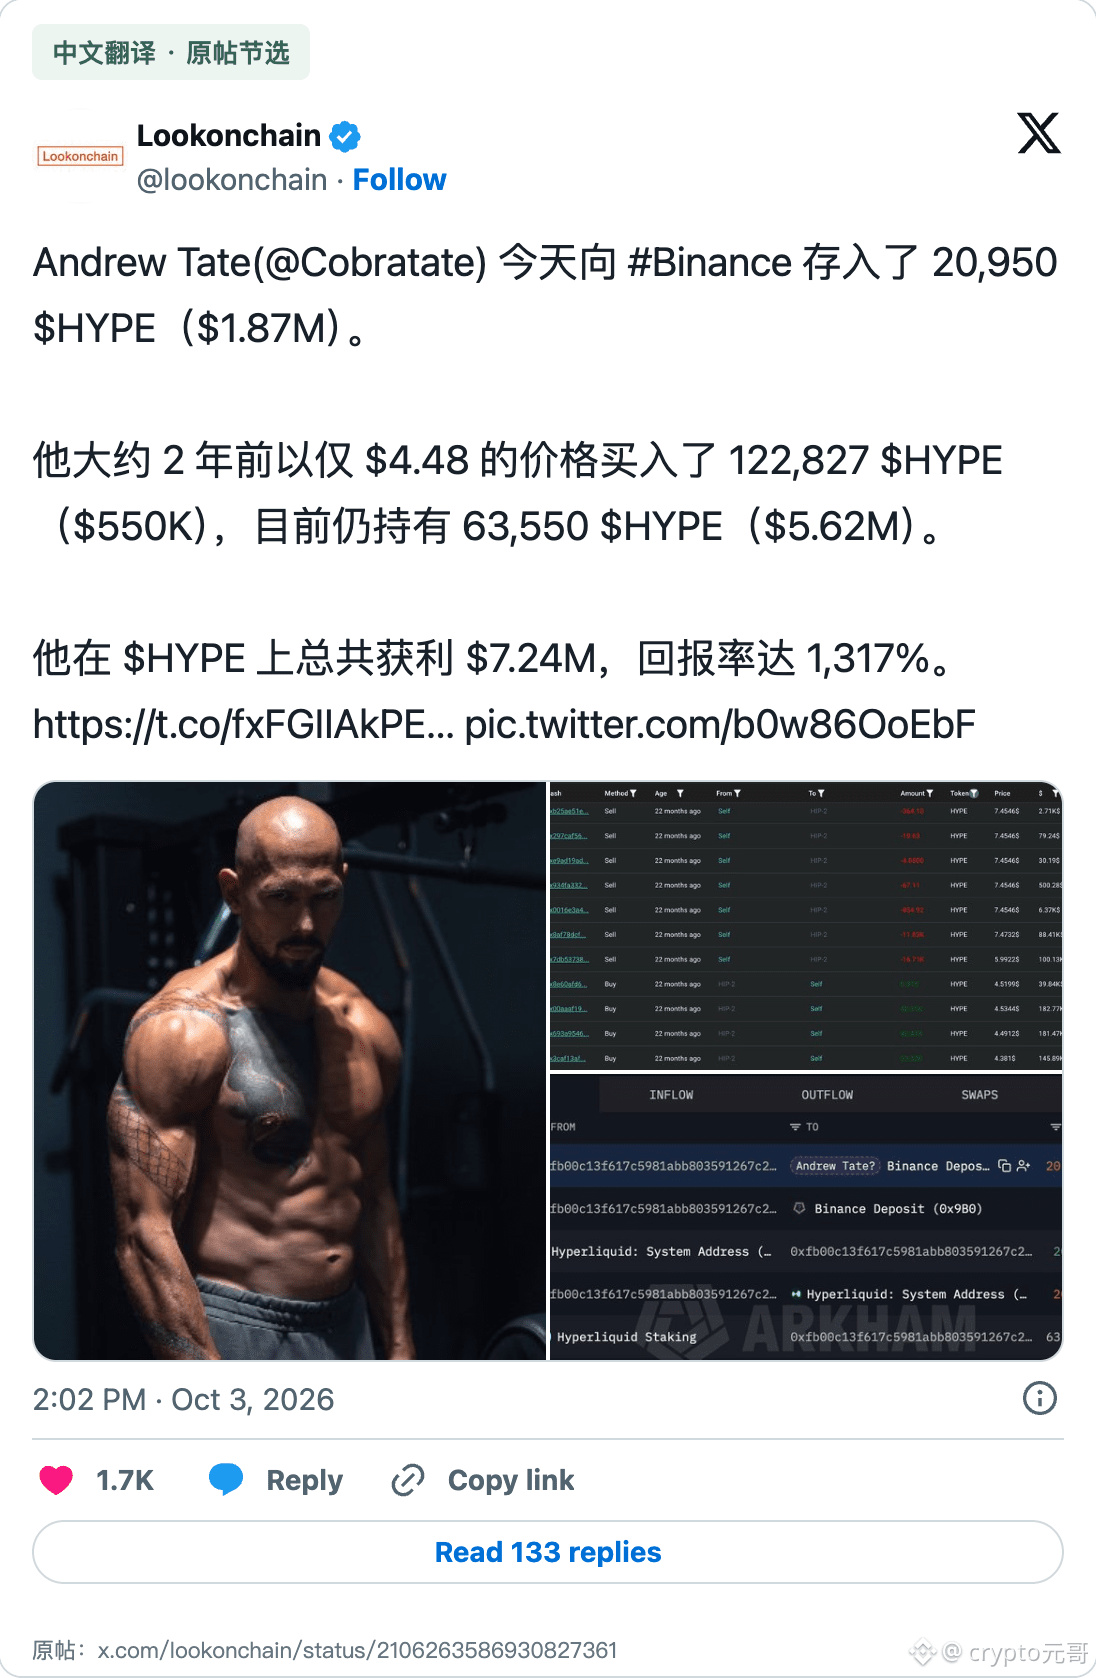
According to Lookonchain monitoring, Andrew Tate (@Cobratate) deposited 20,950 $HYPE into Binance today, worth about $1.87 million.
Here’s the key point—he bought 122,827 $HYPE at the $4.48 level two years ago, spending only about $550,000 at the time.
Now he still holds 63,550 $HYPE, worth $5.62 million.
Totaling it all, he’s already made $7.24 million on $HYPE , a return of 1317%.
Many people see “depositing to an exchange” and think it’s a sell-off signal right away, but don’t forget: his cost basis is $4.48, and he’s still holding more than 60,000 coins. For someone who has earned 13x and hasn’t exited yet, transferring 20,000 coins to an exchange— is that taking some profit, or is he planning to add more?
I’m more inclined to think he doesn’t intend to leave. If he really wanted to run, wouldn’t it have been better to sell when it was already over $4 two years ago? Why wait until it’s risen to more than 90 before running?
At the $HYPE level, the chips are in the hands of strong players—don’t get scared off by a single deposit record.
Bullish.
Andrew Tate just sent $1.87 million worth of $HYPE to Binance—do you understand what this means?
According to Lookonchain monitoring, Andrew Tate (@Cobratate) deposited 20,950 $HYPE into Binance today, worth about $1.87 million.
Here’s the key point—he bought 122,827 $HYPE at the $4.48 level two years ago, spending only about $550,000 at the time.
Now he still holds 63,550 $HYPE , worth $5.62 million.
Totaling it all, he’s already made $7.24 million on $HYPE , a return of 1317%.
Many people see “depositing to an exchange” and think it’s a sell-off signal right away, but don’t forget: his cost basis is $4.48, and he’s still holding more than 60,000 coins. For someone who has earned 13x and hasn’t exited yet, transferring 20,000 coins to an exchange— is that taking some profit, or is he planning to add more?
I’m more inclined to think he doesn’t intend to leave. If he really wanted to run, wouldn’t it have been better to sell when it was already over $4 two years ago? Why wait until it’s risen to more than 90 before running?
At the $HYPE level, the chips are in the hands of strong players—don’t get scared off by a single deposit record.
Bullish.
According to Lookonchain monitoring, Andrew Tate (@Cobratate) deposited 20,950 $HYPE into Binance today, worth about $1.87 million.
Here’s the key point—he bought 122,827 $HYPE at the $4.48 level two years ago, spending only about $550,000 at the time.
Now he still holds 63,550 $HYPE , worth $5.62 million.
Totaling it all, he’s already made $7.24 million on $HYPE , a return of 1317%.
Many people see “depositing to an exchange” and think it’s a sell-off signal right away, but don’t forget: his cost basis is $4.48, and he’s still holding more than 60,000 coins. For someone who has earned 13x and hasn’t exited yet, transferring 20,000 coins to an exchange— is that taking some profit, or is he planning to add more?
I’m more inclined to think he doesn’t intend to leave. If he really wanted to run, wouldn’t it have been better to sell when it was already over $4 two years ago? Why wait until it’s risen to more than 90 before running?
At the $HYPE level, the chips are in the hands of strong players—don’t get scared off by a single deposit record.
Bullish.
146
·
--
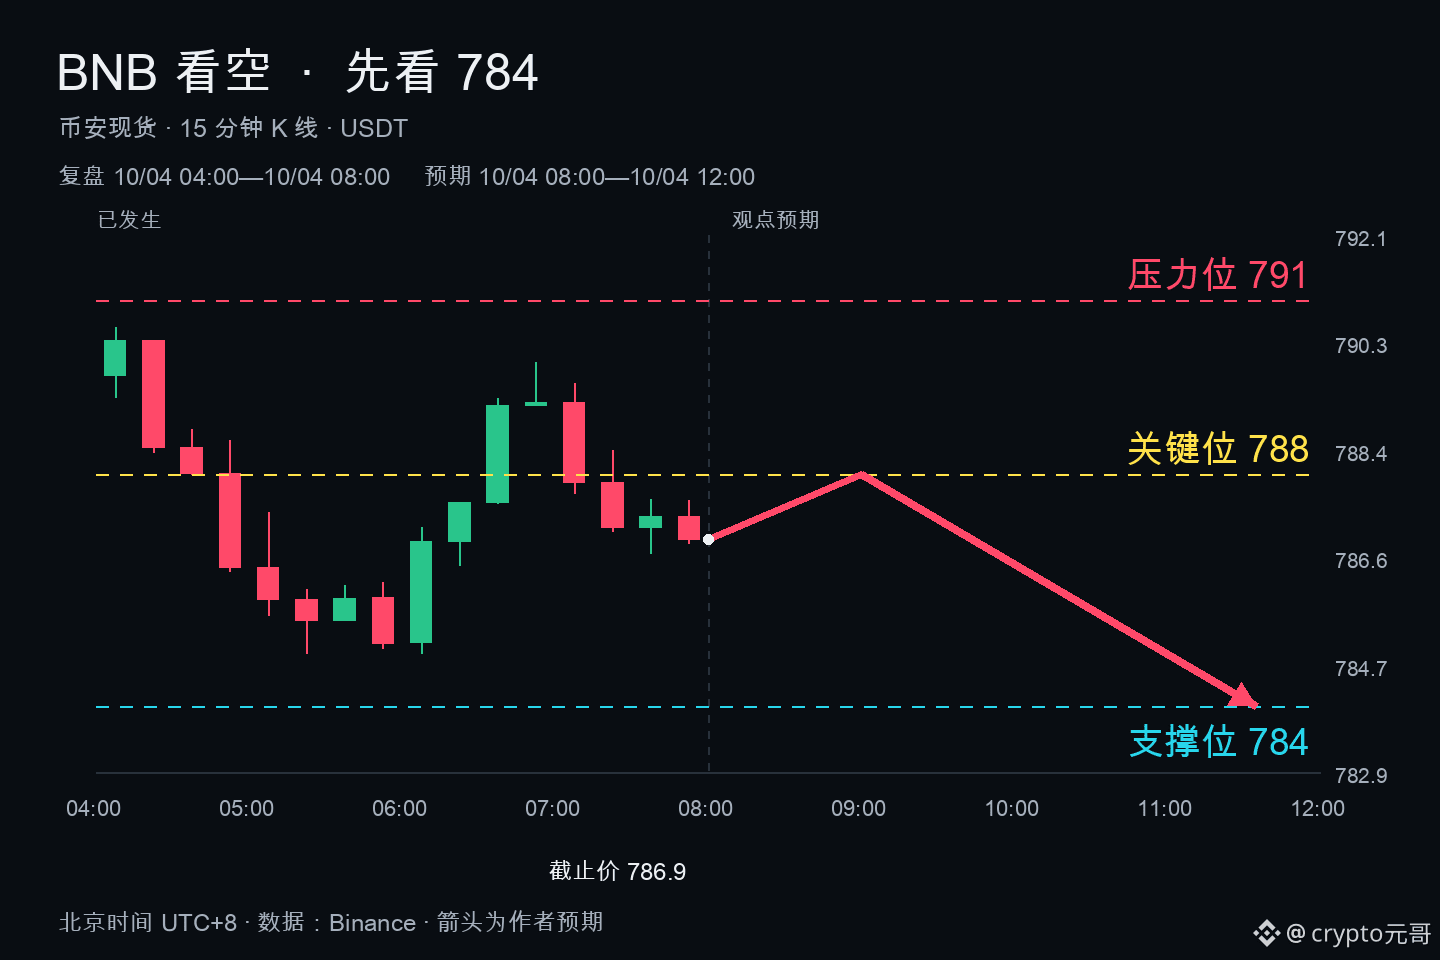
BNB 788 can’t hold anymore? The rebound is getting weaker and weaker, with the shorts eyeing 784
$BNB —this rebound really feels a bit underwhelming.
The four-hour chart closed at 786.88, down 0.36%. The high was 790.53, but it couldn’t even reach 791. Every time price tries to push higher, it gets pulled back.
Looking at the last four 15-minute K-lines within the past hour: the highs have slid from 789.57 down to 787.55, and the lows are also trending downward. The close dropped as well—from 787.86 to 786.88. This isn’t consolidation; it’s a steady grind lower. The bulls clearly don’t have strength anymore.
More importantly, volume: in the last four hours, the trading volume in the final two hours is even lower than in the first two hours by 0.34%. If the rebound can’t pick up volume, it means no one is willing to buy here. In that case, this rebound just hands opportunities to the shorts.
My view is simple: 788 isn’t a stable level. For the short term, I continue to look for downside, with 784 as the first target below. If 784 can’t be held either, sentiment will worsen further.
Of course, if price can get back above and hold 791, I’ll admit I’m wrong and withdraw the bearish view. But until then, don’t rush to bottom-fish. $BNB ’s short-term momentum is still in the shorts’ hands.
*(The above is just personal observation of the order book and price action, not investment advice. The market can change at any time—manage your positions responsibly.)*
BNB 788 can’t hold anymore? The rebound is getting weaker and weaker, with the shorts eyeing 784
$BNB —this rebound really feels a bit underwhelming.
The four-hour chart closed at 786.88, down 0.36%. The high was 790.53, but it couldn’t even reach 791. Every time price tries to push higher, it gets pulled back.
Looking at the last four 15-minute K-lines within the past hour: the highs have slid from 789.57 down to 787.55, and the lows are also trending downward. The close dropped as well—from 787.86 to 786.88. This isn’t consolidation; it’s a steady grind lower. The bulls clearly don’t have strength anymore.
More importantly, volume: in the last four hours, the trading volume in the final two hours is even lower than in the first two hours by 0.34%. If the rebound can’t pick up volume, it means no one is willing to buy here. In that case, this rebound just hands opportunities to the shorts.
My view is simple: 788 isn’t a stable level. For the short term, I continue to look for downside, with 784 as the first target below. If 784 can’t be held either, sentiment will worsen further.
Of course, if price can get back above and hold 791, I’ll admit I’m wrong and withdraw the bearish view. But until then, don’t rush to bottom-fish. $BNB ’s short-term momentum is still in the shorts’ hands.
*(The above is just personal observation of the order book and price action, not investment advice. The market can change at any time—manage your positions responsibly.)*
$BNB —this rebound really feels a bit underwhelming.
The four-hour chart closed at 786.88, down 0.36%. The high was 790.53, but it couldn’t even reach 791. Every time price tries to push higher, it gets pulled back.
Looking at the last four 15-minute K-lines within the past hour: the highs have slid from 789.57 down to 787.55, and the lows are also trending downward. The close dropped as well—from 787.86 to 786.88. This isn’t consolidation; it’s a steady grind lower. The bulls clearly don’t have strength anymore.
More importantly, volume: in the last four hours, the trading volume in the final two hours is even lower than in the first two hours by 0.34%. If the rebound can’t pick up volume, it means no one is willing to buy here. In that case, this rebound just hands opportunities to the shorts.
My view is simple: 788 isn’t a stable level. For the short term, I continue to look for downside, with 784 as the first target below. If 784 can’t be held either, sentiment will worsen further.
Of course, if price can get back above and hold 791, I’ll admit I’m wrong and withdraw the bearish view. But until then, don’t rush to bottom-fish. $BNB ’s short-term momentum is still in the shorts’ hands.
*(The above is just personal observation of the order book and price action, not investment advice. The market can change at any time—manage your positions responsibly.)*
77
·
--
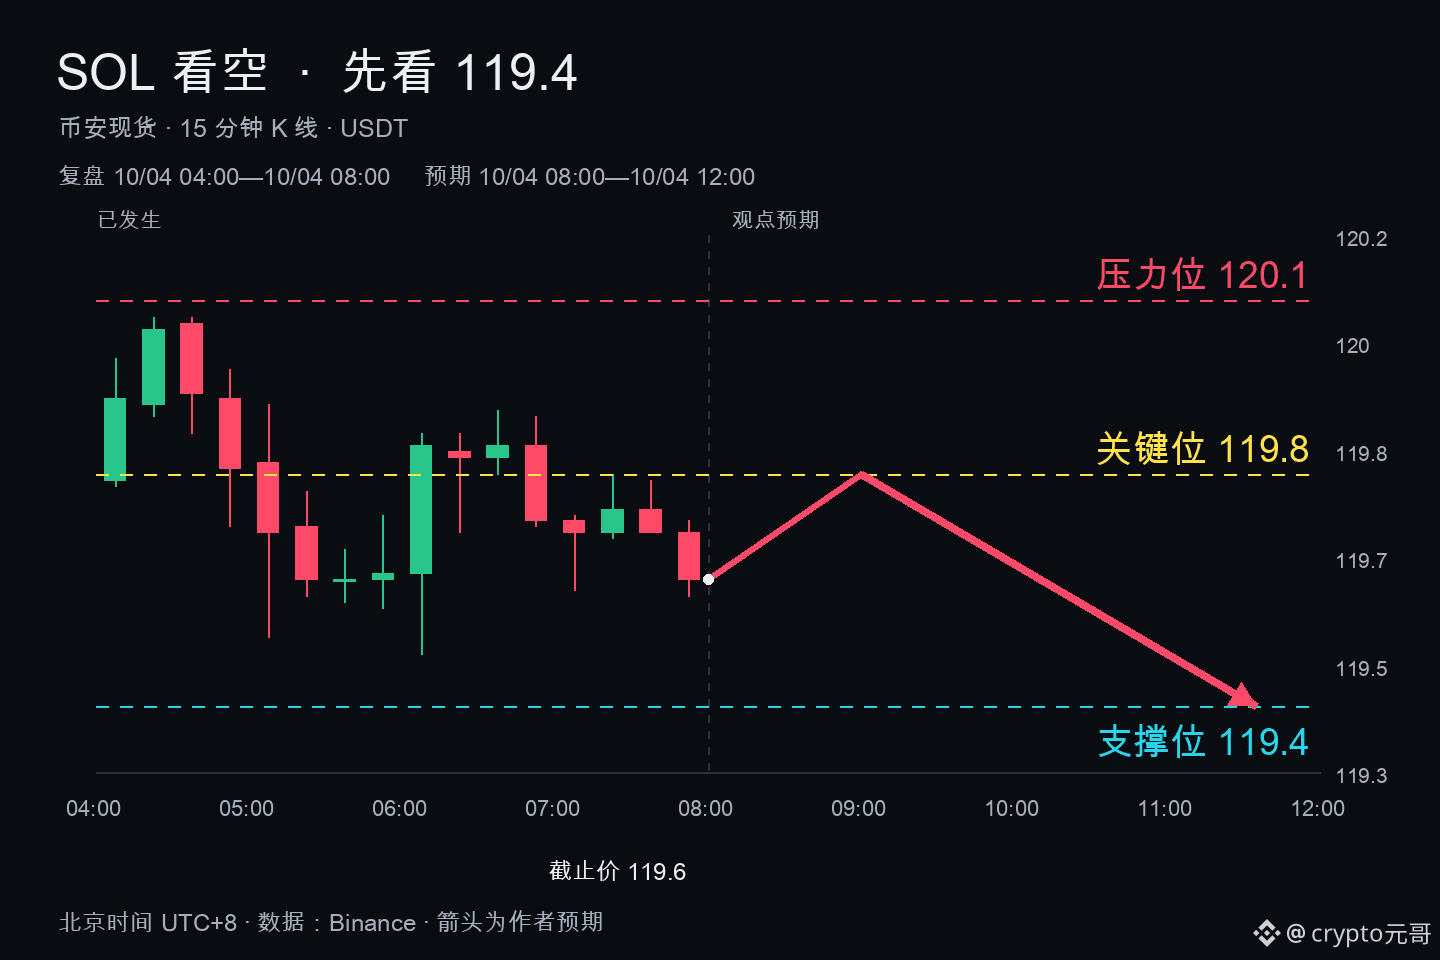
If SOL can’t break up, then it’s weak. In the short term, I’m looking for a drop to 119.4.
This market with $SOL is really frustrating to watch. The 4-hour candle closed at 119.62, down 0.14%. The high only managed to tag 120.07 before being slammed back down. The most fatal part is volume—over the most recent four hours, the transaction volume in the last two hours is down by almost 10% compared with the first two hours. Any rebound without volume is just a paper tiger.
On the technical side, the last four 15-minute candlesticks have been moving like an ECG: highs at 119.73, 119.80, 119.79, and 119.72—each time it fails to break through. The close even slid lower to 119.62. 119.8 is the wall right in front of it; if it can’t get past, then it can’t get past.
On the news front, CoinDesk said that in the September crypto hiring, Solana is one of the most commonly requested blockchain skills. The story is a good one, but the chart isn’t buying it. Great narrative, no money—so in the short term it’s just exhausting to trade.
My view is very direct: as long as it can’t hold above 119.8, the bears have the upper hand. First target is 119.4. If it can regain and hold above 120.1, then I’ll admit I’m wrong and withdraw my bearish view.
At this level, chasing longs has poor value. Let it choose its direction on its own.
If SOL can’t break up, then it’s weak. In the short term, I’m looking for a drop to 119.4.
This market with $SOL is really frustrating to watch. The 4-hour candle closed at 119.62, down 0.14%. The high only managed to tag 120.07 before being slammed back down. The most fatal part is volume—over the most recent four hours, the transaction volume in the last two hours is down by almost 10% compared with the first two hours. Any rebound without volume is just a paper tiger.
On the technical side, the last four 15-minute candlesticks have been moving like an ECG: highs at 119.73, 119.80, 119.79, and 119.72—each time it fails to break through. The close even slid lower to 119.62. 119.8 is the wall right in front of it; if it can’t get past, then it can’t get past.
On the news front, CoinDesk said that in the September crypto hiring, Solana is one of the most commonly requested blockchain skills. The story is a good one, but the chart isn’t buying it. Great narrative, no money—so in the short term it’s just exhausting to trade.
My view is very direct: as long as it can’t hold above 119.8, the bears have the upper hand. First target is 119.4. If it can regain and hold above 120.1, then I’ll admit I’m wrong and withdraw my bearish view.
At this level, chasing longs has poor value. Let it choose its direction on its own.
This market with $SOL is really frustrating to watch. The 4-hour candle closed at 119.62, down 0.14%. The high only managed to tag 120.07 before being slammed back down. The most fatal part is volume—over the most recent four hours, the transaction volume in the last two hours is down by almost 10% compared with the first two hours. Any rebound without volume is just a paper tiger.
On the technical side, the last four 15-minute candlesticks have been moving like an ECG: highs at 119.73, 119.80, 119.79, and 119.72—each time it fails to break through. The close even slid lower to 119.62. 119.8 is the wall right in front of it; if it can’t get past, then it can’t get past.
On the news front, CoinDesk said that in the September crypto hiring, Solana is one of the most commonly requested blockchain skills. The story is a good one, but the chart isn’t buying it. Great narrative, no money—so in the short term it’s just exhausting to trade.
My view is very direct: as long as it can’t hold above 119.8, the bears have the upper hand. First target is 119.4. If it can regain and hold above 120.1, then I’ll admit I’m wrong and withdraw my bearish view.
At this level, chasing longs has poor value. Let it choose its direction on its own.
64
·
--
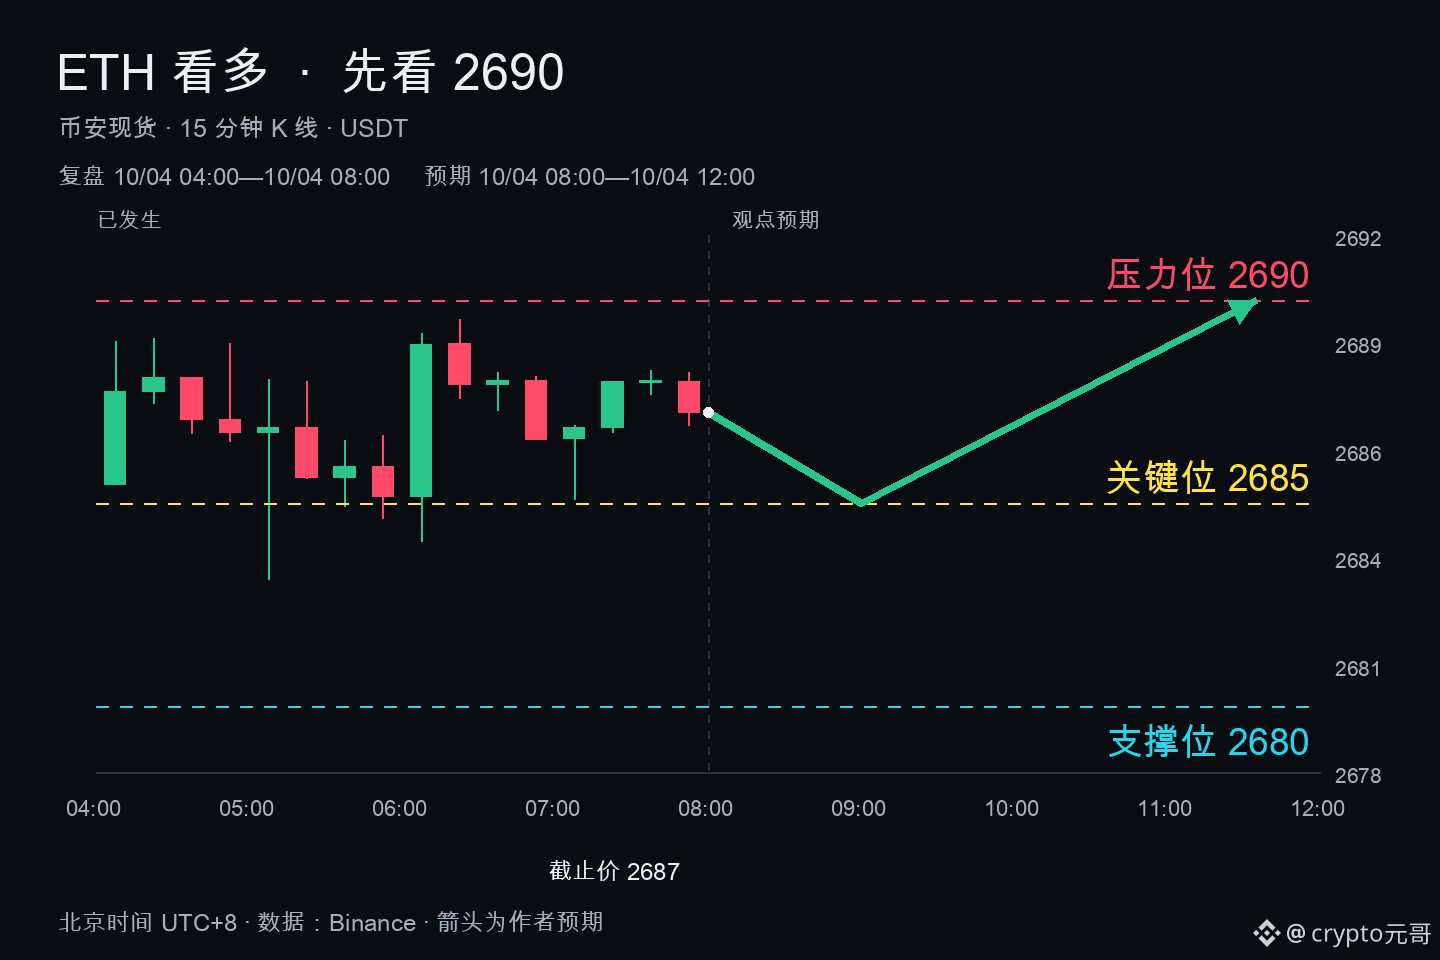
ETH Pulls Back on Lower Volume, Holds 2685 Unbroken — I’m Bullish!
$ETH current price around 2687. Near 2685 at the 4-hour open, it closed at 2687, with a slight daily gain of 0.07%. Don’t look at the small percentage— the trend is steady.
Looking at the 15-minute candles: the most recent hour shows four small bullish/small bearish candles. Highs: 2686.91 → 2688.01 → 2688.27 → 2688.21. Lows: 2685.09 → 2686.74 → 2687.69 → 2686.91. The lows are being quietly raised, and the 2685 level has been tested repeatedly without breaking down.
The trading volume is even more interesting: in the last four hours, the total volume in the latter two hours is 31.55% less than in the first two hours. A pullback on lighter volume with no heavy selling pressure—this kind of structure often indicates buildup, not a breakdown.
The news also adds confidence. According to CoinDesk, the number of crypto job postings increased to more than 1,200 in September. Bitcoin, Ethereum, and Solana are the most commonly requested blockchain skills. Demand for talent in the Ethereum ecosystem is still there— the industry hasn’t cooled off.
My plan: as long as it doesn’t fall below 2680, I’ll stay bullish on the short term. The first upside target is the 2690 resistance area. If it breaks above 2690, there’s a good chance more room opens up. If it drops below 2680, the short-term bullish logic fails and I’ll step back.
Not investment advice—manage your position size yourself.
ETH Pulls Back on Lower Volume, Holds 2685 Unbroken — I’m Bullish!
$ETH current price around 2687. Near 2685 at the 4-hour open, it closed at 2687, with a slight daily gain of 0.07%. Don’t look at the small percentage— the trend is steady.
Looking at the 15-minute candles: the most recent hour shows four small bullish/small bearish candles. Highs: 2686.91 → 2688.01 → 2688.27 → 2688.21. Lows: 2685.09 → 2686.74 → 2687.69 → 2686.91. The lows are being quietly raised, and the 2685 level has been tested repeatedly without breaking down.
The trading volume is even more interesting: in the last four hours, the total volume in the latter two hours is 31.55% less than in the first two hours. A pullback on lighter volume with no heavy selling pressure—this kind of structure often indicates buildup, not a breakdown.
The news also adds confidence. According to CoinDesk, the number of crypto job postings increased to more than 1,200 in September. Bitcoin, Ethereum, and Solana are the most commonly requested blockchain skills. Demand for talent in the Ethereum ecosystem is still there— the industry hasn’t cooled off.
My plan: as long as it doesn’t fall below 2680, I’ll stay bullish on the short term. The first upside target is the 2690 resistance area. If it breaks above 2690, there’s a good chance more room opens up. If it drops below 2680, the short-term bullish logic fails and I’ll step back.
Not investment advice—manage your position size yourself.
$ETH current price around 2687. Near 2685 at the 4-hour open, it closed at 2687, with a slight daily gain of 0.07%. Don’t look at the small percentage— the trend is steady.
Looking at the 15-minute candles: the most recent hour shows four small bullish/small bearish candles. Highs: 2686.91 → 2688.01 → 2688.27 → 2688.21. Lows: 2685.09 → 2686.74 → 2687.69 → 2686.91. The lows are being quietly raised, and the 2685 level has been tested repeatedly without breaking down.
The trading volume is even more interesting: in the last four hours, the total volume in the latter two hours is 31.55% less than in the first two hours. A pullback on lighter volume with no heavy selling pressure—this kind of structure often indicates buildup, not a breakdown.
The news also adds confidence. According to CoinDesk, the number of crypto job postings increased to more than 1,200 in September. Bitcoin, Ethereum, and Solana are the most commonly requested blockchain skills. Demand for talent in the Ethereum ecosystem is still there— the industry hasn’t cooled off.
My plan: as long as it doesn’t fall below 2680, I’ll stay bullish on the short term. The first upside target is the 2690 resistance area. If it breaks above 2690, there’s a good chance more room opens up. If it drops below 2680, the short-term bullish logic fails and I’ll step back.
Not investment advice—manage your position size yourself.
60
·
--
BTC rebound lacks volume; once 84,550 breaks, the selloff accelerates $BTC
On the 4-hour timeframe, BTC looks a bit shaky. It opened at 84,842 and closed at 84,754, down 0.1%. The high only touched 84,916— it didn’t even manage to reach the 84,950 resistance before dropping.
Looking at the recent 1-hour’s 15-minute candles: the four recent highs are 84,782, 84,818, 84,791, and 84,810, but the lows are trending lower: 84,760, 84,738, 84,738, and 84,708. The closing prices are also 84,760, 84,738, 84,778, and 84,753—up and down, churning for a while, but it just can’t break higher.
Most obvious is the volume. In the last four hours, the total traded volume in the last two hours is 168.92% higher than in the first two hours. Volume is expanding, yet the price doesn’t break out; instead, the highs keep getting lower. That doesn’t look like money is stepping in to push the price up—more like someone is distributing above 84,750.
84,750 is a key level. Price is currently grinding right around it. Below it, the support to watch is 84,550. If 84,750 can’t hold, 84,550 will very likely be tested. The short-term target is 84,550.
My view is straightforward: short-term bearish. Unless price reclaims and holds above 84,950, every rebound is an opportunity for the bears. If it holds 84,950, withdraw the bearish stance—don’t hold on hoping.
It’s not bashing BTC; it’s just that this volume-price action isn’t cooperating. For now, go with the trend and short, and only reassess once the signals change.
$BTC
BTC rebound lacks volume; once 84,550 breaks, the selloff accelerates $BTC
On the 4-hour timeframe, BTC looks a bit shaky. It opened at 84,842 and closed at 84,754, down 0.1%. The high only touched 84,916— it didn’t even manage to reach the 84,950 resistance before dropping.
Looking at the recent 1-hour’s 15-minute candles: the four recent highs are 84,782, 84,818, 84,791, and 84,810, but the lows are trending lower: 84,760, 84,738, 84,738, and 84,708. The closing prices are also 84,760, 84,738, 84,778, and 84,753—up and down, churning for a while, but it just can’t break higher.
Most obvious is the volume. In the last four hours, the total traded volume in the last two hours is 168.92% higher than in the first two hours. Volume is expanding, yet the price doesn’t break out; instead, the highs keep getting lower. That doesn’t look like money is stepping in to push the price up—more like someone is distributing above 84,750.
84,750 is a key level. Price is currently grinding right around it. Below it, the support to watch is 84,550. If 84,750 can’t hold, 84,550 will very likely be tested. The short-term target is 84,550.
My view is straightforward: short-term bearish. Unless price reclaims and holds above 84,950, every rebound is an opportunity for the bears. If it holds 84,950, withdraw the bearish stance—don’t hold on hoping.
It’s not bashing BTC; it’s just that this volume-price action isn’t cooperating. For now, go with the trend and short, and only reassess once the signals change.
$BTC
On the 4-hour timeframe, BTC looks a bit shaky. It opened at 84,842 and closed at 84,754, down 0.1%. The high only touched 84,916— it didn’t even manage to reach the 84,950 resistance before dropping.
Looking at the recent 1-hour’s 15-minute candles: the four recent highs are 84,782, 84,818, 84,791, and 84,810, but the lows are trending lower: 84,760, 84,738, 84,738, and 84,708. The closing prices are also 84,760, 84,738, 84,778, and 84,753—up and down, churning for a while, but it just can’t break higher.
Most obvious is the volume. In the last four hours, the total traded volume in the last two hours is 168.92% higher than in the first two hours. Volume is expanding, yet the price doesn’t break out; instead, the highs keep getting lower. That doesn’t look like money is stepping in to push the price up—more like someone is distributing above 84,750.
84,750 is a key level. Price is currently grinding right around it. Below it, the support to watch is 84,550. If 84,750 can’t hold, 84,550 will very likely be tested. The short-term target is 84,550.
My view is straightforward: short-term bearish. Unless price reclaims and holds above 84,950, every rebound is an opportunity for the bears. If it holds 84,950, withdraw the bearish stance—don’t hold on hoping.
It’s not bashing BTC; it’s just that this volume-price action isn’t cooperating. For now, go with the trend and short, and only reassess once the signals change.
$BTC
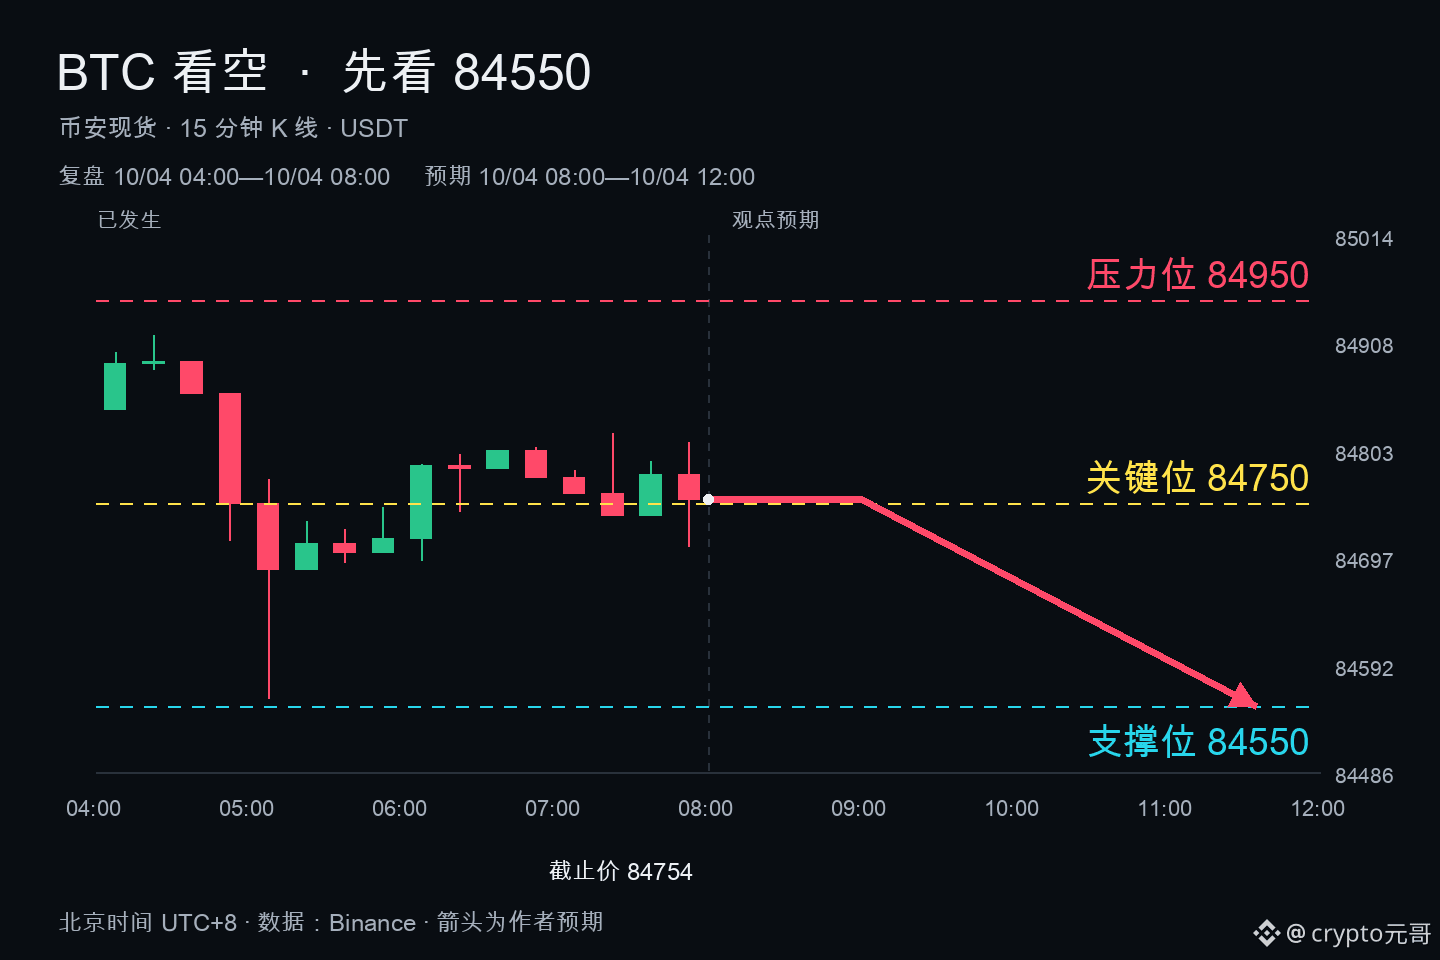
99
·
--
$VELODROME bottoming-out rebound +16%, volume expands, bulls need to counterattack
VELODROME today printed a beautiful bottoming-out rebound candle, with the intraday gain directly reaching +16.68%.
From the four-hour chart: it opened at 0.03639, closed at 0.03748, up 3%, and the high tapped 0.03778. More importantly, in the recent four hours, the trading volume in the last two hours is 16.62% higher than in the first two hours. Volume and price are in sync—this suggests real money is coming in, not a hollow pump.
Looking at the 15-minute chart: the past hour has been pretty stable. The highs have risen from 0.03736 to 0.03778, and the lows are also pushing higher. Around 0.0373, there’s consistent buying support. This step-by-step rise—slowly absorbing positions by the bid—is not a one-off “wave.”
My view is very straightforward: bullish.
Below, 0.03706 is the key level. For short-term support, watch 0.03633. As long as price doesn’t break 0.03633, the structure of this bottoming-out rebound remains intact. The upside target starts with 0.03778—the prior high. If it holds, there’s a high likelihood of further room upward.
This pattern of shrinking-volume selloff followed by a volume-expansion rally is often a signal that the short-term trend is strengthening. VELODROME has been compressed for a long time. Now that volume is coming back and sentiment is repairing, going long is much more comfortable than chasing shorts.
Of course, trading never guarantees wins. If it breaks below 0.03633, the long logic for the short term needs to be withdrawn. Cut your loss when necessary—don’t stubbornly hold.
In one sentence: bottoming-out rebound + volume expansion—I’m on the bulls’ side.
$VELODROME bottoming-out rebound +16%, volume expands, bulls need to counterattack
VELODROME today printed a beautiful bottoming-out rebound candle, with the intraday gain directly reaching +16.68%.
From the four-hour chart: it opened at 0.03639, closed at 0.03748, up 3%, and the high tapped 0.03778. More importantly, in the recent four hours, the trading volume in the last two hours is 16.62% higher than in the first two hours. Volume and price are in sync—this suggests real money is coming in, not a hollow pump.
Looking at the 15-minute chart: the past hour has been pretty stable. The highs have risen from 0.03736 to 0.03778, and the lows are also pushing higher. Around 0.0373, there’s consistent buying support. This step-by-step rise—slowly absorbing positions by the bid—is not a one-off “wave.”
My view is very straightforward: bullish.
Below, 0.03706 is the key level. For short-term support, watch 0.03633. As long as price doesn’t break 0.03633, the structure of this bottoming-out rebound remains intact. The upside target starts with 0.03778—the prior high. If it holds, there’s a high likelihood of further room upward.
This pattern of shrinking-volume selloff followed by a volume-expansion rally is often a signal that the short-term trend is strengthening. VELODROME has been compressed for a long time. Now that volume is coming back and sentiment is repairing, going long is much more comfortable than chasing shorts.
Of course, trading never guarantees wins. If it breaks below 0.03633, the long logic for the short term needs to be withdrawn. Cut your loss when necessary—don’t stubbornly hold.
In one sentence: bottoming-out rebound + volume expansion—I’m on the bulls’ side.
VELODROME today printed a beautiful bottoming-out rebound candle, with the intraday gain directly reaching +16.68%.
From the four-hour chart: it opened at 0.03639, closed at 0.03748, up 3%, and the high tapped 0.03778. More importantly, in the recent four hours, the trading volume in the last two hours is 16.62% higher than in the first two hours. Volume and price are in sync—this suggests real money is coming in, not a hollow pump.
Looking at the 15-minute chart: the past hour has been pretty stable. The highs have risen from 0.03736 to 0.03778, and the lows are also pushing higher. Around 0.0373, there’s consistent buying support. This step-by-step rise—slowly absorbing positions by the bid—is not a one-off “wave.”
My view is very straightforward: bullish.
Below, 0.03706 is the key level. For short-term support, watch 0.03633. As long as price doesn’t break 0.03633, the structure of this bottoming-out rebound remains intact. The upside target starts with 0.03778—the prior high. If it holds, there’s a high likelihood of further room upward.
This pattern of shrinking-volume selloff followed by a volume-expansion rally is often a signal that the short-term trend is strengthening. VELODROME has been compressed for a long time. Now that volume is coming back and sentiment is repairing, going long is much more comfortable than chasing shorts.
Of course, trading never guarantees wins. If it breaks below 0.03633, the long logic for the short term needs to be withdrawn. Cut your loss when necessary—don’t stubbornly hold.
In one sentence: bottoming-out rebound + volume expansion—I’m on the bulls’ side.
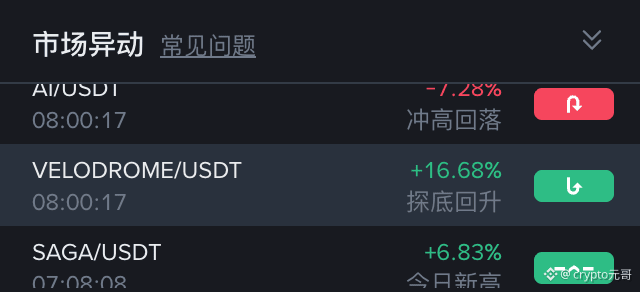
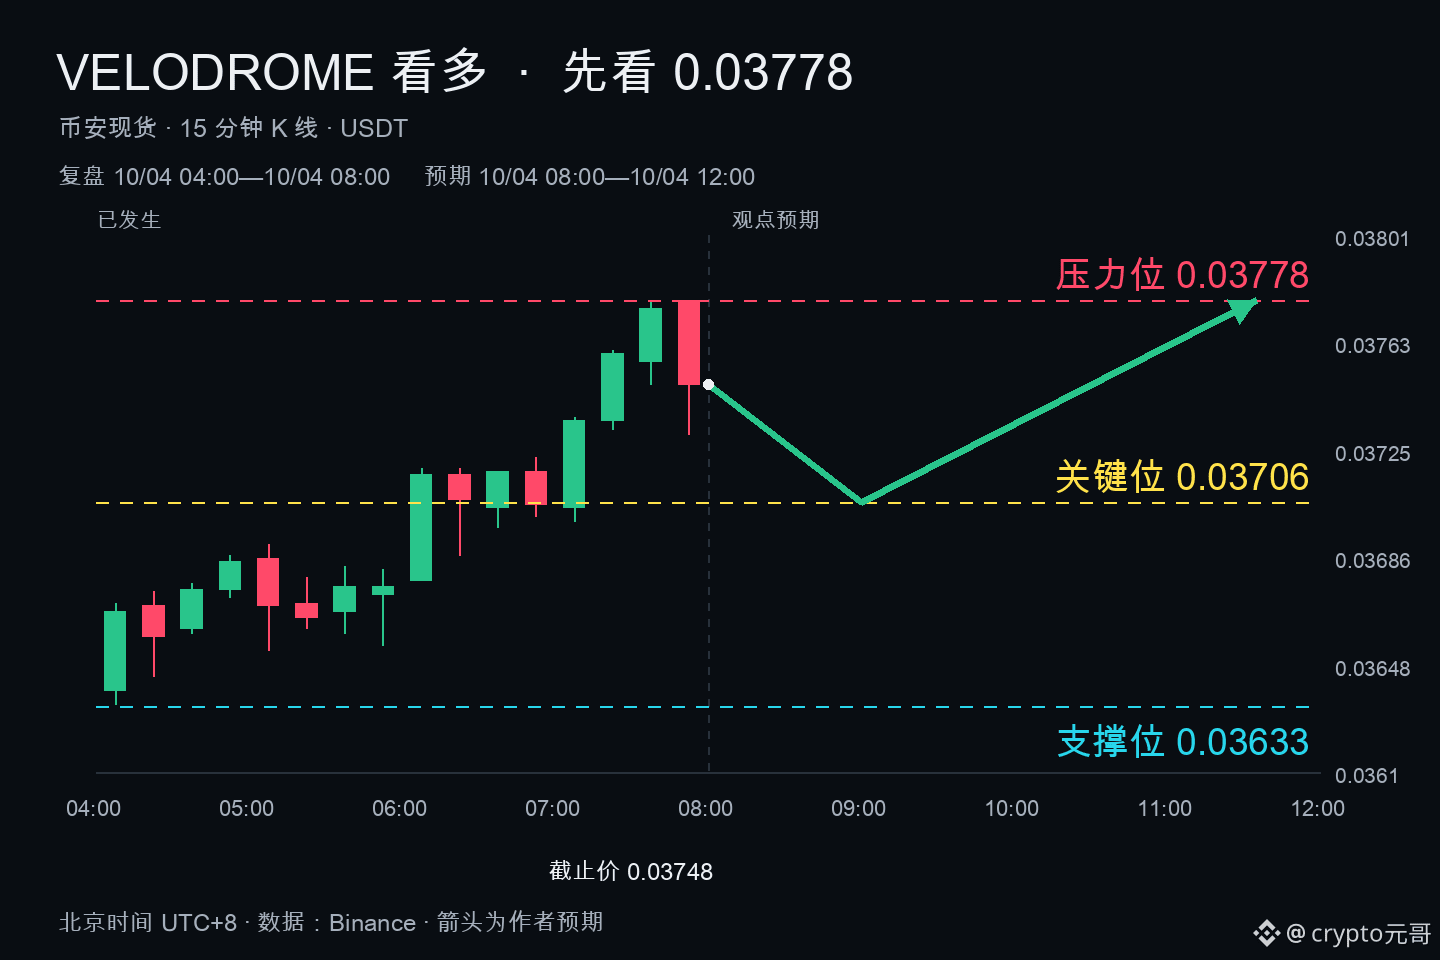
71
Log in to explore more content
Join global crypto users on Binance Square
⚡️ Get latest and useful information about crypto.
💬 Trusted by the world’s largest crypto exchange.
👍 Discover real insights from verified creators.
Email / Phone number
Trending Topics
BNBSurpasses$790
10,563 views
84 Discussing
$BNB strategic long plan -> FOCUS NOW
BNB has created 2 strong lows after taking out internal liquidity
I'm expecting a move towards swing high $815-$830 and looking for a long on a retest of the green box
#BNBSurpasses$790 #bnb
Ghost Writer
·4 Likes
·5.1k views
ZamaRises15.99%ToIntradayHigh$0.09
5,153 views
72 Discussing
BitcoinSpotETFsDraw$6.34BInflowsInQ3
3,679 views
60 Discussing