
Ubaidurrahman2025
276 Posts

Ubaidurrahman2025
Report
Block User
Open Trade
Occasional Trader
1.8 Years
553 Following
299 Followers
153 Liked
Posts
Portfolio
All
Quotes
Videos
Live
Article
Bitcoin next move Up...Buy call### Bitcoin: Is the next move UP? ₿
There may be a bullish case for Bitcoin, but I wouldn't call an upward move proven until price action confirms it.
To establish whether BTC is preparing for its next rally, we should look for multiple independent bullish catalysts, not just social-media predictions.
I'll assess five key areas:
* Institutional demand – Spot Bitcoin ETF inflows and large investors accumulating BTC.
* Federal Reserve policy – Interest-rate cuts, liquidity expansion and a weaker US dollar.
* Regulation – Government policies and institutional adoption.
* Supply dynamics – Exchange reserves, whale accumulation and long-term holder supply.
* Market structure – Breakouts, volume, support and resistance.
### 1\. News supporting a bullish Bitcoin move

Institutional ETF demand is substantial
Bullish evidence
According to 21Shares, US spot Bitcoin ETFs accumulated 79,800 BTC worth $6.2 billion in Q3 2026, almost twice the 41,300 BTC mined during that quarter.
Source: [21Shares – Bitcoin ETF inflows, November 2](https://www.21shares.com/en-us/insights/bitcoin-etf-inflows-q3-2026?utm_source=chatgpt.com).

BlackRock ETF buying
Bullish evidence
Coinbase Institutional reported that ETFs had become the primary source of Bitcoin demand since August, with approximately $6.4 billion of inflows versus $1.5 billion from corporate treasuries.
Source: [Coinbase Institutional – October 23](https://www.coinbase.com/de/institutional/research-insights/research/weekly-market-commentary/weekly-2026-10-23?utm_source=chatgpt.com).

Supply-demand imbalance
Potentially bullish
ETF purchases exceeded newly mined supply in Q3. If this demand continues, it can create upward price pressure.
Source: [21Shares supply and demand analysis](https://www.21shares.com/en-us/insights/bitcoin-etf-inflows-q3-2026?utm_source=chatgpt.com).
### 2\. But there are serious warning signals
We must not ignore negative news:
* November 8 – Reuters: Bitcoin fell more than 2% to approximately $73,708 amid political uncertainty and crypto-security concerns. Reuters
* November 5 – The Block: More than $1 billion in crypto liquidations occurred over 24 hours. Bitcoin fell approximately 6%. The Block
* October 23 – Coinbase: Rising inflation and expectations of a possible December Fed rate hike created macroeconomic headwinds. Coinbase Institutional Weekly Market Commentary
These are important because institutional buying alone does not guarantee an immediate rally.
### 3\. Bitcoin price levels to watch
Based on the latest reported market analysis:
| Price level | Significance |
| ------------------------- | ------------------------------- |
| $80,000 | Important bullish reclaim level |
| $75,000–73,000 | Major support area |
| Below $73,000 | Further downside risk |
| Above $80,000 and holding | Stronger bullish confirmation |
Coinbase identified $80K–82K as important support in October, while The Block reported that reclaiming $80K convincingly would improve the bullish outlook. Those levels need reassessment after the November selloff. Coinbase Institutional Weekly Market Commentary +1
### 4\. My verdict
### Long-term bullish case remains
Short-term direction: Not confirmed
Reasons to be optimistic:
* Strong Q3 ETF accumulation.
* Institutional demand remains an important source of buying.
* ETF purchases exceeded newly mined supply.
Reasons for caution:
* Recent market selloff.
* Regulatory uncertainty.
* Fed rate-hike concerns.
* Risk of further liquidations.
My conclusion: Bitcoin has fundamental reasons to recover, but the latest news does not prove that its next immediate move will be upward. I would look for renewed ETF inflows, improving market liquidity and a sustained price reclaim before treating a rally as confirmed.
### 5\. Let's track the next Bitcoin move
I can monitor daily news, ETF flows, whale activity, macroeconomic developments and technical breakout signals.
Would you like a daily Bitcoin bullish/bearish report?
₿
Daily Bitcoin market intelligence
Tap to set up
#CPITestsDecemberRateOutlook #NvidiaInvestigatesAfterHuang’sAffairApology #US-IranTalksFuelStrongStockMarketRebound #BitcoinFiveWeeklyLosses #CryptoLiquidationsReach$1.16BIn24Hours $BTC
{spot}(BTCUSDT)
Bitcoin next move Up...Buy call
### Bitcoin: Is the next move UP? ₿
There may be a bullish case for Bitcoin, but I wouldn't call an upward move proven until price action confirms it.
To establish whether BTC is preparing for its next rally, we should look for multiple independent bullish catalysts, not just social-media predictions.
I'll assess five key areas:
* Institutional demand – Spot Bitcoin ETF inflows and large investors accumulating BTC.
* Federal Reserve policy – Interest-rate cuts, liquidity expansion and a weaker US dollar.
* Regulation – Government policies and institutional adoption.
* Supply dynamics – Exchange reserves, whale accumulation and long-term holder supply.
* Market structure – Breakouts, volume, support and resistance.
### 1\. News supporting a bullish Bitcoin move

Institutional ETF demand is substantial
Bullish evidence
According to 21Shares, US spot Bitcoin ETFs accumulated 79,800 BTC worth $6.2 billion in Q3 2026, almost twice the 41,300 BTC mined during that quarter.
Source: [21Shares – Bitcoin ETF inflows, November 2](https://www.21shares.com/en-us/insights/bitcoin-etf-inflows-q3-2026?utm_source=chatgpt.com).

BlackRock ETF buying
Bullish evidence
Coinbase Institutional reported that ETFs had become the primary source of Bitcoin demand since August, with approximately $6.4 billion of inflows versus $1.5 billion from corporate treasuries.
Source: [Coinbase Institutional – October 23](https://www.coinbase.com/de/institutional/research-insights/research/weekly-market-commentary/weekly-2026-10-23?utm_source=chatgpt.com).

Supply-demand imbalance
Potentially bullish
ETF purchases exceeded newly mined supply in Q3. If this demand continues, it can create upward price pressure.
Source: [21Shares supply and demand analysis](https://www.21shares.com/en-us/insights/bitcoin-etf-inflows-q3-2026?utm_source=chatgpt.com).
### 2\. But there are serious warning signals
We must not ignore negative news:
* November 8 – Reuters: Bitcoin fell more than 2% to approximately $73,708 amid political uncertainty and crypto-security concerns. Reuters
* November 5 – The Block: More than $1 billion in crypto liquidations occurred over 24 hours. Bitcoin fell approximately 6%. The Block
* October 23 – Coinbase: Rising inflation and expectations of a possible December Fed rate hike created macroeconomic headwinds. Coinbase Institutional Weekly Market Commentary
These are important because institutional buying alone does not guarantee an immediate rally.
### 3\. Bitcoin price levels to watch
Based on the latest reported market analysis:
| Price level | Significance |
| ------------------------- | ------------------------------- |
| $80,000 | Important bullish reclaim level |
| $75,000–73,000 | Major support area |
| Below $73,000 | Further downside risk |
| Above $80,000 and holding | Stronger bullish confirmation |
Coinbase identified $80K–82K as important support in October, while The Block reported that reclaiming $80K convincingly would improve the bullish outlook. Those levels need reassessment after the November selloff. Coinbase Institutional Weekly Market Commentary +1
### 4\. My verdict
### Long-term bullish case remains
Short-term direction: Not confirmed
Reasons to be optimistic:
* Strong Q3 ETF accumulation.
* Institutional demand remains an important source of buying.
* ETF purchases exceeded newly mined supply.
Reasons for caution:
* Recent market selloff.
* Regulatory uncertainty.
* Fed rate-hike concerns.
* Risk of further liquidations.
My conclusion: Bitcoin has fundamental reasons to recover, but the latest news does not prove that its next immediate move will be upward. I would look for renewed ETF inflows, improving market liquidity and a sustained price reclaim before treating a rally as confirmed.
### 5\. Let's track the next Bitcoin move
I can monitor daily news, ETF flows, whale activity, macroeconomic developments and technical breakout signals.
Would you like a daily Bitcoin bullish/bearish report?
₿
Daily Bitcoin market intelligence
Tap to set up
#CPITestsDecemberRateOutlook #NvidiaInvestigatesAfterHuang’sAffairApology #US-IranTalksFuelStrongStockMarketRebound #BitcoinFiveWeeklyLosses #CryptoLiquidationsReach$1.16BIn24Hours $BTC
There may be a bullish case for Bitcoin, but I wouldn't call an upward move proven until price action confirms it.
To establish whether BTC is preparing for its next rally, we should look for multiple independent bullish catalysts, not just social-media predictions.
I'll assess five key areas:
* Institutional demand – Spot Bitcoin ETF inflows and large investors accumulating BTC.
* Federal Reserve policy – Interest-rate cuts, liquidity expansion and a weaker US dollar.
* Regulation – Government policies and institutional adoption.
* Supply dynamics – Exchange reserves, whale accumulation and long-term holder supply.
* Market structure – Breakouts, volume, support and resistance.
### 1\. News supporting a bullish Bitcoin move

Institutional ETF demand is substantial
Bullish evidence
According to 21Shares, US spot Bitcoin ETFs accumulated 79,800 BTC worth $6.2 billion in Q3 2026, almost twice the 41,300 BTC mined during that quarter.
Source: [21Shares – Bitcoin ETF inflows, November 2](https://www.21shares.com/en-us/insights/bitcoin-etf-inflows-q3-2026?utm_source=chatgpt.com).

BlackRock ETF buying
Bullish evidence
Coinbase Institutional reported that ETFs had become the primary source of Bitcoin demand since August, with approximately $6.4 billion of inflows versus $1.5 billion from corporate treasuries.
Source: [Coinbase Institutional – October 23](https://www.coinbase.com/de/institutional/research-insights/research/weekly-market-commentary/weekly-2026-10-23?utm_source=chatgpt.com).

Supply-demand imbalance
Potentially bullish
ETF purchases exceeded newly mined supply in Q3. If this demand continues, it can create upward price pressure.
Source: [21Shares supply and demand analysis](https://www.21shares.com/en-us/insights/bitcoin-etf-inflows-q3-2026?utm_source=chatgpt.com).
### 2\. But there are serious warning signals
We must not ignore negative news:
* November 8 – Reuters: Bitcoin fell more than 2% to approximately $73,708 amid political uncertainty and crypto-security concerns. Reuters
* November 5 – The Block: More than $1 billion in crypto liquidations occurred over 24 hours. Bitcoin fell approximately 6%. The Block
* October 23 – Coinbase: Rising inflation and expectations of a possible December Fed rate hike created macroeconomic headwinds. Coinbase Institutional Weekly Market Commentary
These are important because institutional buying alone does not guarantee an immediate rally.
### 3\. Bitcoin price levels to watch
Based on the latest reported market analysis:
| Price level | Significance |
| ------------------------- | ------------------------------- |
| $80,000 | Important bullish reclaim level |
| $75,000–73,000 | Major support area |
| Below $73,000 | Further downside risk |
| Above $80,000 and holding | Stronger bullish confirmation |
Coinbase identified $80K–82K as important support in October, while The Block reported that reclaiming $80K convincingly would improve the bullish outlook. Those levels need reassessment after the November selloff. Coinbase Institutional Weekly Market Commentary +1
### 4\. My verdict
### Long-term bullish case remains
Short-term direction: Not confirmed
Reasons to be optimistic:
* Strong Q3 ETF accumulation.
* Institutional demand remains an important source of buying.
* ETF purchases exceeded newly mined supply.
Reasons for caution:
* Recent market selloff.
* Regulatory uncertainty.
* Fed rate-hike concerns.
* Risk of further liquidations.
My conclusion: Bitcoin has fundamental reasons to recover, but the latest news does not prove that its next immediate move will be upward. I would look for renewed ETF inflows, improving market liquidity and a sustained price reclaim before treating a rally as confirmed.
### 5\. Let's track the next Bitcoin move
I can monitor daily news, ETF flows, whale activity, macroeconomic developments and technical breakout signals.
Would you like a daily Bitcoin bullish/bearish report?
₿
Daily Bitcoin market intelligence
Tap to set up
#CPITestsDecemberRateOutlook #NvidiaInvestigatesAfterHuang’sAffairApology #US-IranTalksFuelStrongStockMarketRebound #BitcoinFiveWeeklyLosses #CryptoLiquidationsReach$1.16BIn24Hours $BTC
1
97
·
--
Bullish
### Bitcoin: Is the next move UP? ₿
There may be a bullish case for Bitcoin, but I wouldn't call an upward move proven until price action confirms it.
To establish whether BTC is preparing for its next rally, we should look for multiple independent bullish catalysts, not just social-media predictions.
I'll assess five key areas:
* Institutional demand – Spot Bitcoin ETF inflows and large investors accumulating BTC.
* Federal Reserve policy – Interest-rate cuts, liquidity expansion and a weaker US dollar.
* Regulation – Government policies and institutional adoption.
* Supply dynamics – Exchange reserves, whale accumulation and long-term holder supply.
* Market structure – Breakouts, volume, support and resistance.
#CPITestsDecemberRateOutlook #NvidiaInvestigatesAfterHuang’sAffairApology #US-IranTalksFuelStrongStockMarketRebound #AIChipSlumpNasdaq #AIChipSlumpNasdaq $BTC
### Bitcoin: Is the next move UP? ₿
There may be a bullish case for Bitcoin, but I wouldn't call an upward move proven until price action confirms it.
To establish whether BTC is preparing for its next rally, we should look for multiple independent bullish catalysts, not just social-media predictions.
I'll assess five key areas:
* Institutional demand – Spot Bitcoin ETF inflows and large investors accumulating BTC.
* Federal Reserve policy – Interest-rate cuts, liquidity expansion and a weaker US dollar.
* Regulation – Government policies and institutional adoption.
* Supply dynamics – Exchange reserves, whale accumulation and long-term holder supply.
* Market structure – Breakouts, volume, support and resistance.
#CPITestsDecemberRateOutlook #NvidiaInvestigatesAfterHuang’sAffairApology #US-IranTalksFuelStrongStockMarketRebound #AIChipSlumpNasdaq #AIChipSlumpNasdaq $BTC
There may be a bullish case for Bitcoin, but I wouldn't call an upward move proven until price action confirms it.
To establish whether BTC is preparing for its next rally, we should look for multiple independent bullish catalysts, not just social-media predictions.
I'll assess five key areas:
* Institutional demand – Spot Bitcoin ETF inflows and large investors accumulating BTC.
* Federal Reserve policy – Interest-rate cuts, liquidity expansion and a weaker US dollar.
* Regulation – Government policies and institutional adoption.
* Supply dynamics – Exchange reserves, whale accumulation and long-term holder supply.
* Market structure – Breakouts, volume, support and resistance.
#CPITestsDecemberRateOutlook #NvidiaInvestigatesAfterHuang’sAffairApology #US-IranTalksFuelStrongStockMarketRebound #AIChipSlumpNasdaq #AIChipSlumpNasdaq $BTC
79
·
--
Bullish
USDT bot
earn Daily 5$
https://t.me/Riward_trusttbot?start=8311109628
#KalshiOrderedToSuspendWashingtonOperations #ProCapFilesBitcoinTreasuryDiscountETF #OilEdgesHigher #SP500SlipsFridayThirdStraightWeeklyGain #UkraineSaysOdesaBlackSeaPortsEffectivelyClosed $AAPL.US
USDT bot
earn Daily 5$
https://t.me/Riward_trusttbot?start=8311109628
#KalshiOrderedToSuspendWashingtonOperations #ProCapFilesBitcoinTreasuryDiscountETF #OilEdgesHigher #SP500SlipsFridayThirdStraightWeeklyGain #UkraineSaysOdesaBlackSeaPortsEffectivelyClosed $AAPL.US
earn Daily 5$
https://t.me/Riward_trusttbot?start=8311109628
#KalshiOrderedToSuspendWashingtonOperations #ProCapFilesBitcoinTreasuryDiscountETF #OilEdgesHigher #SP500SlipsFridayThirdStraightWeeklyGain #UkraineSaysOdesaBlackSeaPortsEffectivelyClosed $AAPL.US
AAPLUS-0.73%
32

Article
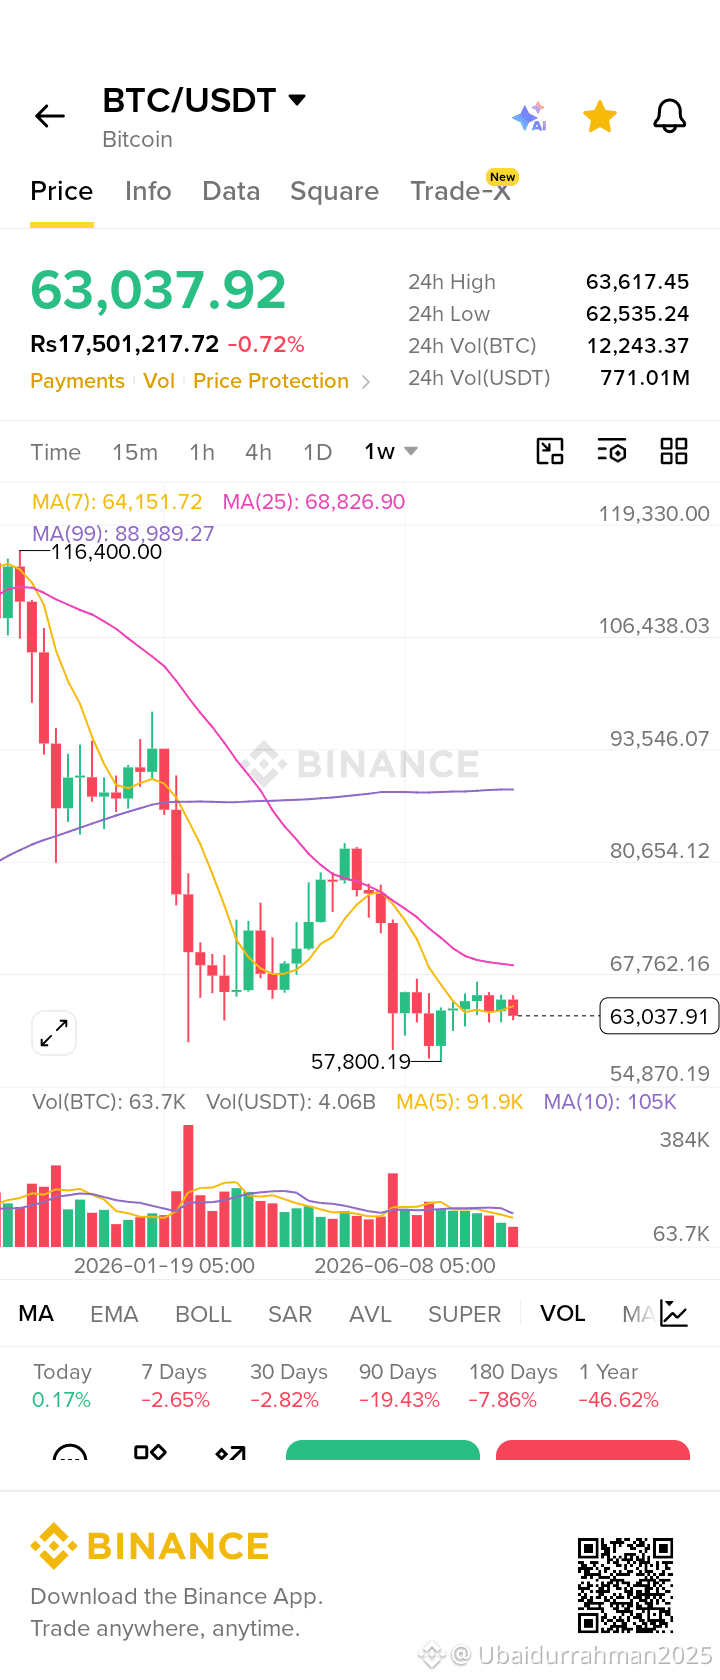
BTC Next MoveBased on your 1-week BTC/USDT chart, the setup is currently neutral-to-bearish, but BTC is sitting near an important support zone.
📊 My 1-week outlook
Current: ~$63,038
Major support: $62,000–$62,500
Strong support: $57,800–$58,000
First resistance: $64,150–$65,000 — around your 7-week MA
Major resistance: $67,700–$69,000 — near the 25-week MA
Bullish confirmation: weekly close above $65K, preferably followed by $68–69K.
Bearish confirmation: daily/weekly break below $62K.
The broader current market also has BTC around the low-$63K area, with $62K repeatedly identified as an important support zone.
🔮 My scenario for the next 7 days
Most likely: ↔️ $61,500–$66,000 consolidation
Bullish scenario:
If BTC holds $62K and breaks $65K, I would watch:
$66.5K → $68K → $70K
Bearish scenario:
If $62K breaks with strong volume, the next likely targets are:
$60K → $58K → $55K–$56K
🎯 My bias
~55% bearish/sideways, ~45% bullish for the coming week.
I would not chase a Buy at $63K based on this weekly chart alone. The cleaner signal is either a confirmed reclaim of $65K+ or a clear reaction from $62K/$58K.
This is a technical scenario, not a guaranteed prediction—BTC can move sharply against the setup.
#SP500SlipsFridayThirdStraightWeeklyGain #AnthropicIPOMeetingsSkipFinancialsValuation #ProCapFilesBitcoinTreasuryDiscountETF #US30YBondAuctionYieldHighestSince2001
BTC Next Move
Based on your 1-week BTC/USDT chart, the setup is currently neutral-to-bearish, but BTC is sitting near an important support zone.
📊 My 1-week outlook
Current: ~$63,038
Major support: $62,000–$62,500
Strong support: $57,800–$58,000
First resistance: $64,150–$65,000 — around your 7-week MA
Major resistance: $67,700–$69,000 — near the 25-week MA
Bullish confirmation: weekly close above $65K, preferably followed by $68–69K.
Bearish confirmation: daily/weekly break below $62K.
The broader current market also has BTC around the low-$63K area, with $62K repeatedly identified as an important support zone.
🔮 My scenario for the next 7 days
Most likely: ↔️ $61,500–$66,000 consolidation
Bullish scenario:
If BTC holds $62K and breaks $65K, I would watch:
$66.5K → $68K → $70K
Bearish scenario:
If $62K breaks with strong volume, the next likely targets are:
$60K → $58K → $55K–$56K
🎯 My bias
~55% bearish/sideways, ~45% bullish for the coming week.
I would not chase a Buy at $63K based on this weekly chart alone. The cleaner signal is either a confirmed reclaim of $65K+ or a clear reaction from $62K/$58K.
This is a technical scenario, not a guaranteed prediction—BTC can move sharply against the setup.
#SP500SlipsFridayThirdStraightWeeklyGain #AnthropicIPOMeetingsSkipFinancialsValuation #ProCapFilesBitcoinTreasuryDiscountETF #US30YBondAuctionYieldHighestSince2001
📊 My 1-week outlook
Current: ~$63,038
Major support: $62,000–$62,500
Strong support: $57,800–$58,000
First resistance: $64,150–$65,000 — around your 7-week MA
Major resistance: $67,700–$69,000 — near the 25-week MA
Bullish confirmation: weekly close above $65K, preferably followed by $68–69K.
Bearish confirmation: daily/weekly break below $62K.
The broader current market also has BTC around the low-$63K area, with $62K repeatedly identified as an important support zone.
🔮 My scenario for the next 7 days
Most likely: ↔️ $61,500–$66,000 consolidation
Bullish scenario:
If BTC holds $62K and breaks $65K, I would watch:
$66.5K → $68K → $70K
Bearish scenario:
If $62K breaks with strong volume, the next likely targets are:
$60K → $58K → $55K–$56K
🎯 My bias
~55% bearish/sideways, ~45% bullish for the coming week.
I would not chase a Buy at $63K based on this weekly chart alone. The cleaner signal is either a confirmed reclaim of $65K+ or a clear reaction from $62K/$58K.
This is a technical scenario, not a guaranteed prediction—BTC can move sharply against the setup.
#SP500SlipsFridayThirdStraightWeeklyGain #AnthropicIPOMeetingsSkipFinancialsValuation #ProCapFilesBitcoinTreasuryDiscountETF #US30YBondAuctionYieldHighestSince2001
1
92
BTC next Move
Based on your 1-week BTC/USDT chart, the setup is currently neutral-to-bearish, but BTC is sitting near an important support zone.
📊 My 1-week outlook
Current: ~$63,038
Major support: $62,000–$62,500
Strong support: $57,800–$58,000
First resistance: $64,150–$65,000 — around your 7-week MA
Major resistance: $67,700–$69,000 — near the 25-week MA
Bullish confirmation: weekly close above $65K, preferably followed by $68–69K.
Bearish confirmation: daily/weekly break below $62K.
The broader current market also has BTC around the low-$63K area, with $62K repeatedly identified as an important support zone.
🔮 My scenario for the next 7 days
Most likely: ↔️ $61,500–$66,000 consolidation
Bullish scenario:
If BTC holds $62K and breaks $65K, I would watch: $66.5K → $68K → $70K
Bearish scenario:
If $62K breaks with strong volume, the next likely targets are: $60K → $58K → $55K–$56K
🎯 My bias
~55% bearish/sideways, ~45% bullish for the coming week.
I would not chase a Buy at $63K based on this weekly chart alone. The cleaner signal is either a confirmed reclaim of $65K+ or a clear reaction from $62K/$58K.
This is a technical scenario, not a guaranteed prediction—BTC can move sharply against the setup.
BTC next Move
Based on your 1-week BTC/USDT chart, the setup is currently neutral-to-bearish, but BTC is sitting near an important support zone.
📊 My 1-week outlook
Current: ~$63,038
Major support: $62,000–$62,500
Strong support: $57,800–$58,000
First resistance: $64,150–$65,000 — around your 7-week MA
Major resistance: $67,700–$69,000 — near the 25-week MA
Bullish confirmation: weekly close above $65K, preferably followed by $68–69K.
Bearish confirmation: daily/weekly break below $62K.
The broader current market also has BTC around the low-$63K area, with $62K repeatedly identified as an important support zone.
🔮 My scenario for the next 7 days
Most likely: ↔️ $61,500–$66,000 consolidation
Bullish scenario:
If BTC holds $62K and breaks $65K, I would watch: $66.5K → $68K → $70K
Bearish scenario:
If $62K breaks with strong volume, the next likely targets are: $60K → $58K → $55K–$56K
🎯 My bias
~55% bearish/sideways, ~45% bullish for the coming week.
I would not chase a Buy at $63K based on this weekly chart alone. The cleaner signal is either a confirmed reclaim of $65K+ or a clear reaction from $62K/$58K.
This is a technical scenario, not a guaranteed prediction—BTC can move sharply against the setup.
Based on your 1-week BTC/USDT chart, the setup is currently neutral-to-bearish, but BTC is sitting near an important support zone.
📊 My 1-week outlook
Current: ~$63,038
Major support: $62,000–$62,500
Strong support: $57,800–$58,000
First resistance: $64,150–$65,000 — around your 7-week MA
Major resistance: $67,700–$69,000 — near the 25-week MA
Bullish confirmation: weekly close above $65K, preferably followed by $68–69K.
Bearish confirmation: daily/weekly break below $62K.
The broader current market also has BTC around the low-$63K area, with $62K repeatedly identified as an important support zone.
🔮 My scenario for the next 7 days
Most likely: ↔️ $61,500–$66,000 consolidation
Bullish scenario:
If BTC holds $62K and breaks $65K, I would watch: $66.5K → $68K → $70K
Bearish scenario:
If $62K breaks with strong volume, the next likely targets are: $60K → $58K → $55K–$56K
🎯 My bias
~55% bearish/sideways, ~45% bullish for the coming week.
I would not chase a Buy at $63K based on this weekly chart alone. The cleaner signal is either a confirmed reclaim of $65K+ or a clear reaction from $62K/$58K.
This is a technical scenario, not a guaranteed prediction—BTC can move sharply against the setup.
118
https://www.binance.com/download?utm_medium=screenshot
XRP
Disclaimer: I am an AI, not a financial advisor. Crypto markets are highly volatile. This is a technical probability forecast, not trading advice.
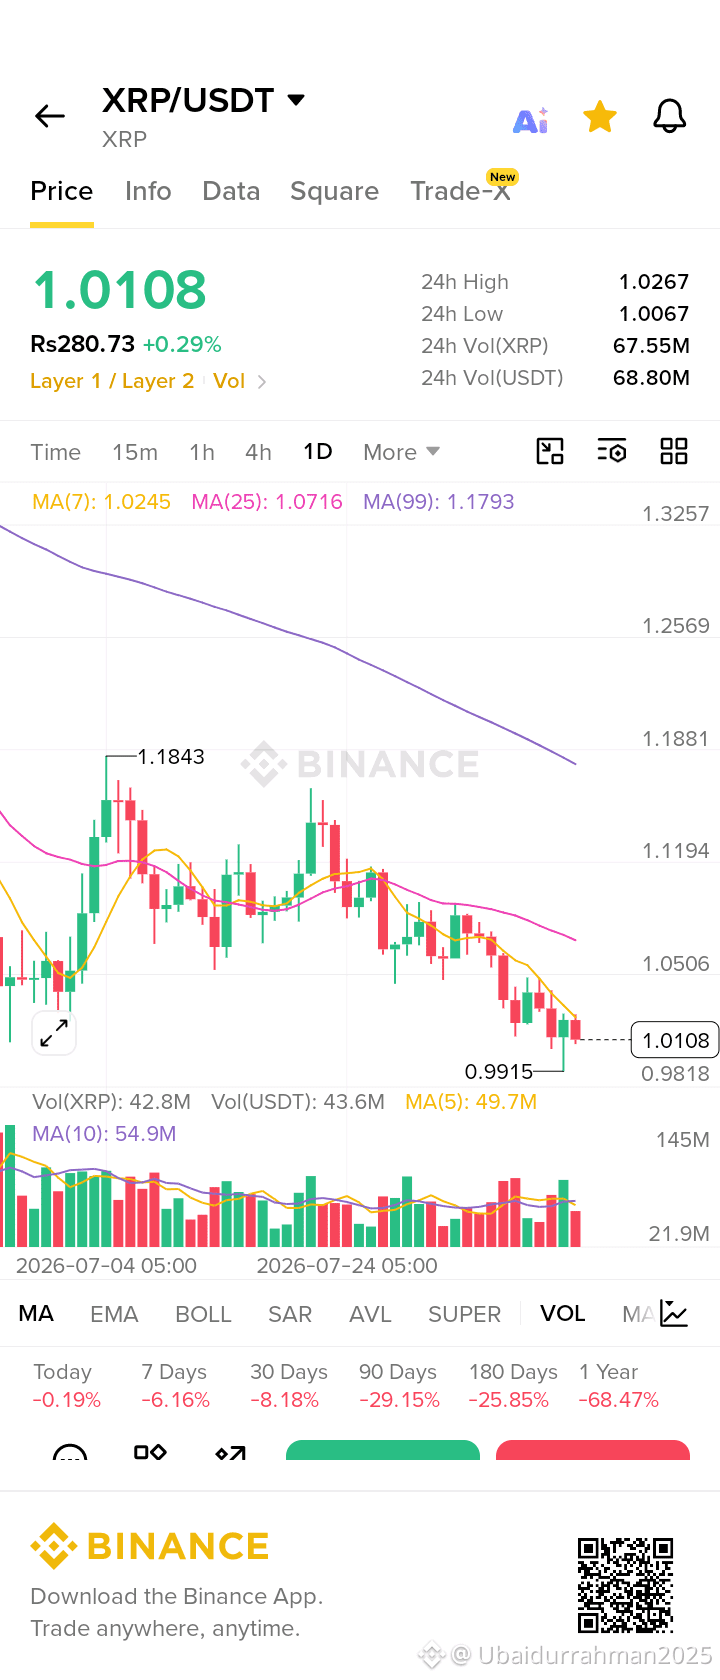
Based on your screenshot (taken at 21:35), here is the 10-hour forecast (until ~07:35 AM UTC+5, Aug 13, 2026).
Current Technical Snapshot (Bearish):
· Structure: Price ($1.0108) is below all major MAs (7, 25, 99). The bearish alignment is intact.
· Volume: Current volume (42.8M) is below MA(5) at 49.7M, indicating weak buying interest—bounces are likely to be shallow.
· Momentum: Squeezed between the 24h Low (1.0067) and MA7 (1.0245).
Key Levels for the next 10h:
· Resistance: 1.0245 (MA7) → 1.0267 (24H High).
· Support: 1.0067 (24H Low) → 1.0000 (Psychological) → 0.9915 (Recent chart low).
---
10-Hour Price Prediction (Scenarios)
Base Case (45% probability) – Range-Bound Consolidation:
Price holds the 1.0067 support but struggles to break MA7. Expect a sideways drift between $1.008 – $1.022 with low volatility.
Predicted close: ~$1.014.
Bearish Case (35% probability) – Breakdown:
The 24h low gets retested and breaks due to thin overnight liquidity. Stop-losses trigger a flush down to the psychological $1.0000 handle, possibly touching **$0.995 – $1.002**.
*Predicted close: ~$1.002.*
Bullish Case (20% probability) – Fakeout Bounce:
A short-squeeze pushes price above MA7 ($1.0245). However, with volume below average, it will likely get rejected at the 24H high ($1.0267) or MA25 ($1.0716) far above.
*Predicted close: ~$1.025 (rejection wick).*
---
Summary Forecast for the next 10 hours:
Most probable trading range: $1.002 – $1.025.
Given the strong bearish 90-day (-29%) and 1Y (-68%) performance, downside risk outweighs upside potential in this timeframe. Watch the $1.0067 level closely—if it breaks with increasing volume, expect a quick drop to $1.00 or lower within 2–3 hours.
https://www.binance.com/download?utm_medium=screenshot
XRP
Disclaimer: I am an AI, not a financial advisor. Crypto markets are highly volatile. This is a technical probability forecast, not trading advice.
Based on your screenshot (taken at 21:35), here is the 10-hour forecast (until ~07:35 AM UTC+5, Aug 13, 2026).
Current Technical Snapshot (Bearish):
· Structure: Price ($1.0108) is below all major MAs (7, 25, 99). The bearish alignment is intact.
· Volume: Current volume (42.8M) is below MA(5) at 49.7M, indicating weak buying interest—bounces are likely to be shallow.
· Momentum: Squeezed between the 24h Low (1.0067) and MA7 (1.0245).
Key Levels for the next 10h:
· Resistance: 1.0245 (MA7) → 1.0267 (24H High).
· Support: 1.0067 (24H Low) → 1.0000 (Psychological) → 0.9915 (Recent chart low).
---
10-Hour Price Prediction (Scenarios)
Base Case (45% probability) – Range-Bound Consolidation:
Price holds the 1.0067 support but struggles to break MA7. Expect a sideways drift between $1.008 – $1.022 with low volatility.
Predicted close: ~$1.014.
Bearish Case (35% probability) – Breakdown:
The 24h low gets retested and breaks due to thin overnight liquidity. Stop-losses trigger a flush down to the psychological $1.0000 handle, possibly touching **$0.995 – $1.002**.
*Predicted close: ~$1.002.*
Bullish Case (20% probability) – Fakeout Bounce:
A short-squeeze pushes price above MA7 ($1.0245). However, with volume below average, it will likely get rejected at the 24H high ($1.0267) or MA25 ($1.0716) far above.
*Predicted close: ~$1.025 (rejection wick).*
---
Summary Forecast for the next 10 hours:
Most probable trading range: $1.002 – $1.025.
Given the strong bearish 90-day (-29%) and 1Y (-68%) performance, downside risk outweighs upside potential in this timeframe. Watch the $1.0067 level closely—if it breaks with increasing volume, expect a quick drop to $1.00 or lower within 2–3 hours.
XRP
Disclaimer: I am an AI, not a financial advisor. Crypto markets are highly volatile. This is a technical probability forecast, not trading advice.
Based on your screenshot (taken at 21:35), here is the 10-hour forecast (until ~07:35 AM UTC+5, Aug 13, 2026).
Current Technical Snapshot (Bearish):
· Structure: Price ($1.0108) is below all major MAs (7, 25, 99). The bearish alignment is intact.
· Volume: Current volume (42.8M) is below MA(5) at 49.7M, indicating weak buying interest—bounces are likely to be shallow.
· Momentum: Squeezed between the 24h Low (1.0067) and MA7 (1.0245).
Key Levels for the next 10h:
· Resistance: 1.0245 (MA7) → 1.0267 (24H High).
· Support: 1.0067 (24H Low) → 1.0000 (Psychological) → 0.9915 (Recent chart low).
---
10-Hour Price Prediction (Scenarios)
Base Case (45% probability) – Range-Bound Consolidation:
Price holds the 1.0067 support but struggles to break MA7. Expect a sideways drift between $1.008 – $1.022 with low volatility.
Predicted close: ~$1.014.
Bearish Case (35% probability) – Breakdown:
The 24h low gets retested and breaks due to thin overnight liquidity. Stop-losses trigger a flush down to the psychological $1.0000 handle, possibly touching **$0.995 – $1.002**.
*Predicted close: ~$1.002.*
Bullish Case (20% probability) – Fakeout Bounce:
A short-squeeze pushes price above MA7 ($1.0245). However, with volume below average, it will likely get rejected at the 24H high ($1.0267) or MA25 ($1.0716) far above.
*Predicted close: ~$1.025 (rejection wick).*
---
Summary Forecast for the next 10 hours:
Most probable trading range: $1.002 – $1.025.
Given the strong bearish 90-day (-29%) and 1Y (-68%) performance, downside risk outweighs upside potential in this timeframe. Watch the $1.0067 level closely—if it breaks with increasing volume, expect a quick drop to $1.00 or lower within 2–3 hours.
41
·
--
Bearish
https://www.binance.com/download?utm_medium=screenshot
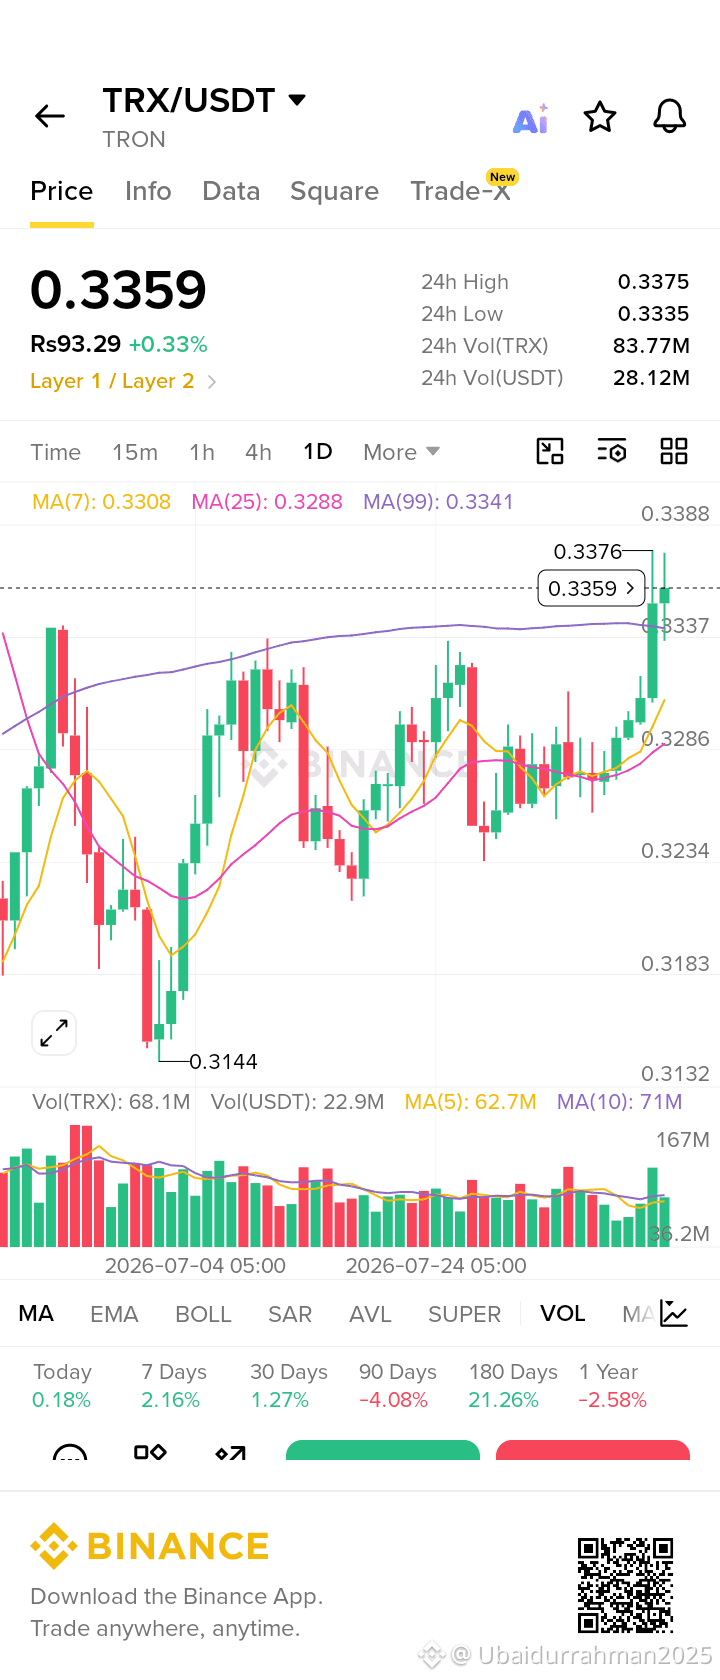
One Day Pattern:
Consolidating above MA99 (0.3341) after bouncing from 0.3268. Bullish bias with price holding key MAs, but facing strong resistance at the 24h high (0.3375) and MA peak (0.3376).
Next 10h: Up – likely to test 0.3375–0.3388. However, rejection there could pull it back to 0.3340. Bias is mildly bullish unless it breaks below 0.3340.
https://www.binance.com/download?utm_medium=screenshot
One Day Pattern:
Consolidating above MA99 (0.3341) after bouncing from 0.3268. Bullish bias with price holding key MAs, but facing strong resistance at the 24h high (0.3375) and MA peak (0.3376).
Next 10h: Up – likely to test 0.3375–0.3388. However, rejection there could pull it back to 0.3340. Bias is mildly bullish unless it breaks below 0.3340.
One Day Pattern:
Consolidating above MA99 (0.3341) after bouncing from 0.3268. Bullish bias with price holding key MAs, but facing strong resistance at the 24h high (0.3375) and MA peak (0.3376).
Next 10h: Up – likely to test 0.3375–0.3388. However, rejection there could pull it back to 0.3340. Bias is mildly bullish unless it breaks below 0.3340.
13
·
--
Bearish
https://www.binance.com/download?utm_medium=screenshot
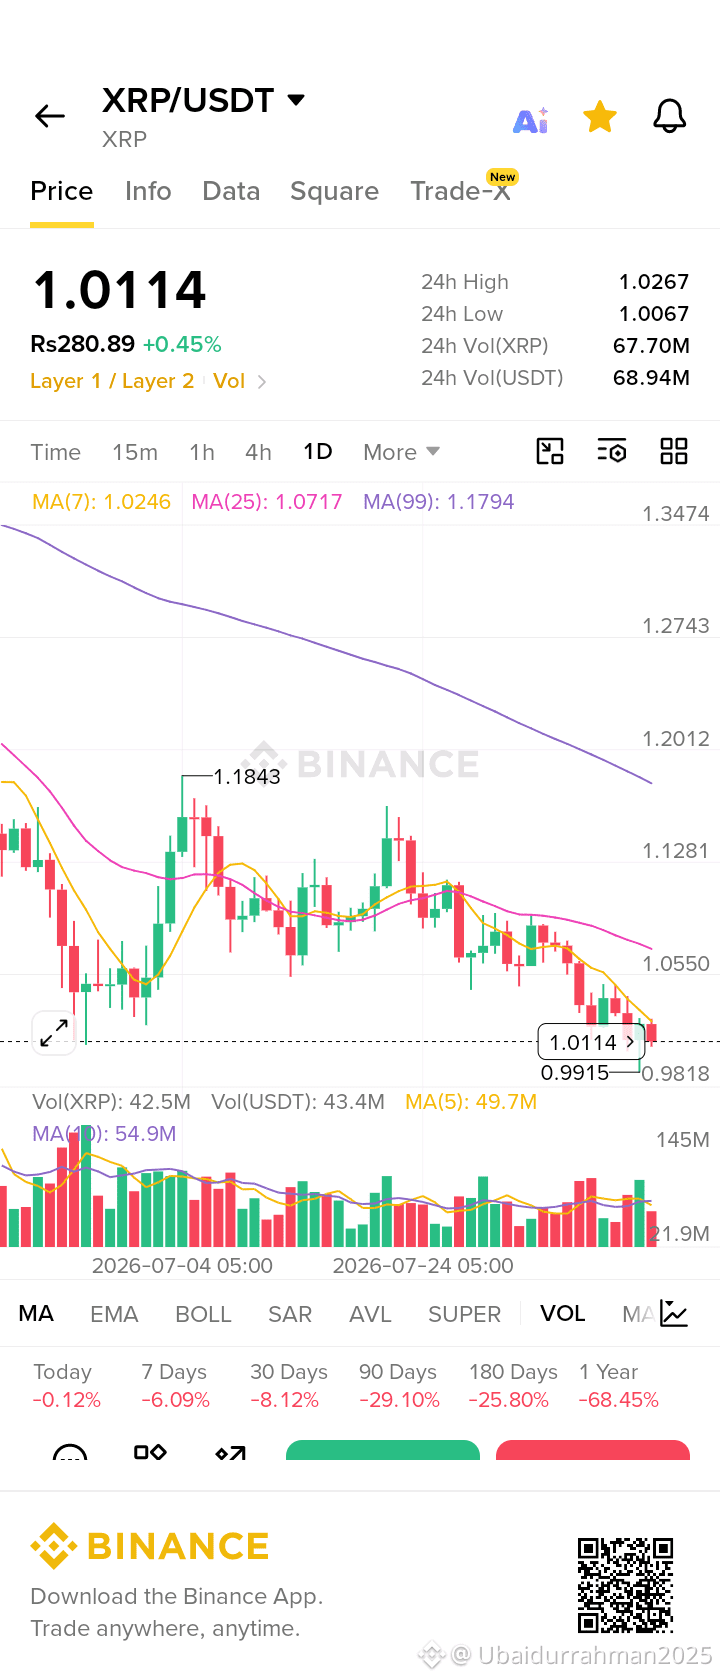
Pattern: Bearish consolidation below all major MAs (price 1.0114 < MA7 1.0246 < MA25 1.0717). Stuck in today's tight range (1.0067–1.0267) with declining volume (42.5M < MA5 49.7M) — a classic bearish flag/pennant continuation setup.
Next 10h Prediction:
· First 3-4h: Minor relief bounce toward 1.022–1.025 (testing MA7/resistance).
· Next 6h: Strong rejection at 1.025, then a slide back down. Breaks below 1.0067 support.
· End of 10h: Target 0.995–1.000 (testing the 0.9915 annotation level).
Short verdict: Bearish with a fake-out bounce. Net change over 10h: -1.2% to -1.8%. Watch 1.025 for short entries.
https://www.binance.com/download?utm_medium=screenshot
Pattern: Bearish consolidation below all major MAs (price 1.0114 < MA7 1.0246 < MA25 1.0717). Stuck in today's tight range (1.0067–1.0267) with declining volume (42.5M < MA5 49.7M) — a classic bearish flag/pennant continuation setup.
Next 10h Prediction:
· First 3-4h: Minor relief bounce toward 1.022–1.025 (testing MA7/resistance).
· Next 6h: Strong rejection at 1.025, then a slide back down. Breaks below 1.0067 support.
· End of 10h: Target 0.995–1.000 (testing the 0.9915 annotation level).
Short verdict: Bearish with a fake-out bounce. Net change over 10h: -1.2% to -1.8%. Watch 1.025 for short entries.
Pattern: Bearish consolidation below all major MAs (price 1.0114 < MA7 1.0246 < MA25 1.0717). Stuck in today's tight range (1.0067–1.0267) with declining volume (42.5M < MA5 49.7M) — a classic bearish flag/pennant continuation setup.
Next 10h Prediction:
· First 3-4h: Minor relief bounce toward 1.022–1.025 (testing MA7/resistance).
· Next 6h: Strong rejection at 1.025, then a slide back down. Breaks below 1.0067 support.
· End of 10h: Target 0.995–1.000 (testing the 0.9915 annotation level).
Short verdict: Bearish with a fake-out bounce. Net change over 10h: -1.2% to -1.8%. Watch 1.025 for short entries.
54
·
--
Bullish
https://www.binance.com/download?utm_medium=screenshot
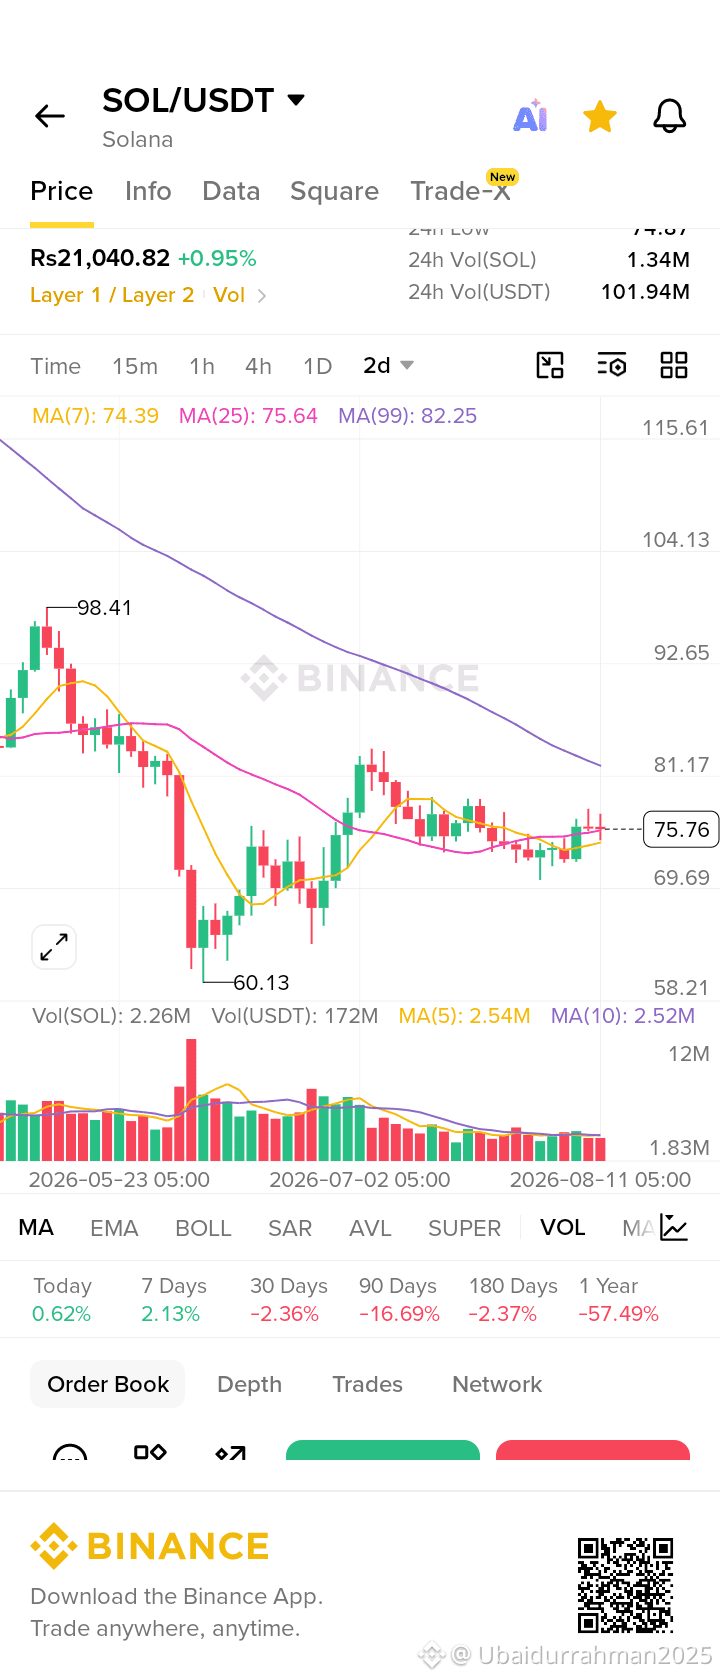
Next 10h: Likely down / sideways consolidation.
Why:
· The 2D bounce is stalling at MA(25) resistance (~75.64).
· Volume is below its MA(5)—weak buying pressure to break higher.
· Immediate support sits at MA(7) (~74.39).
Key level: Must break above 76 for upside; otherwise, expect a dip to test 74.4.
https://www.binance.com/download?utm_medium=screenshot
Next 10h: Likely down / sideways consolidation.
Why:
· The 2D bounce is stalling at MA(25) resistance (~75.64).
· Volume is below its MA(5)—weak buying pressure to break higher.
· Immediate support sits at MA(7) (~74.39).
Key level: Must break above 76 for upside; otherwise, expect a dip to test 74.4.
Next 10h: Likely down / sideways consolidation.
Why:
· The 2D bounce is stalling at MA(25) resistance (~75.64).
· Volume is below its MA(5)—weak buying pressure to break higher.
· Immediate support sits at MA(7) (~74.39).
Key level: Must break above 76 for upside; otherwise, expect a dip to test 74.4.
17
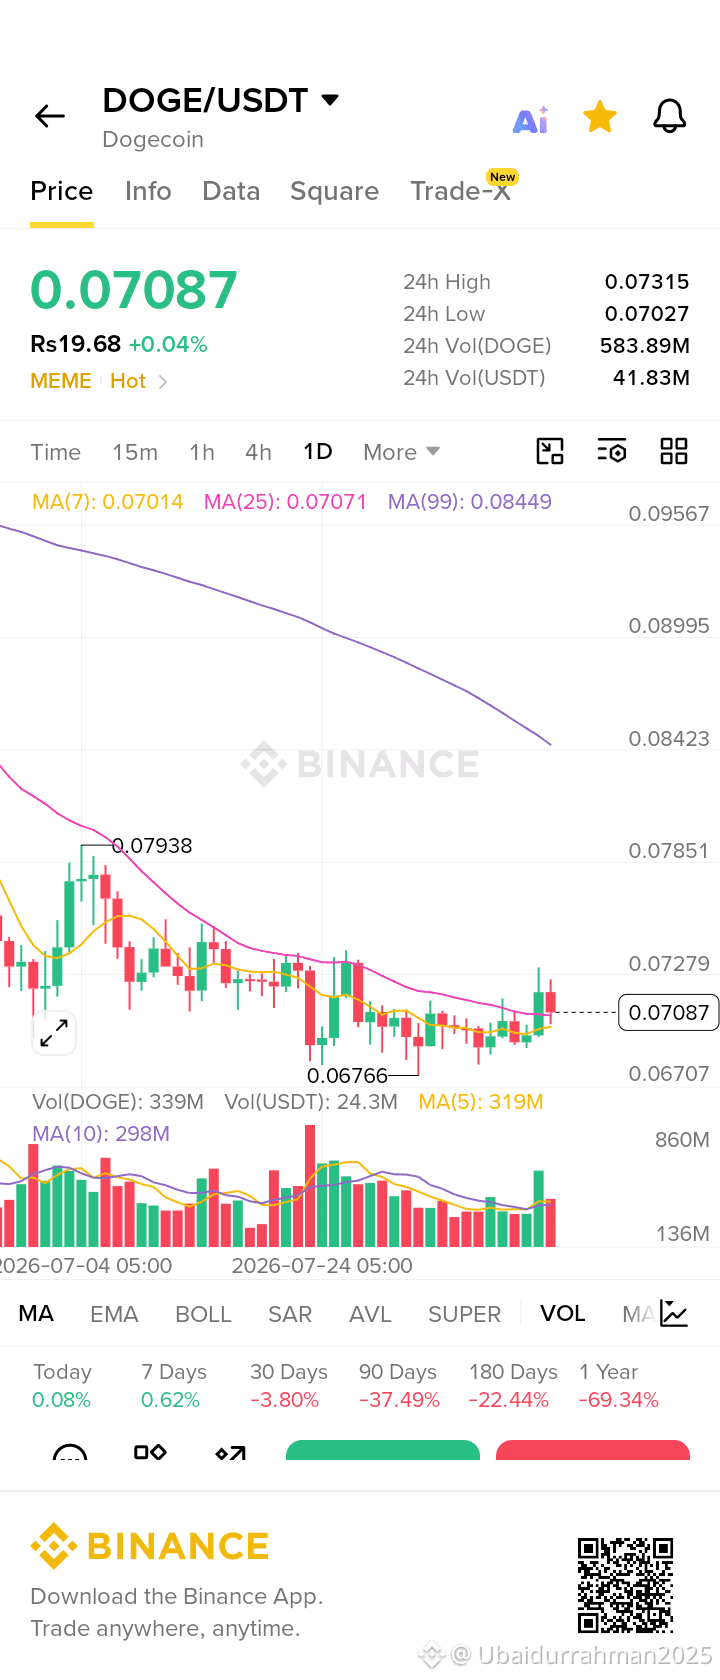
https://www.binance.com/download?utm_medium=screenshot
Up, ~60% chance (but choppy – expects a spike to ~0.073 then a pullback, still closing above current).
https://www.binance.com/download?utm_medium=screenshot
Up, ~60% chance (but choppy – expects a spike to ~0.073 then a pullback, still closing above current).
Up, ~60% chance (but choppy – expects a spike to ~0.073 then a pullback, still closing above current).
38
·
--
Bearish
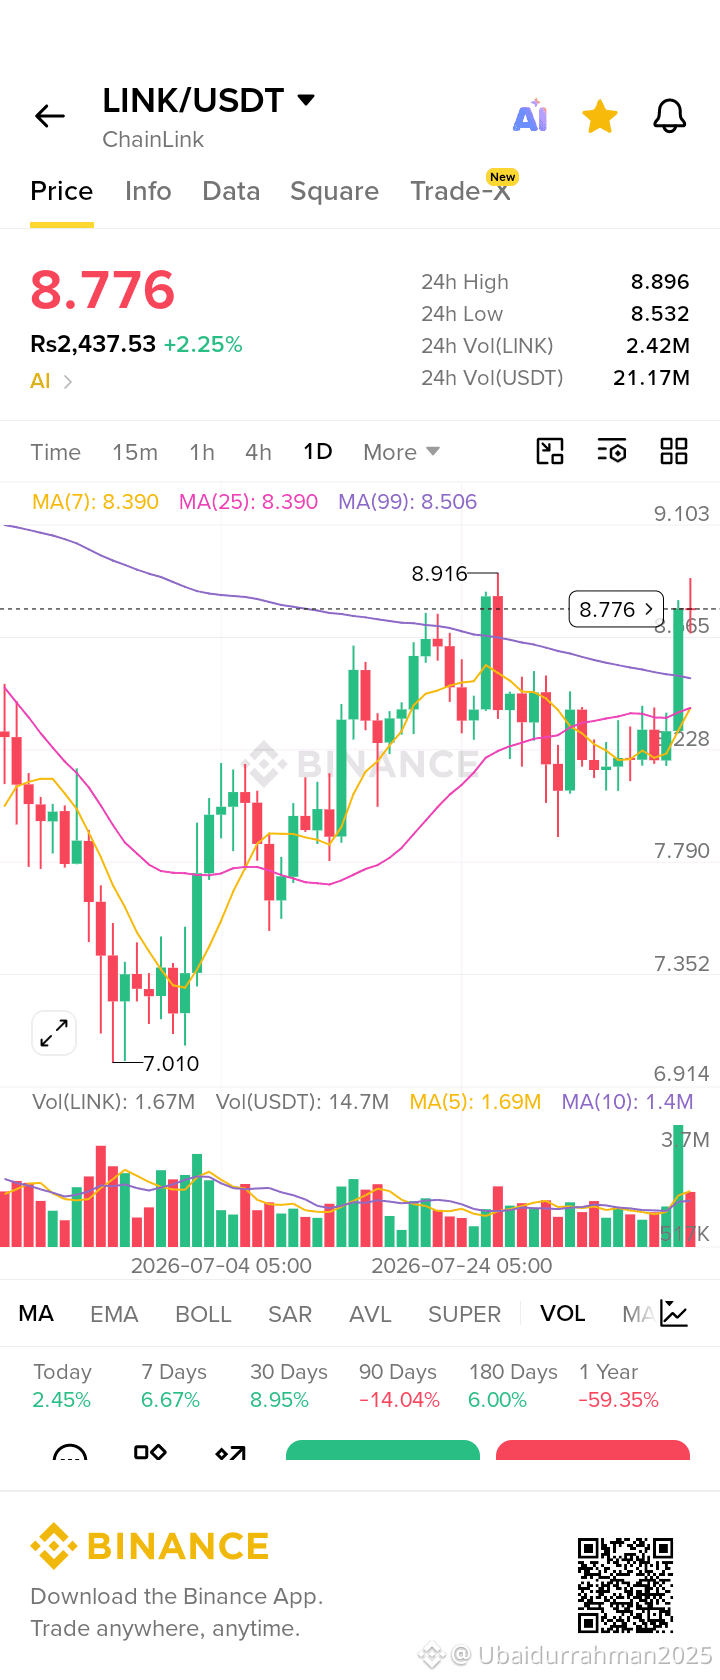
https://www.binance.com/download?utm_medium=screenshot
Prediction: DOWN (Correction) for next 10h.
Key reasons: Rejected 24h high (8.896), price is stretched above clustered MAs (8.39), and volume isn't surging to break resistance. Expect pullback to 8.60–8.65. Invalid if breaks above 8.90.
https://www.binance.com/download?utm_medium=screenshot
Prediction: DOWN (Correction) for next 10h.
Key reasons: Rejected 24h high (8.896), price is stretched above clustered MAs (8.39), and volume isn't surging to break resistance. Expect pullback to 8.60–8.65. Invalid if breaks above 8.90.
Prediction: DOWN (Correction) for next 10h.
Key reasons: Rejected 24h high (8.896), price is stretched above clustered MAs (8.39), and volume isn't surging to break resistance. Expect pullback to 8.60–8.65. Invalid if breaks above 8.90.
80
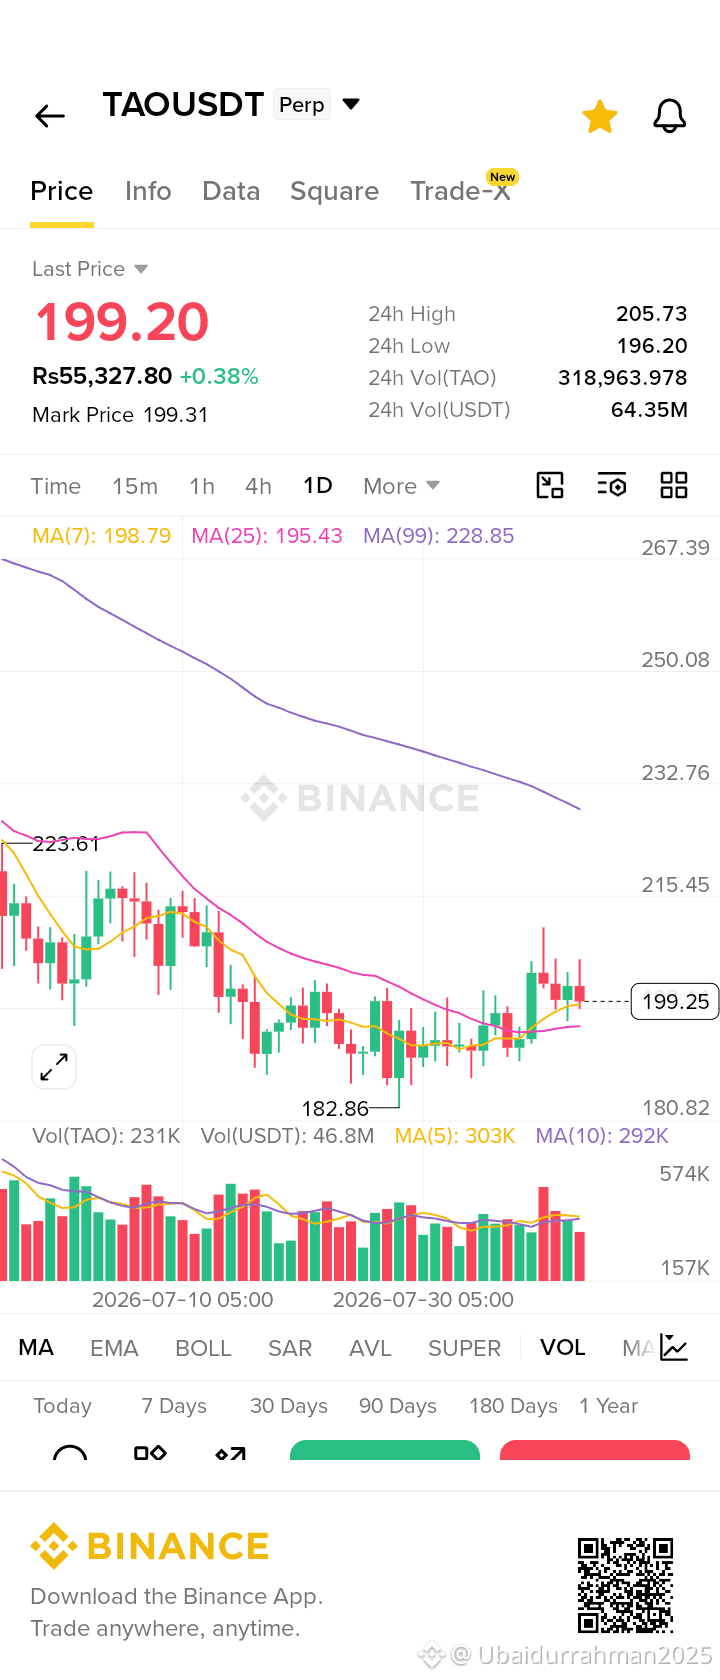
https://www.binance.com/download?utm_medium=screenshot
Based on the 1-Day candle and the data provided (price, volume, MAs), here is your TAO/USDT Perpetual analysis and prediction for the next 10 hours.
🔍 1-Day Candle Context
· Trend Structure: Bearish long-term (Price $199 < MA99 $228). However, the short-term momentum is neutral-to-slight-bullish as price holds above MA7 ($198.79) and MA25 ($195.43).
· Current Candle: Price is near the bottom half of the 24H range ($196.20 – $205.73). This suggests sellers are currently in control of the daily session.
· Volume Red Flag: 24H Vol is 318K, but the current volume (231K) is below MA5 (303K) and MA10 (292K). Declining volume + consolidation near the low = weak buying conviction. No strong reversal signal yet.
---
🕒 Next 10 Hours Prediction (Intraday)
Given the low volume and the overhead resistance, the 10H outlook is Bearish Consolidation (Range-bound with a downward tilt).
· Expected Price Range: $196.50 – $202.00
· Most Likely Path (Probability ~65%):
1. Hours 1-4: A small relief bounce toward $200.50 - $201.00 as price hugs MA7 support.
2. Hours 4-10: Rejection at $201 leads to a slow drift downward. Price retests the **24H Low support at $196.20**.
· Alternative Path (Probability ~35%): A sudden volume spike breaks $196.20, sending price toward **$193.00** rapidly.
---
📊 Key Levels to Watch (10H)
Level Price Action
Immediate Resistance $201.50 Break above this requires volume > 300K, unlikely.
Pivot / MA7 $198.80 Losing this level confirms the bearish drift.
Critical Support $196.20 If broken in the next 10H, expect a cascade to $193.
Strong Resistance $205.73 Unreachable in the next 10H without a major catalyst.
---
⚠️ Verdict
Short-term bias: Mildly Bearish.
Do not chase longs. The price is struggling to move up despite the 24H high being far away, and volume is drying up. Look for short entries near **$201** with a stop-loss above $203, targeting a retest of $196.50** within the 10-hour window. If you are a spot buyer, wait for a dip to **$195-$196 before accumulating
https://www.binance.com/download?utm_medium=screenshot
Based on the 1-Day candle and the data provided (price, volume, MAs), here is your TAO/USDT Perpetual analysis and prediction for the next 10 hours.
🔍 1-Day Candle Context
· Trend Structure: Bearish long-term (Price $199 < MA99 $228). However, the short-term momentum is neutral-to-slight-bullish as price holds above MA7 ($198.79) and MA25 ($195.43).
· Current Candle: Price is near the bottom half of the 24H range ($196.20 – $205.73). This suggests sellers are currently in control of the daily session.
· Volume Red Flag: 24H Vol is 318K, but the current volume (231K) is below MA5 (303K) and MA10 (292K). Declining volume + consolidation near the low = weak buying conviction. No strong reversal signal yet.
---
🕒 Next 10 Hours Prediction (Intraday)
Given the low volume and the overhead resistance, the 10H outlook is Bearish Consolidation (Range-bound with a downward tilt).
· Expected Price Range: $196.50 – $202.00
· Most Likely Path (Probability ~65%):
1. Hours 1-4: A small relief bounce toward $200.50 - $201.00 as price hugs MA7 support.
2. Hours 4-10: Rejection at $201 leads to a slow drift downward. Price retests the **24H Low support at $196.20**.
· Alternative Path (Probability ~35%): A sudden volume spike breaks $196.20, sending price toward **$193.00** rapidly.
---
📊 Key Levels to Watch (10H)
Level Price Action
Immediate Resistance $201.50 Break above this requires volume > 300K, unlikely.
Pivot / MA7 $198.80 Losing this level confirms the bearish drift.
Critical Support $196.20 If broken in the next 10H, expect a cascade to $193.
Strong Resistance $205.73 Unreachable in the next 10H without a major catalyst.
---
⚠️ Verdict
Short-term bias: Mildly Bearish.
Do not chase longs. The price is struggling to move up despite the 24H high being far away, and volume is drying up. Look for short entries near **$201** with a stop-loss above $203, targeting a retest of $196.50** within the 10-hour window. If you are a spot buyer, wait for a dip to **$195-$196 before accumulating
Based on the 1-Day candle and the data provided (price, volume, MAs), here is your TAO/USDT Perpetual analysis and prediction for the next 10 hours.
🔍 1-Day Candle Context
· Trend Structure: Bearish long-term (Price $199 < MA99 $228). However, the short-term momentum is neutral-to-slight-bullish as price holds above MA7 ($198.79) and MA25 ($195.43).
· Current Candle: Price is near the bottom half of the 24H range ($196.20 – $205.73). This suggests sellers are currently in control of the daily session.
· Volume Red Flag: 24H Vol is 318K, but the current volume (231K) is below MA5 (303K) and MA10 (292K). Declining volume + consolidation near the low = weak buying conviction. No strong reversal signal yet.
---
🕒 Next 10 Hours Prediction (Intraday)
Given the low volume and the overhead resistance, the 10H outlook is Bearish Consolidation (Range-bound with a downward tilt).
· Expected Price Range: $196.50 – $202.00
· Most Likely Path (Probability ~65%):
1. Hours 1-4: A small relief bounce toward $200.50 - $201.00 as price hugs MA7 support.
2. Hours 4-10: Rejection at $201 leads to a slow drift downward. Price retests the **24H Low support at $196.20**.
· Alternative Path (Probability ~35%): A sudden volume spike breaks $196.20, sending price toward **$193.00** rapidly.
---
📊 Key Levels to Watch (10H)
Level Price Action
Immediate Resistance $201.50 Break above this requires volume > 300K, unlikely.
Pivot / MA7 $198.80 Losing this level confirms the bearish drift.
Critical Support $196.20 If broken in the next 10H, expect a cascade to $193.
Strong Resistance $205.73 Unreachable in the next 10H without a major catalyst.
---
⚠️ Verdict
Short-term bias: Mildly Bearish.
Do not chase longs. The price is struggling to move up despite the 24H high being far away, and volume is drying up. Look for short entries near **$201** with a stop-loss above $203, targeting a retest of $196.50** within the 10-hour window. If you are a spot buyer, wait for a dip to **$195-$196 before accumulating
122
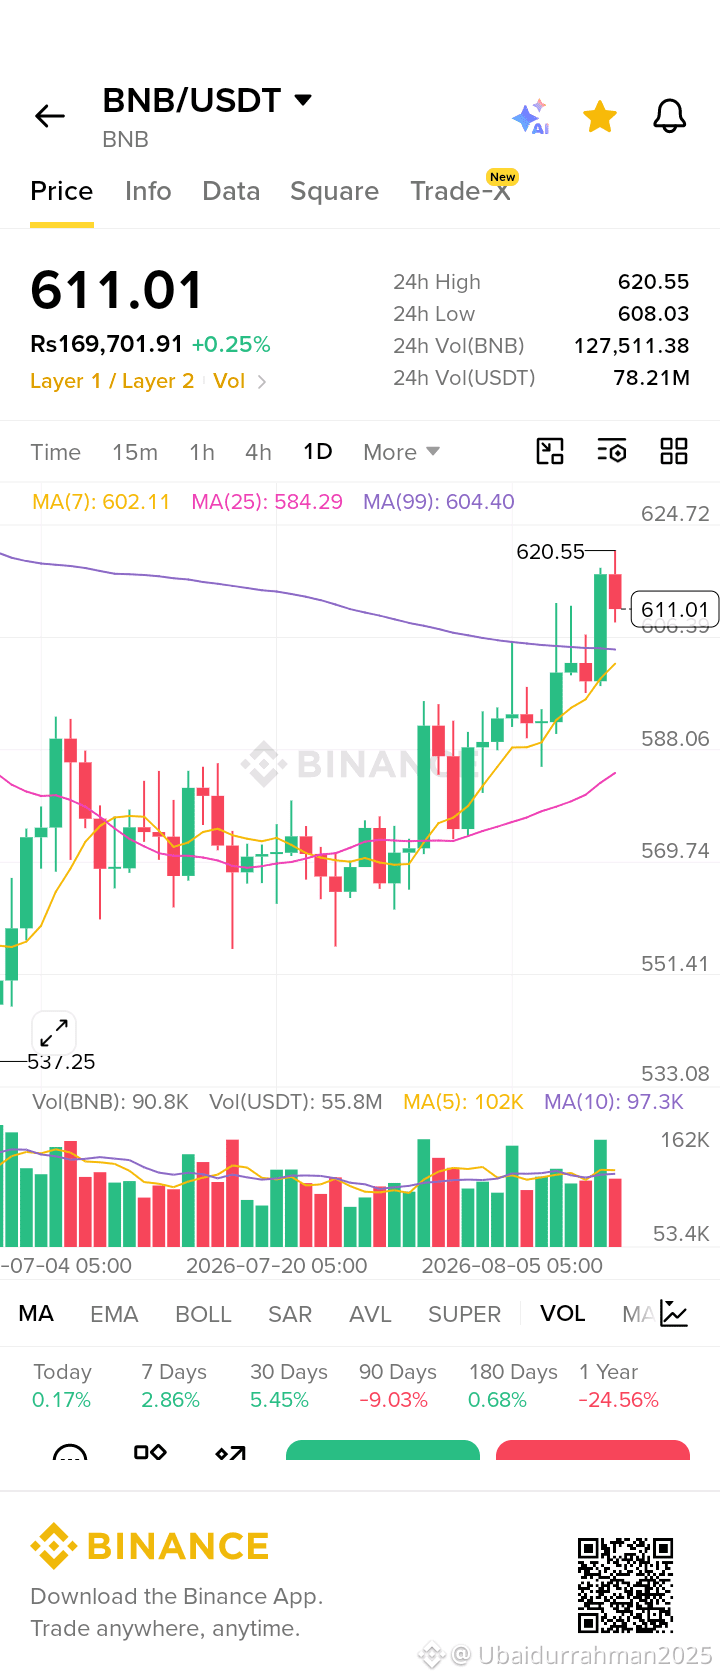
https://www.binance.com/download?utm_medium=screenshot
Based on the daily candle chart provided (and analyzing the visible 30-day structure), here is my breakdown and 10-hour prediction:
Pattern & Structure
· "V" Recovery & Rejection: BNB bottomed near $533–$551 (early July), rallied hard to the 24h high of $620.55, but got rejected at that level.
· Current Candle: Price is currently at $611.01, forming a small bearish pullback candle after that rejection. It is digesting the recent move.
· Crucial Support Zone: The price is hovering just above the 24h Low ($608.03)** and the **MA(99) at $604.40. This $604–$608 zone is the immediate "make-or-break" support.
Volume & Momentum
· Declining Volume: Peak volume during the rally was ~162K BNB. Current 24h volume is 127.5K, and the intraday volume shown (90.8K) is notably lower.
· Bullish Divergence in Volume: Lower volume on this pullback suggests sellers are not aggressive. It looks like a healthy consolidation/correction, not a mass reversal.
10-Hour Prediction (Next ~10 hours)
Since we are in the pullback phase of a daily candle:
· Most Likely Scenario (Neutral-to-Bullish): Price will range between $608 and $616 for the next 10 hours. It will likely test the $608 support but hold above it due to the MA(99) safety net.
· The Breakout Test: If volume picks up above the current 90.8K, expect a move back up to retest $620.55 within this 10-hour window.
· Bearish Risk (Low Probability): A break and close below **$604** would invalidate the pattern and could drop to $588, but the low volume on the dip makes this unlikely in the next 10 hours.
Verdict: Consolidation with an upward bias. Expect price to hold $608 and attempt to reclaim $615–$616. Watch the volume spike—if it surges past 100K on green candles, it will hit $620 again.#KOSPIRisesNearly5%TriggersBuySideSidecar #OCCSaysDigitalFirmsCanSeekNationalBankStatus $AAPLB #DogecoinLeadsMajorsUpNearly3% #SECMayUnveilTokenizedStockExemptionAsSoonAsFriday
https://www.binance.com/download?utm_medium=screenshot
Based on the daily candle chart provided (and analyzing the visible 30-day structure), here is my breakdown and 10-hour prediction:
Pattern & Structure
· "V" Recovery & Rejection: BNB bottomed near $533–$551 (early July), rallied hard to the 24h high of $620.55, but got rejected at that level.
· Current Candle: Price is currently at $611.01, forming a small bearish pullback candle after that rejection. It is digesting the recent move.
· Crucial Support Zone: The price is hovering just above the 24h Low ($608.03)** and the **MA(99) at $604.40. This $604–$608 zone is the immediate "make-or-break" support.
Volume & Momentum
· Declining Volume: Peak volume during the rally was ~162K BNB. Current 24h volume is 127.5K, and the intraday volume shown (90.8K) is notably lower.
· Bullish Divergence in Volume: Lower volume on this pullback suggests sellers are not aggressive. It looks like a healthy consolidation/correction, not a mass reversal.
10-Hour Prediction (Next ~10 hours)
Since we are in the pullback phase of a daily candle:
· Most Likely Scenario (Neutral-to-Bullish): Price will range between $608 and $616 for the next 10 hours. It will likely test the $608 support but hold above it due to the MA(99) safety net.
· The Breakout Test: If volume picks up above the current 90.8K, expect a move back up to retest $620.55 within this 10-hour window.
· Bearish Risk (Low Probability): A break and close below **$604** would invalidate the pattern and could drop to $588, but the low volume on the dip makes this unlikely in the next 10 hours.
Verdict: Consolidation with an upward bias. Expect price to hold $608 and attempt to reclaim $615–$616. Watch the volume spike—if it surges past 100K on green candles, it will hit $620 again.#KOSPIRisesNearly5%TriggersBuySideSidecar #OCCSaysDigitalFirmsCanSeekNationalBankStatus $AAPLB #DogecoinLeadsMajorsUpNearly3% #SECMayUnveilTokenizedStockExemptionAsSoonAsFriday
Based on the daily candle chart provided (and analyzing the visible 30-day structure), here is my breakdown and 10-hour prediction:
Pattern & Structure
· "V" Recovery & Rejection: BNB bottomed near $533–$551 (early July), rallied hard to the 24h high of $620.55, but got rejected at that level.
· Current Candle: Price is currently at $611.01, forming a small bearish pullback candle after that rejection. It is digesting the recent move.
· Crucial Support Zone: The price is hovering just above the 24h Low ($608.03)** and the **MA(99) at $604.40. This $604–$608 zone is the immediate "make-or-break" support.
Volume & Momentum
· Declining Volume: Peak volume during the rally was ~162K BNB. Current 24h volume is 127.5K, and the intraday volume shown (90.8K) is notably lower.
· Bullish Divergence in Volume: Lower volume on this pullback suggests sellers are not aggressive. It looks like a healthy consolidation/correction, not a mass reversal.
10-Hour Prediction (Next ~10 hours)
Since we are in the pullback phase of a daily candle:
· Most Likely Scenario (Neutral-to-Bullish): Price will range between $608 and $616 for the next 10 hours. It will likely test the $608 support but hold above it due to the MA(99) safety net.
· The Breakout Test: If volume picks up above the current 90.8K, expect a move back up to retest $620.55 within this 10-hour window.
· Bearish Risk (Low Probability): A break and close below **$604** would invalidate the pattern and could drop to $588, but the low volume on the dip makes this unlikely in the next 10 hours.
Verdict: Consolidation with an upward bias. Expect price to hold $608 and attempt to reclaim $615–$616. Watch the volume spike—if it surges past 100K on green candles, it will hit $620 again.#KOSPIRisesNearly5%TriggersBuySideSidecar #OCCSaysDigitalFirmsCanSeekNationalBankStatus $AAPLB #DogecoinLeadsMajorsUpNearly3% #SECMayUnveilTokenizedStockExemptionAsSoonAsFriday
59
https://www.binance.com/download?utm_medium=screenshot
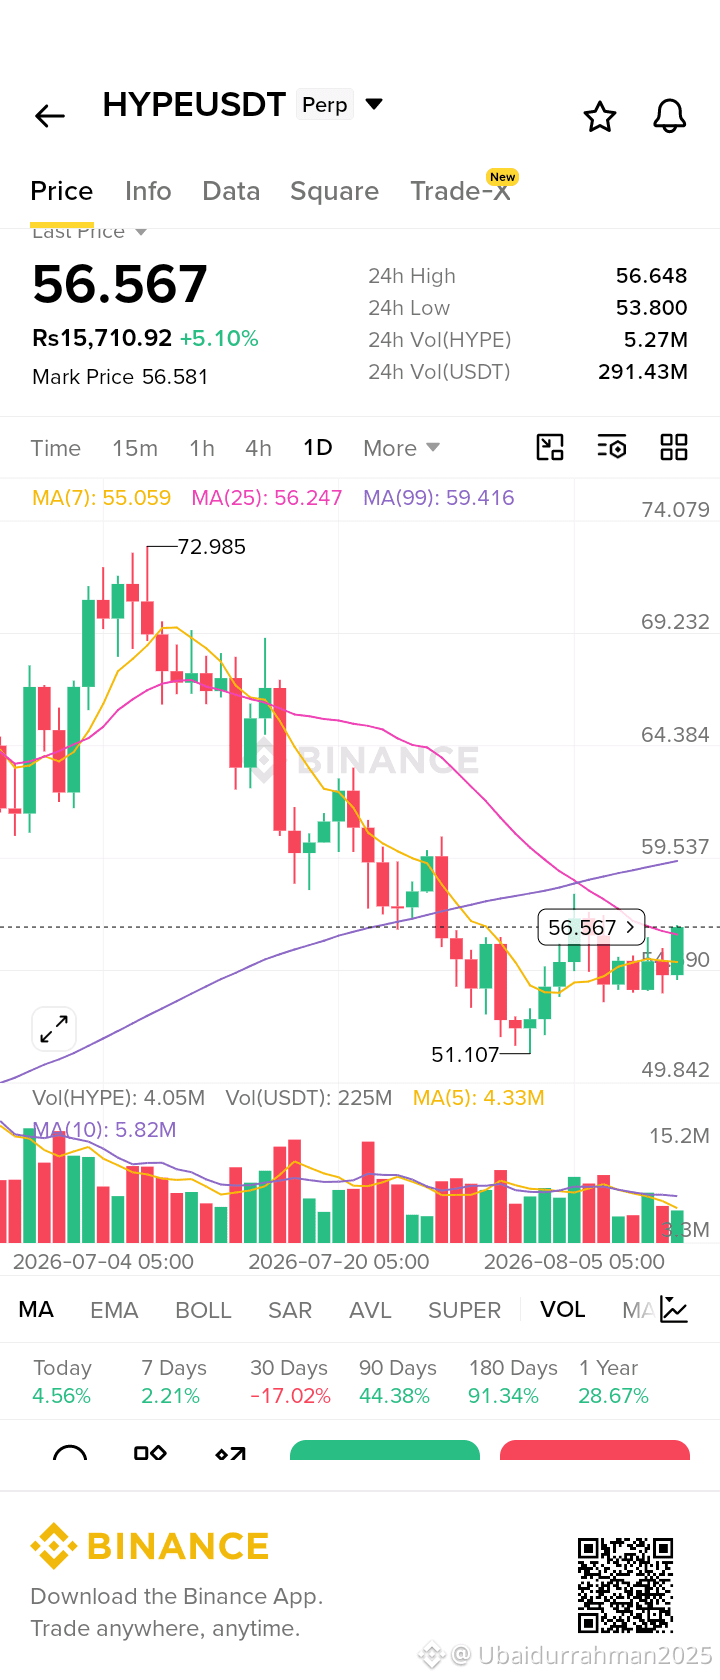
Based on the 1D candle data:
Bullish Signals:
· Price (+5.10%) is above MA(7) and MA(25), showing short-term strength.
· The 24h high rejection suggests buyers attempted a push higher (56.648).
Bearish Signals:
· The price is still below the long-term MA(99) at 59.416, acting as resistance.
· Volume is slightly declining (current 4.05M vs MA5 4.33M), indicating weaker buying momentum.
Prediction (Next 10h):
Consolidation with a slight downward bias.
Expect a pullback to test support near 55.50–56.00 before any further upward move. The rejection at the daily high and decreasing volume suggest a short-term cooldown rather than a breakout.#KOSPIRisesNearly5%TriggersBuySideSidecar #DogecoinLeadsMajorsUpNearly3% #DogecoinLeadsMajorsUpNearly3%
https://www.binance.com/download?utm_medium=screenshot
Based on the 1D candle data:
Bullish Signals:
· Price (+5.10%) is above MA(7) and MA(25), showing short-term strength.
· The 24h high rejection suggests buyers attempted a push higher (56.648).
Bearish Signals:
· The price is still below the long-term MA(99) at 59.416, acting as resistance.
· Volume is slightly declining (current 4.05M vs MA5 4.33M), indicating weaker buying momentum.
Prediction (Next 10h):
Consolidation with a slight downward bias.
Expect a pullback to test support near 55.50–56.00 before any further upward move. The rejection at the daily high and decreasing volume suggest a short-term cooldown rather than a breakout.#KOSPIRisesNearly5%TriggersBuySideSidecar #DogecoinLeadsMajorsUpNearly3% #DogecoinLeadsMajorsUpNearly3%
Based on the 1D candle data:
Bullish Signals:
· Price (+5.10%) is above MA(7) and MA(25), showing short-term strength.
· The 24h high rejection suggests buyers attempted a push higher (56.648).
Bearish Signals:
· The price is still below the long-term MA(99) at 59.416, acting as resistance.
· Volume is slightly declining (current 4.05M vs MA5 4.33M), indicating weaker buying momentum.
Prediction (Next 10h):
Consolidation with a slight downward bias.
Expect a pullback to test support near 55.50–56.00 before any further upward move. The rejection at the daily high and decreasing volume suggest a short-term cooldown rather than a breakout.#KOSPIRisesNearly5%TriggersBuySideSidecar #DogecoinLeadsMajorsUpNearly3% #DogecoinLeadsMajorsUpNearly3%
139
https://www.binance.com/download?utm_medium=screenshot
Based on the 1-Day candle structure, volume, and moving averages you provided, my clear prediction for the next 10 hours is:
📉 Price will go DOWN (Bearish pullback).
Here is the technical breakdown driving this forecast:
· Rejection at Heavy Resistance (MA Cluster): The current price ($1,894) is trading **below** both the MA(7) at $1,899.40 and the MA(25) at $1,895.30. This creates a strong **resistance ceiling** right above the current price ($1,895 - $1,900). The daily candle tried to push higher (High: $1,925) but failed to close above these averages, signaling seller dominance.
· Weak Buying Volume (Divergence): Today’s price is up +1.89%, but the 24h Vol(ETH) is 128K, which is below both the MA(5) volume (135K) and MA(10) volume (166K). This is a classic bearish divergence – the price is rising on decreasing momentum and liquidity. Buyers are exhausted.
· Descending Price Structure: The chart's historical data points show clear lower highs (1,981 → 1,894 → 1,827), confirming the broader trend remains down. Without volume, a breakout above $1,925 is highly unlikely.
· Next 10-Hour Target: Expect a retracement toward the MA(99) support at $1,886** within the next few hours. If selling intensifies, it could slide further to test the **$1,870 - $1,859 (Daily Low) zone.
⚠️ Disclaimer: This is a short-term technical analysis based on the provided data. Crypto markets are volatile; always use stop-losses and manage your risk.#KOSPIRisesNearly5%TriggersBuySideSidecar #KOSPIRisesNearly5%TriggersBuySideSidecar $NVDAB $AAPL.US #KOSPIRisesNearly5%TriggersBuySideSidecar #DogecoinLeadsMajorsUpNearly3%
https://www.binance.com/download?utm_medium=screenshot
Based on the 1-Day candle structure, volume, and moving averages you provided, my clear prediction for the next 10 hours is:
📉 Price will go DOWN (Bearish pullback).
Here is the technical breakdown driving this forecast:
· Rejection at Heavy Resistance (MA Cluster): The current price ($1,894) is trading **below** both the MA(7) at $1,899.40 and the MA(25) at $1,895.30. This creates a strong **resistance ceiling** right above the current price ($1,895 - $1,900). The daily candle tried to push higher (High: $1,925) but failed to close above these averages, signaling seller dominance.
· Weak Buying Volume (Divergence): Today’s price is up +1.89%, but the 24h Vol(ETH) is 128K, which is below both the MA(5) volume (135K) and MA(10) volume (166K). This is a classic bearish divergence – the price is rising on decreasing momentum and liquidity. Buyers are exhausted.
· Descending Price Structure: The chart's historical data points show clear lower highs (1,981 → 1,894 → 1,827), confirming the broader trend remains down. Without volume, a breakout above $1,925 is highly unlikely.
· Next 10-Hour Target: Expect a retracement toward the MA(99) support at $1,886** within the next few hours. If selling intensifies, it could slide further to test the **$1,870 - $1,859 (Daily Low) zone.
⚠️ Disclaimer: This is a short-term technical analysis based on the provided data. Crypto markets are volatile; always use stop-losses and manage your risk.#KOSPIRisesNearly5%TriggersBuySideSidecar #KOSPIRisesNearly5%TriggersBuySideSidecar $NVDAB $AAPL.US #KOSPIRisesNearly5%TriggersBuySideSidecar #DogecoinLeadsMajorsUpNearly3%
Based on the 1-Day candle structure, volume, and moving averages you provided, my clear prediction for the next 10 hours is:
📉 Price will go DOWN (Bearish pullback).
Here is the technical breakdown driving this forecast:
· Rejection at Heavy Resistance (MA Cluster): The current price ($1,894) is trading **below** both the MA(7) at $1,899.40 and the MA(25) at $1,895.30. This creates a strong **resistance ceiling** right above the current price ($1,895 - $1,900). The daily candle tried to push higher (High: $1,925) but failed to close above these averages, signaling seller dominance.
· Weak Buying Volume (Divergence): Today’s price is up +1.89%, but the 24h Vol(ETH) is 128K, which is below both the MA(5) volume (135K) and MA(10) volume (166K). This is a classic bearish divergence – the price is rising on decreasing momentum and liquidity. Buyers are exhausted.
· Descending Price Structure: The chart's historical data points show clear lower highs (1,981 → 1,894 → 1,827), confirming the broader trend remains down. Without volume, a breakout above $1,925 is highly unlikely.
· Next 10-Hour Target: Expect a retracement toward the MA(99) support at $1,886** within the next few hours. If selling intensifies, it could slide further to test the **$1,870 - $1,859 (Daily Low) zone.
⚠️ Disclaimer: This is a short-term technical analysis based on the provided data. Crypto markets are volatile; always use stop-losses and manage your risk.#KOSPIRisesNearly5%TriggersBuySideSidecar #KOSPIRisesNearly5%TriggersBuySideSidecar $NVDAB $AAPL.US #KOSPIRisesNearly5%TriggersBuySideSidecar #DogecoinLeadsMajorsUpNearly3%
126
·
--
Bearish
Doge coin Down upto 5% in 24 hr
let we see chark and other analysis $NVDA.US 😇
Doge coin Down upto 5% in 24 hr
let we see chark and other analysis $NVDA.US 😇
let we see chark and other analysis $NVDA.US 😇
NVDAUS-3.51%
70
Top 5 Coins That Could Pump Soon (July 2026)The cryptocurrency market moves quickly, and identifying coins with strong momentum can help traders spot potential opportunities. While no one can guarantee future price movements, several cryptocurrencies are attracting attention because of strong development, growing adoption, and positive market sentiment.
1. Bitcoin (BTC)
Bitcoin remains the market leader. Rising institutional interest, strong liquidity, and positive macroeconomic developments often make BTC the first coin to gain momentum during bullish periods.
2. Ethereum (ETH)
Ethereum continues to dominate the smart contract ecosystem. Growth in decentralized finance (DeFi), tokenization, and Layer-2 networks could support another upward move if market sentiment improves.
3. Solana (SOL)
Solana remains one of the fastest-growing blockchain networks. Increasing developer activity, low transaction fees, and expanding decentralized applications make SOL a coin to watch.
4. Hyperliquid (HYPE)
Hyperliquid has become one of the strongest-performing crypto projects in 2026. Growth in decentralized derivatives trading and increasing user adoption have attracted investor attention.
5. Ondo (ONDO)
Ondo Finance is benefiting from the growing trend of tokenized real-world assets (RWAs). As more traditional financial assets move on-chain, ONDO could see increased demand.
Final Thoughts
These five cryptocurrencies have strong fundamentals and are among the projects receiving significant attention in July 2026. However, cryptocurrency markets are highly volatile. Always conduct your own research, manage risk carefully, and never invest more than you can afford to lose.
Disclaimer: This article is for educational purposes only and should not be considered financial advice.#US30YearYieldClimbsToNear5.23% #USLaunchesFreshStrikesOnIRGC #MetaFalls10%OnEarningsMiss #
$AAPL.US $AAPLB
Top 5 Coins That Could Pump Soon (July 2026)
The cryptocurrency market moves quickly, and identifying coins with strong momentum can help traders spot potential opportunities. While no one can guarantee future price movements, several cryptocurrencies are attracting attention because of strong development, growing adoption, and positive market sentiment.
1. Bitcoin (BTC)
Bitcoin remains the market leader. Rising institutional interest, strong liquidity, and positive macroeconomic developments often make BTC the first coin to gain momentum during bullish periods.
2. Ethereum (ETH)
Ethereum continues to dominate the smart contract ecosystem. Growth in decentralized finance (DeFi), tokenization, and Layer-2 networks could support another upward move if market sentiment improves.
3. Solana (SOL)
Solana remains one of the fastest-growing blockchain networks. Increasing developer activity, low transaction fees, and expanding decentralized applications make SOL a coin to watch.
4. Hyperliquid (HYPE)
Hyperliquid has become one of the strongest-performing crypto projects in 2026. Growth in decentralized derivatives trading and increasing user adoption have attracted investor attention.
5. Ondo (ONDO)
Ondo Finance is benefiting from the growing trend of tokenized real-world assets (RWAs). As more traditional financial assets move on-chain, ONDO could see increased demand.
Final Thoughts
These five cryptocurrencies have strong fundamentals and are among the projects receiving significant attention in July 2026. However, cryptocurrency markets are highly volatile. Always conduct your own research, manage risk carefully, and never invest more than you can afford to lose.
Disclaimer: This article is for educational purposes only and should not be considered financial advice.#US30YearYieldClimbsToNear5.23% #USLaunchesFreshStrikesOnIRGC #MetaFalls10%OnEarningsMiss #
$AAPL.US $AAPLB
1. Bitcoin (BTC)
Bitcoin remains the market leader. Rising institutional interest, strong liquidity, and positive macroeconomic developments often make BTC the first coin to gain momentum during bullish periods.
2. Ethereum (ETH)
Ethereum continues to dominate the smart contract ecosystem. Growth in decentralized finance (DeFi), tokenization, and Layer-2 networks could support another upward move if market sentiment improves.
3. Solana (SOL)
Solana remains one of the fastest-growing blockchain networks. Increasing developer activity, low transaction fees, and expanding decentralized applications make SOL a coin to watch.
4. Hyperliquid (HYPE)
Hyperliquid has become one of the strongest-performing crypto projects in 2026. Growth in decentralized derivatives trading and increasing user adoption have attracted investor attention.
5. Ondo (ONDO)
Ondo Finance is benefiting from the growing trend of tokenized real-world assets (RWAs). As more traditional financial assets move on-chain, ONDO could see increased demand.
Final Thoughts
These five cryptocurrencies have strong fundamentals and are among the projects receiving significant attention in July 2026. However, cryptocurrency markets are highly volatile. Always conduct your own research, manage risk carefully, and never invest more than you can afford to lose.
Disclaimer: This article is for educational purposes only and should not be considered financial advice.#US30YearYieldClimbsToNear5.23% #USLaunchesFreshStrikesOnIRGC #MetaFalls10%OnEarningsMiss #
$AAPL.US $AAPLB
1
108
·
--
Bullish
Top 5 Coins That Could Pump Soon (July 2026)
The cryptocurrency market moves quickly, and identifying coins with strong momentum can help traders spot potential opportunities. While no one can guarantee future price movements, several cryptocurrencies are attracting attention because of strong development, growing adoption, and positive market sentiment.
1. Bitcoin (BTC)
Bitcoin remains the market leader. Rising institutional interest, strong liquidity, and positive macroeconomic developments often make BTC the first coin to gain momentum during bullish periods.
2. Ethereum (ETH)
Ethereum continues to dominate the smart contract ecosystem. Growth in decentralized finance (DeFi), tokenization, and Layer-2 networks could support another upward move if market sentiment improves.
3. Solana (SOL)
Solana remains one of the fastest-growing blockchain networks. Increasing developer activity, low transaction fees, and expanding decentralized applications make SOL a coin to watch.
4. Hyperliquid (HYPE)
Hyperliquid has become one of the strongest-performing crypto projects in 2026. Growth in decentralized derivatives trading and increasing user adoption have attracted investor attention.
5. Ondo (ONDO)
Ondo Finance is benefiting from the growing trend of tokenized real-world assets (RWAs). As more traditional financial assets move on-chain, ONDO could see increased demand.
Final Thoughts
These five cryptocurrencies have strong fundamentals and are among the projects receiving significant attention in July 2026. However, cryptocurrency markets are highly volatile. Always conduct your own research, manage risk carefully, and never invest more than you can afford to lose.
Disclaimer: This article is for educational purposes only and should not be considered financial advice.#SouthKoreaProposesSuspiciousCryptoAccountFreeze #US30YearYieldClimbsToNear5.23% #MetaFalls10%OnEarningsMiss #FedHoldsRates9To3
Top 5 Coins That Could Pump Soon (July 2026)
The cryptocurrency market moves quickly, and identifying coins with strong momentum can help traders spot potential opportunities. While no one can guarantee future price movements, several cryptocurrencies are attracting attention because of strong development, growing adoption, and positive market sentiment.
1. Bitcoin (BTC)
Bitcoin remains the market leader. Rising institutional interest, strong liquidity, and positive macroeconomic developments often make BTC the first coin to gain momentum during bullish periods.
2. Ethereum (ETH)
Ethereum continues to dominate the smart contract ecosystem. Growth in decentralized finance (DeFi), tokenization, and Layer-2 networks could support another upward move if market sentiment improves.
3. Solana (SOL)
Solana remains one of the fastest-growing blockchain networks. Increasing developer activity, low transaction fees, and expanding decentralized applications make SOL a coin to watch.
4. Hyperliquid (HYPE)
Hyperliquid has become one of the strongest-performing crypto projects in 2026. Growth in decentralized derivatives trading and increasing user adoption have attracted investor attention.
5. Ondo (ONDO)
Ondo Finance is benefiting from the growing trend of tokenized real-world assets (RWAs). As more traditional financial assets move on-chain, ONDO could see increased demand.
Final Thoughts
These five cryptocurrencies have strong fundamentals and are among the projects receiving significant attention in July 2026. However, cryptocurrency markets are highly volatile. Always conduct your own research, manage risk carefully, and never invest more than you can afford to lose.
Disclaimer: This article is for educational purposes only and should not be considered financial advice.#SouthKoreaProposesSuspiciousCryptoAccountFreeze #US30YearYieldClimbsToNear5.23% #MetaFalls10%OnEarningsMiss #FedHoldsRates9To3
The cryptocurrency market moves quickly, and identifying coins with strong momentum can help traders spot potential opportunities. While no one can guarantee future price movements, several cryptocurrencies are attracting attention because of strong development, growing adoption, and positive market sentiment.
1. Bitcoin (BTC)
Bitcoin remains the market leader. Rising institutional interest, strong liquidity, and positive macroeconomic developments often make BTC the first coin to gain momentum during bullish periods.
2. Ethereum (ETH)
Ethereum continues to dominate the smart contract ecosystem. Growth in decentralized finance (DeFi), tokenization, and Layer-2 networks could support another upward move if market sentiment improves.
3. Solana (SOL)
Solana remains one of the fastest-growing blockchain networks. Increasing developer activity, low transaction fees, and expanding decentralized applications make SOL a coin to watch.
4. Hyperliquid (HYPE)
Hyperliquid has become one of the strongest-performing crypto projects in 2026. Growth in decentralized derivatives trading and increasing user adoption have attracted investor attention.
5. Ondo (ONDO)
Ondo Finance is benefiting from the growing trend of tokenized real-world assets (RWAs). As more traditional financial assets move on-chain, ONDO could see increased demand.
Final Thoughts
These five cryptocurrencies have strong fundamentals and are among the projects receiving significant attention in July 2026. However, cryptocurrency markets are highly volatile. Always conduct your own research, manage risk carefully, and never invest more than you can afford to lose.
Disclaimer: This article is for educational purposes only and should not be considered financial advice.#SouthKoreaProposesSuspiciousCryptoAccountFreeze #US30YearYieldClimbsToNear5.23% #MetaFalls10%OnEarningsMiss #FedHoldsRates9To3
170
Log in to explore more content
Join global crypto users on Binance Square
⚡️ Get latest and useful information about crypto.
💬 Trusted by the world’s largest crypto exchange.
👍 Discover real insights from verified creators.
Email / Phone number
Trending Topics
HotCPIDecemberHikePriced
92,188 views
1,095 Discussing
CPI Market Watch | US CPI Rises 0.4% in October, Hotter Than 0.3% Forecast
Binance News
·27 Likes
·41.4k views
AnthropicRejectsIPODelayValuationinQuestion
217,574 views
1,823 Discussing
CanNvidiaEarningsEaseMarketConcerns?
35,032 views
509 Discussing