

Dark Trader08
4 Posts

Dark Trader08
Report
Block User
0 Following
1 Followers
0 Liked
Posts
🔥 $WLFI (World Liberty Financial) — Latest Market Analysis
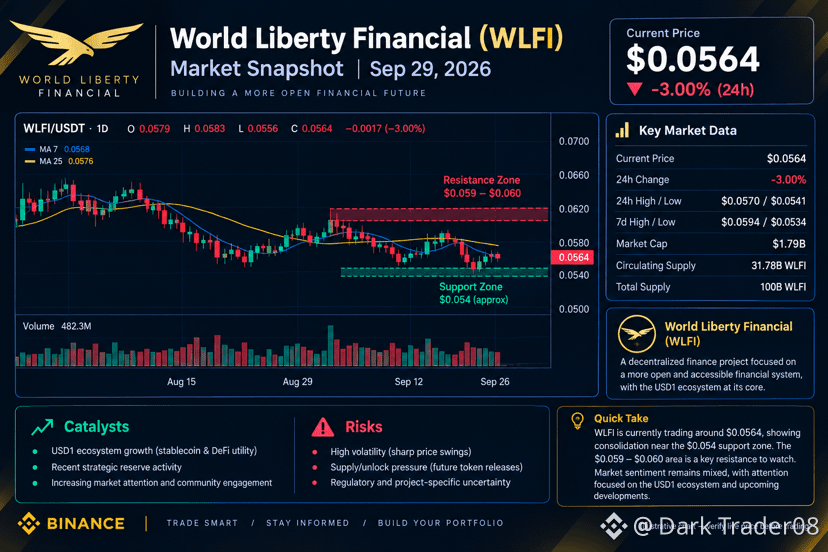
WLFI is trading around $0.0564, with recent price action showing consolidation after significant volatility. The $0.054 area is an important support zone, while $0.059–$0.060 is a key resistance area based on the recent 7-day range. (CoinMarketCap)
📈 Bullish scenario: A sustained move above $0.060 could signal stronger momentum.
📉 Bearish scenario: Losing the $0.054 support area could increase selling pressure.
🔥 Catalysts: Growth of the USD1 ecosystem, recent strategic-reserve activity and continued market attention around WLFI. (CoinGecko)
⚠️ Risk: WLFI remains highly volatile, and its large total supply of 100B tokens means supply/unlock dynamics are important to monitor. (CoinMarketCap)
Bottom line: WLFI is currently at a key technical area. Traders should watch $0.054 support and $0.060 resistance for the next significant move.#ChainlinkLaunchesCCIP2WithEnterpriseVerification #UKFCAWinsCourtOrderToRecover851400Pounds
{spot}(WLFIUSDT)
🔥 $WLFI (World Liberty Financial) — Latest Market Analysis
WLFI is trading around $0.0564, with recent price action showing consolidation after significant volatility. The $0.054 area is an important support zone, while $0.059–$0.060 is a key resistance area based on the recent 7-day range. (CoinMarketCap)
📈 Bullish scenario: A sustained move above $0.060 could signal stronger momentum.
📉 Bearish scenario: Losing the $0.054 support area could increase selling pressure.
🔥 Catalysts: Growth of the USD1 ecosystem, recent strategic-reserve activity and continued market attention around WLFI. (CoinGecko)
⚠️ Risk: WLFI remains highly volatile, and its large total supply of 100B tokens means supply/unlock dynamics are important to monitor. (CoinMarketCap)
Bottom line: WLFI is currently at a key technical area. Traders should watch $0.054 support and $0.060 resistance for the next significant move.#ChainlinkLaunchesCCIP2WithEnterpriseVerification #UKFCAWinsCourtOrderToRecover851400Pounds
WLFI is trading around $0.0564, with recent price action showing consolidation after significant volatility. The $0.054 area is an important support zone, while $0.059–$0.060 is a key resistance area based on the recent 7-day range. (CoinMarketCap)
📈 Bullish scenario: A sustained move above $0.060 could signal stronger momentum.
📉 Bearish scenario: Losing the $0.054 support area could increase selling pressure.
🔥 Catalysts: Growth of the USD1 ecosystem, recent strategic-reserve activity and continued market attention around WLFI. (CoinGecko)
⚠️ Risk: WLFI remains highly volatile, and its large total supply of 100B tokens means supply/unlock dynamics are important to monitor. (CoinMarketCap)
Bottom line: WLFI is currently at a key technical area. Traders should watch $0.054 support and $0.060 resistance for the next significant move.#ChainlinkLaunchesCCIP2WithEnterpriseVerification #UKFCAWinsCourtOrderToRecover851400Pounds
219
🚀 $ETH — Short-Term Market Outlook
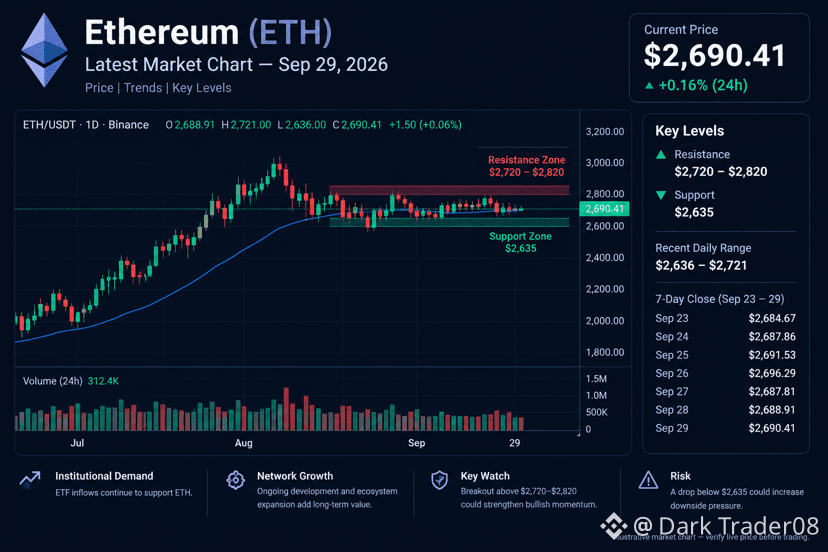
ETH is currently trading near $2,690 and has shown resilience despite the recent crypto-market correction. Recent Ethereum ETF inflows suggest continued institutional interest, while ETH has been holding around the $2,635 support area.
📊 Key levels:
• Support: ~$2,635
• Resistance: ~$2,720–$2,820
• A confirmed breakout above resistance could strengthen bullish momentum.
• A break below support could increase downside pressure.
🔥 Watch ETH closely: the combination of ETF demand and upcoming Ethereum developments makes ETH one of the major altcoins worth monitoring.#BitMineETHHoldingsTop6Million #StrategyAdds1666BTCHoldingsReach847666 #NvidiaApproves$150BBuyback #OpenAIDelaysGPT6.1OverSafetyIssues
{spot}(ETHUSDT)
🚀 $ETH — Short-Term Market Outlook
ETH is currently trading near $2,690 and has shown resilience despite the recent crypto-market correction. Recent Ethereum ETF inflows suggest continued institutional interest, while ETH has been holding around the $2,635 support area.
📊 Key levels:
• Support: ~$2,635
• Resistance: ~$2,720–$2,820
• A confirmed breakout above resistance could strengthen bullish momentum.
• A break below support could increase downside pressure.
🔥 Watch ETH closely: the combination of ETF demand and upcoming Ethereum developments makes ETH one of the major altcoins worth monitoring.#BitMineETHHoldingsTop6Million #StrategyAdds1666BTCHoldingsReach847666 #NvidiaApproves$150BBuyback #OpenAIDelaysGPT6.1OverSafetyIssues
ETH is currently trading near $2,690 and has shown resilience despite the recent crypto-market correction. Recent Ethereum ETF inflows suggest continued institutional interest, while ETH has been holding around the $2,635 support area.
📊 Key levels:
• Support: ~$2,635
• Resistance: ~$2,720–$2,820
• A confirmed breakout above resistance could strengthen bullish momentum.
• A break below support could increase downside pressure.
🔥 Watch ETH closely: the combination of ETF demand and upcoming Ethereum developments makes ETH one of the major altcoins worth monitoring.#BitMineETHHoldingsTop6Million #StrategyAdds1666BTCHoldingsReach847666 #NvidiaApproves$150BBuyback #OpenAIDelaysGPT6.1OverSafetyIssues
78
$SOL 🔥🔥🔥— latest quick analysis
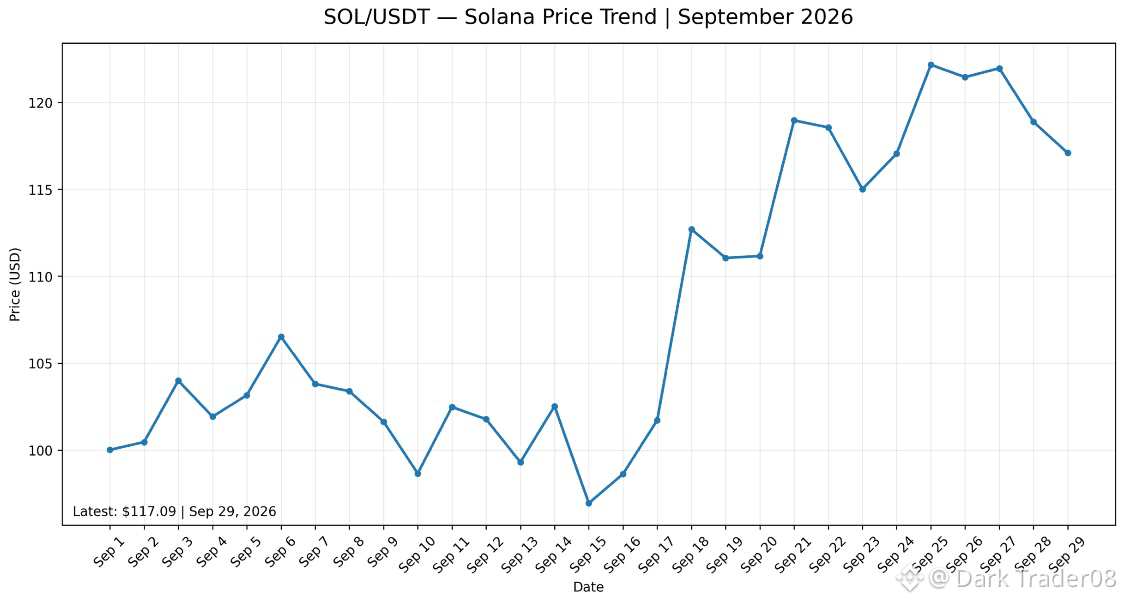
As of September 29, 2026, SOL is around $116.60, down about 4% in 24 hours, with a market cap of roughly $68.5B.
Solana ETFs recorded about $86.7M of inflows on September 25, with cumulative net inflows around $1.62B according to SolanaFloor’s tracker.
* ⚡ Network upgrades: Solana’s Alpenglow upgrade is targeting much faster transaction finality, potentially around 150 milliseconds, although the mainnet timing has been subject to clarification.
* 🔥 Network usage: Recent reports indicate monthly Solana transactions surpassed 5 billion, showing substantial network activity.
* ⚠️ Short-term risk: SOL has pulled back from its recent highs, while broader crypto markets face pressure from elevated U.S. Treasury yields and oil prices.
Bottom line: SOL currently has a combination of high network activity, institutional ETF demand, and major protocol upgrades, but its ~4% daily decline shows that volatility remains high. The $100–$120 area is worth watching for how the market develops next. #solanAnalysis #ChainlinkLaunchesCCIP2WithEnterpriseVerification
{spot}(SOLUSDT)
$SOL 🔥🔥🔥— latest quick analysis
As of September 29, 2026, SOL is around $116.60, down about 4% in 24 hours, with a market cap of roughly $68.5B.
Solana ETFs recorded about $86.7M of inflows on September 25, with cumulative net inflows around $1.62B according to SolanaFloor’s tracker.
* ⚡ Network upgrades: Solana’s Alpenglow upgrade is targeting much faster transaction finality, potentially around 150 milliseconds, although the mainnet timing has been subject to clarification.
* 🔥 Network usage: Recent reports indicate monthly Solana transactions surpassed 5 billion, showing substantial network activity.
* ⚠️ Short-term risk: SOL has pulled back from its recent highs, while broader crypto markets face pressure from elevated U.S. Treasury yields and oil prices.
Bottom line: SOL currently has a combination of high network activity, institutional ETF demand, and major protocol upgrades, but its ~4% daily decline shows that volatility remains high. The $100–$120 area is worth watching for how the market develops next. #solanAnalysis #ChainlinkLaunchesCCIP2WithEnterpriseVerification
As of September 29, 2026, SOL is around $116.60, down about 4% in 24 hours, with a market cap of roughly $68.5B.
Solana ETFs recorded about $86.7M of inflows on September 25, with cumulative net inflows around $1.62B according to SolanaFloor’s tracker.
* ⚡ Network upgrades: Solana’s Alpenglow upgrade is targeting much faster transaction finality, potentially around 150 milliseconds, although the mainnet timing has been subject to clarification.
* 🔥 Network usage: Recent reports indicate monthly Solana transactions surpassed 5 billion, showing substantial network activity.
* ⚠️ Short-term risk: SOL has pulled back from its recent highs, while broader crypto markets face pressure from elevated U.S. Treasury yields and oil prices.
Bottom line: SOL currently has a combination of high network activity, institutional ETF demand, and major protocol upgrades, but its ~4% daily decline shows that volatility remains high. The $100–$120 area is worth watching for how the market develops next. #solanAnalysis #ChainlinkLaunchesCCIP2WithEnterpriseVerification
90
$BTC #BitMineETHHoldingsTop6Million #StrategyAdds1666BTCHoldingsReach847666 #ChainlinkLaunchesCCIP2WithEnterpriseVerification — latest analysis
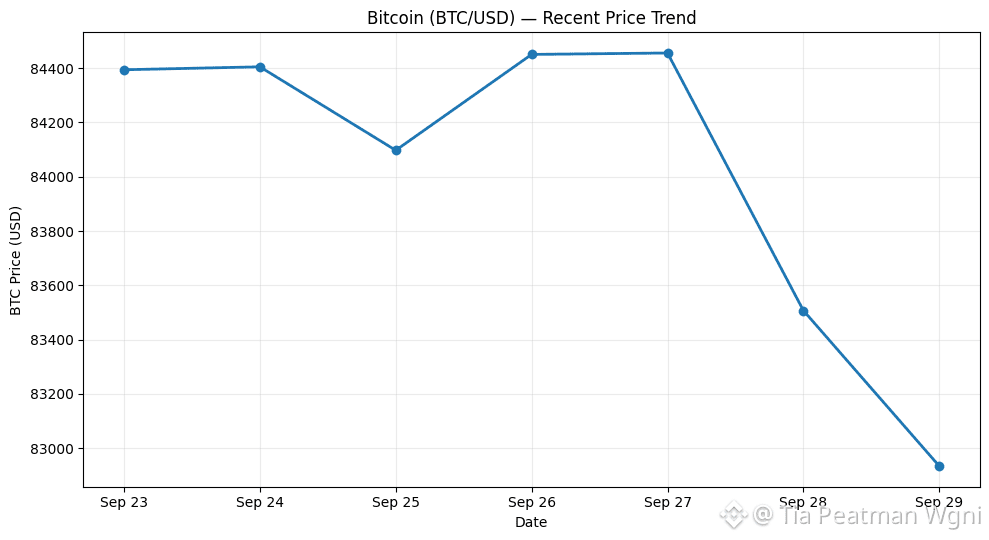
As of September 29, 2026, Bitcoin is trading around $83,000, down roughly 0.7% over 24 hours.
What the chart shows: BTC has pulled back from the $86K+ area reached earlier in September. Higher U.S. Treasury yields are currently putting pressure on risk assets, while BTC’s recent decline has extended to several sessions.
Key levels:
* Support: around $82K–$83K
* Near-term resistance: roughly $84K–$86K
* A sustained move above $86K would change the short-term technical picture; losing the $82K area would indicate additional downside pressure.
There are also constructive factors: Binance Research reports that spot Bitcoin ETF flows have recently turned positive, including a $999M single-day inflow on September 21, while BTC has reclaimed its 50-week moving average.
Bottom line: BTC is currently in a pullback/consolidation phase around $83K, with macro conditions—particularly Treasury yields—and continued ETF demand likely to remain important near-term drivers. This is market analysis, not a prediction or investment recommendation.
$BTC #BitMineETHHoldingsTop6Million #StrategyAdds1666BTCHoldingsReach847666 #ChainlinkLaunchesCCIP2WithEnterpriseVerification — latest analysis
As of September 29, 2026, Bitcoin is trading around $83,000, down roughly 0.7% over 24 hours.
What the chart shows: BTC has pulled back from the $86K+ area reached earlier in September. Higher U.S. Treasury yields are currently putting pressure on risk assets, while BTC’s recent decline has extended to several sessions.
Key levels:
* Support: around $82K–$83K
* Near-term resistance: roughly $84K–$86K
* A sustained move above $86K would change the short-term technical picture; losing the $82K area would indicate additional downside pressure.
There are also constructive factors: Binance Research reports that spot Bitcoin ETF flows have recently turned positive, including a $999M single-day inflow on September 21, while BTC has reclaimed its 50-week moving average.
Bottom line: BTC is currently in a pullback/consolidation phase around $83K, with macro conditions—particularly Treasury yields—and continued ETF demand likely to remain important near-term drivers. This is market analysis, not a prediction or investment recommendation.
As of September 29, 2026, Bitcoin is trading around $83,000, down roughly 0.7% over 24 hours.
What the chart shows: BTC has pulled back from the $86K+ area reached earlier in September. Higher U.S. Treasury yields are currently putting pressure on risk assets, while BTC’s recent decline has extended to several sessions.
Key levels:
* Support: around $82K–$83K
* Near-term resistance: roughly $84K–$86K
* A sustained move above $86K would change the short-term technical picture; losing the $82K area would indicate additional downside pressure.
There are also constructive factors: Binance Research reports that spot Bitcoin ETF flows have recently turned positive, including a $999M single-day inflow on September 21, while BTC has reclaimed its 50-week moving average.
Bottom line: BTC is currently in a pullback/consolidation phase around $83K, with macro conditions—particularly Treasury yields—and continued ETF demand likely to remain important near-term drivers. This is market analysis, not a prediction or investment recommendation.
84
Log in to explore more content
Join global crypto users on Binance Square
⚡️ Get latest and useful information about crypto.
💬 Trusted by the world’s largest crypto exchange.
👍 Discover real insights from verified creators.
Email / Phone number