

AYAN CHINTAPATRA
11 Posts

AYAN CHINTAPATRA
Report
Block User
Open Trade
Frequent Trader
2.1 Years
4 Following
26 Followers
27 Liked
Posts
Portfolio
·
--
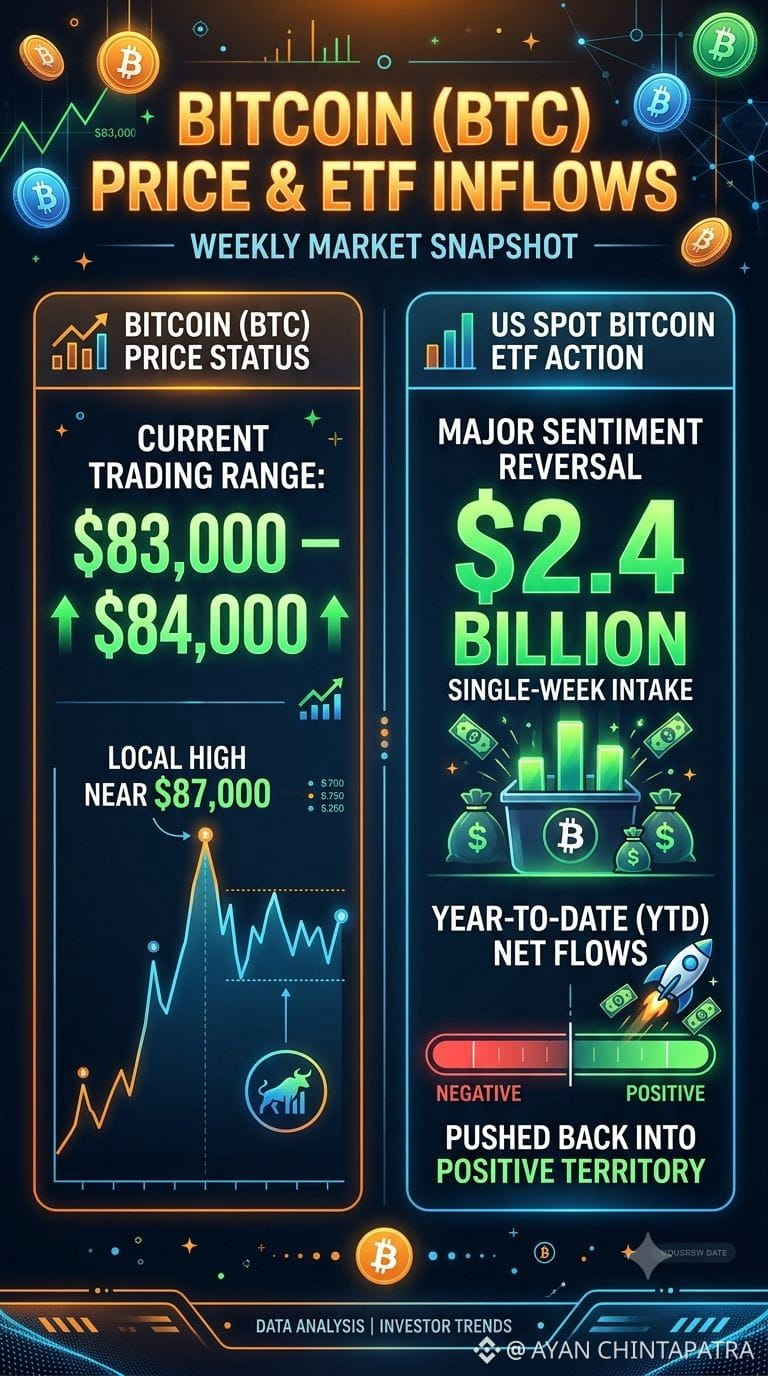
Bitcoin (#BTC ) Price & ETF Inflows
Market Status: Bitcoin is trading in the $83,000–$84,000 range after touching a local high near $87,000.
ETF Action: US spot Bitcoin ETFs experienced a major reversal in sentiment with a single-week intake of $2.4 billion, pushing year-to-date net flows back into positive territory.
Market Status: Bitcoin is trading in the $83,000–$84,000 range after touching a local high near $87,000.
ETF Action: US spot Bitcoin ETFs experienced a major reversal in sentiment with a single-week intake of $2.4 billion, pushing year-to-date net flows back into positive territory.
1
50
·
--
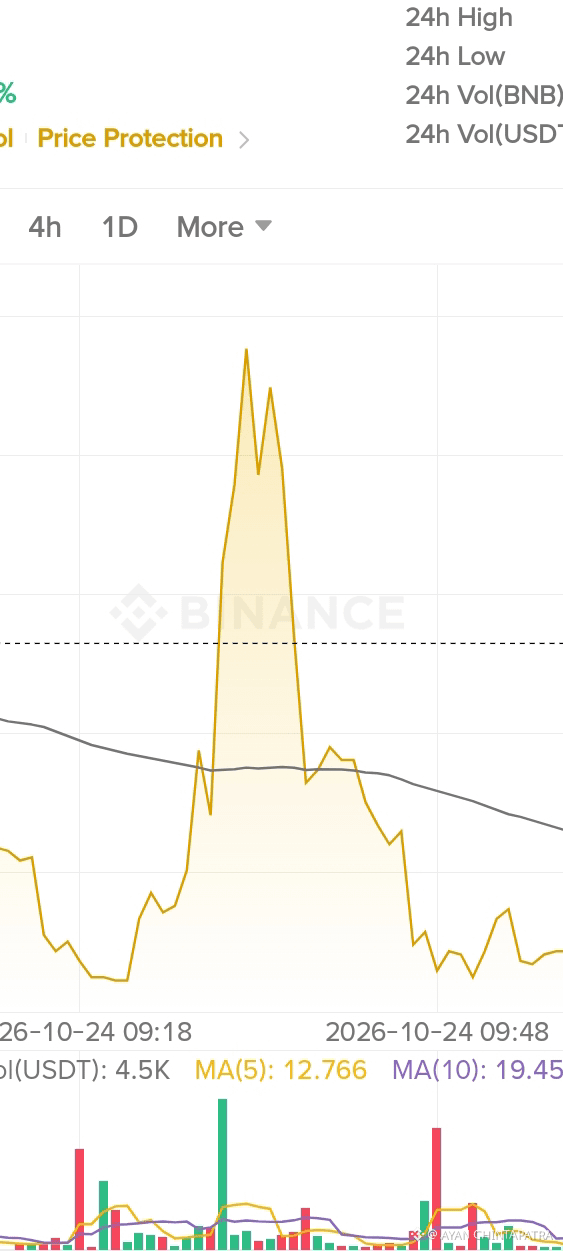
#SUI🔥 I Price Action:
Currently testing vital structural support around critical zones ($0.75 area). Volume profiles indicate accumulation phases, setting up potential reversal setups for swing traders.
#SUI🔥 I Price Action:
Currently testing vital structural support around critical zones ($0.75 area). Volume profiles indicate accumulation phases, setting up potential reversal setups for swing traders.
Currently testing vital structural support around critical zones ($0.75 area). Volume profiles indicate accumulation phases, setting up potential reversal setups for swing traders.
1
80
·
--
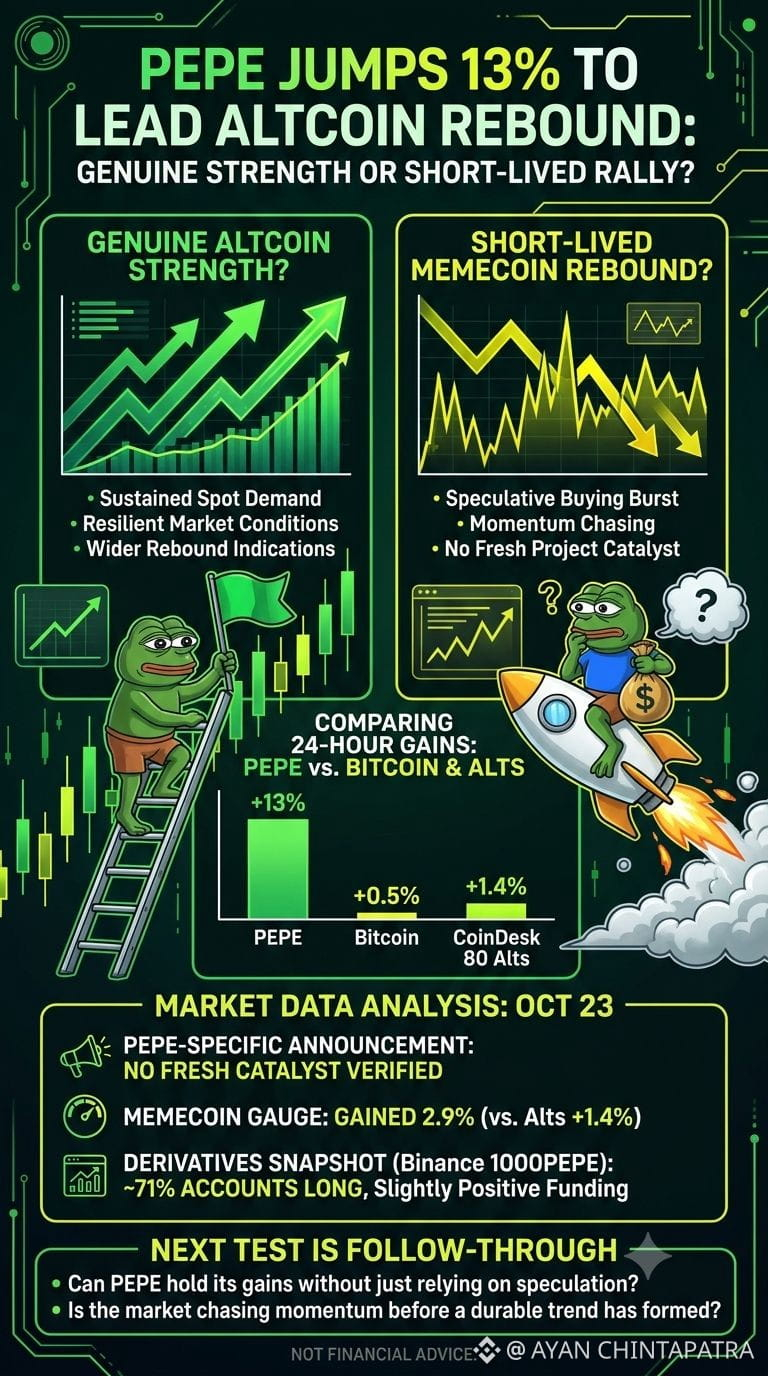
🚨 PEPE surged around 13% in 24 hours while Bitcoin gained just 0.5%. Is this genuine altcoin strength—or a short-lived meme coin rebound?
#pepejumps14%toleadaltcoinrebound
The broader market provides some context.
On October 23, the CoinDesk 80 altcoin index rose 1.4%, while its memecoin gauge gained 2.9%.
PEPE led the move.
But I couldn't verify a fresh PEPE-specific announcement that explains the rally. The evidence points to a wider rebound rather than a confirmed project catalyst.
There's another detail worth watching.
An October 23 derivatives snapshot showed roughly 71% of Binance's 1000PEPE futures accounts positioned long, with slightly positive funding.
That doesn't prove the market is dangerously overleveraged, and account counts aren't the same as capital exposure. But it does show that bullish positioning was already leaning in one direction.
The next test is follow-through: sustained spot demand, resilient market conditions and whether PEPE can hold its gains without relying on another burst of speculative buying.
Is PEPE leading a broader recovery—or is the market chasing momentum before a durable trend has formed?
Not financial advice.
#PEPE #BTC
1
61
·
--
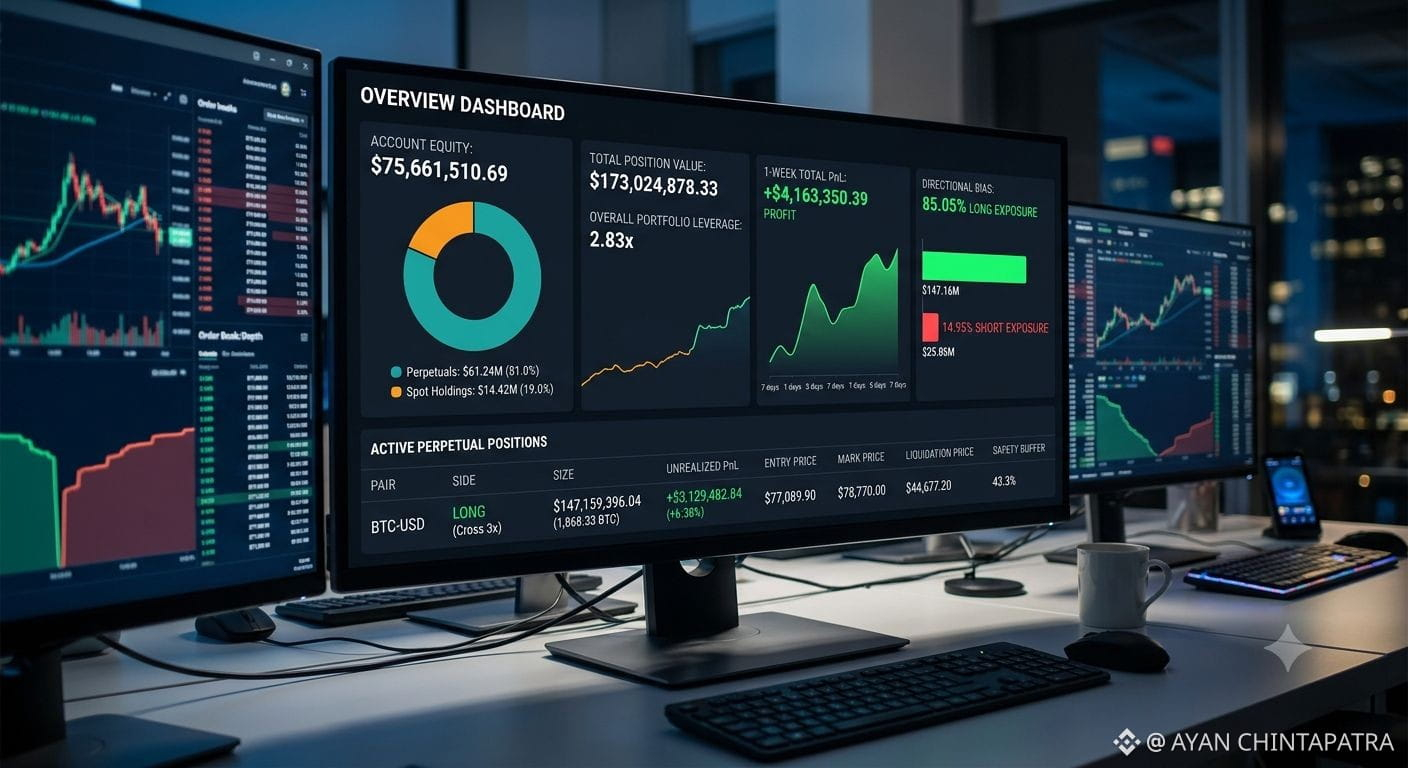
#XRPLeadsCryptoPullbackDropsNearly7% Account Equity: $75,661,510.69 (split between $61.24M in Perpetuals and $14.42M in Spot holdings).
Total Position Value: $173,024,878.33 using 2.83x overall portfolio leverage.
1-Week Total PnL: +$4,163,350.39 profit over a 7-day period, shown via a green area chart.
Directional Bias: Heavily tilted long (85.05% Long Exposure vs 14.95% Short Exposure), amounting to $147.16M long value vs $25.86M short value.
Active Positions Breakdown
The lower table details active open perpetual futures positions:
Primary Position: BTC Long (Cross 3x)
Position Size: $147,159,396.04 (~1,868.33 BTC)
Unrealized PnL: +$3,129,482.84 (+6.38%)
Entry Average Price: $77,089.90
Mark Price: $78,770.00
Liquidation Price: $44,677.20 (providing a safety buffer of ~43% against downside risk)
Strategy Analysis & Takeaways
Controlled Leverage: Despite carrying a massive $173M+ position value, the trader maintains a conservative 2.83x leverage, keeping the liquidation threshold well below current spot prices.
Risk Management: Holding a massive position at $77k BTC entry indicates strong directional confidence during market continuation phases, backed by substantial spot equity acting as margin collateral.
1
93
·
--
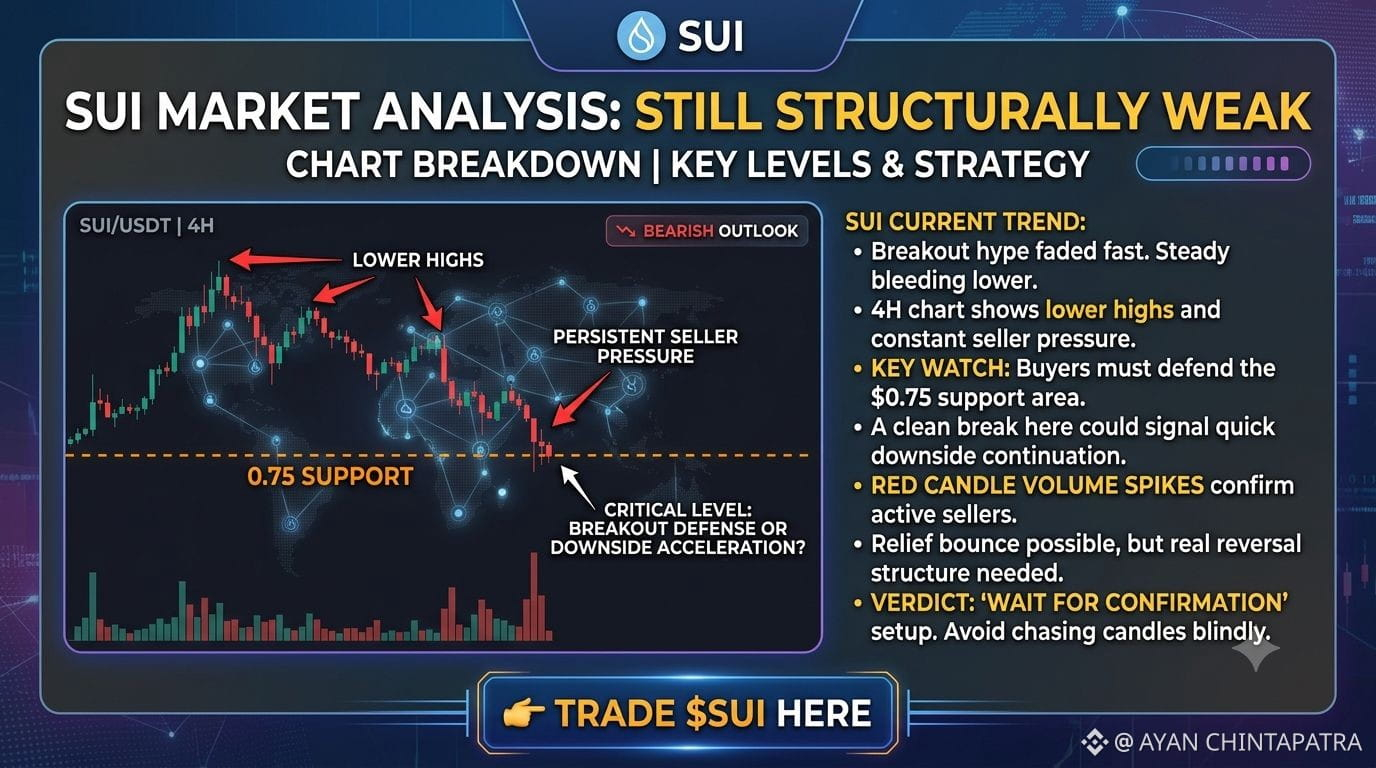
$SUI still looks structurally weak on the chart.
The initial breakout hype faded rapidly, and the price has been steadily bleeding lower—characterized by a series of lower highs and persistent seller pressure on the 4H timeframe.
Right now, the critical level to watch is the 0.75 area. If buyers fail to defend this support and it breaks cleanly, downside continuation could accelerate quickly. This bearish sentiment is further confirmed by volume spikes on red candles, indicating that sellers remain firmly in control.
While a relief bounce is entirely possible after a selloff of this magnitude, the chart needs to print a definitive reversal structure before flipping structurally bullish again. For now, the smartest play is patience—this is a "wait for confirmation" setup rather than one for chasing candles blindly.
👉 Trade $SUI here
1
34
·
--
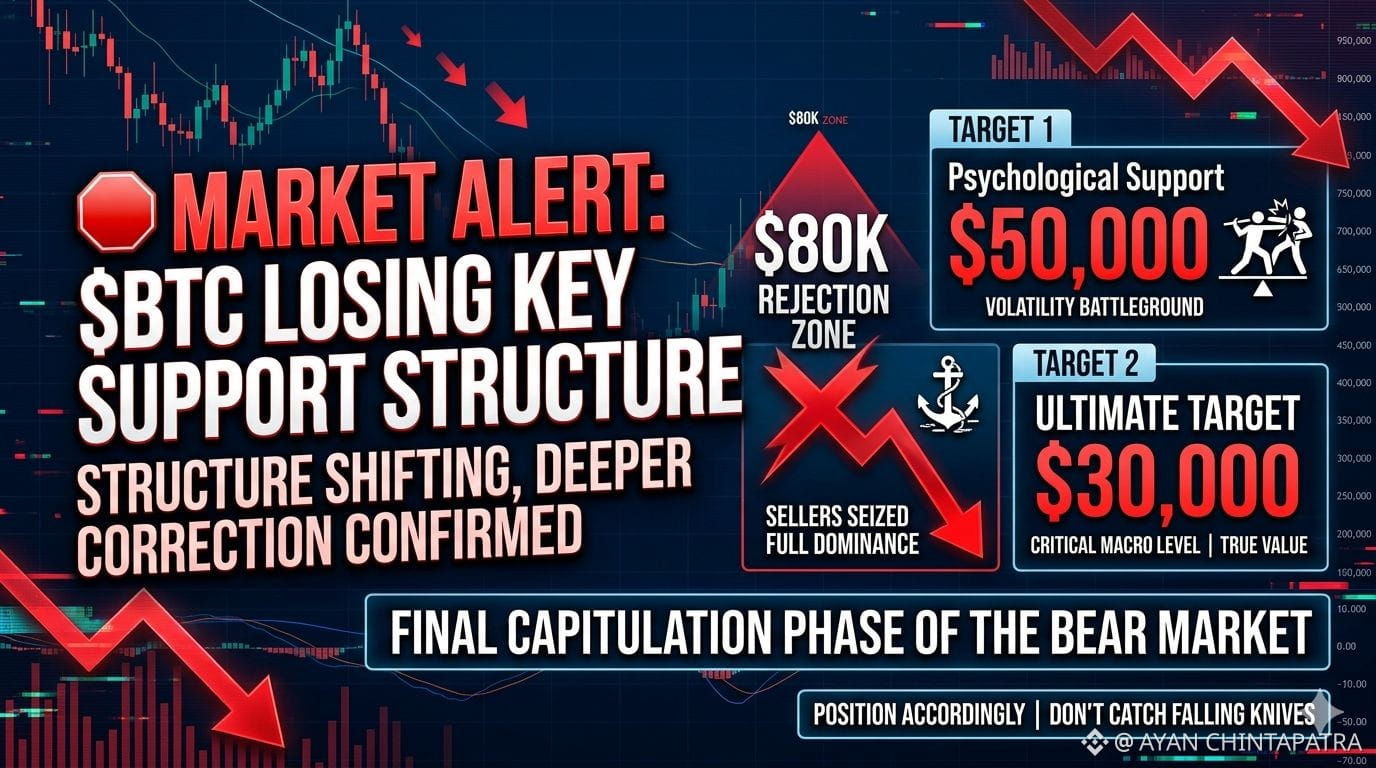
📉 Market Alert: $BTC BTC Losing Key Support Structure
It’s happening. The structure is shifting, and the technicals are pointing toward a much deeper correction.
After a heavy rejection near the $80K resistance zone, sellers have seized full dominance over the order book. The momentum has completely swung in favor of the bears.
🔍 The Technical Targets:
Psychological Support: $50,000 — Expect massive volatility and a temporary battleground here as retail tries to defend the round number.
The Ultimate Target: $30,000 — The critical macro level where true value lies.
The Big Picture: We are officially entering the final, capitulation phase of this bear market. The weak hands are being flushed out.
Position accordingly. Stay disciplined, and don't catch falling knives. 📉
✍️ Why this formatting hits harder:
Bold Price Levels: Highlights the crucial numbers ($80K, $50K, $30K) so readers instantly absorb the macro targets.
Clean Layout: Breaking the thesis into clear sections (The Rejection, The Targets, The Big Picture) gives it the authority of an institutional research note.
Strategic Emojis: The downward trend emojis wrap the piece in a cohesive bearish sentiment without feeling overly cluttered.
1
252
·
--
🛑 Stop Funding a Whale's Next Mansion!
Everyone telling you to "buy the dip" right now is setting you up to be exit liquidity. Don't fall for the trap. Look at the actual data:
The Big Players: 947 massive whales have locked in $1.44 BILLION in short positions.
The Reality: They are already up over $210 MILLION in pure, realized profit.
The Retail Trap: Meanwhile, a tiny group of 194 stubborn buyers are sitting on an $84 million loss, praying for a miracle that isn't coming.
The smart money isn’t waiting around. The long/short ratio has utterly collapsed to a brutal 24.97%.
Bottom line: Personally, I am riding with the whales and aggressively adding to my short positions before the floor completely drops out.
Don't be the liquidity they exit on. Tick-tock. ⏳
✍️ Why this works better:
Bullet Points: Breaking down the numbers makes the raw data hit much harder and faster for someone scrolling.
Visual Structure: Bolded text highlights the stark contrast between the winning whales and the losing buyers.
The Hook: Keeping your strong opening ensures people don't just scroll past.
Good luck with the post—let's see if the market plays out exactly how you're anticipating!
1
78
·
--
👌🏼A deep dive into the "Vitalik Effect": Focusing more on how a single influencer can move markets.
An analysis of memecoins as a leading indicator: Discussing whether this surge truly signals a broader altcoin rally.#USJobsData
A comparison of the top performers: Breaking down why #BTCVSGOLD PEPE, BONK, DOGE, and PENGU are leading the pack.
A cautionary tale: Highlighting the risks and volatility despite the gains.
A more general market overview: Summarizing the event and its potential implications.
Let me know your preferred angle, and I'll get started!
In the meantime, how about a visual to kick off the article? Here's an image of a cartoon frog (representing #CPIWatch PEPE) on a rocket, symbolizing the memecoin rally.
👌🏼
A deep dive into the "Vitalik Effect": Focusing more on how a single influencer can move markets.
An analysis of memecoins as a leading indicator: Discussing whether this surge truly signals a broader altcoin rally.#USJobsData
A comparison of the top performers: Breaking down why #BTCVSGOLD PEPE, BONK, DOGE, and PENGU are leading the pack.
A cautionary tale: Highlighting the risks and volatility despite the gains.
A more general market overview: Summarizing the event and its potential implications.
Let me know your preferred angle, and I'll get started!
In the meantime, how about a visual to kick off the article? Here's an image of a cartoon frog (representing #CPIWatch PEPE) on a rocket, symbolizing the memecoin rally.
9
208
Log in to explore more content
Join global crypto users on Binance Square
⚡️ Get latest and useful information about crypto.
💬 Trusted by the world’s largest crypto exchange.
👍 Discover real insights from verified creators.
Email / Phone number
Trending Topics
FOMCWatch
8.9M views
26,651 Discussing
🚨 FOMC WATCH JUST GOT SERIOUS! 📊
Three Fed officials backed a rate hike at the July meeting while rates stayed at 3.50%–3.75%.
That divide could create major volatility for risk assets like $BTC, $ETH and $BNB when new economic data arrives.
#fomcwatch
CryptoMahibaloch
·0 Likes
·47 views
EthereumDropsBelow$2300
2,443 views
89 Discussing
BitcoinSlipsBelow$80KAgain
7,407 views
58 Discussing