

super_murkote
424 Posts

super_murkote
Report
Block User
24 Following
66 Followers
116 Liked
Posts
All
Quotes
·
--
Bullish
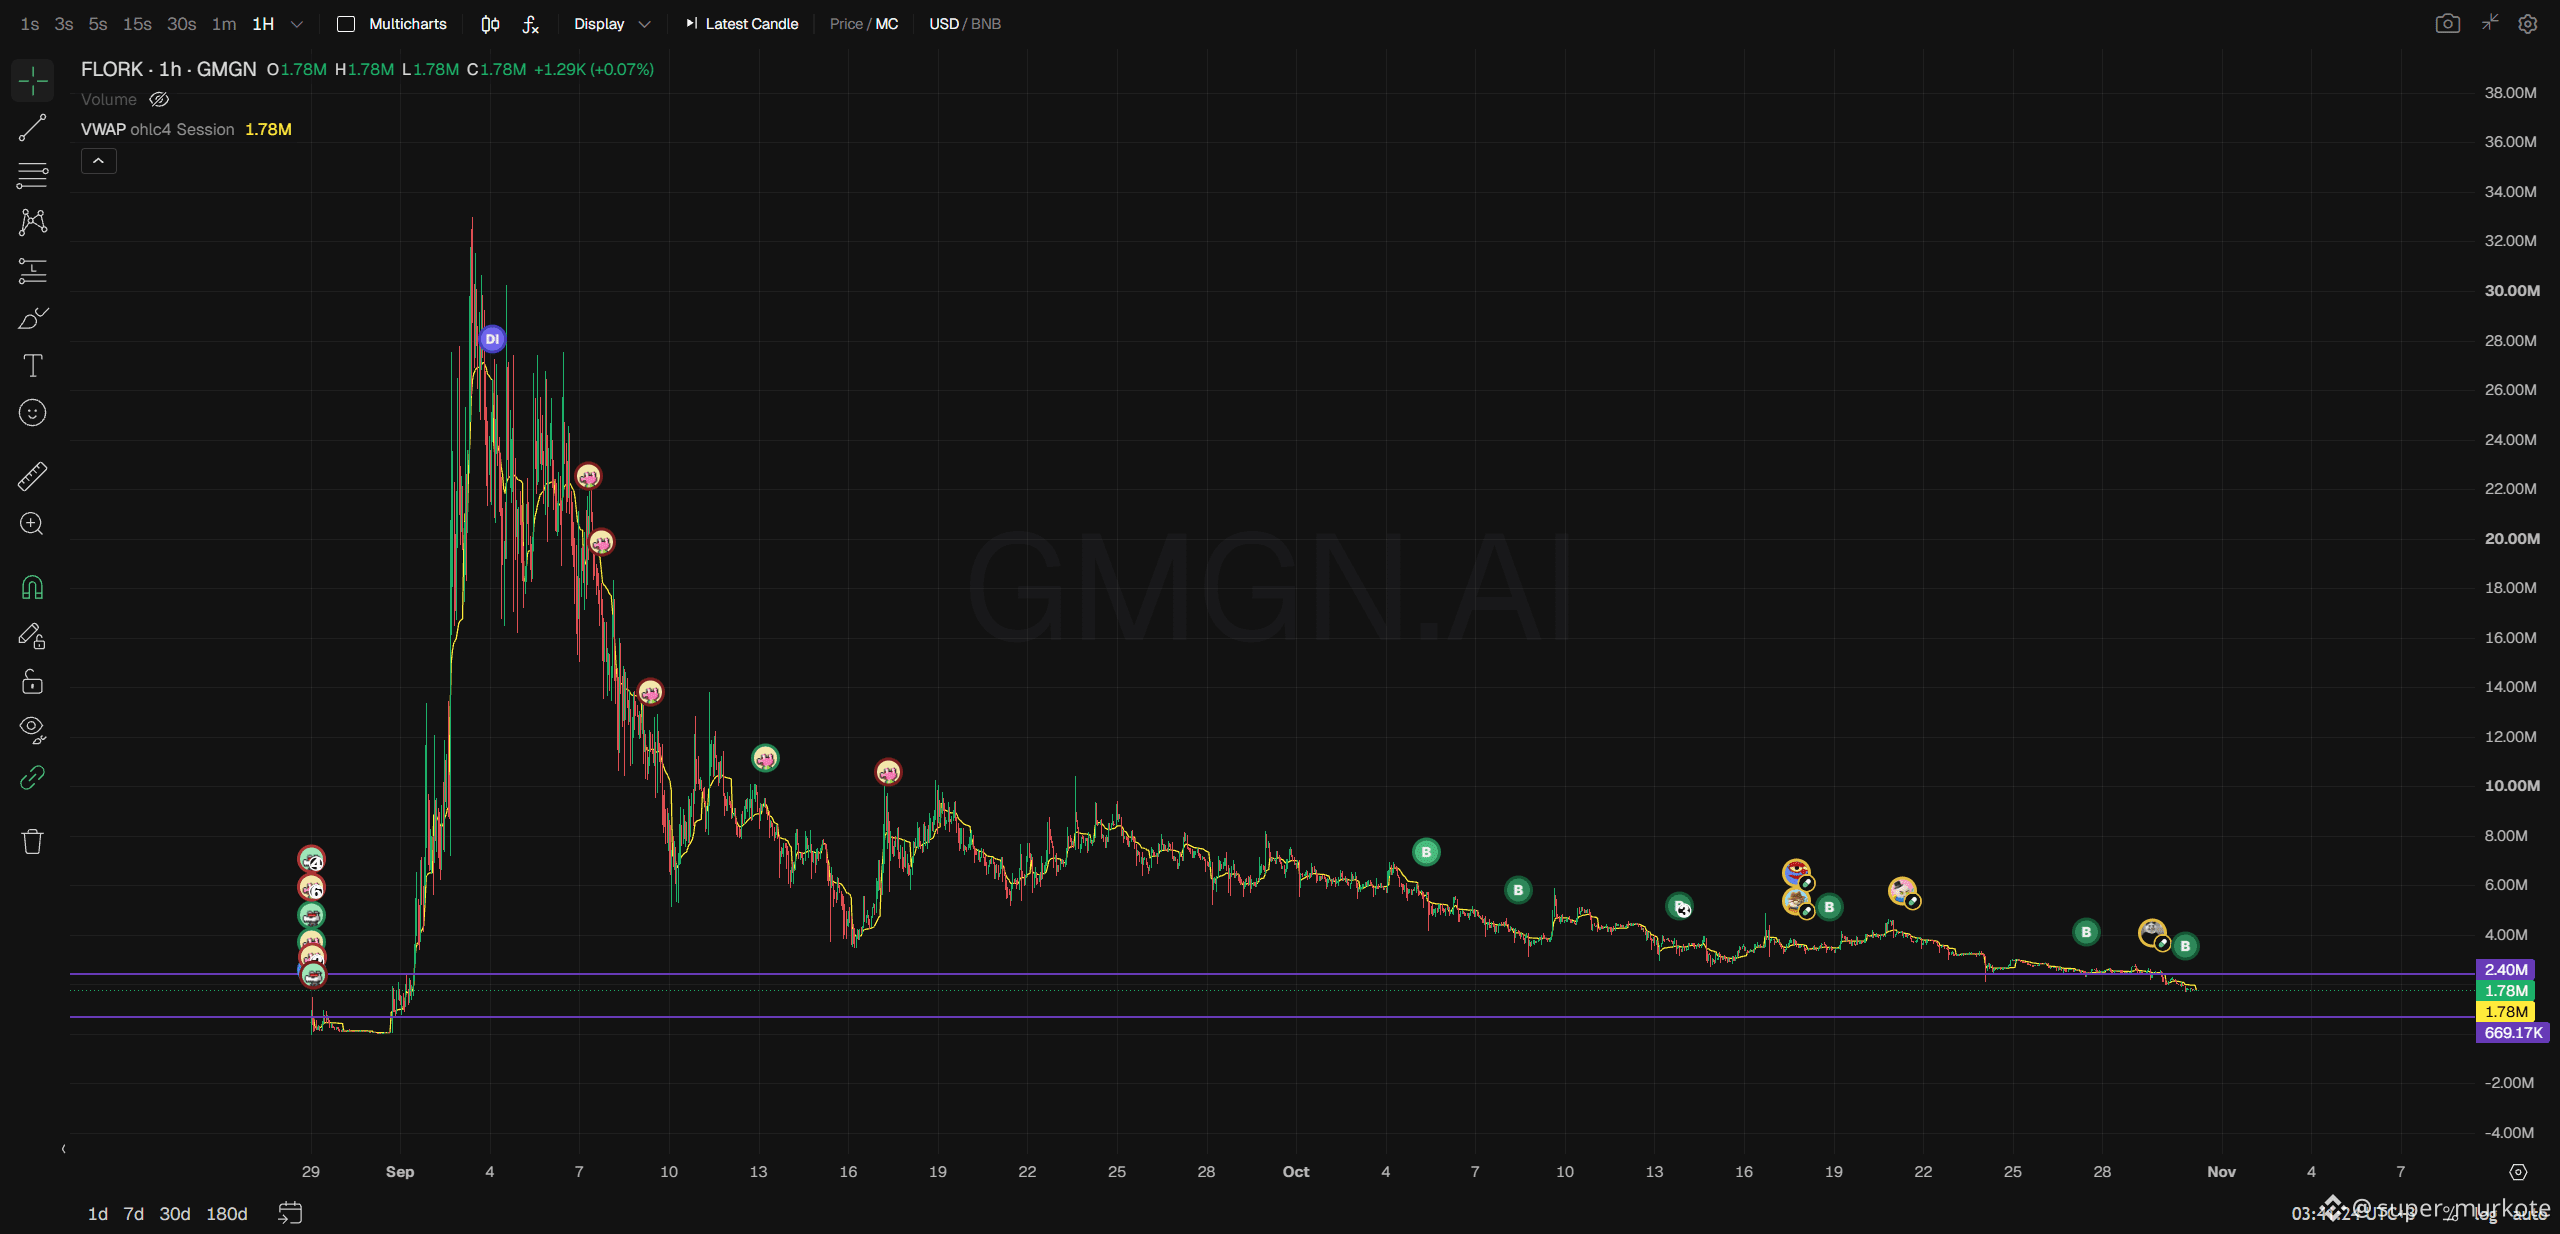
#flork The price has entered the buy zone — if, of course, you believe in this coin. 🍺🌞
Personally, I’m planning to buy more once Binance unlocks withdrawals. 😅$FLORK
I think we’ll see a strong new high, but I’m often wrong.🤷🐳
{alpha}(560xf40592daacb3e5abf358789f5688c0b4f64d7777)
#flork The price has entered the buy zone — if, of course, you believe in this coin. 🍺🌞
Personally, I’m planning to buy more once Binance unlocks withdrawals. 😅$FLORK
I think we’ll see a strong new high, but I’m often wrong.🤷🐳
Personally, I’m planning to buy more once Binance unlocks withdrawals. 😅$FLORK
I think we’ll see a strong new high, but I’m often wrong.🤷🐳
1
548
·
--
Bullish
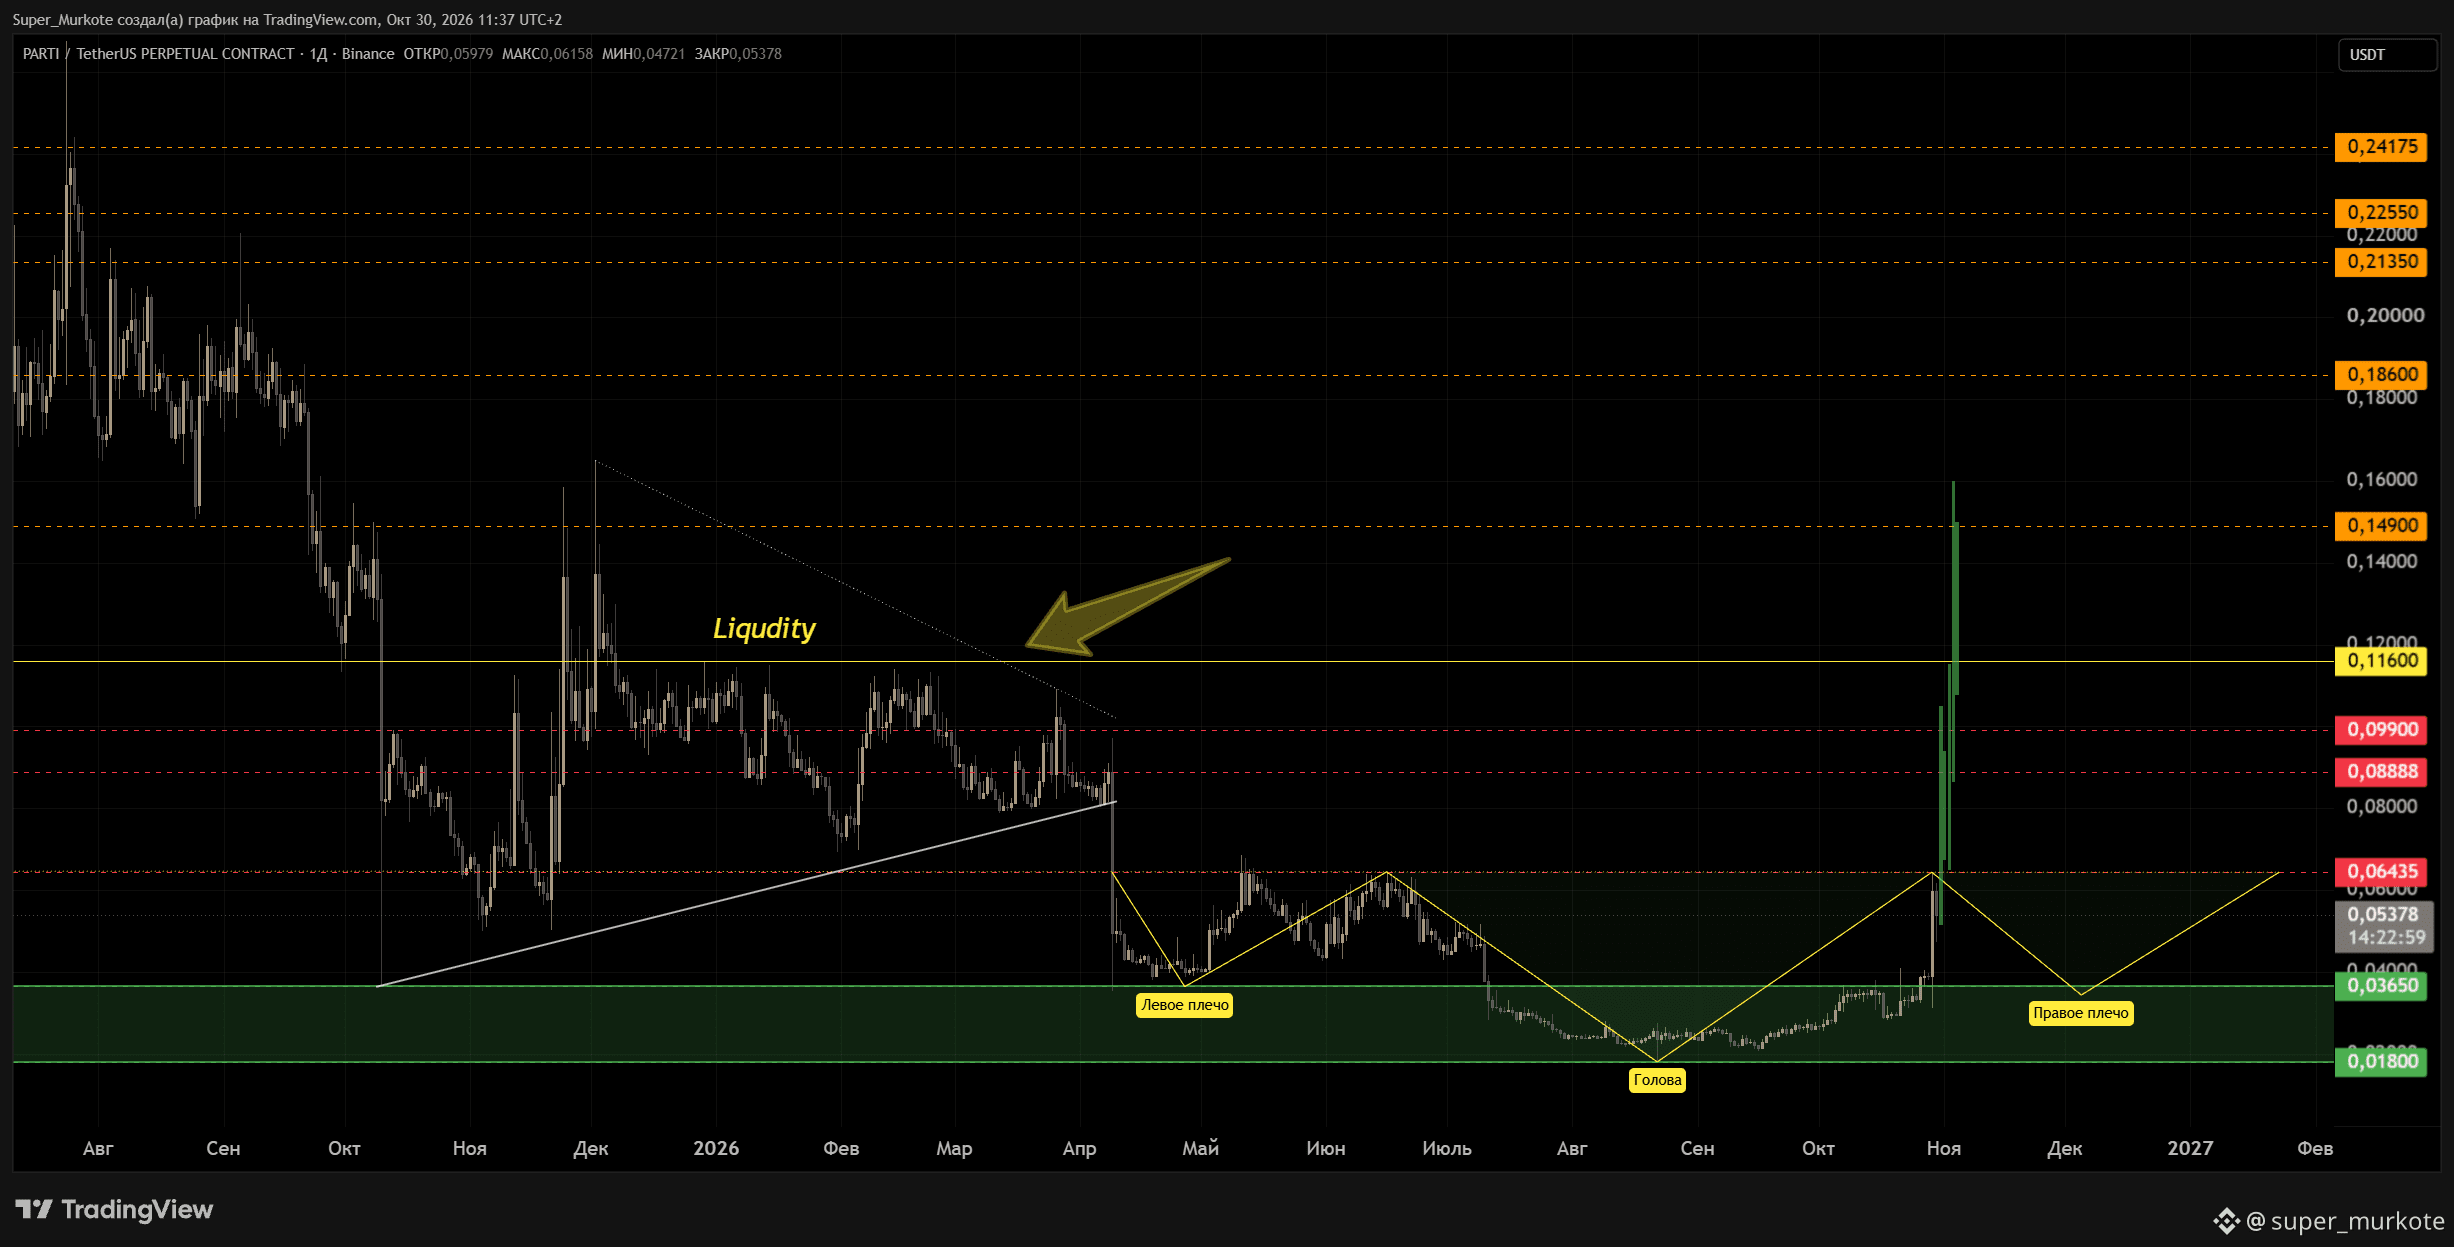
#PARTI After retesting the support zone, the price pumped a little.
From here, I’m considering two possible scenarios:
1) The pump continues.
2) A “Head and Shoulders” pattern forms.
Both scenarios share the same target: sweeping the juicy liquidity above 0.11600.🍺🌞
On the way to this target is the “Triangle” pattern completion zone, with two important levels: 0.08888–0.09900.
Key zones at the moment:
🔴 Resistance: 0.06435-0.06500
🟢 Support zone: 0.03650–0.01800
For now, it’s important to watch how the price reacts to the nearest resistance. A confident break above it would provide further support for continued growth.
As always, think for yourself and take the risks into account.
PS: There are also higher targets—they’re marked on the chart.
#PARTI After retesting the support zone, the price pumped a little.
From here, I’m considering two possible scenarios:
1) The pump continues.
2) A “Head and Shoulders” pattern forms.
Both scenarios share the same target: sweeping the juicy liquidity above 0.11600.🍺🌞
On the way to this target is the “Triangle” pattern completion zone, with two important levels: 0.08888–0.09900.
Key zones at the moment:
🔴 Resistance: 0.06435-0.06500
🟢 Support zone: 0.03650–0.01800
For now, it’s important to watch how the price reacts to the nearest resistance. A confident break above it would provide further support for continued growth.
As always, think for yourself and take the risks into account.
PS: There are also higher targets—they’re marked on the chart.
From here, I’m considering two possible scenarios:
1) The pump continues.
2) A “Head and Shoulders” pattern forms.
Both scenarios share the same target: sweeping the juicy liquidity above 0.11600.🍺🌞
On the way to this target is the “Triangle” pattern completion zone, with two important levels: 0.08888–0.09900.
Key zones at the moment:
🔴 Resistance: 0.06435-0.06500
🟢 Support zone: 0.03650–0.01800
For now, it’s important to watch how the price reacts to the nearest resistance. A confident break above it would provide further support for continued growth.
As always, think for yourself and take the risks into account.
PS: There are also higher targets—they’re marked on the chart.
205
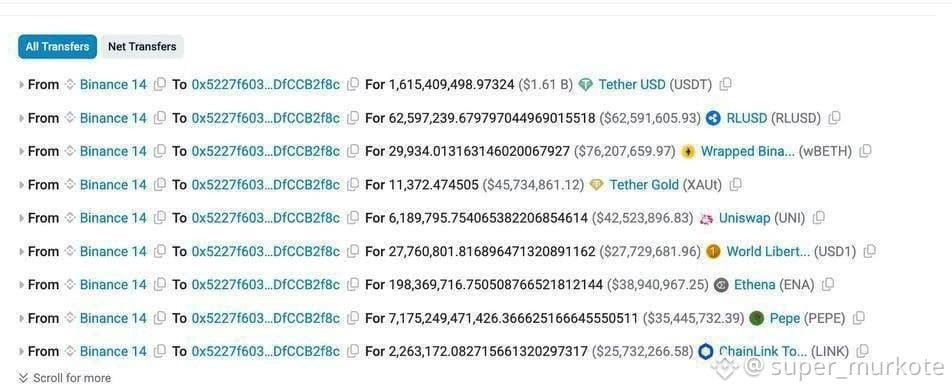
#news Reports are emerging of a possible Binance hack. A hoax has not been ruled out yet. 🤷
Markets plunged amid the rumors. 😫 Nearly $628 million in positions were liquidated in just one hour, around 97% of them longs.
Here’s what else we’ve found out:
Large amounts of ETH and USDT were transferred from Binance hot wallets 14 and 16.
The funds went to a recently created address.
The transaction trail includes a wallet funded through Tornado Cash, a service that conceals transaction history.
Some of the funds were quickly moved onward.
This is starting to look suspicious, but it still doesn’t prove that anything was stolen. 🤷
#news Reports are emerging of a possible Binance hack. A hoax has not been ruled out yet. 🤷
Markets plunged amid the rumors. 😫 Nearly $628 million in positions were liquidated in just one hour, around 97% of them longs.
Here’s what else we’ve found out:
Large amounts of ETH and USDT were transferred from Binance hot wallets 14 and 16.
The funds went to a recently created address.
The transaction trail includes a wallet funded through Tornado Cash, a service that conceals transaction history.
Some of the funds were quickly moved onward.
This is starting to look suspicious, but it still doesn’t prove that anything was stolen. 🤷
Markets plunged amid the rumors. 😫 Nearly $628 million in positions were liquidated in just one hour, around 97% of them longs.
Here’s what else we’ve found out:
Large amounts of ETH and USDT were transferred from Binance hot wallets 14 and 16.
The funds went to a recently created address.
The transaction trail includes a wallet funded through Tornado Cash, a service that conceals transaction history.
Some of the funds were quickly moved onward.
This is starting to look suspicious, but it still doesn’t prove that anything was stolen. 🤷
1.7k
·
--
Bullish
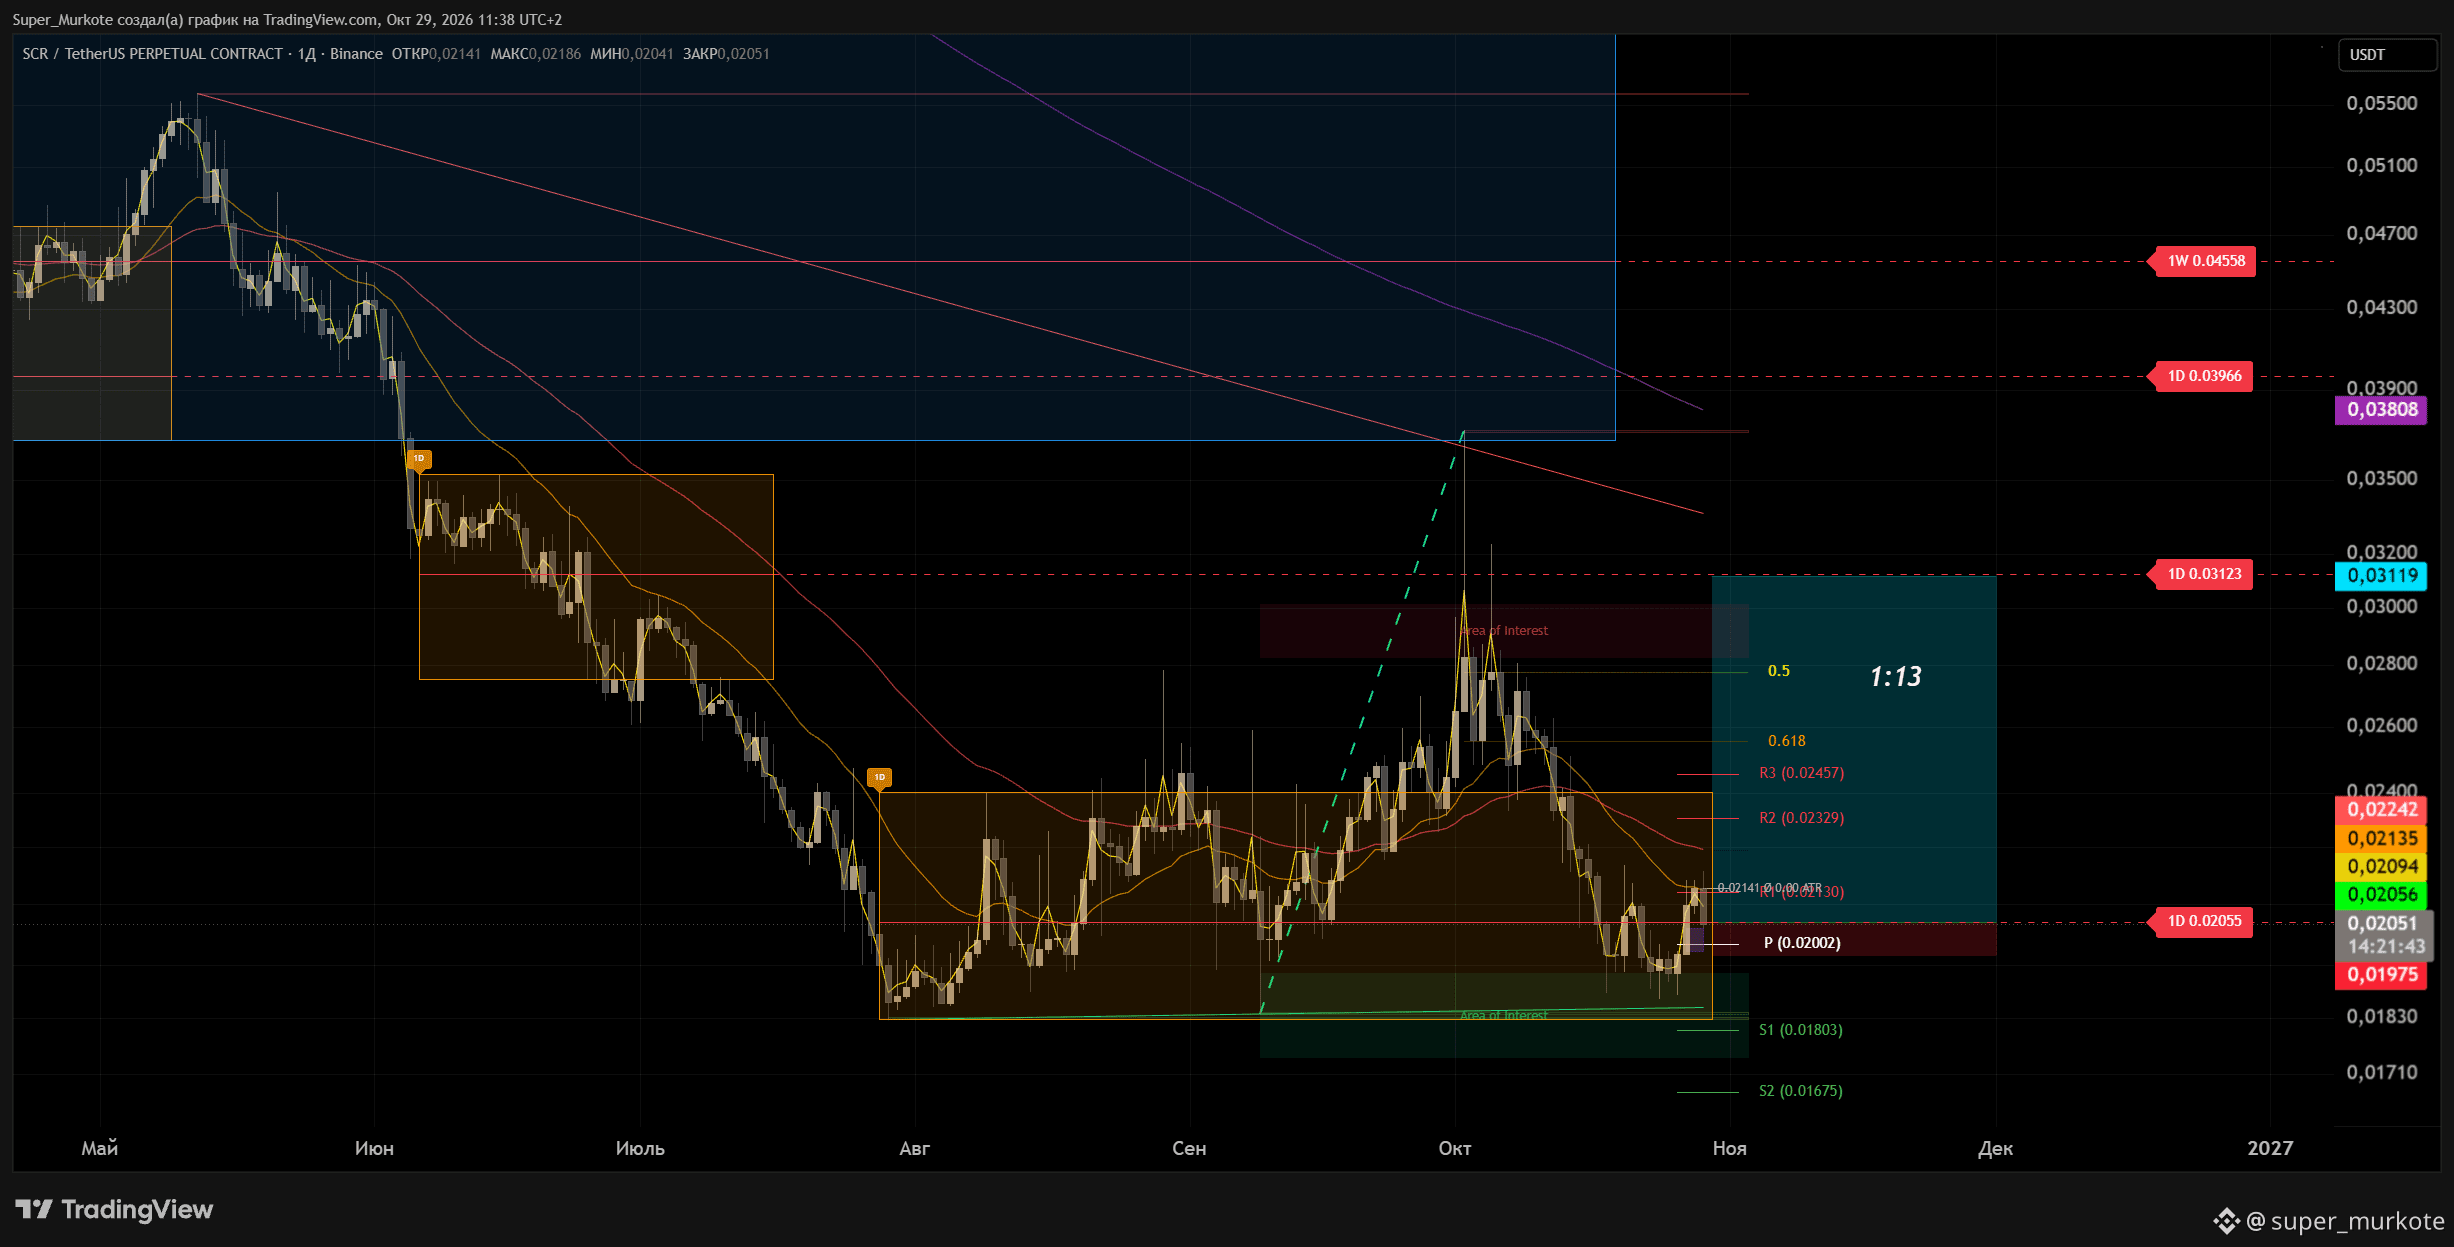
#SCR Price closed the daily candle above the daily POC at 0.02055 and is above the weekly P, indicating a potential continuation of the uptrend.
The target is the descending trendline, where the daily POC is also located at 0.03123.
The risk/reward ratio is 1:13.🍺🌞
The scenario is invalidated if the price falls below the weekly P and the low of the daily candle that closed above the daily POC at 0.02055.
#SCR Price closed the daily candle above the daily POC at 0.02055 and is above the weekly P, indicating a potential continuation of the uptrend.
The target is the descending trendline, where the daily POC is also located at 0.03123.
The risk/reward ratio is 1:13.🍺🌞
The scenario is invalidated if the price falls below the weekly P and the low of the daily candle that closed above the daily POC at 0.02055.
The target is the descending trendline, where the daily POC is also located at 0.03123.
The risk/reward ratio is 1:13.🍺🌞
The scenario is invalidated if the price falls below the weekly P and the low of the daily candle that closed above the daily POC at 0.02055.
171
·
--
Bullish
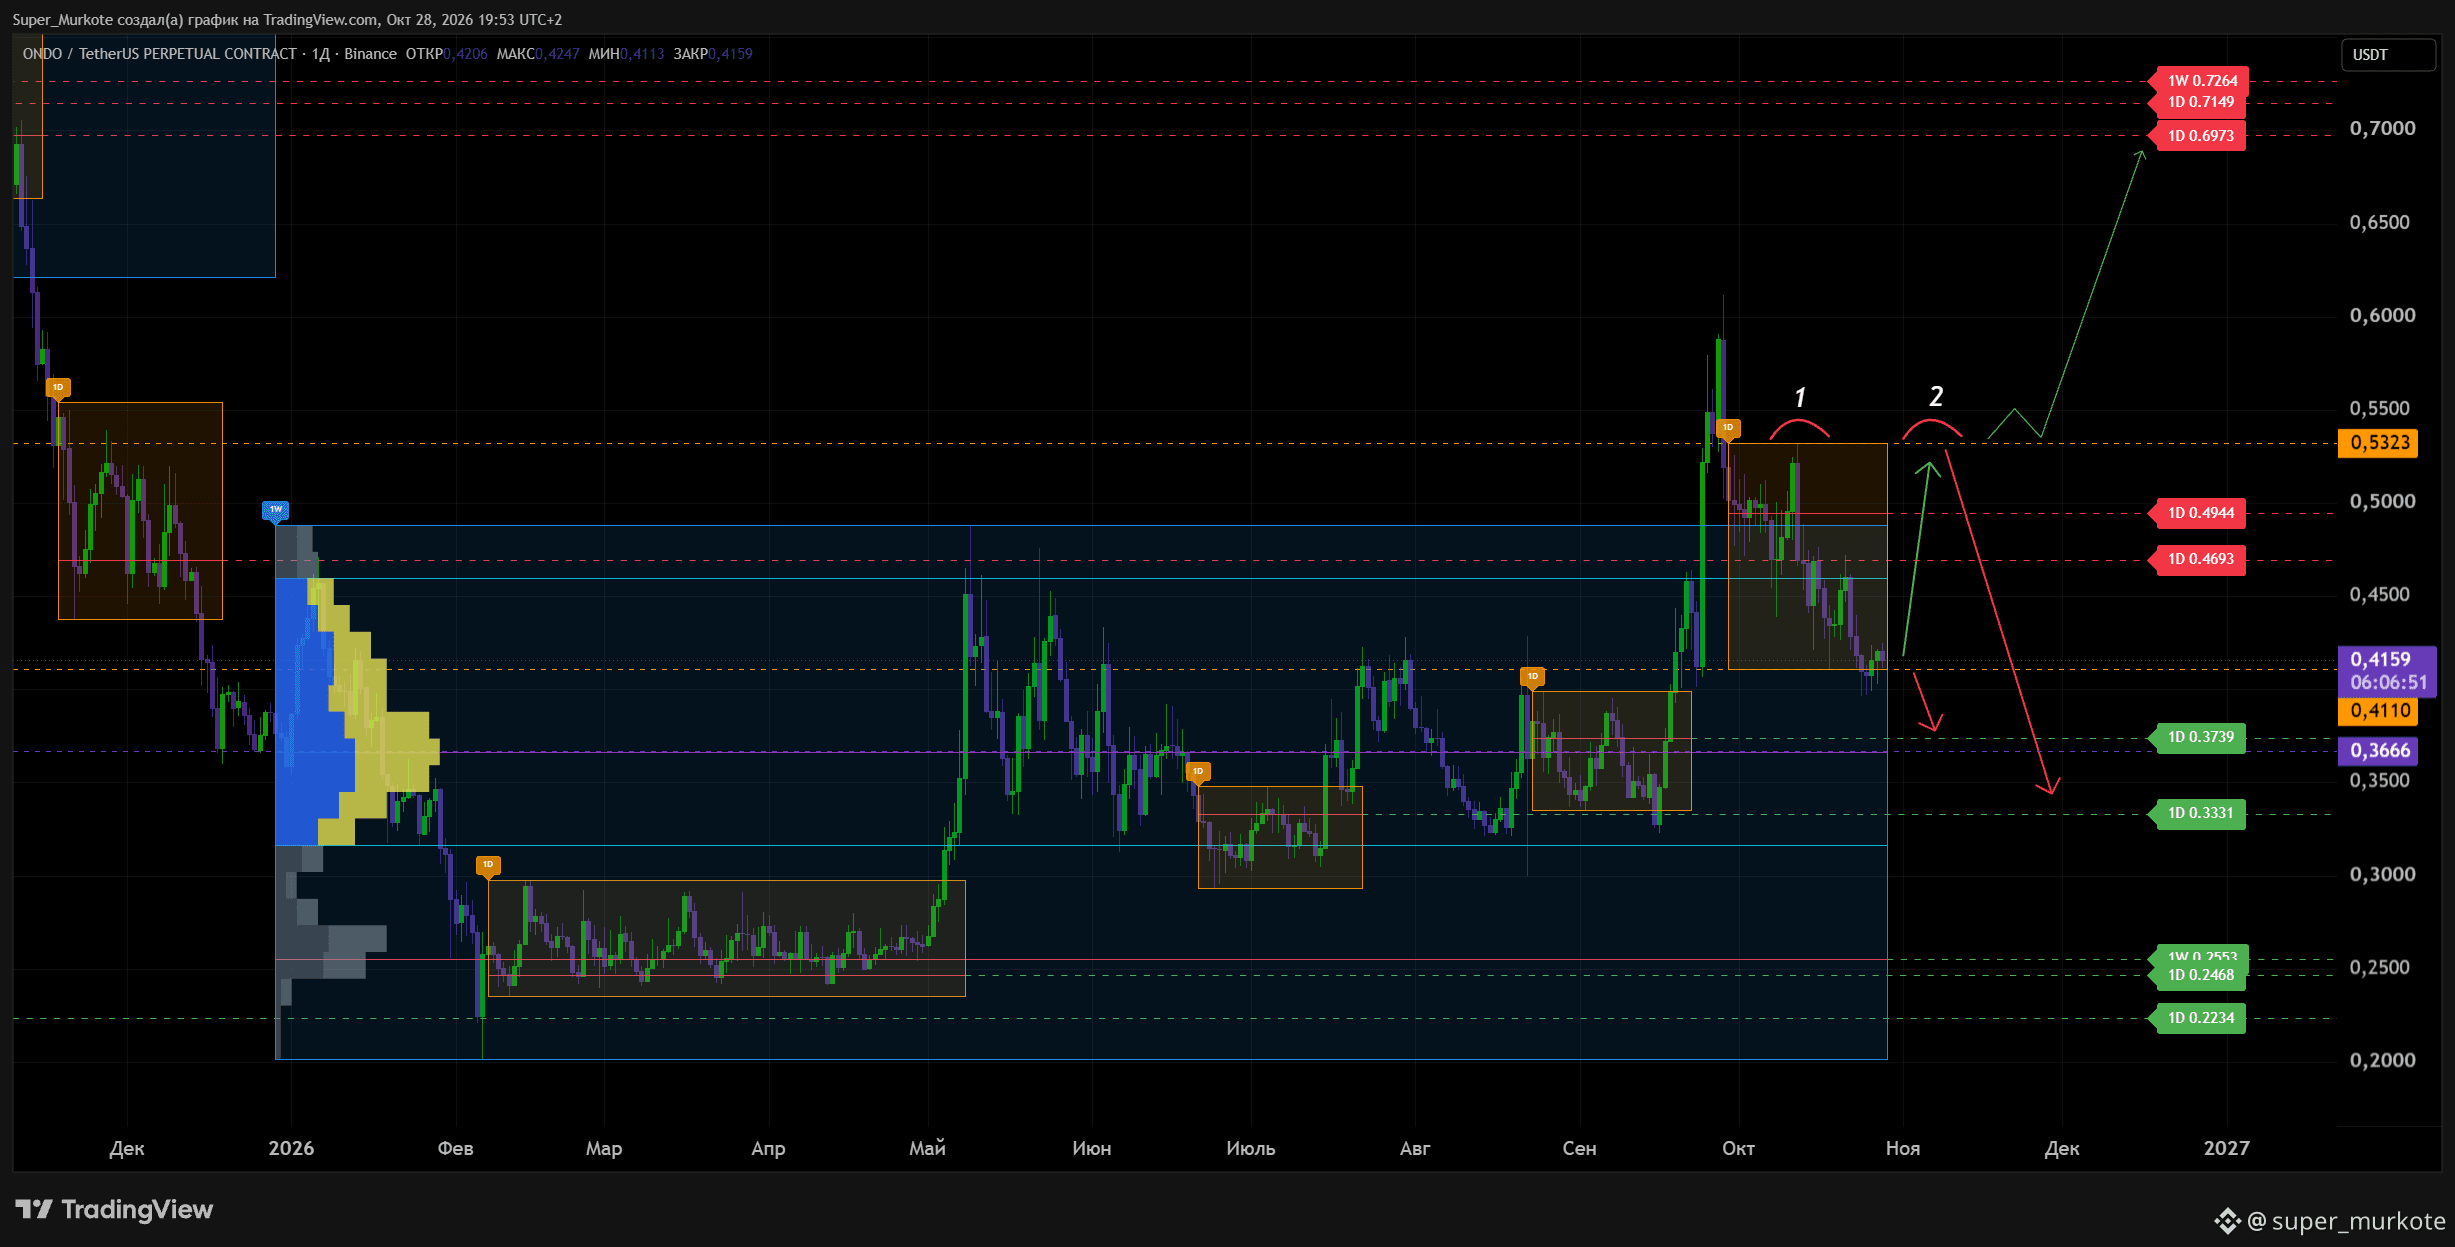
#ONDO As long as there is no sustained break below 0.4110, a move within the structure toward its upper boundary at 0.5323 remains possible. At the same time, the price may well spend some time in this range: holding support does not, by itself, mean that a new impulse will start immediately.
There are intermediate resistance levels at 0.4693 and 0.4944 on the way up. The reaction at these levels will show how confidently buyers are prepared to push the price back into the upper part of the range.
The main decision point is near 0.5323. If sellers show up there again, the price may continue moving within the structure and return to its lower boundary. A breakout, a sustained move above that level, and a successful retest, however, would provide grounds to consider further upside toward 0.6973. The chart also marks levels at 0.7149 and 0.7264 above that.
The bearish scenario is a loss of 0.4110, followed by a sustained move below it. Attention would then shift to the 0.3739–0.3666 zone, and if that gives way, to 0.3331.
My main view right now: ONDO has held the lower boundary of its daily structure and may continue trading in the 0.4110–0.5323 range. As long as support holds, a return to the upper boundary remains a valid scenario. IMO.
#ONDO As long as there is no sustained break below 0.4110, a move within the structure toward its upper boundary at 0.5323 remains possible. At the same time, the price may well spend some time in this range: holding support does not, by itself, mean that a new impulse will start immediately.
There are intermediate resistance levels at 0.4693 and 0.4944 on the way up. The reaction at these levels will show how confidently buyers are prepared to push the price back into the upper part of the range.
The main decision point is near 0.5323. If sellers show up there again, the price may continue moving within the structure and return to its lower boundary. A breakout, a sustained move above that level, and a successful retest, however, would provide grounds to consider further upside toward 0.6973. The chart also marks levels at 0.7149 and 0.7264 above that.
The bearish scenario is a loss of 0.4110, followed by a sustained move below it. Attention would then shift to the 0.3739–0.3666 zone, and if that gives way, to 0.3331.
My main view right now: ONDO has held the lower boundary of its daily structure and may continue trading in the 0.4110–0.5323 range. As long as support holds, a return to the upper boundary remains a valid scenario. IMO.
There are intermediate resistance levels at 0.4693 and 0.4944 on the way up. The reaction at these levels will show how confidently buyers are prepared to push the price back into the upper part of the range.
The main decision point is near 0.5323. If sellers show up there again, the price may continue moving within the structure and return to its lower boundary. A breakout, a sustained move above that level, and a successful retest, however, would provide grounds to consider further upside toward 0.6973. The chart also marks levels at 0.7149 and 0.7264 above that.
The bearish scenario is a loss of 0.4110, followed by a sustained move below it. Attention would then shift to the 0.3739–0.3666 zone, and if that gives way, to 0.3331.
My main view right now: ONDO has held the lower boundary of its daily structure and may continue trading in the 0.4110–0.5323 range. As long as support holds, a return to the upper boundary remains a valid scenario. IMO.
770
·
--
Bullish
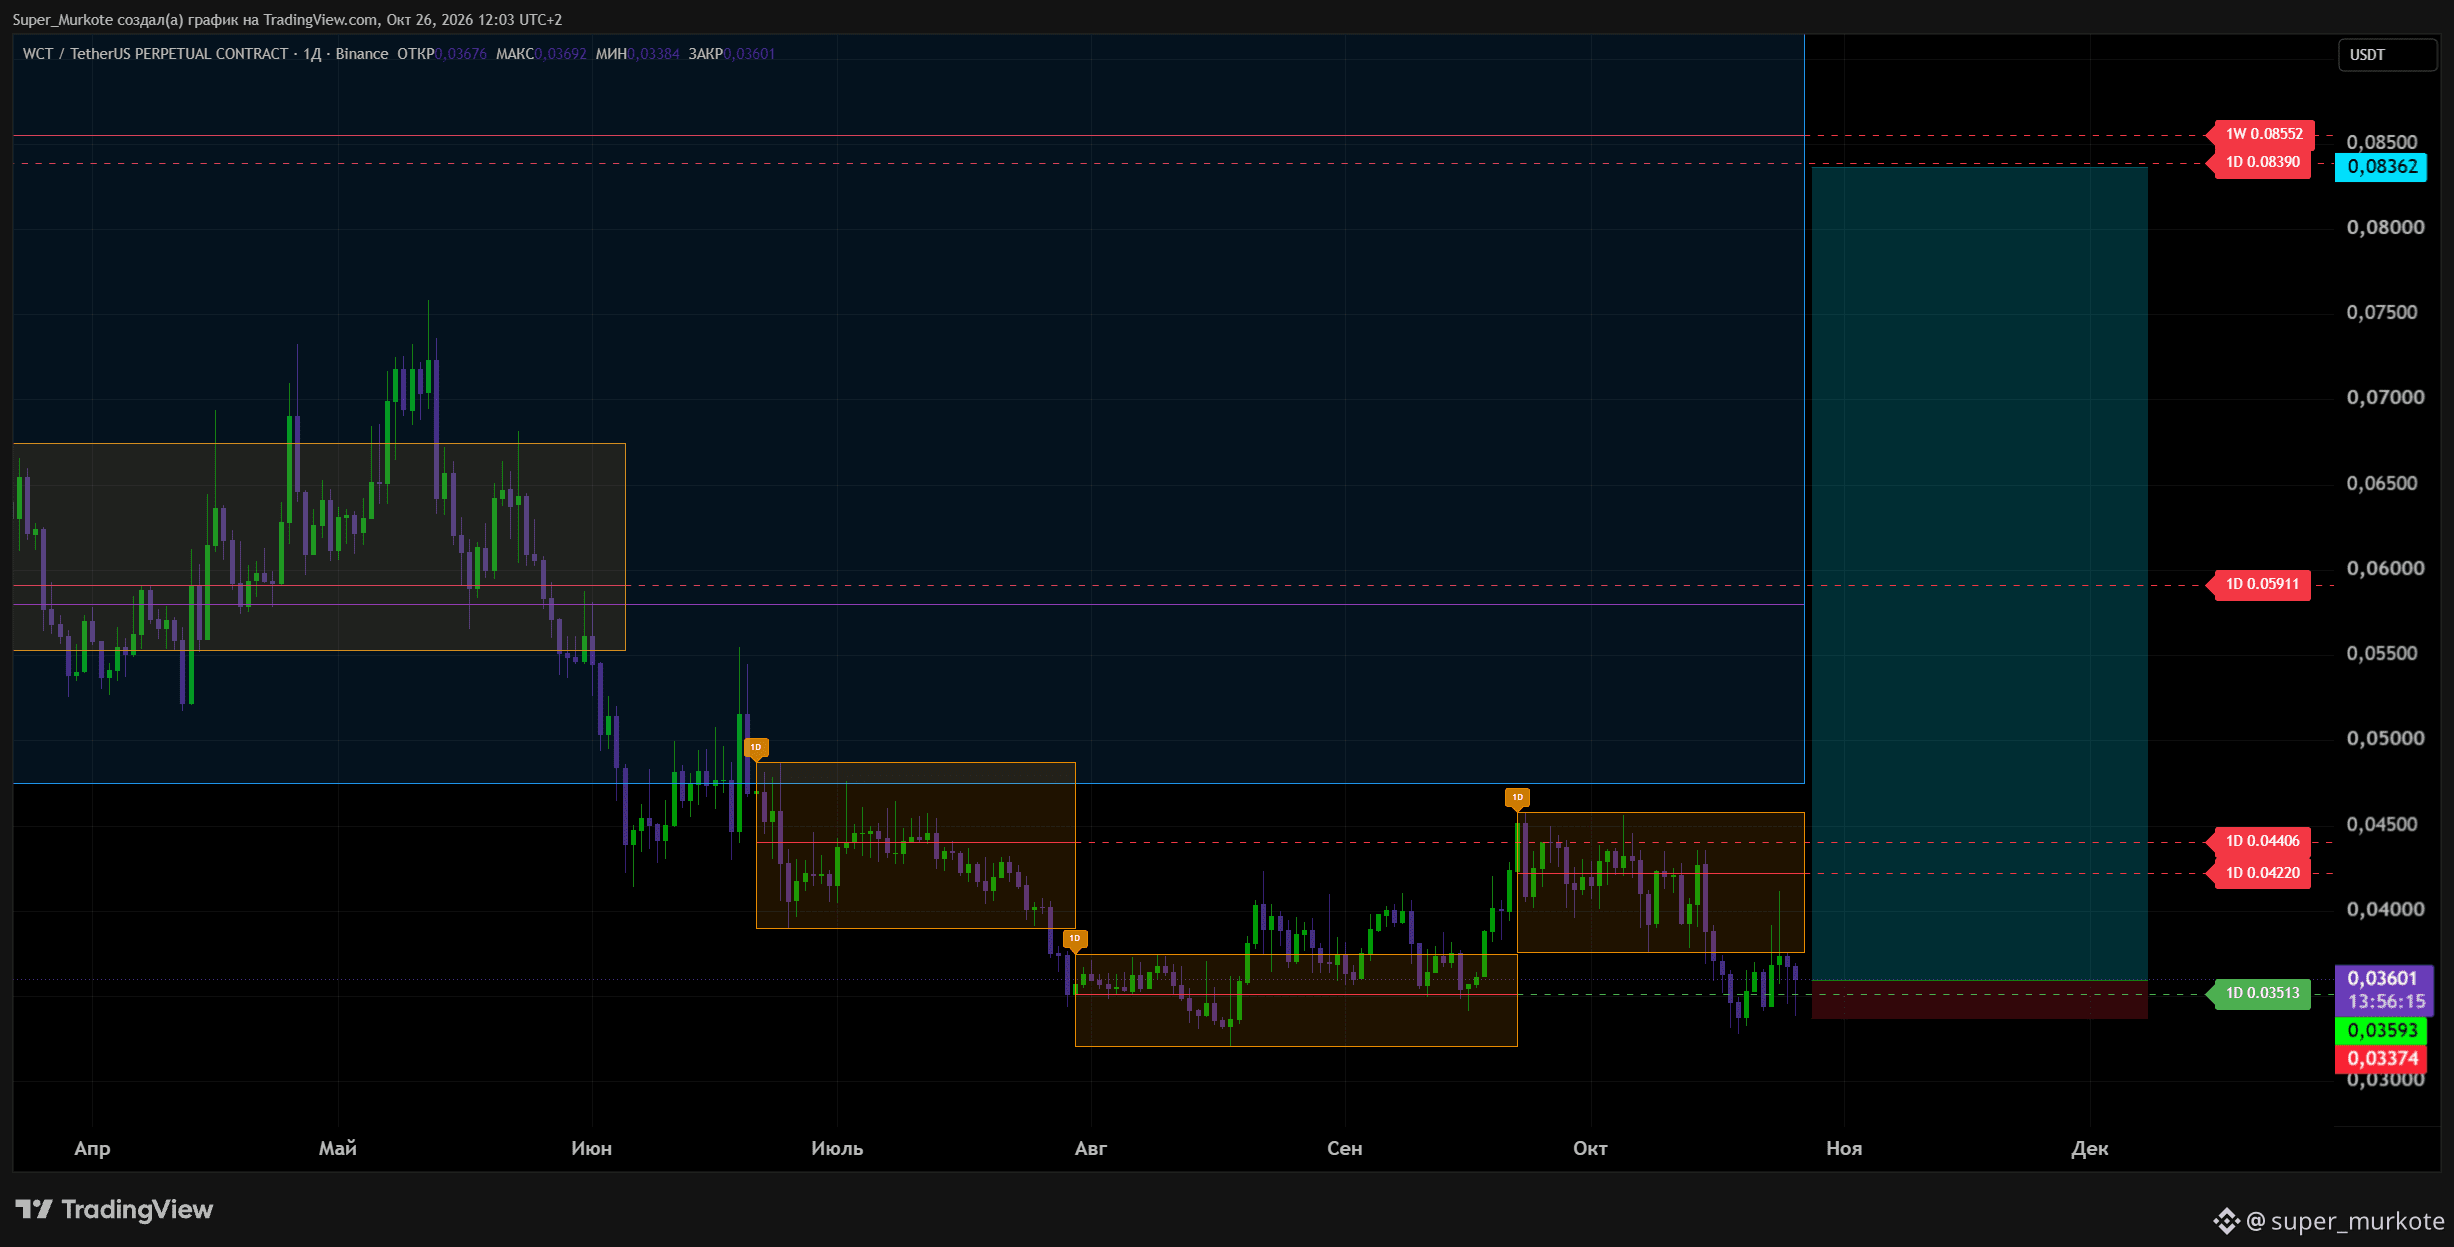
#wct Not a bad buy-the-dip! I entered at market and placed my stop below the latest liquidity. The target is the weekly POC at 0.08552, but I’ll take profit a little earlier. 🍺🌞
#wct Not a bad buy-the-dip! I entered at market and placed my stop below the latest liquidity. The target is the weekly POC at 0.08552, but I’ll take profit a little earlier. 🍺🌞
243
·
--
Bullish
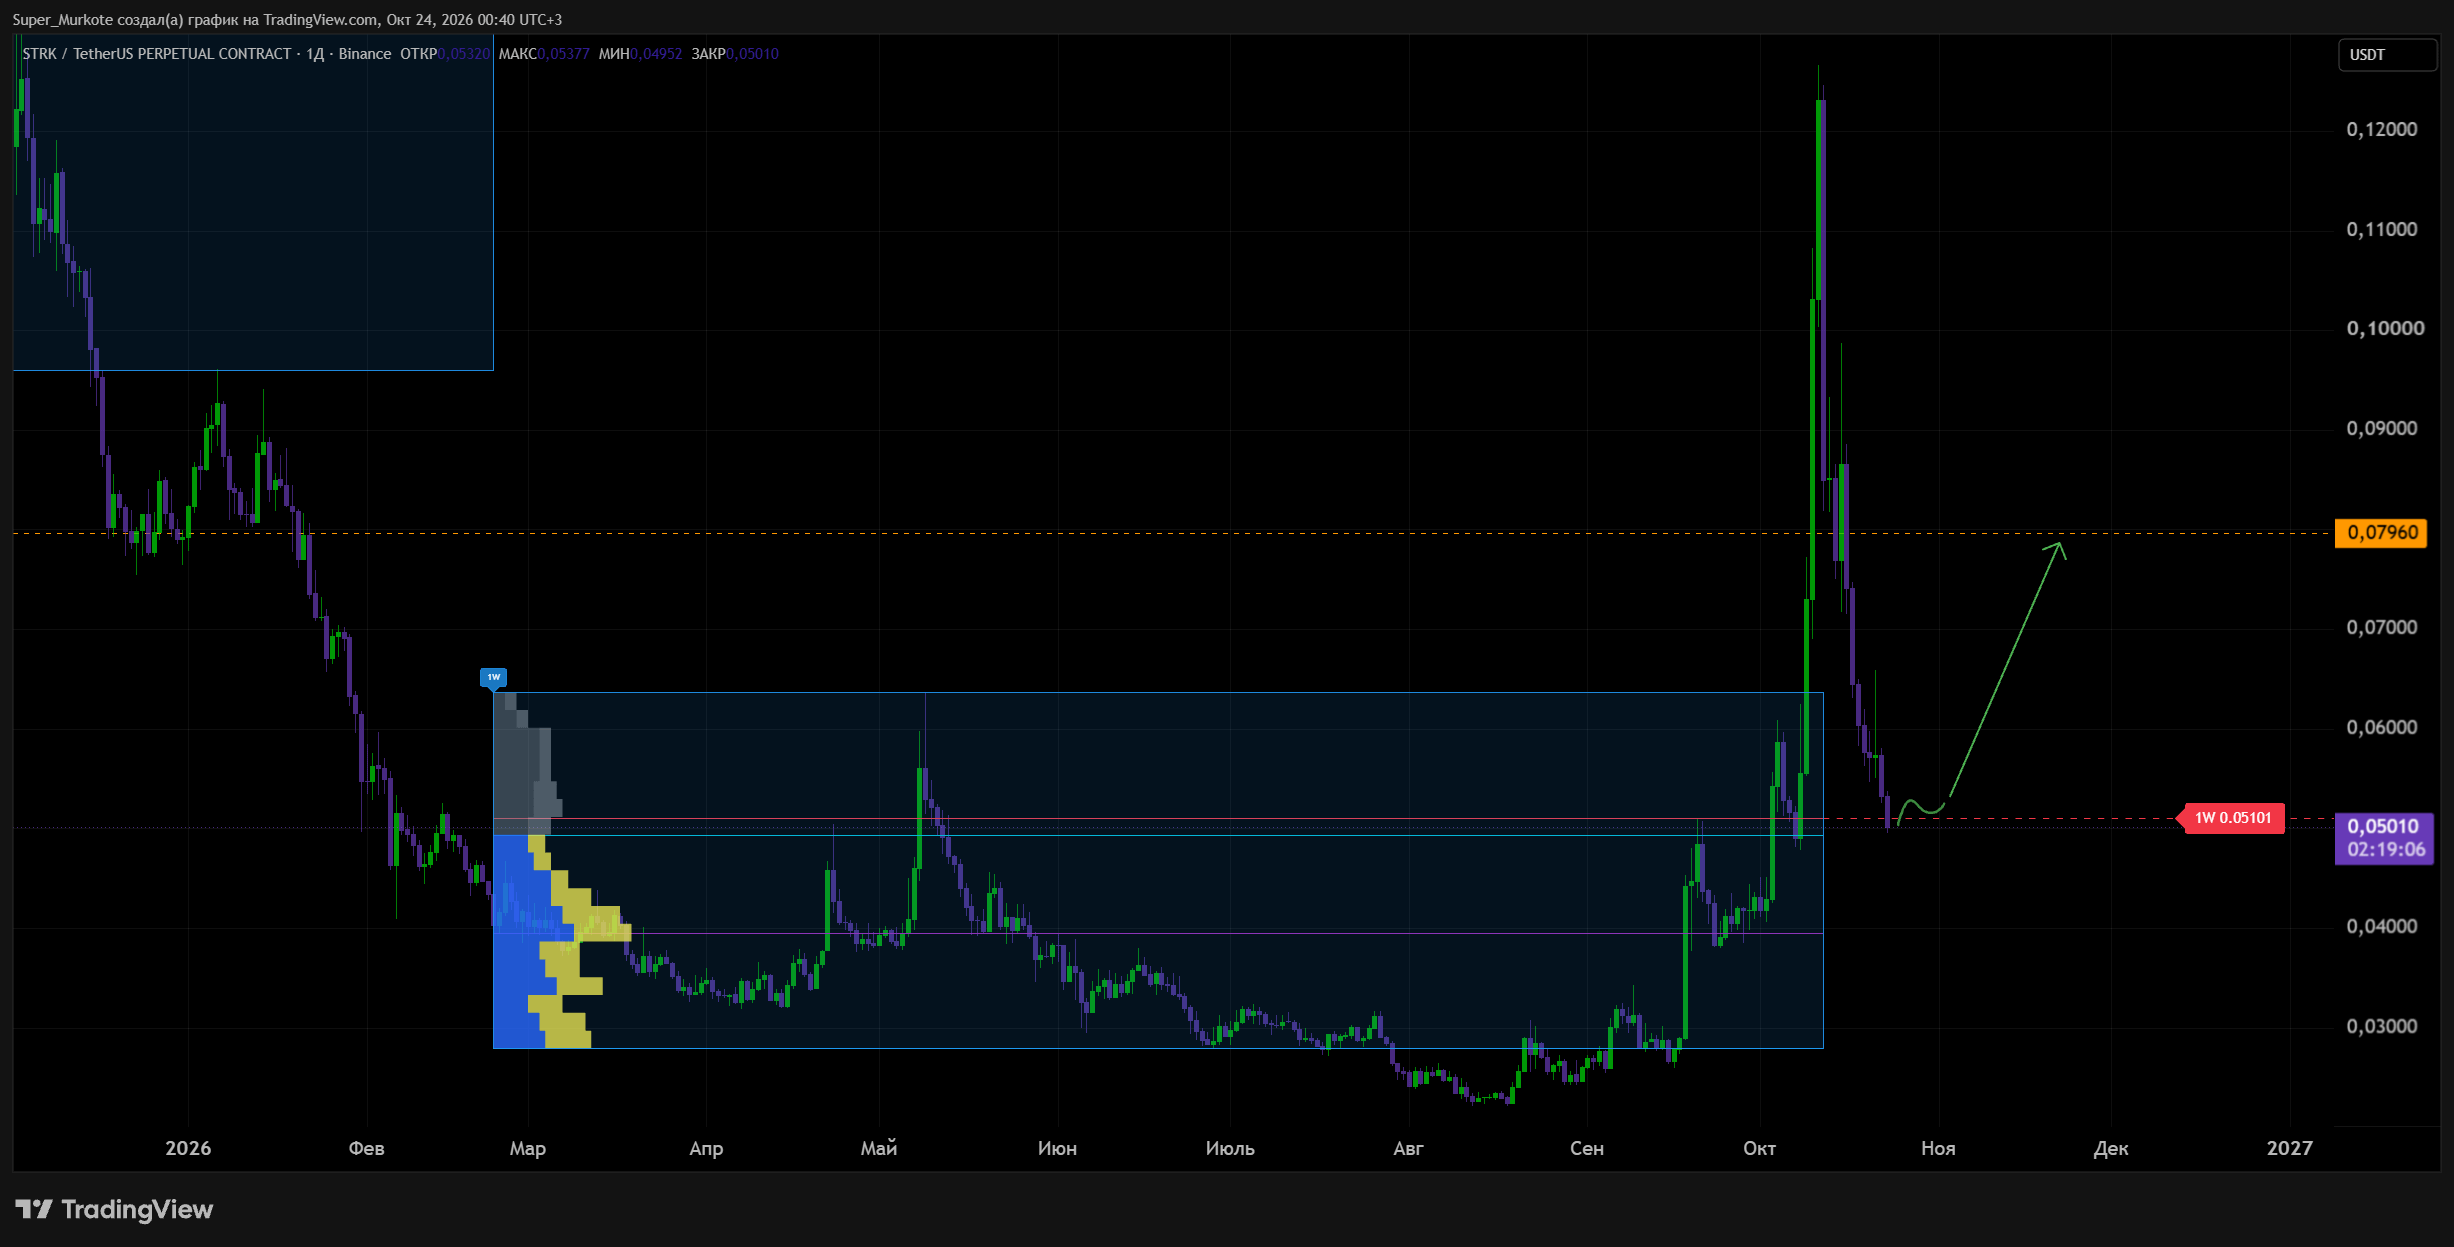
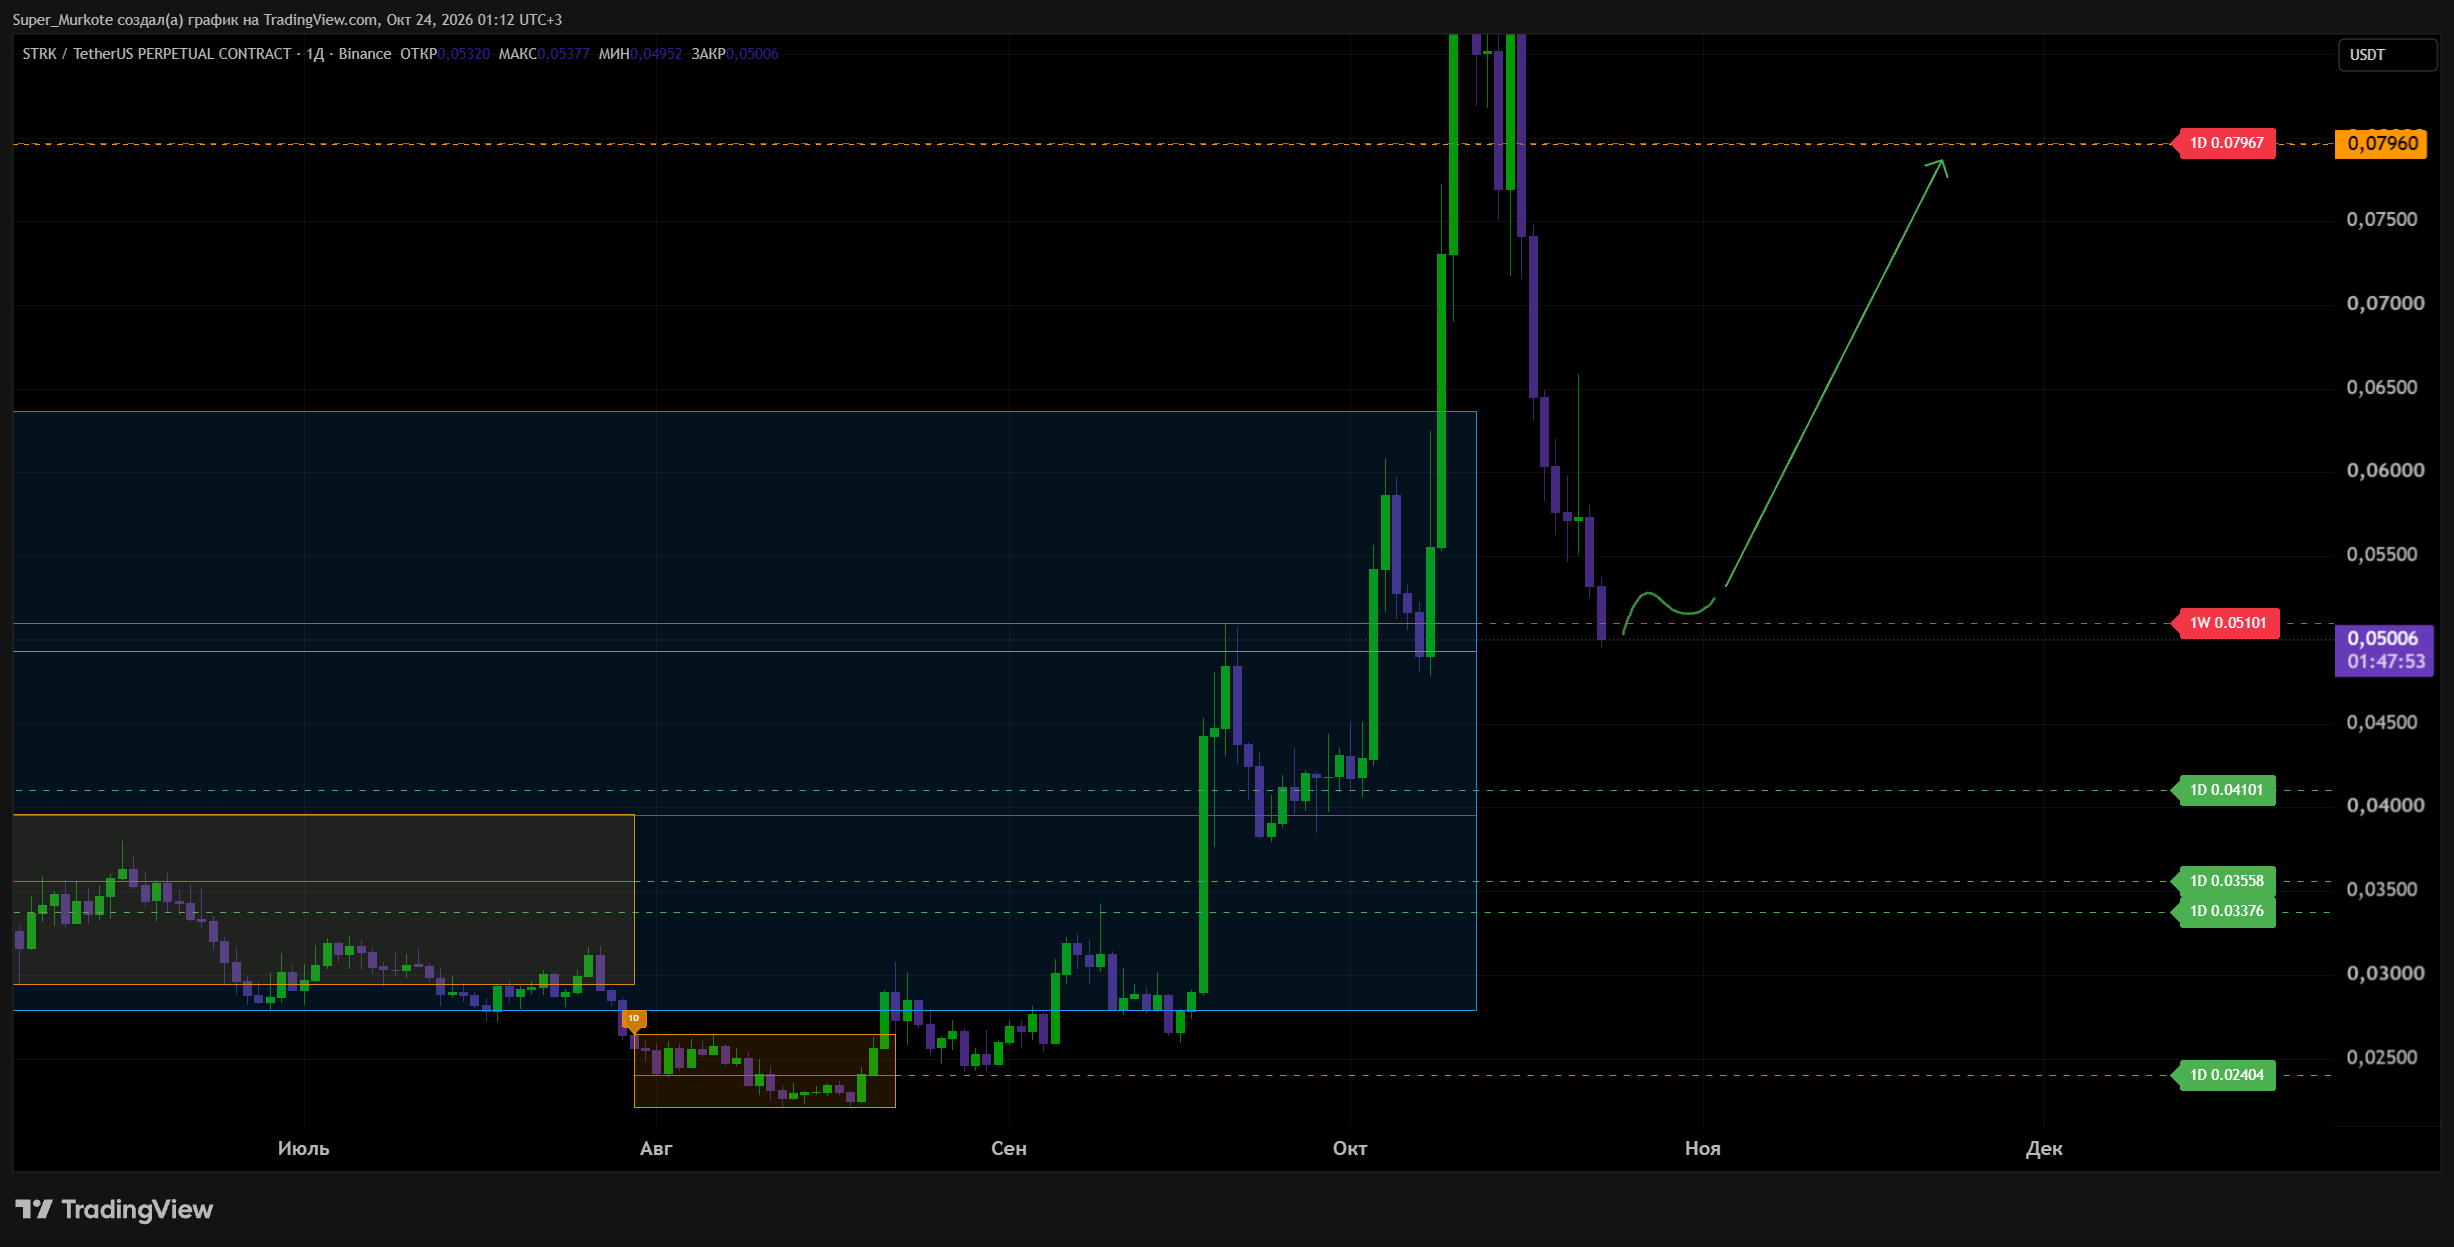
#strk Price has come back to retest the weekly POC at 0.05101.
If it can't hold above this level, that would be unfortunate.
But there will still be other levels to buy at.
Just in case, I marked them on the second screenshot: 0.04101, 0.03558, 0.03376, and 0.02404.
#strk Price has come back to retest the weekly POC at 0.05101.
If it can't hold above this level, that would be unfortunate.
But there will still be other levels to buy at.
Just in case, I marked them on the second screenshot: 0.04101, 0.03558, 0.03376, and 0.02404.
If it can't hold above this level, that would be unfortunate.
But there will still be other levels to buy at.
Just in case, I marked them on the second screenshot: 0.04101, 0.03558, 0.03376, and 0.02404.
1.6k
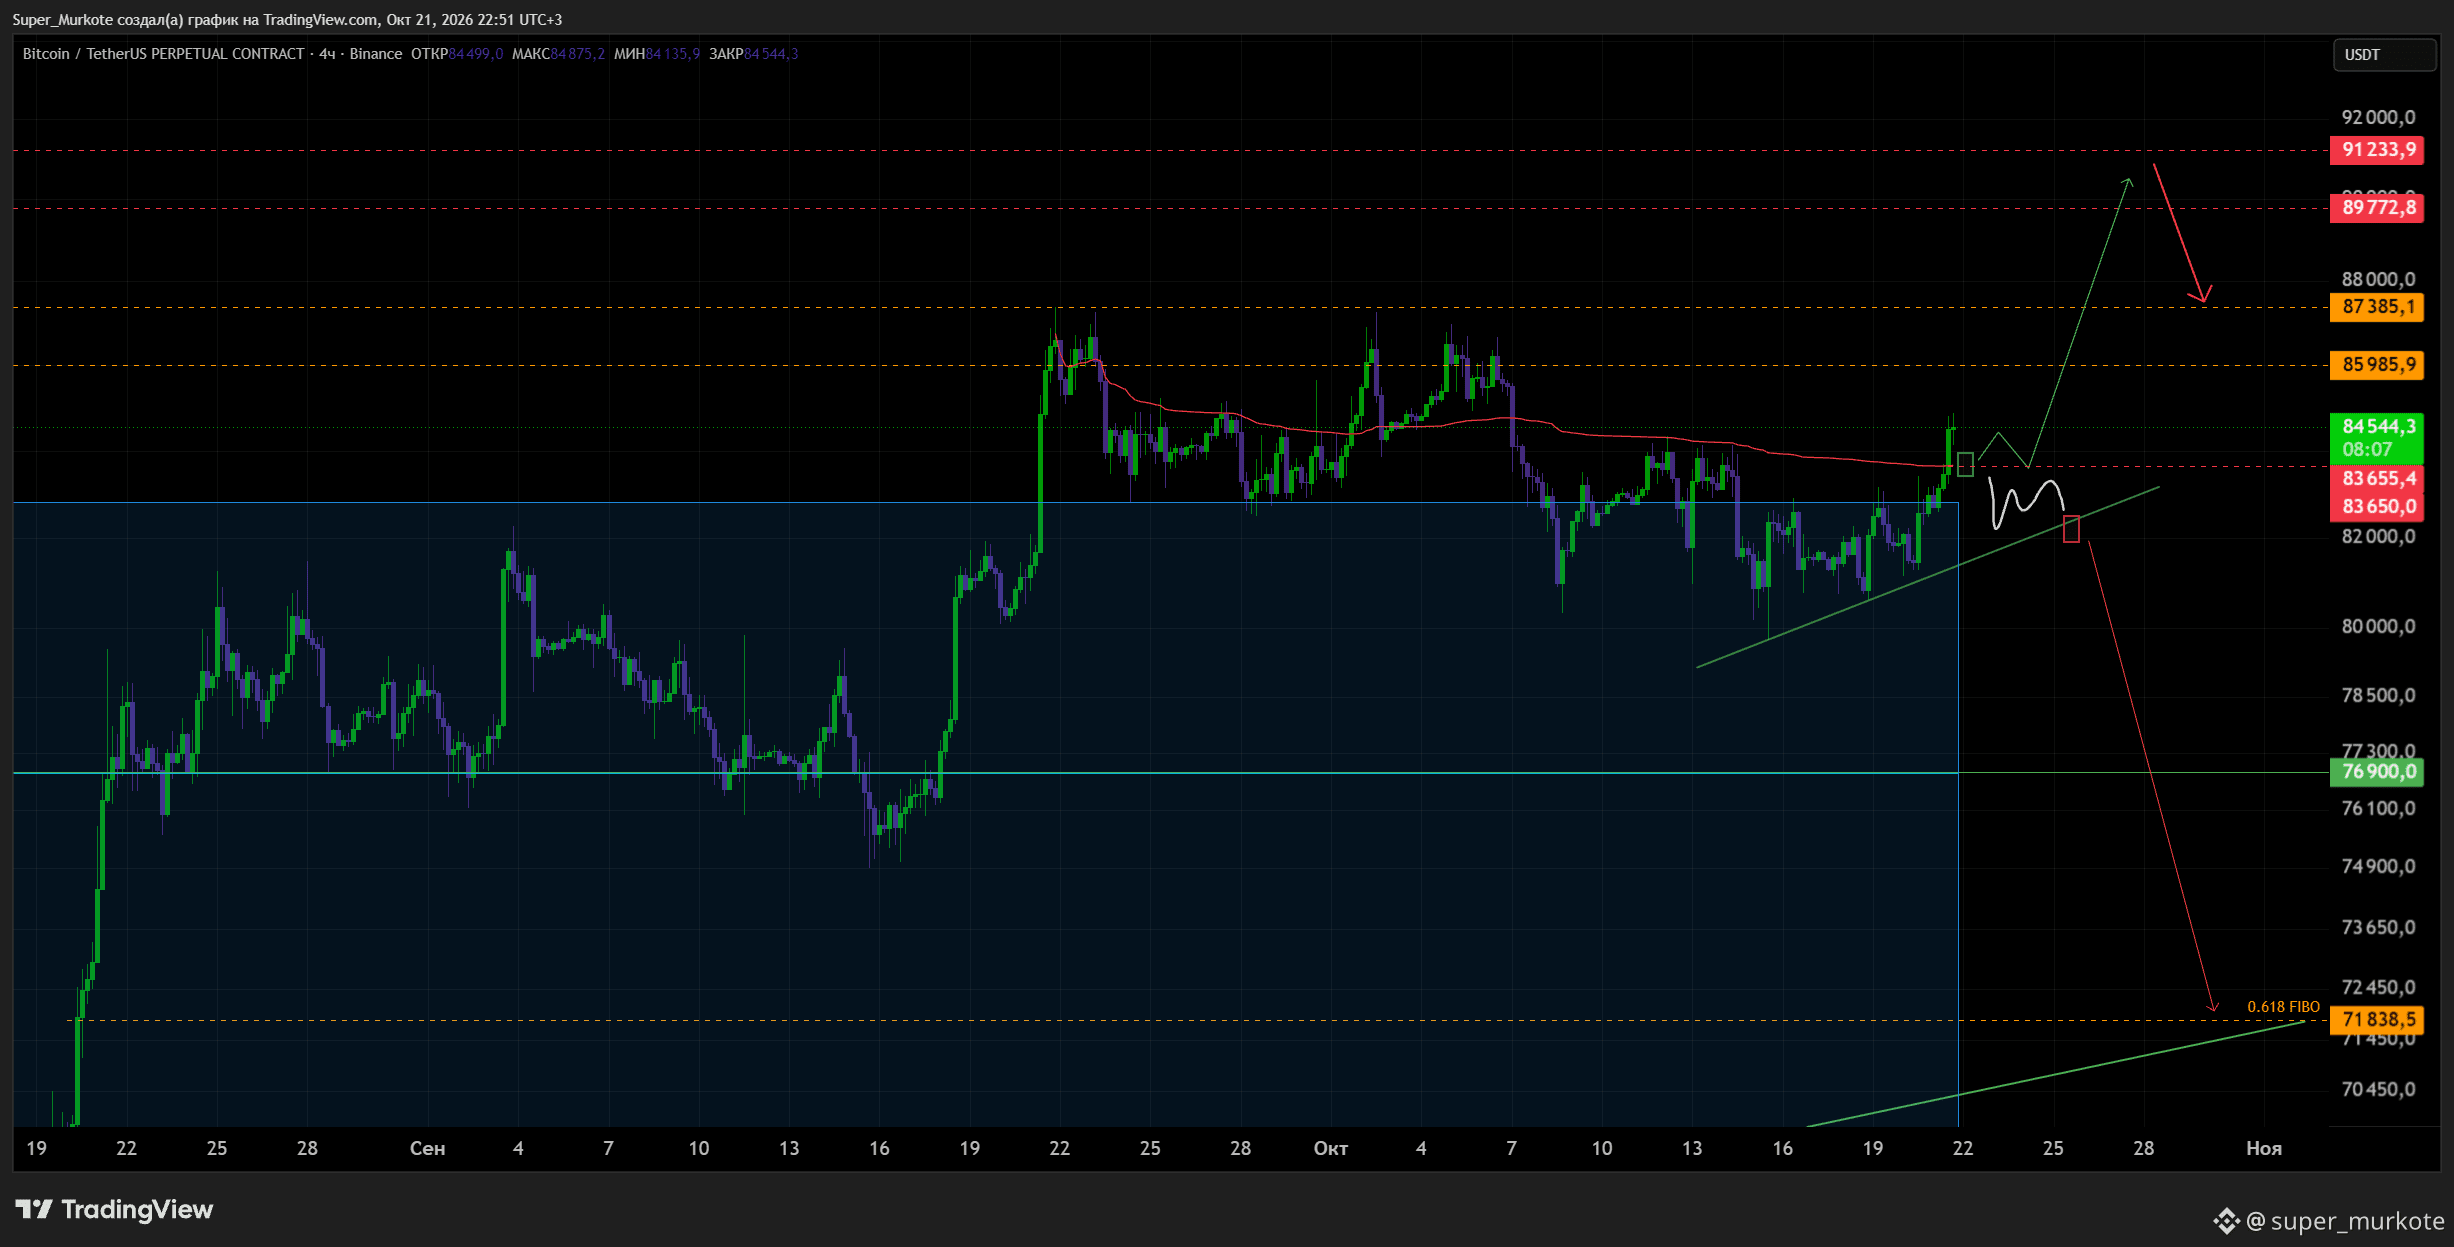
#BTC A comprehensive setup, in my opinion. If we successfully retest 83 650, we head up to 89 772,8 and 91 223,9 (two levels).
But if this is manipulation, we drop below 83 650 to the trendline. As soon as the price closes below it, we fall hard.
No other ideas 🍺🌞
#BTC A comprehensive setup, in my opinion. If we successfully retest 83 650, we head up to 89 772,8 and 91 223,9 (two levels).
But if this is manipulation, we drop below 83 650 to the trendline. As soon as the price closes below it, we fall hard.
No other ideas 🍺🌞
But if this is manipulation, we drop below 83 650 to the trendline. As soon as the price closes below it, we fall hard.
No other ideas 🍺🌞
305
·
--
Bullish
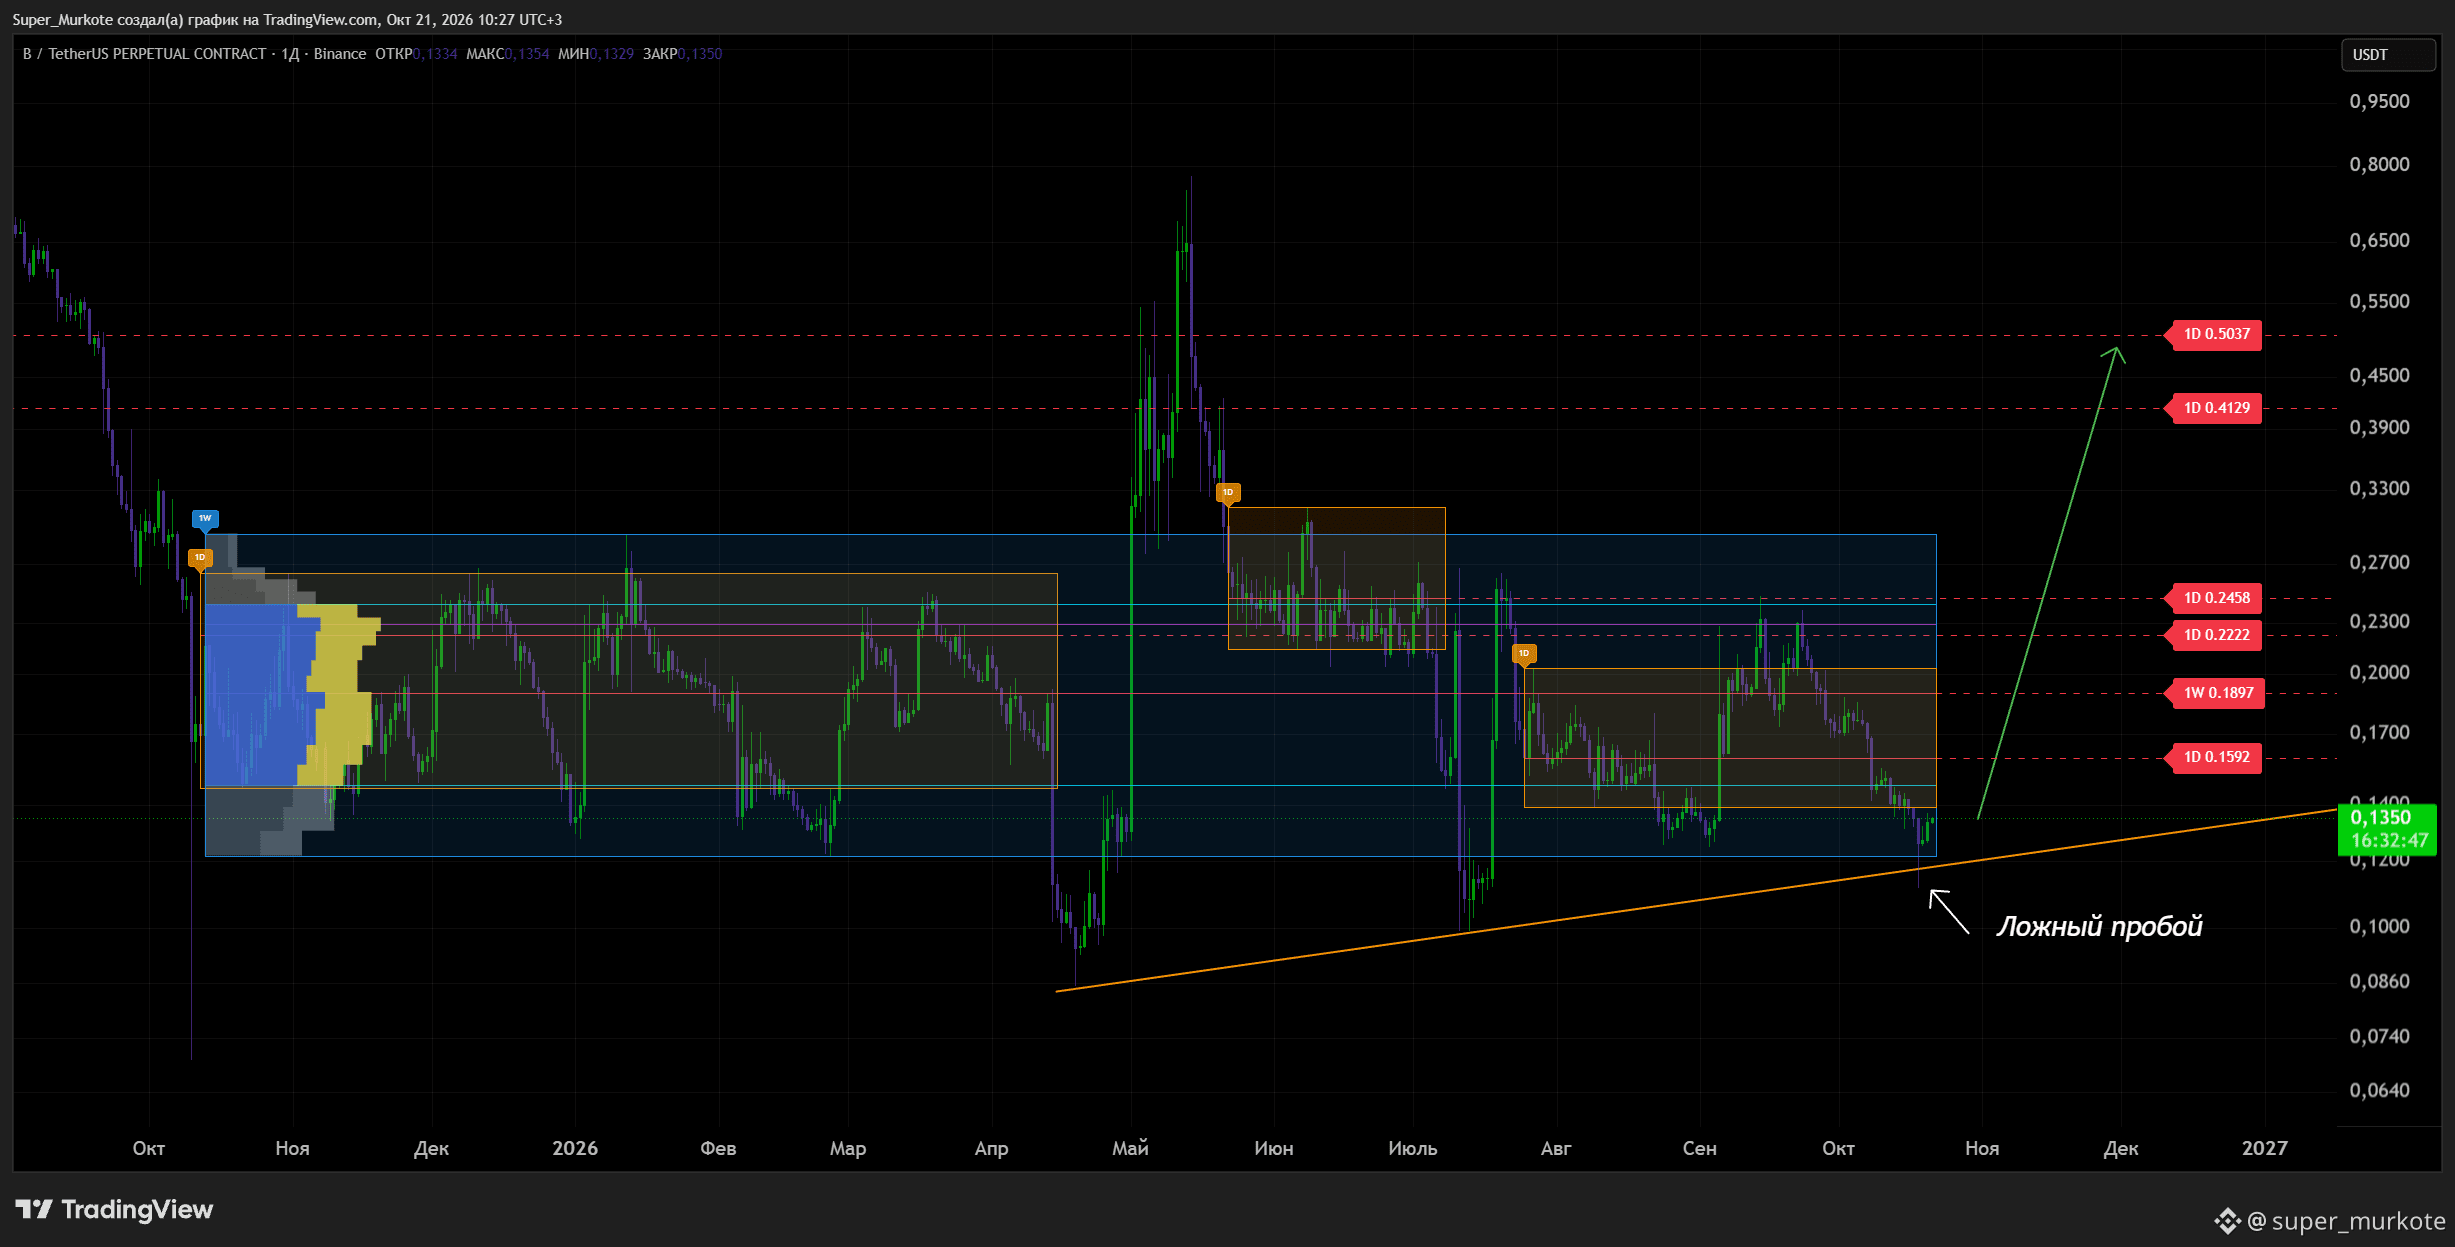
#BUILDon looks like a false breakout before a rise. Overall, it looks like a double bottom pattern is forming.🚀
#BUILDon looks like a false breakout before a rise. Overall, it looks like a double bottom pattern is forming.🚀
12
·
--
Bullish
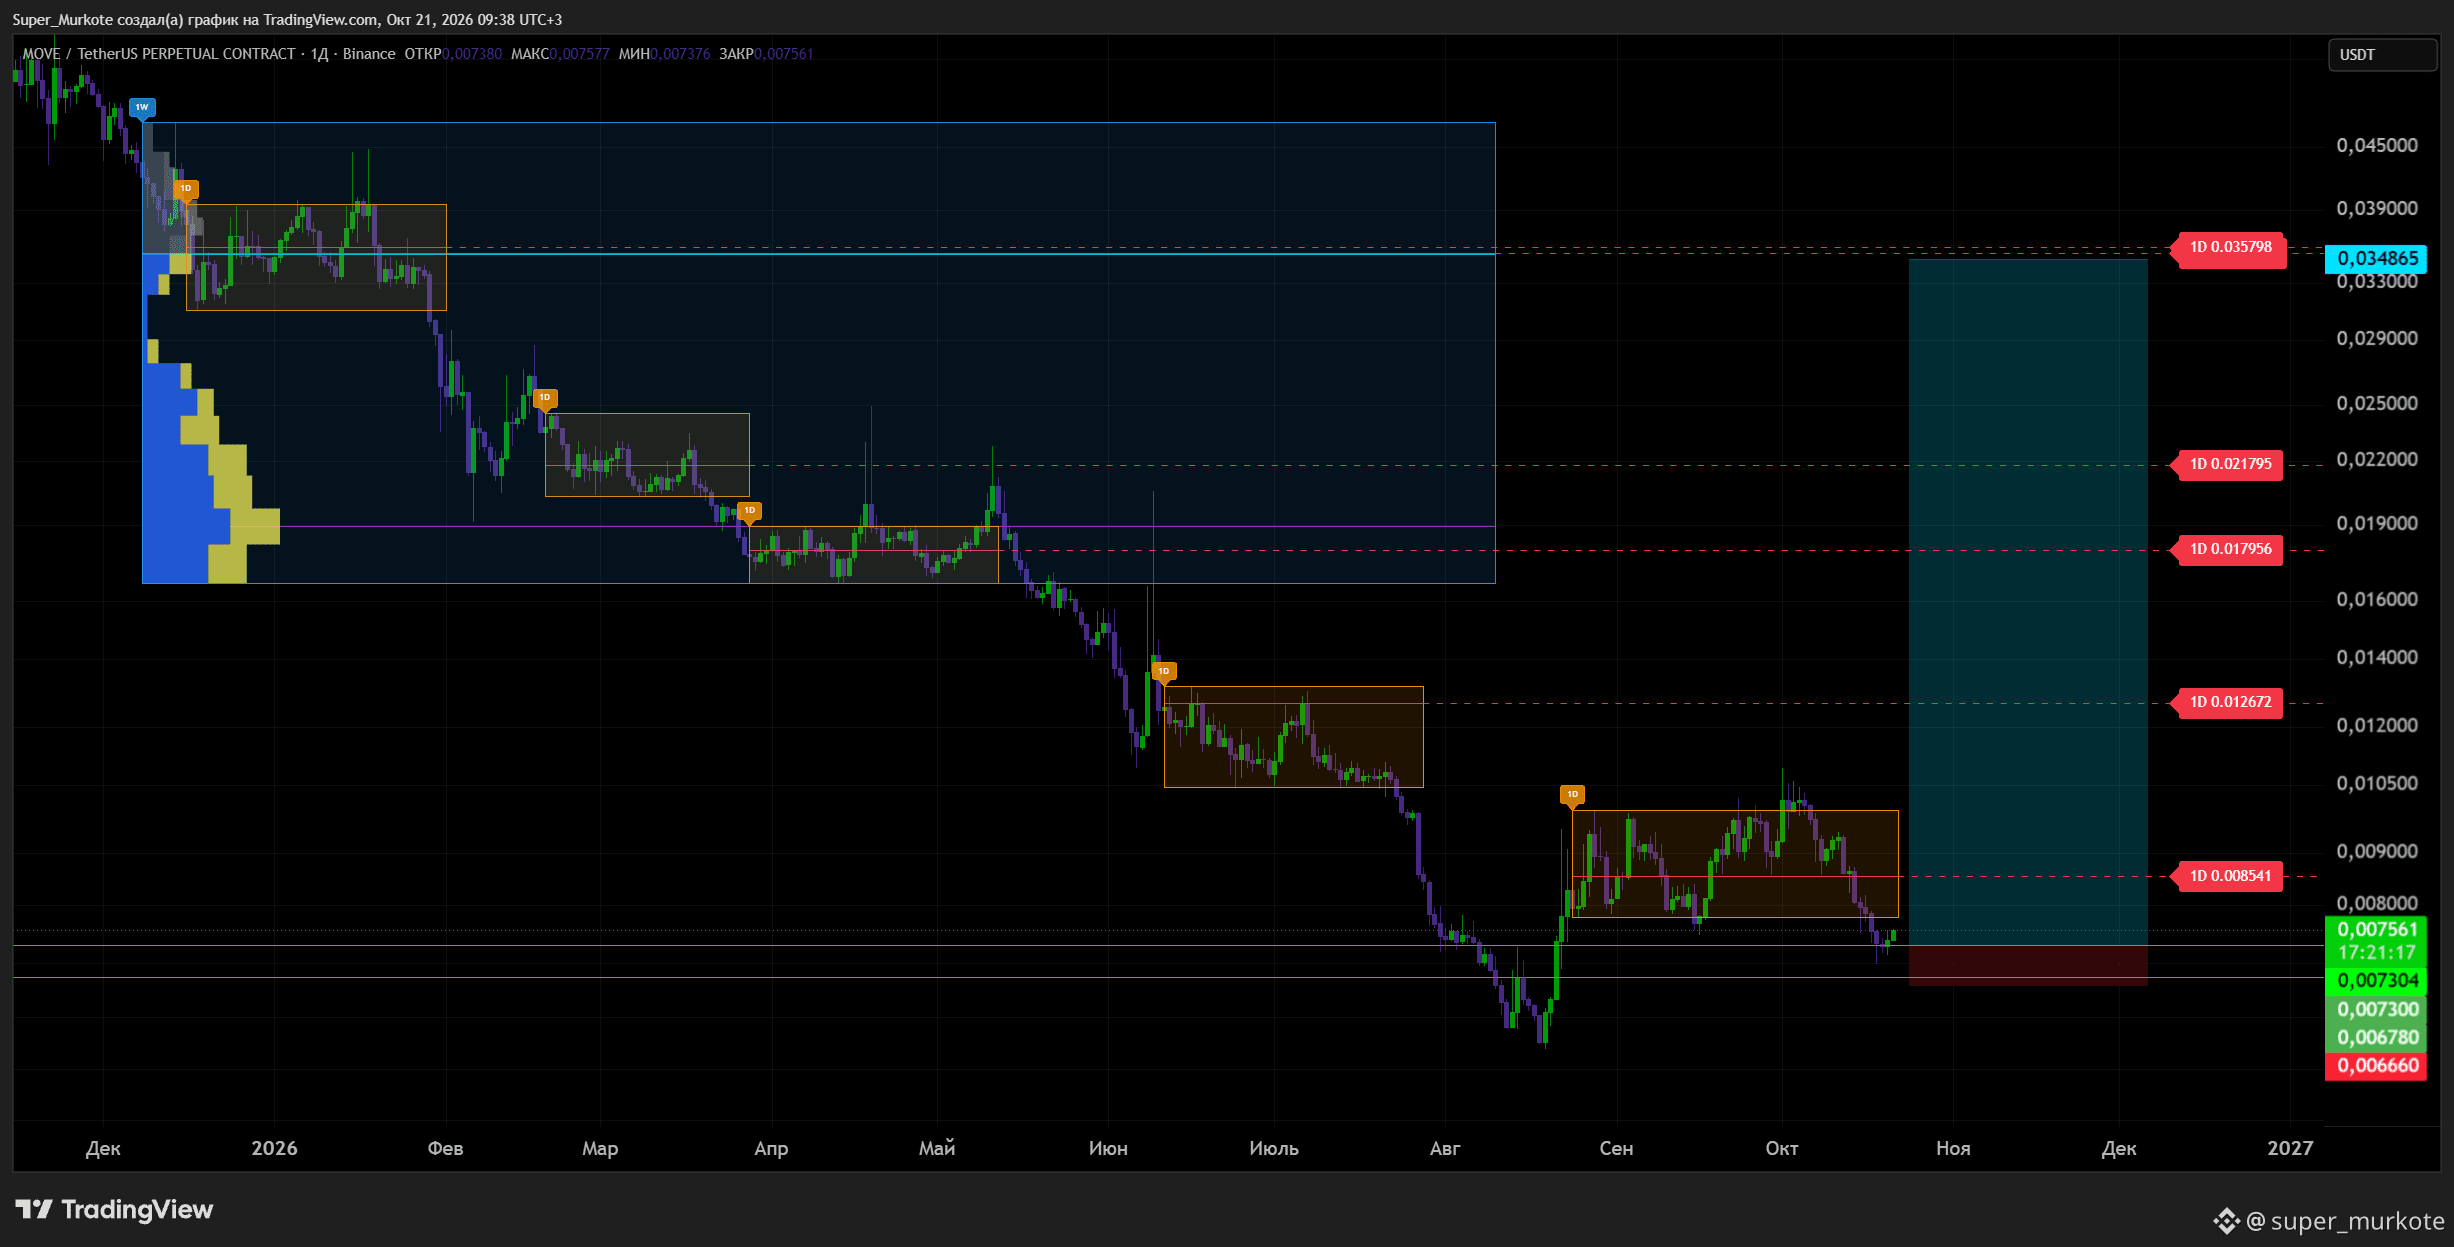
#Move The price has formed a W-shaped reversal pattern and is trading above it, above the 0.006780–0.007300 support zone. Trading volume is elevated in this area, and some MOVE has been withdrawn from the exchange for safekeeping.
The conditions for a rise are in place, and the risk-to-reward ratio works for me 🍺🌞
So I’m opening a long position. The targets are marked on the chart.
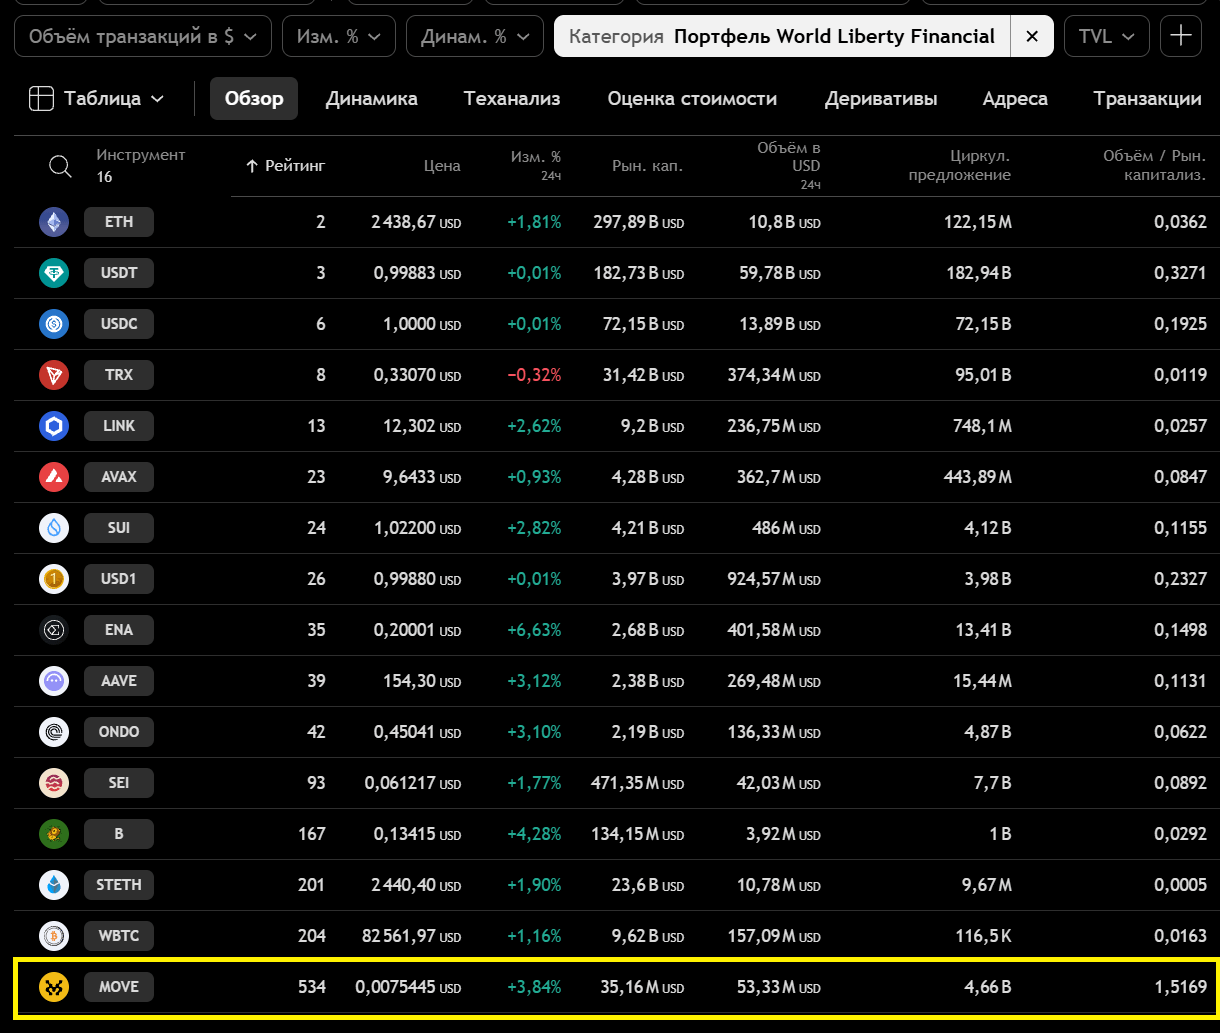
Interestingly, MOVE turned out to be one of the few altcoins in the portfolio of World Liberty Financial, which is linked to the Trump family. 🧐
#Move The price has formed a W-shaped reversal pattern and is trading above it, above the 0.006780–0.007300 support zone. Trading volume is elevated in this area, and some MOVE has been withdrawn from the exchange for safekeeping.
The conditions for a rise are in place, and the risk-to-reward ratio works for me 🍺🌞
So I’m opening a long position. The targets are marked on the chart.
Interestingly, MOVE turned out to be one of the few altcoins in the portfolio of World Liberty Financial, which is linked to the Trump family. 🧐
The conditions for a rise are in place, and the risk-to-reward ratio works for me 🍺🌞
So I’m opening a long position. The targets are marked on the chart.
Interestingly, MOVE turned out to be one of the few altcoins in the portfolio of World Liberty Financial, which is linked to the Trump family. 🧐
1
107
·
--
Bullish
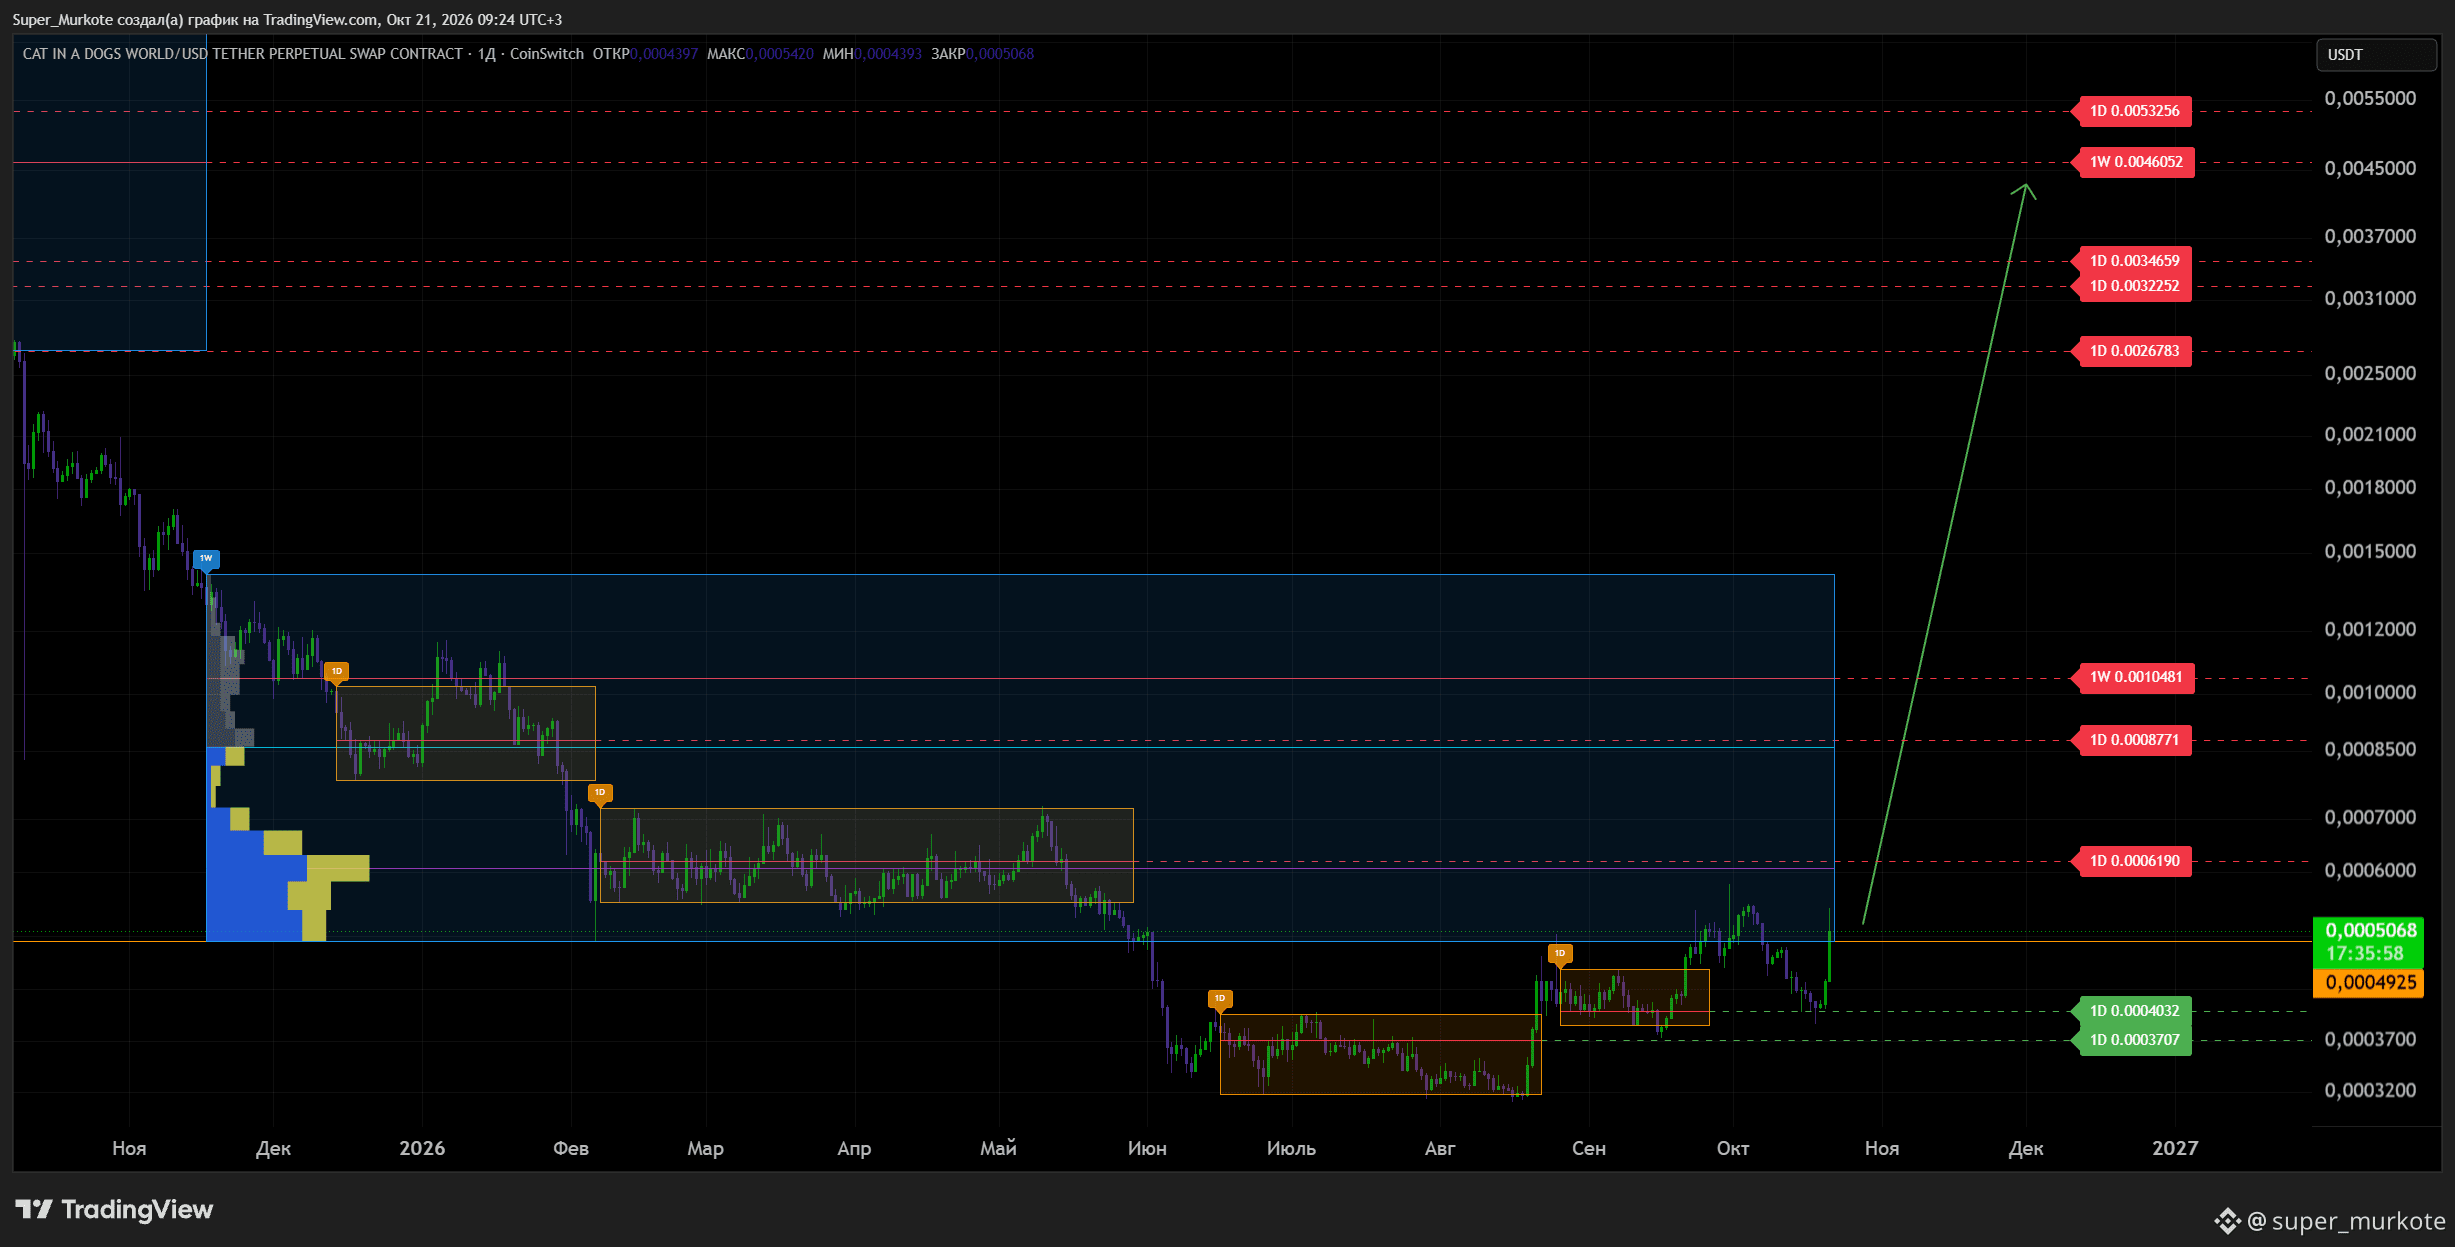
#MEW Meow-meow! 🐱 The coin has returned to the weekly structure. If it holds above 0.0004925, upside targets are marked on the chart. 🚀
#MEW Meow-meow! 🐱 The coin has returned to the weekly structure. If it holds above 0.0004925, upside targets are marked on the chart. 🚀
163
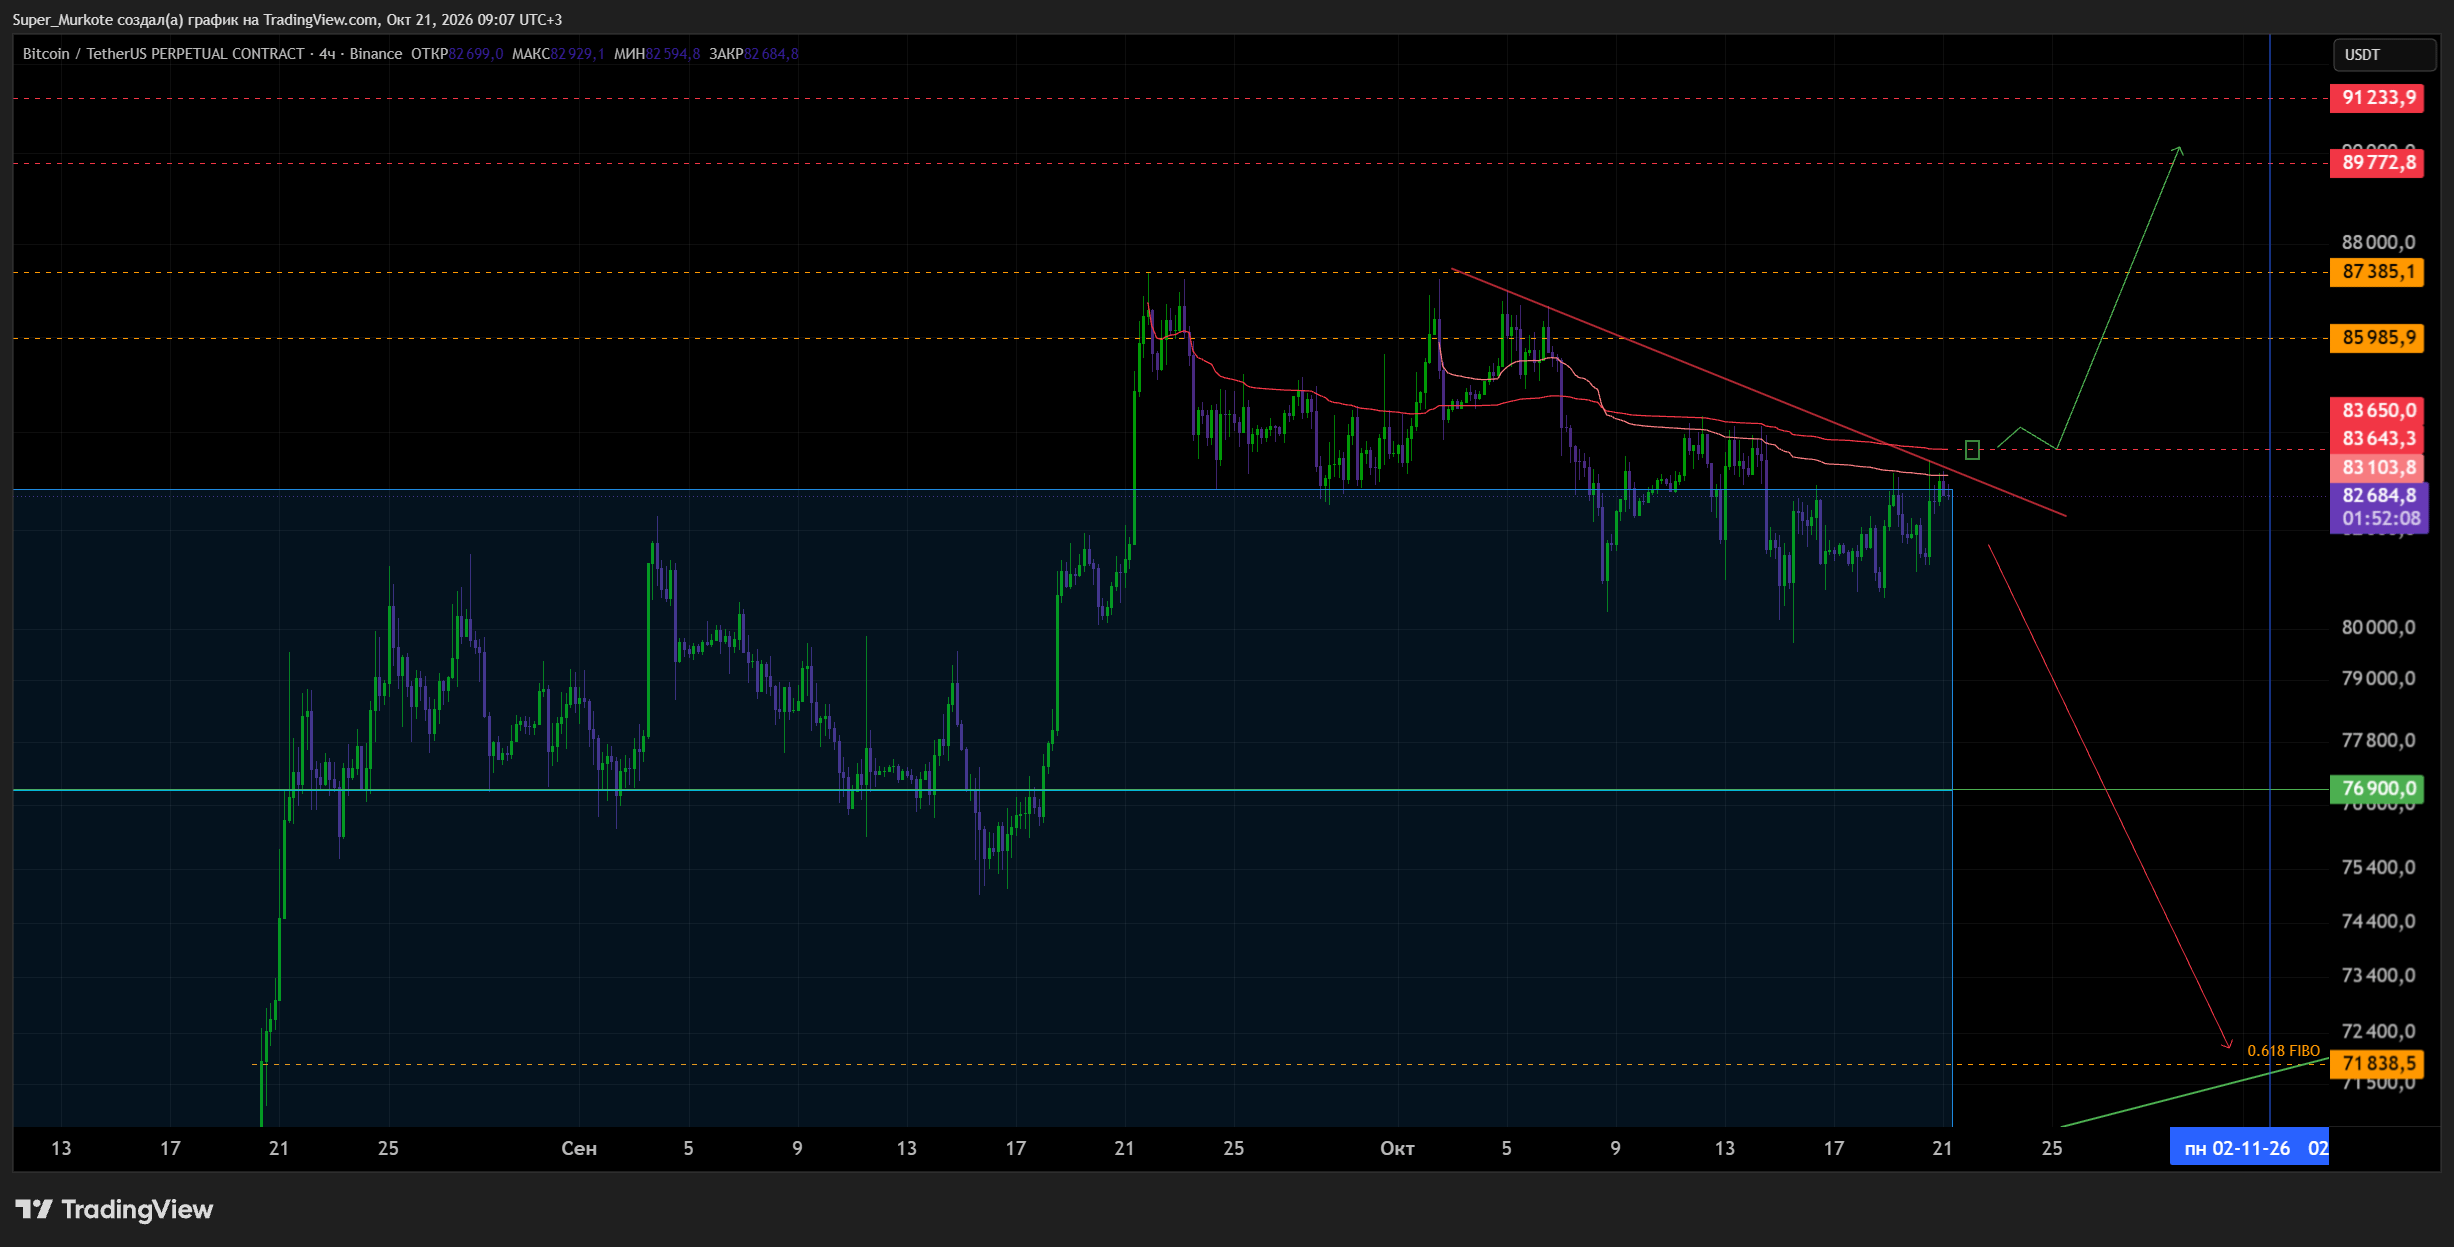
#BTC I'll raise the bar for a long to 83,650 — there's another Anchor VWAP there. If the price closes above it, we'll retest and move higher. IMO.
#BTC I'll raise the bar for a long to 83,650 — there's another Anchor VWAP there. If the price closes above it, we'll retest and move higher. IMO.
127
·
--
Bullish
1
1
520
·
--
Bullish
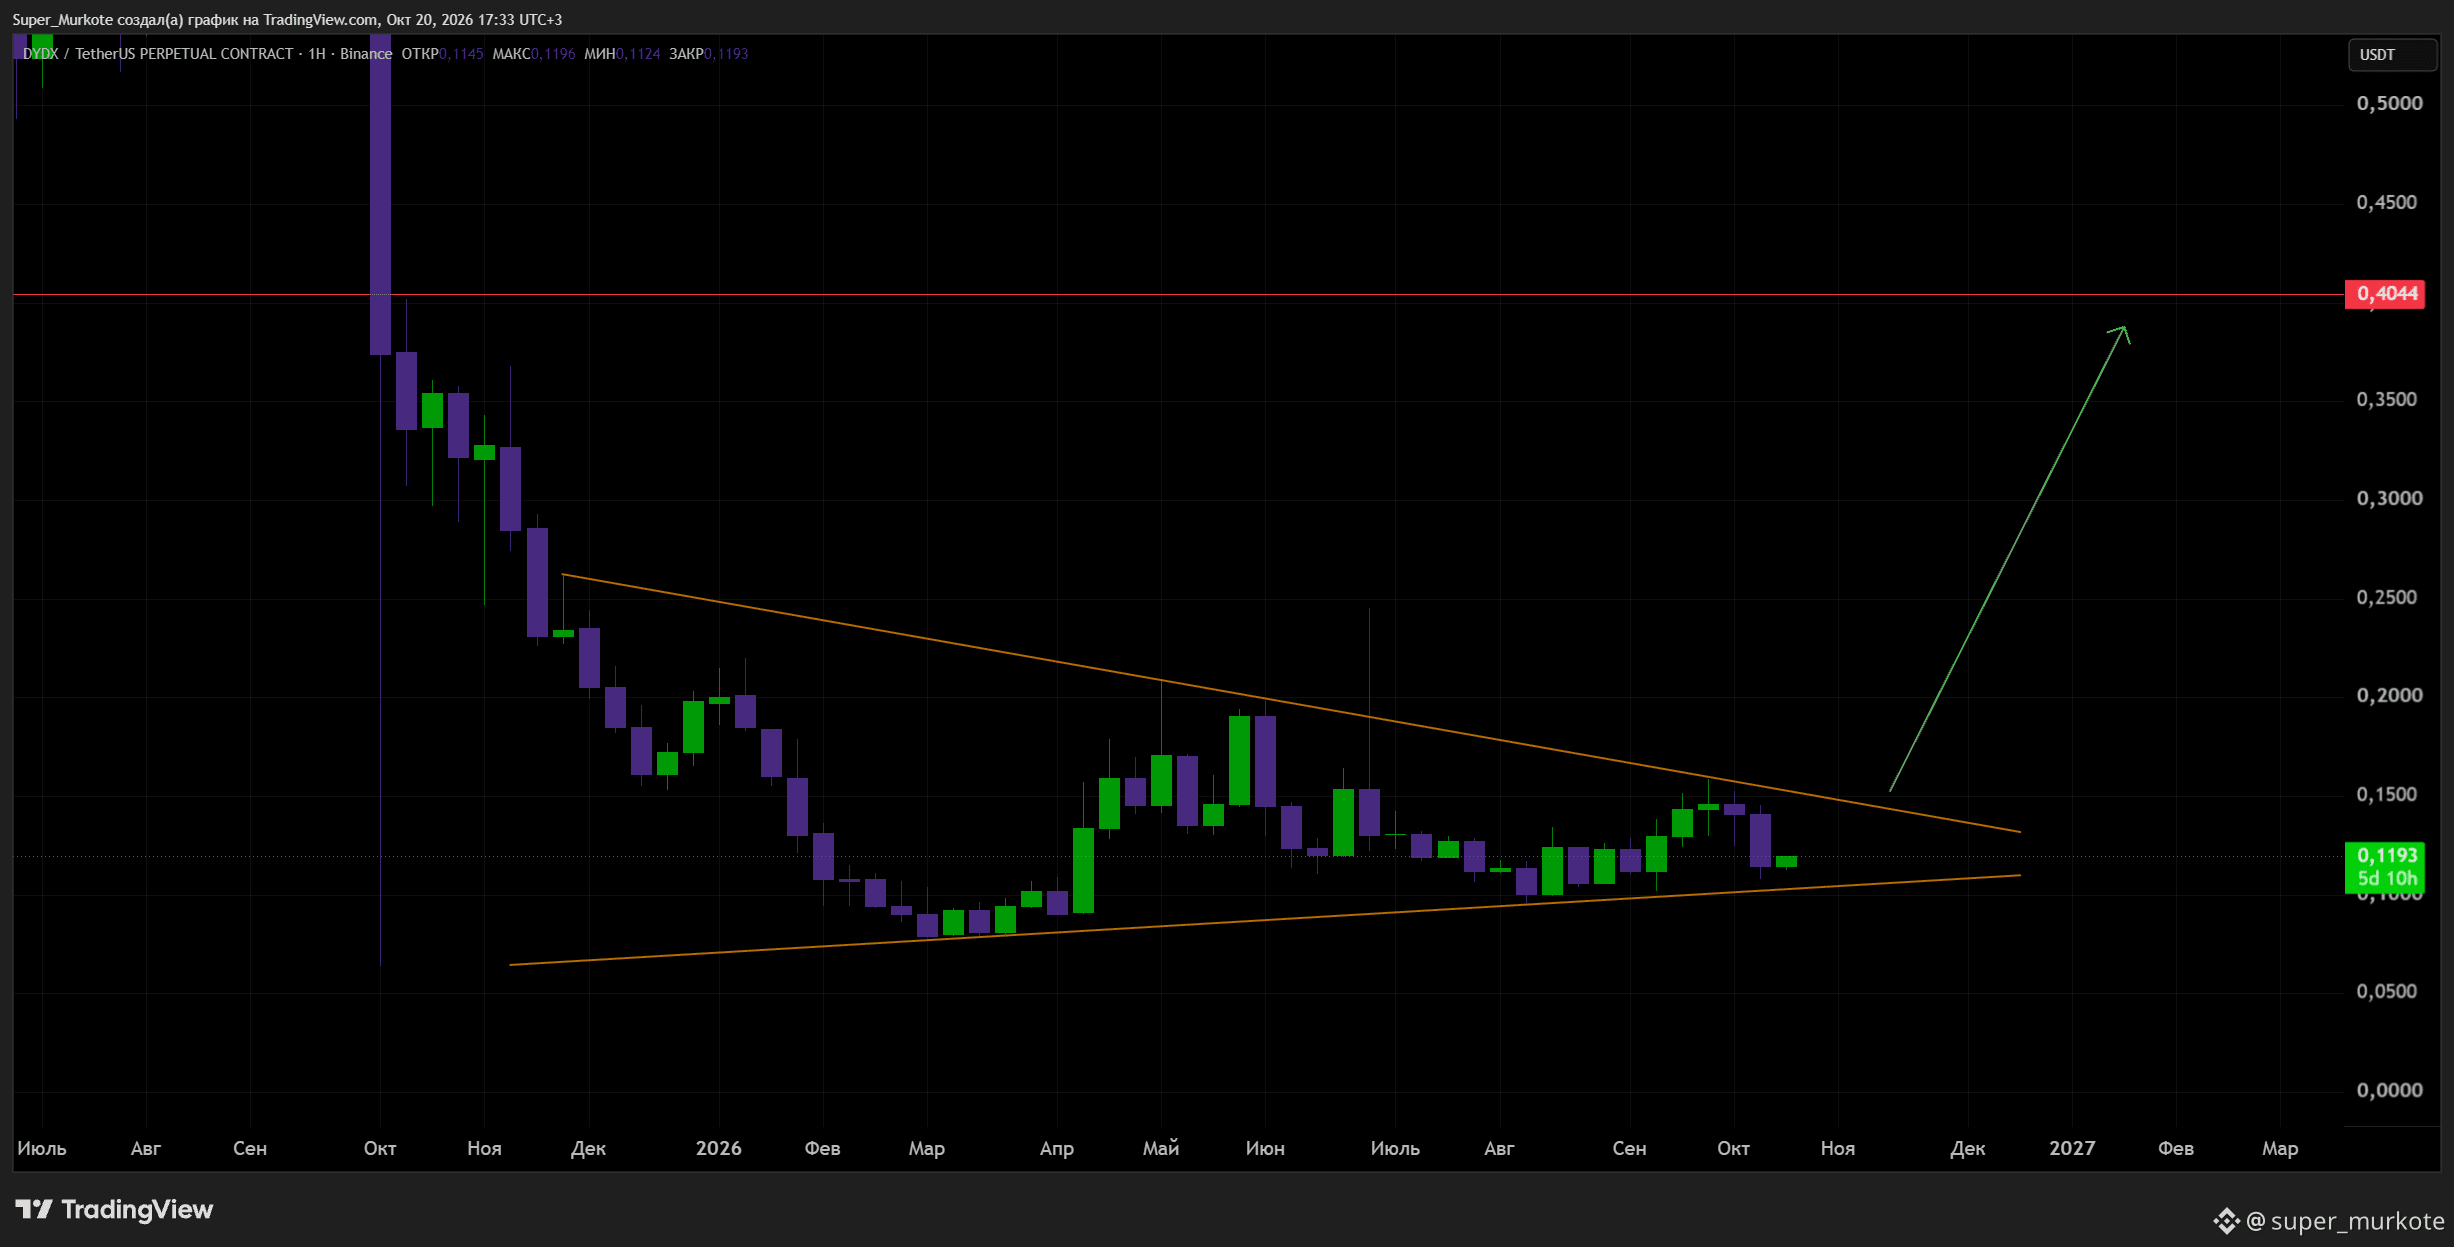
#DYDX Nicely squeezed into a triangle. A good move should follow! 🚀
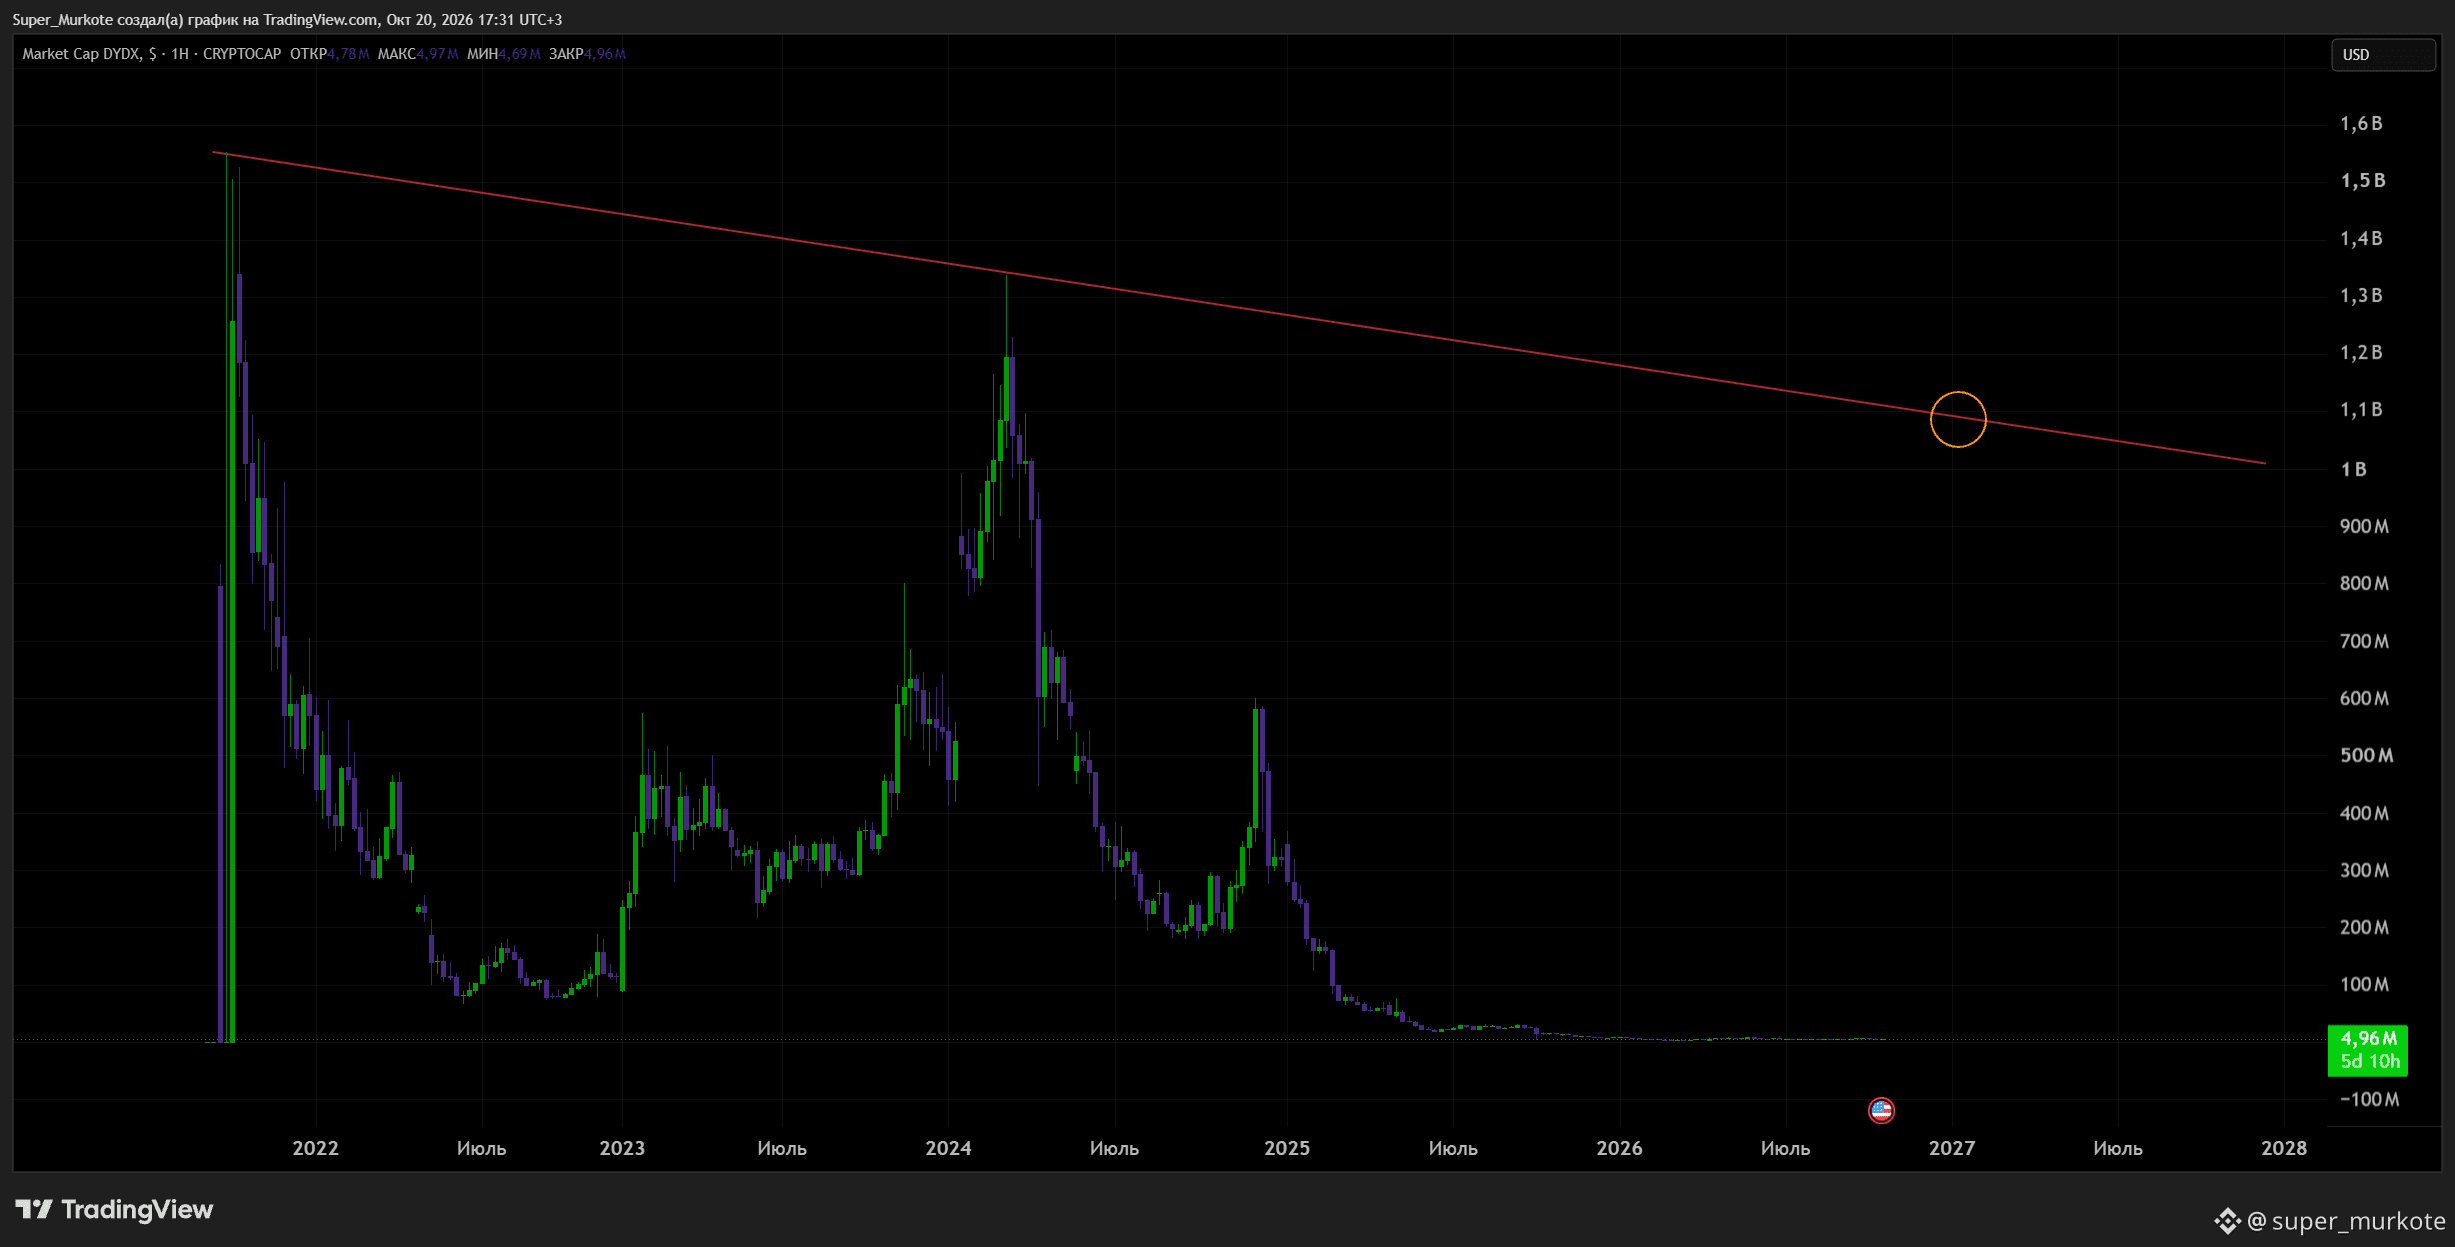
Overall, I think DYDX is extremely undervalued. It’s better to sell based on its market cap rather than its price — around $1 billion. 🐳🍺
Also, before the rise, they may push below the triangle’s lower boundary, taking out long traders’ stop-losses. 🍕
#DYDX Nicely squeezed into a triangle. A good move should follow! 🚀
Overall, I think DYDX is extremely undervalued. It’s better to sell based on its market cap rather than its price — around $1 billion. 🐳🍺
Also, before the rise, they may push below the triangle’s lower boundary, taking out long traders’ stop-losses. 🍕
Overall, I think DYDX is extremely undervalued. It’s better to sell based on its market cap rather than its price — around $1 billion. 🐳🍺
Also, before the rise, they may push below the triangle’s lower boundary, taking out long traders’ stop-losses. 🍕
273
·
--
Bullish
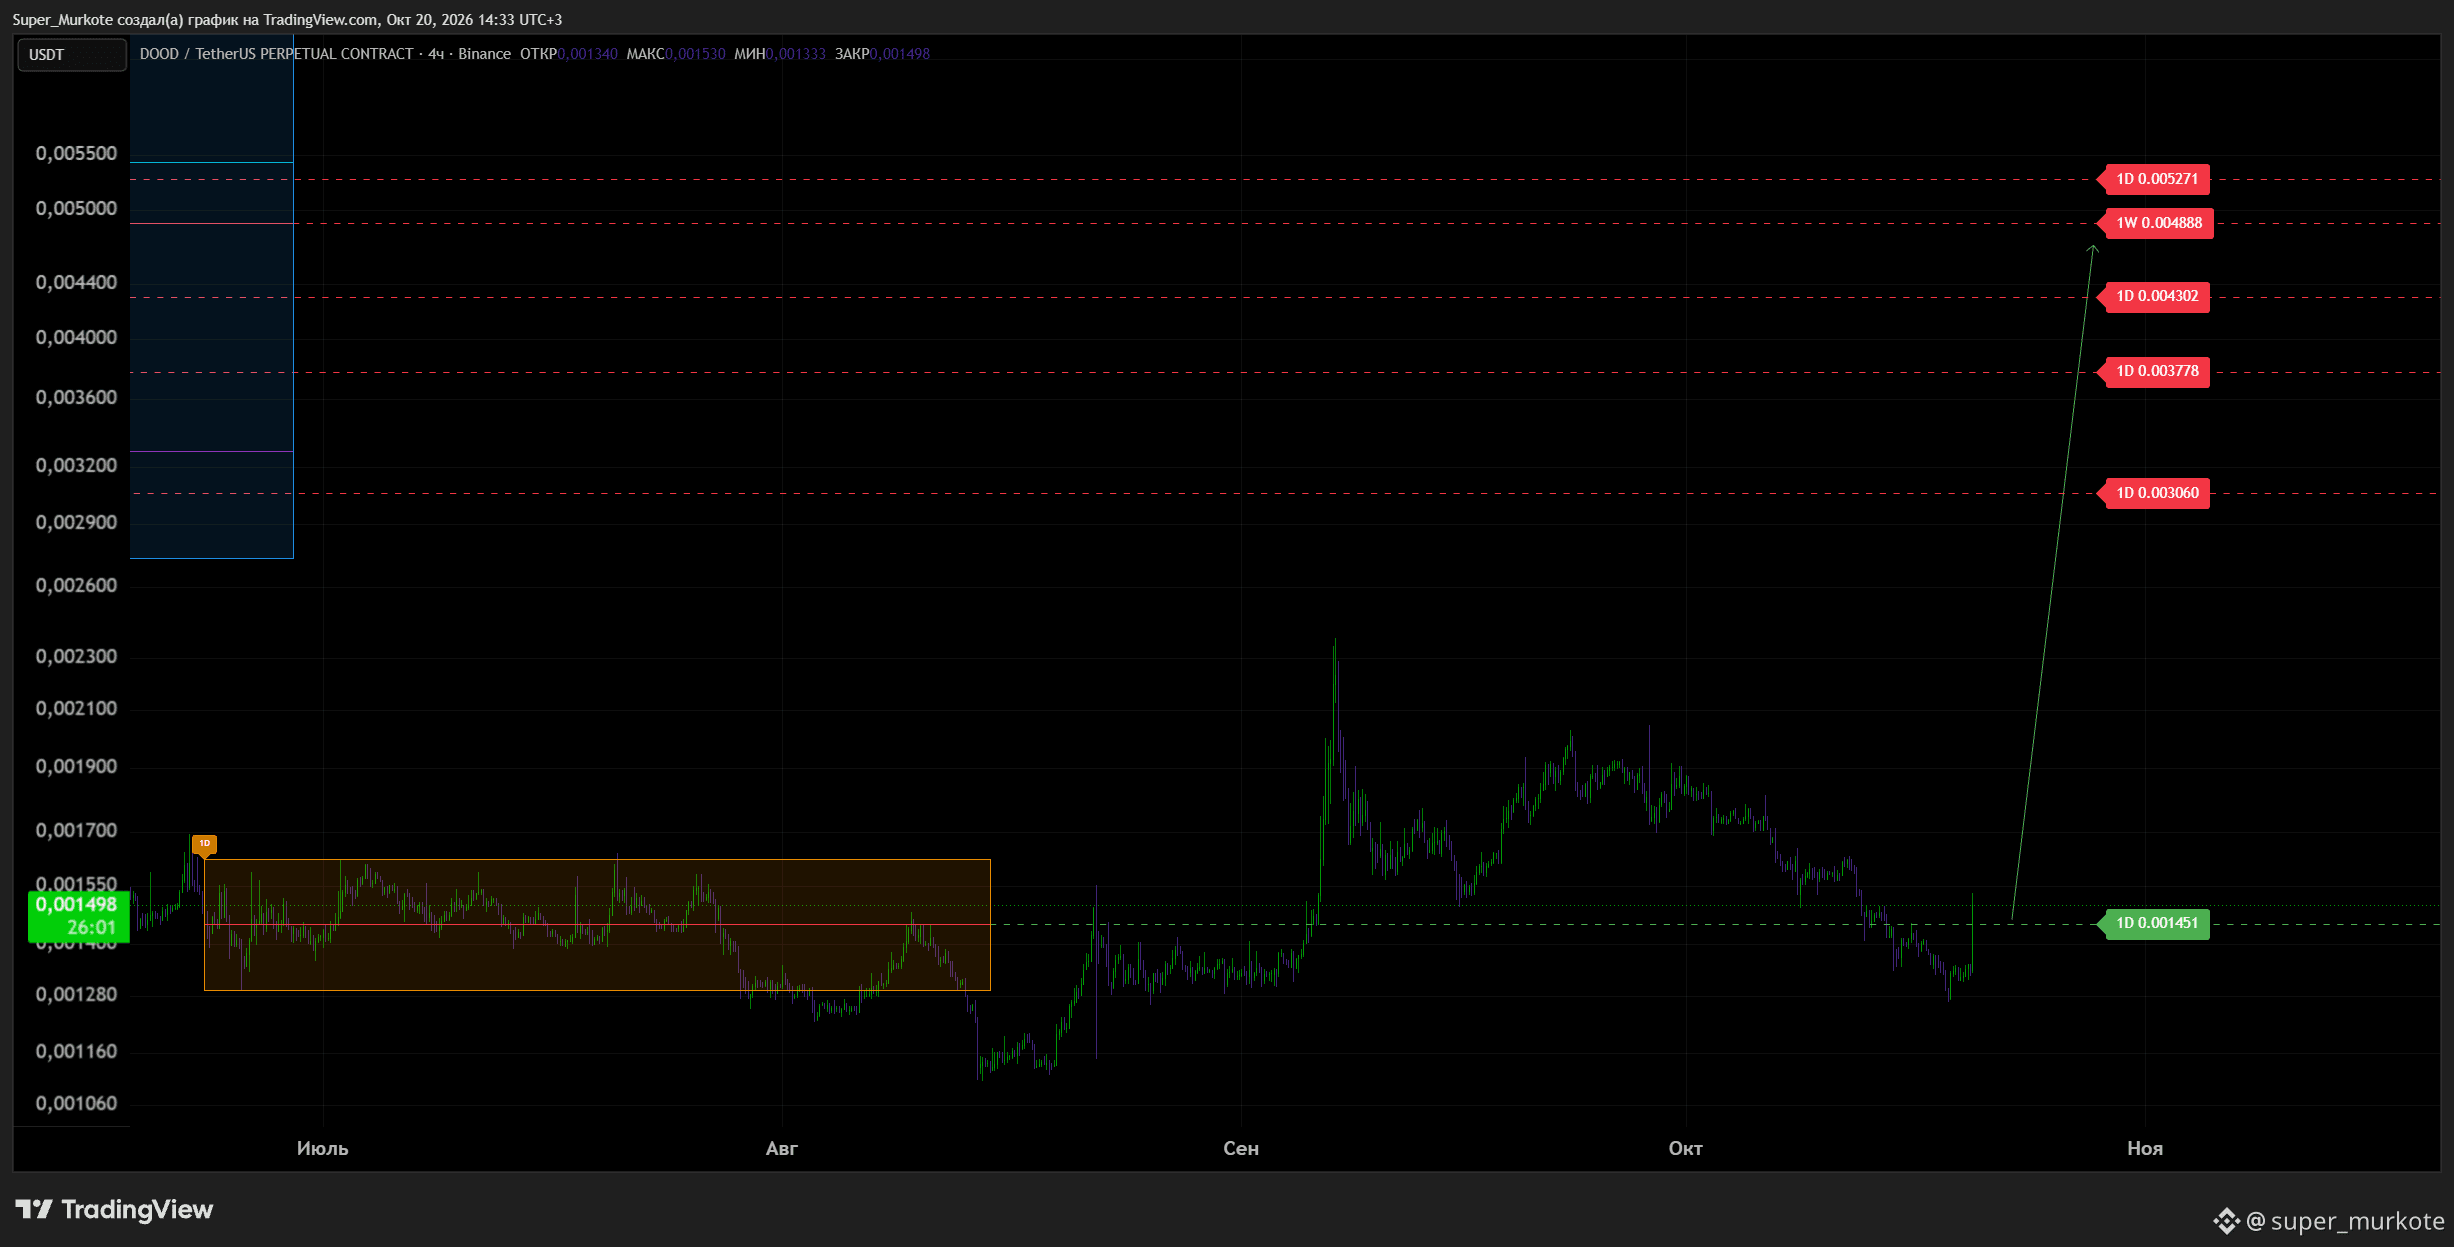
#DOOD Looks like “Dude” is back and showing strength, breaking through the 0.001451 level. 🍺😂
If the rally continues, the targets are marked above. 🚀
#DOOD Looks like “Dude” is back and showing strength, breaking through the 0.001451 level. 🍺😂
If the rally continues, the targets are marked above. 🚀
If the rally continues, the targets are marked above. 🚀
171
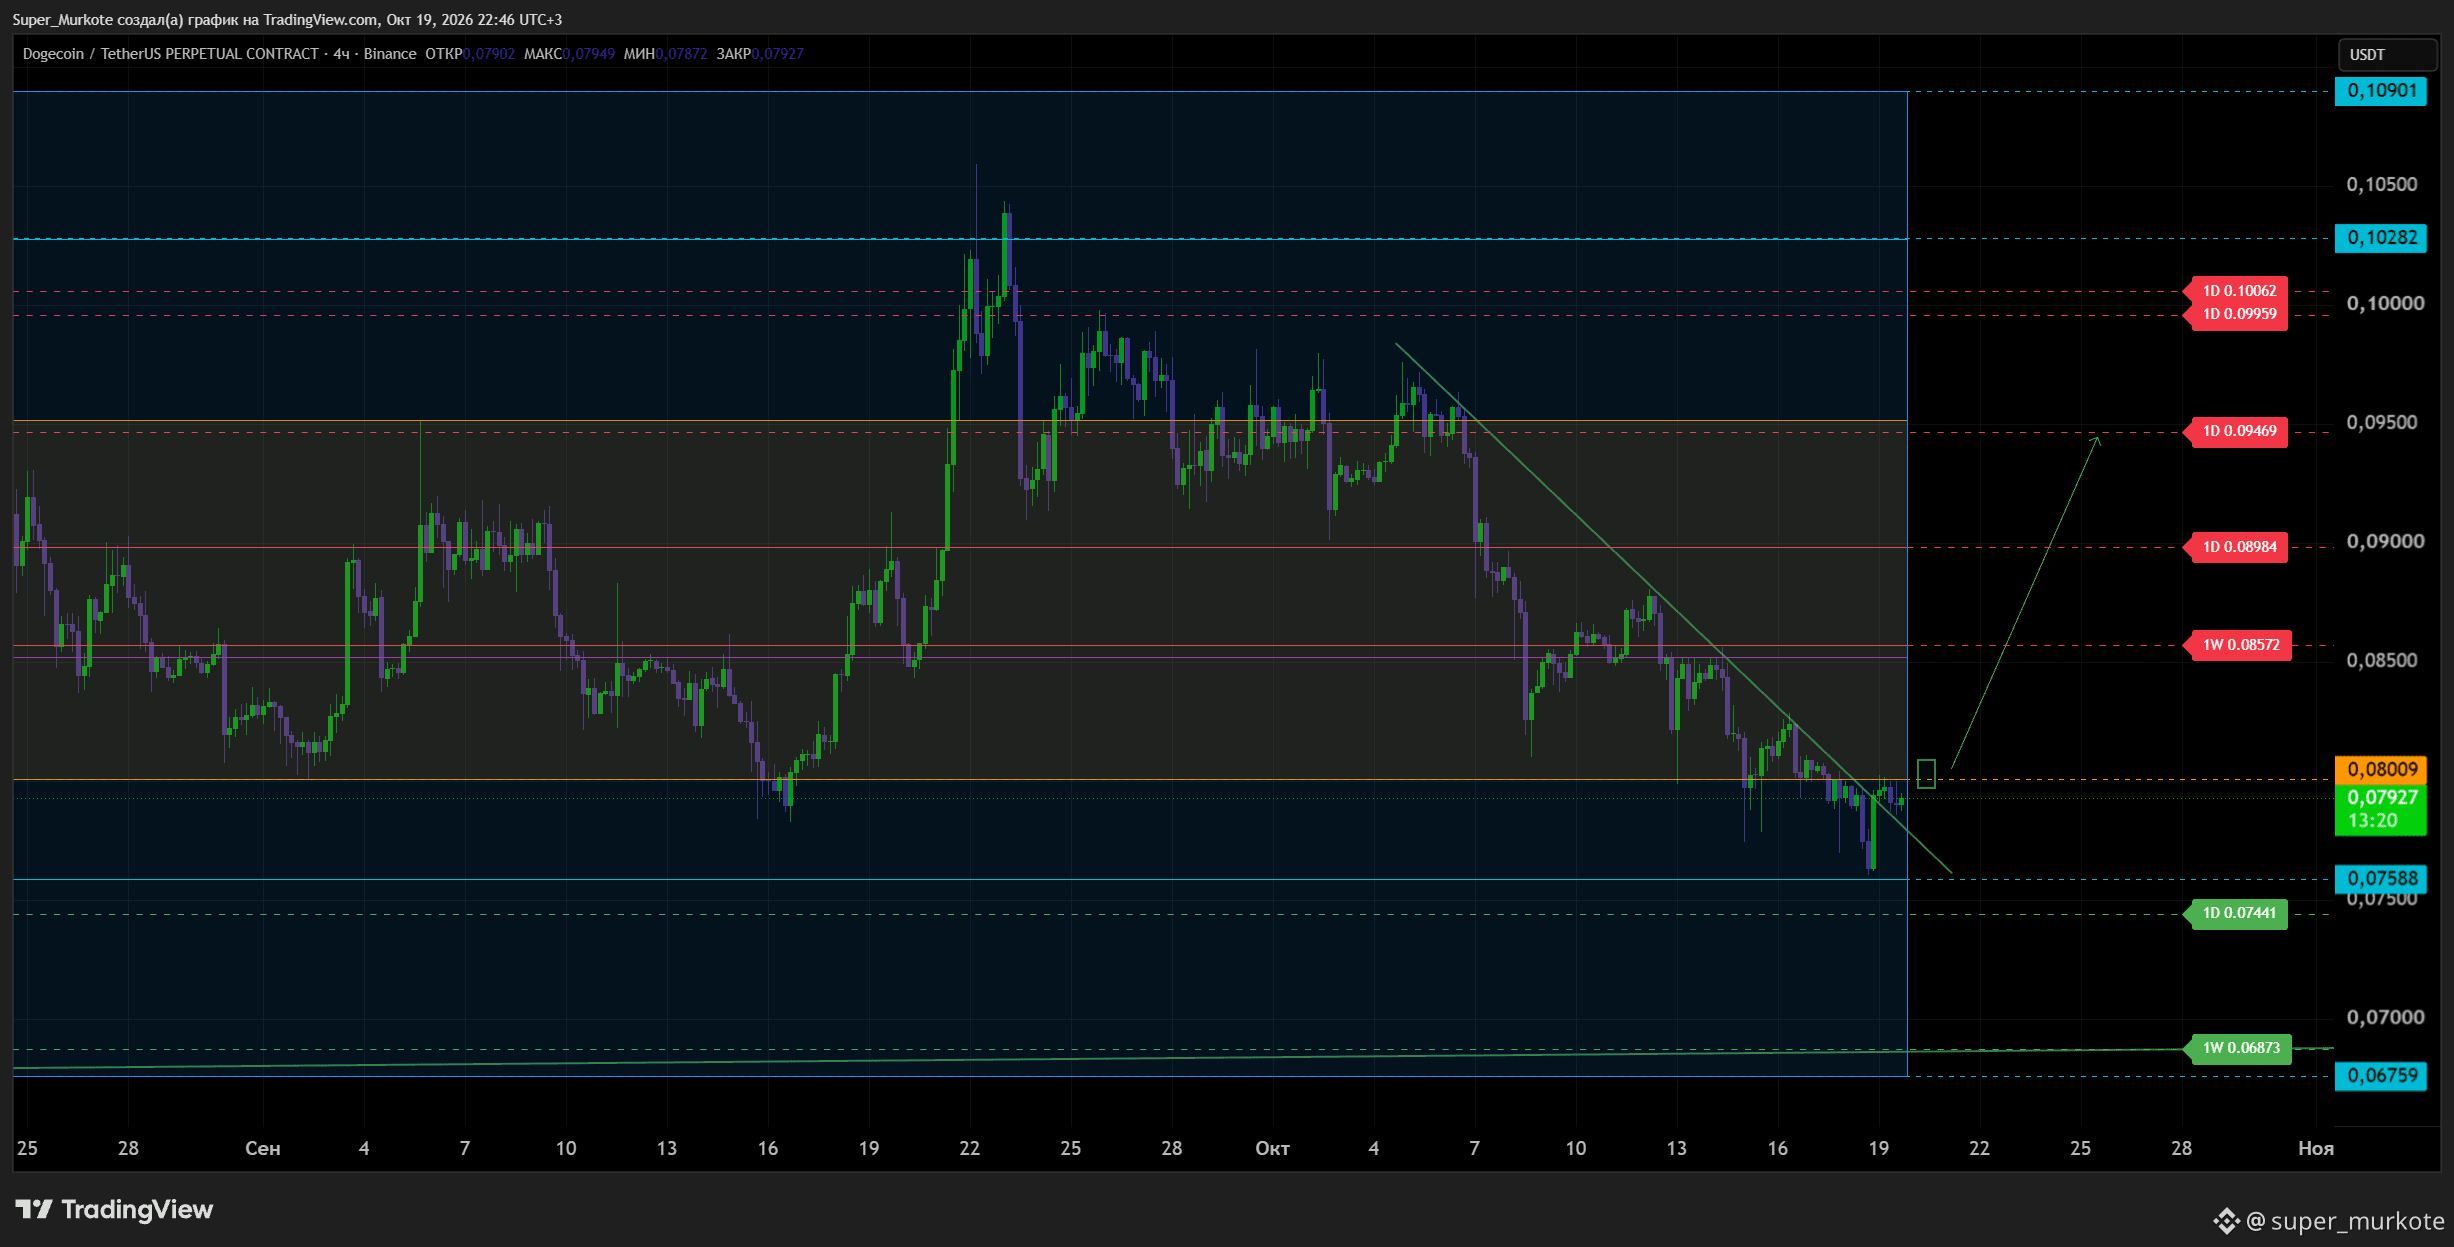
#DOGE It has corrected quite nicely. If it firmly establishes itself above 0.08000, I expect the rise to continue. Buy and sell levels are marked on the chart.
Always do your own analysis and don't trust anyone.🌞
#DOGE It has corrected quite nicely. If it firmly establishes itself above 0.08000, I expect the rise to continue. Buy and sell levels are marked on the chart.
Always do your own analysis and don't trust anyone.🌞
Always do your own analysis and don't trust anyone.🌞
399
·
--
Bullish
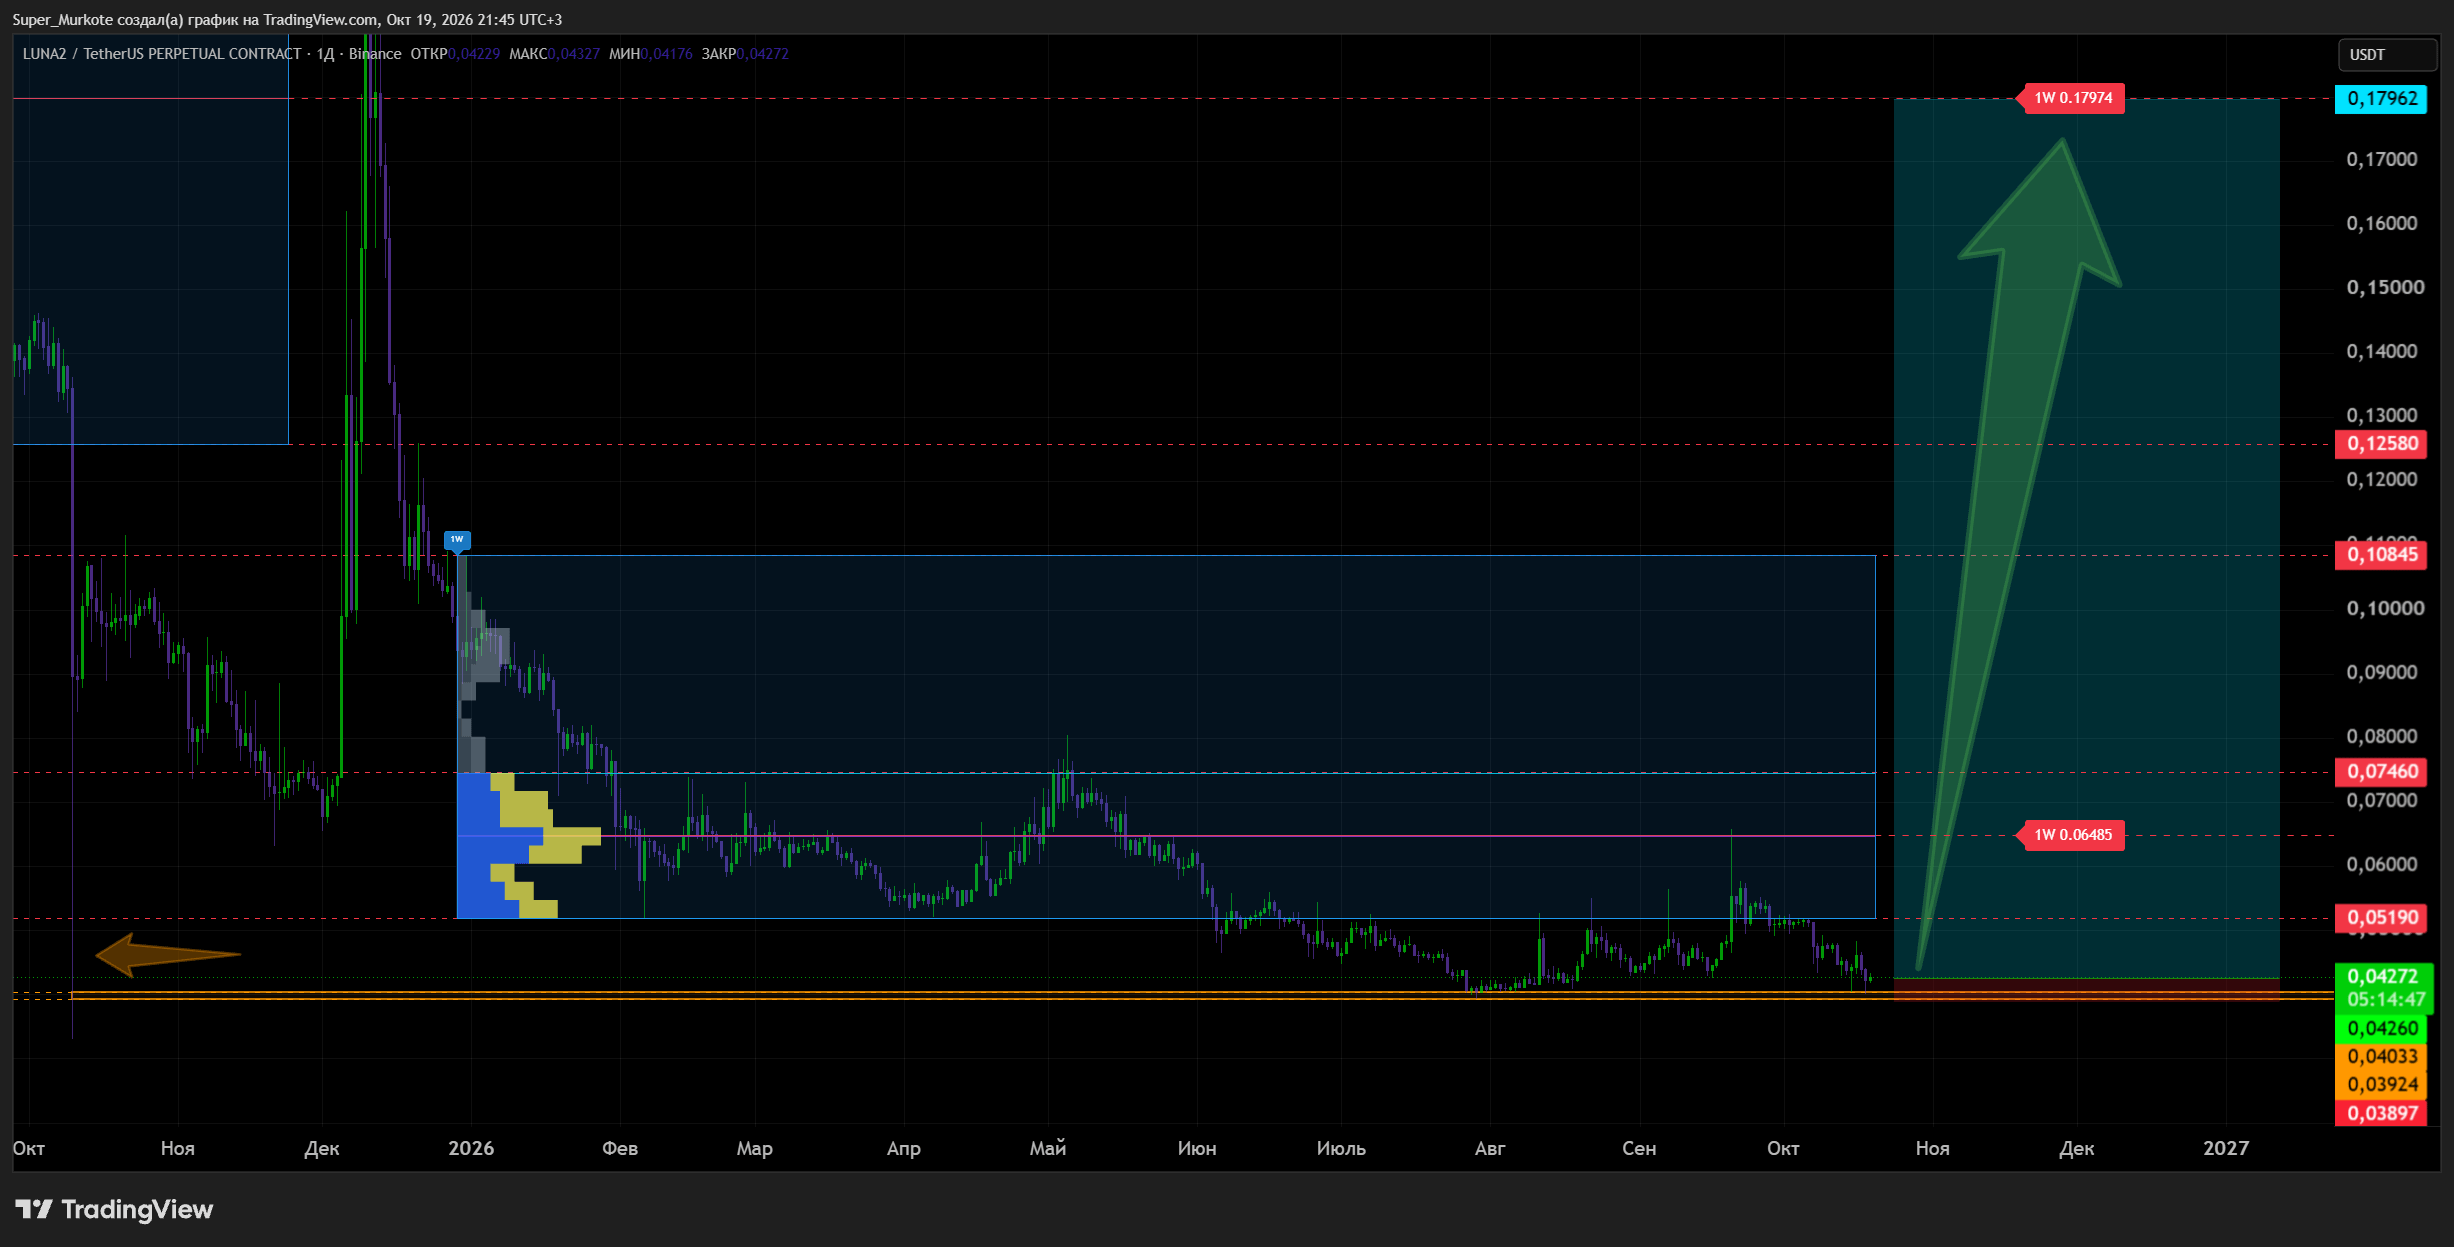
#LUNA2USDT In principle, more than 80% of the wick has already been covered. There is a local support zone at 0.04033–0.03924.
The coin will attract significant interest when it returns to the weekly structure—that is, when it establishes itself above 0.05190. The price could then head toward the upper boundary of the weekly structure at 0.10845.
And if the price breaks out above this structure and holds there, reaching the POC of the previous weekly structure at 0.17974 is usually not too difficult.
Risky, but the potential gains are good too. 🚀
#LUNA2USDT In principle, more than 80% of the wick has already been covered. There is a local support zone at 0.04033–0.03924.
The coin will attract significant interest when it returns to the weekly structure—that is, when it establishes itself above 0.05190. The price could then head toward the upper boundary of the weekly structure at 0.10845.
And if the price breaks out above this structure and holds there, reaching the POC of the previous weekly structure at 0.17974 is usually not too difficult.
Risky, but the potential gains are good too. 🚀
The coin will attract significant interest when it returns to the weekly structure—that is, when it establishes itself above 0.05190. The price could then head toward the upper boundary of the weekly structure at 0.10845.
And if the price breaks out above this structure and holds there, reaching the POC of the previous weekly structure at 0.17974 is usually not too difficult.
Risky, but the potential gains are good too. 🚀
134
·
--
Bearish
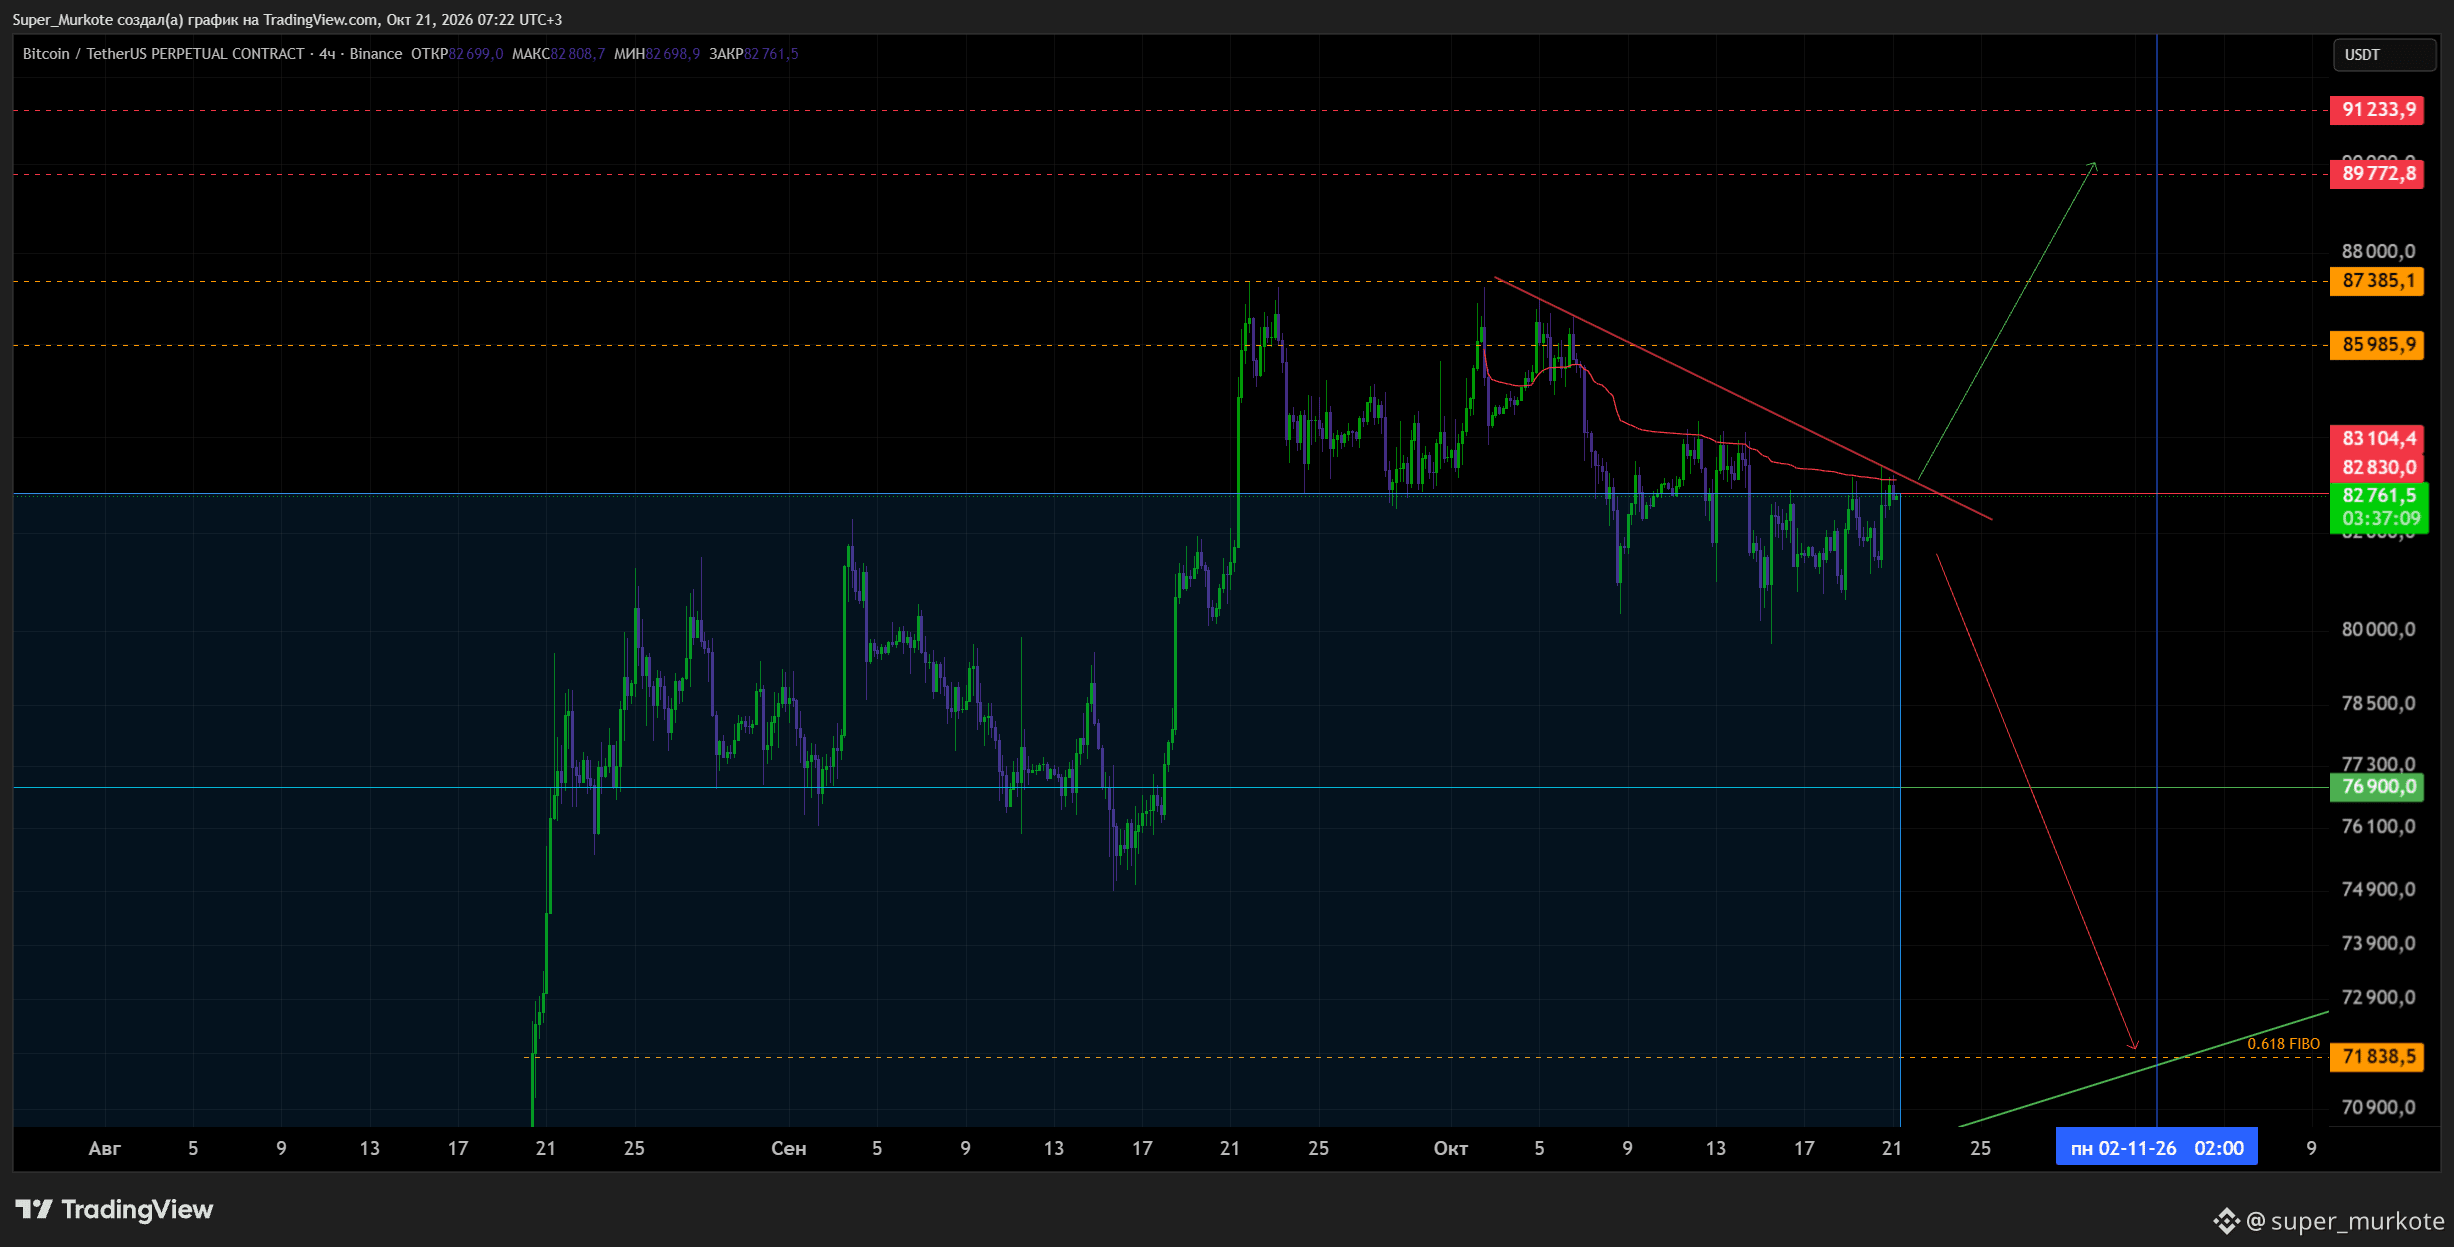
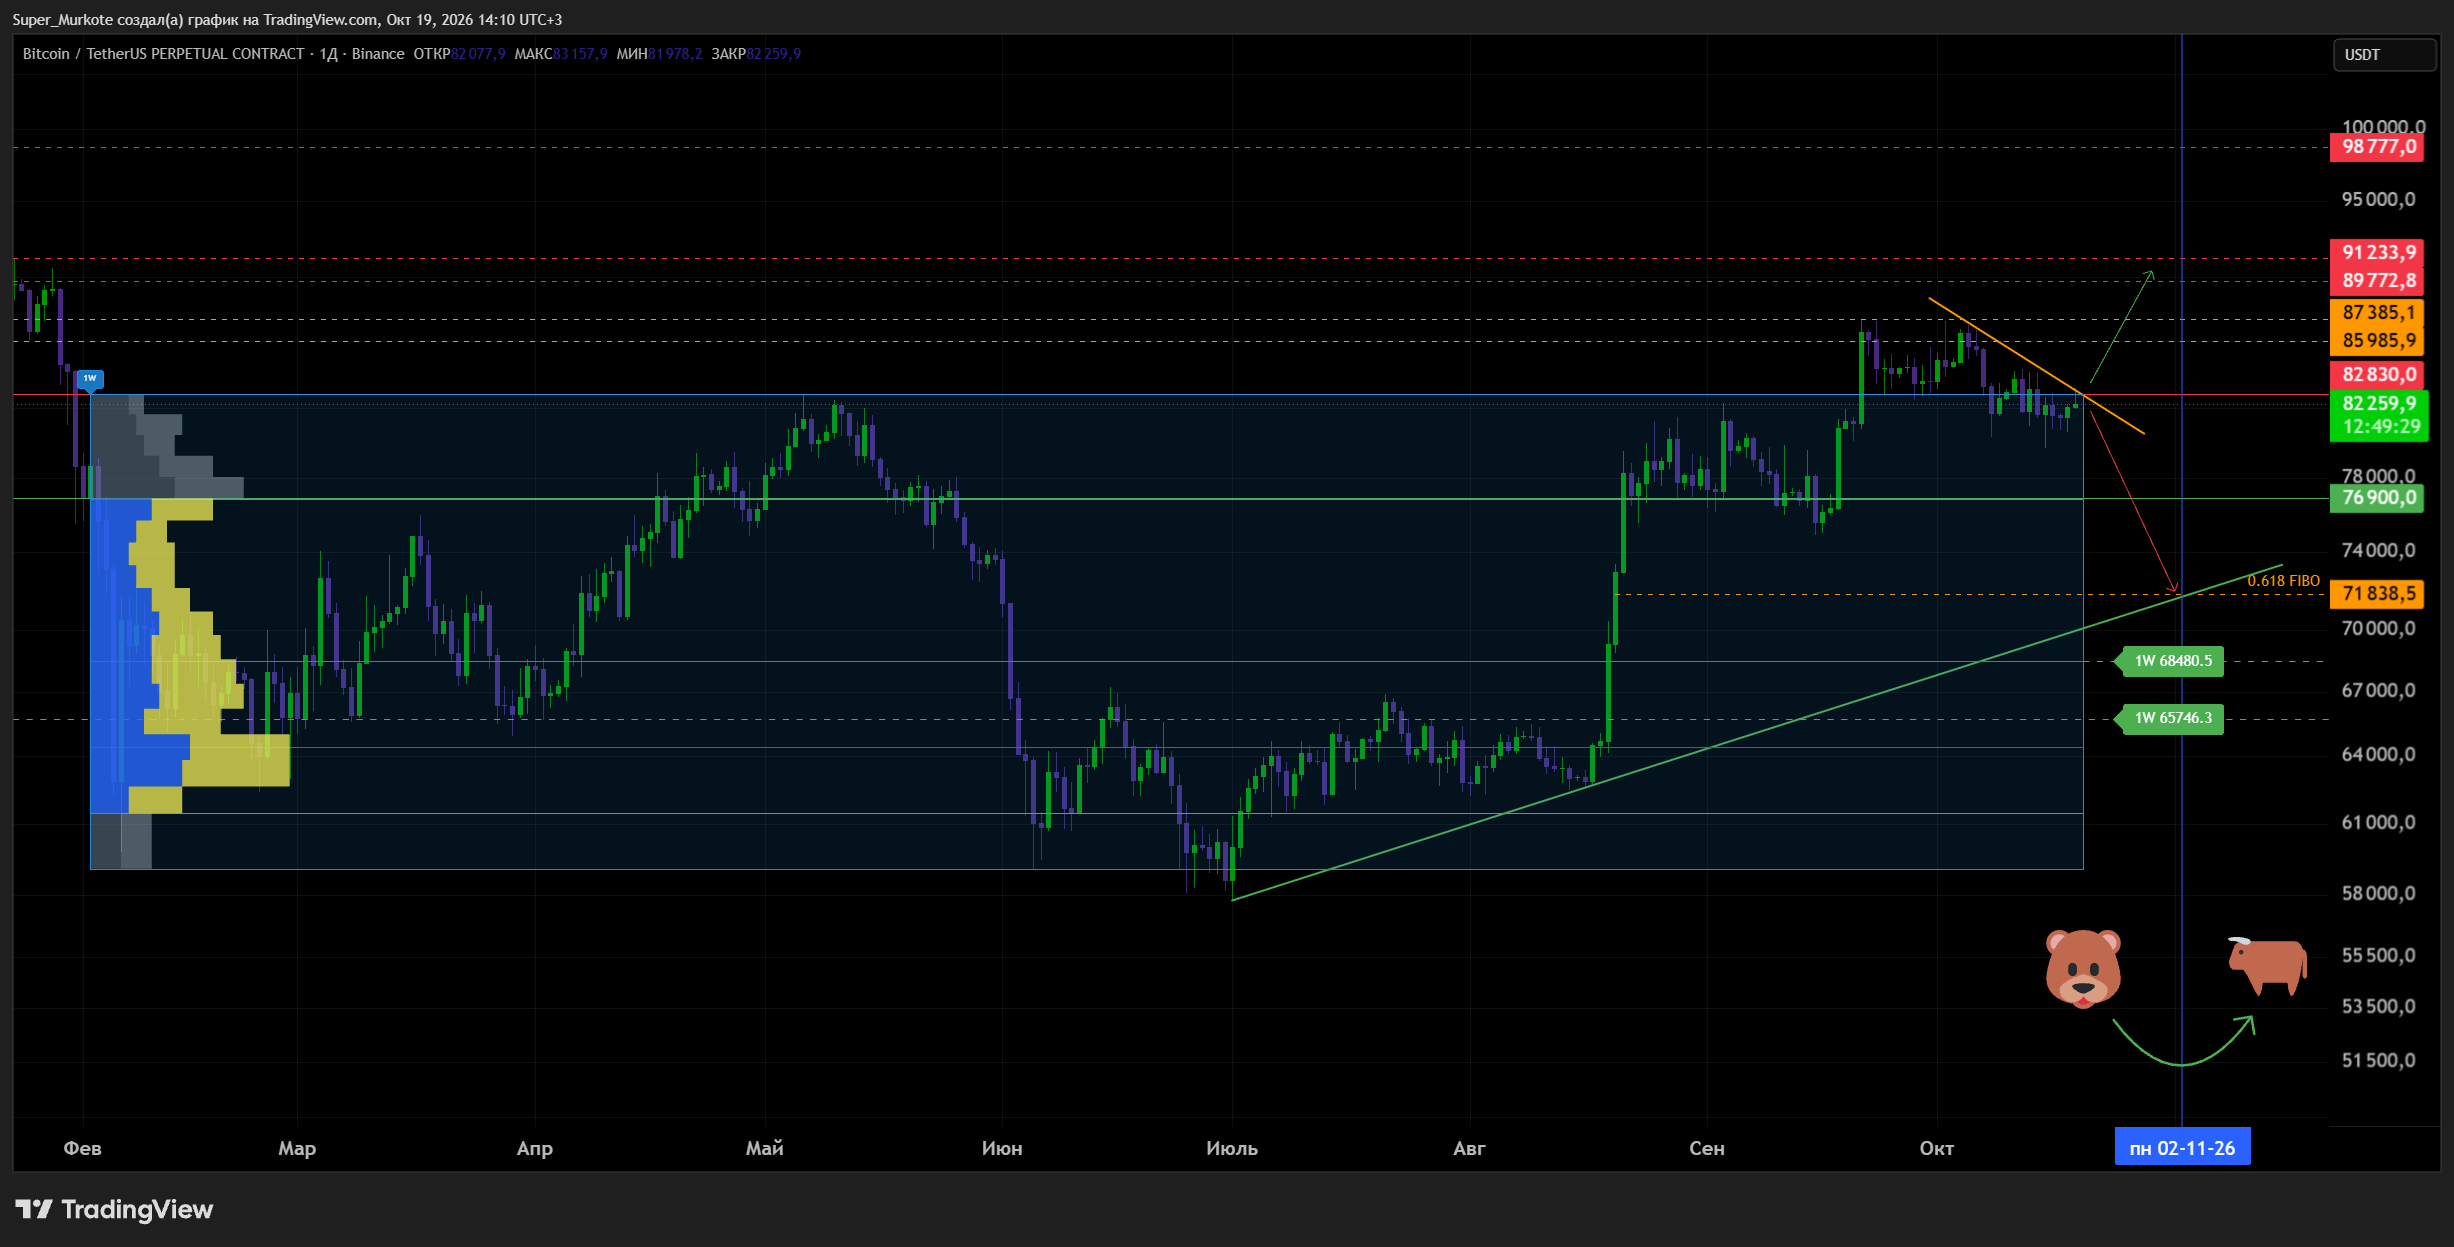
#BTC Pushed BTC into a weekly structure, so for now we continue to decline. If the price consolidates above the orange diagonal line, the upside targets are marked on the chart. 📈
I also want to note that, if we go by cycles, the bear market should end on November 2, after which a bull run is expected. So it’s possible that we are facing the last little dump before a new rise. 🐻➡️🐂
#BTC Pushed BTC into a weekly structure, so for now we continue to decline. If the price consolidates above the orange diagonal line, the upside targets are marked on the chart. 📈
I also want to note that, if we go by cycles, the bear market should end on November 2, after which a bull run is expected. So it’s possible that we are facing the last little dump before a new rise. 🐻➡️🐂
I also want to note that, if we go by cycles, the bear market should end on November 2, after which a bull run is expected. So it’s possible that we are facing the last little dump before a new rise. 🐻➡️🐂
2.3k
Log in to explore more content
Join global crypto users on Binance Square
⚡️ Get latest and useful information about crypto.
💬 Trusted by the world’s largest crypto exchange.
👍 Discover real insights from verified creators.
Email / Phone number
Trending Topics
BinanceSAFUFundTransferCompleted7499BTC
36,845 views
780 Discussing
Binance Says SAFU Fund Transfer Completed, Covering 7,499 BTC
Binance News
·51 Likes
·25.9k views
BinanceRecovery90% of stolen assets
136,365 views
172 Discussing
YiHe:ProofOfReserves:10TokensAt100%Backing
136,742 views
739 Discussing