

砸你乃个别
1.2k Posts

砸你乃个别
Report
Block User
✅博主公众号:币圈罗盘|7 年加密货币分析师 | 区块链行业老兵|
市场情绪捕手|在币圈,心态比技术更重要|一起浪迹Web3|
🎯 目标:带100个兄弟吃上板块轮动肉
High-Frequency Trader
9.8 Months
1.2K+ Following
668 Followers
478 Liked
Posts
All
Quotes
·
--
After doing a few deals with you, I'm really impressed. Is the hit rate that low?
After doing a few deals with you, I'm really impressed. Is the hit rate that low?


起愿
·
--
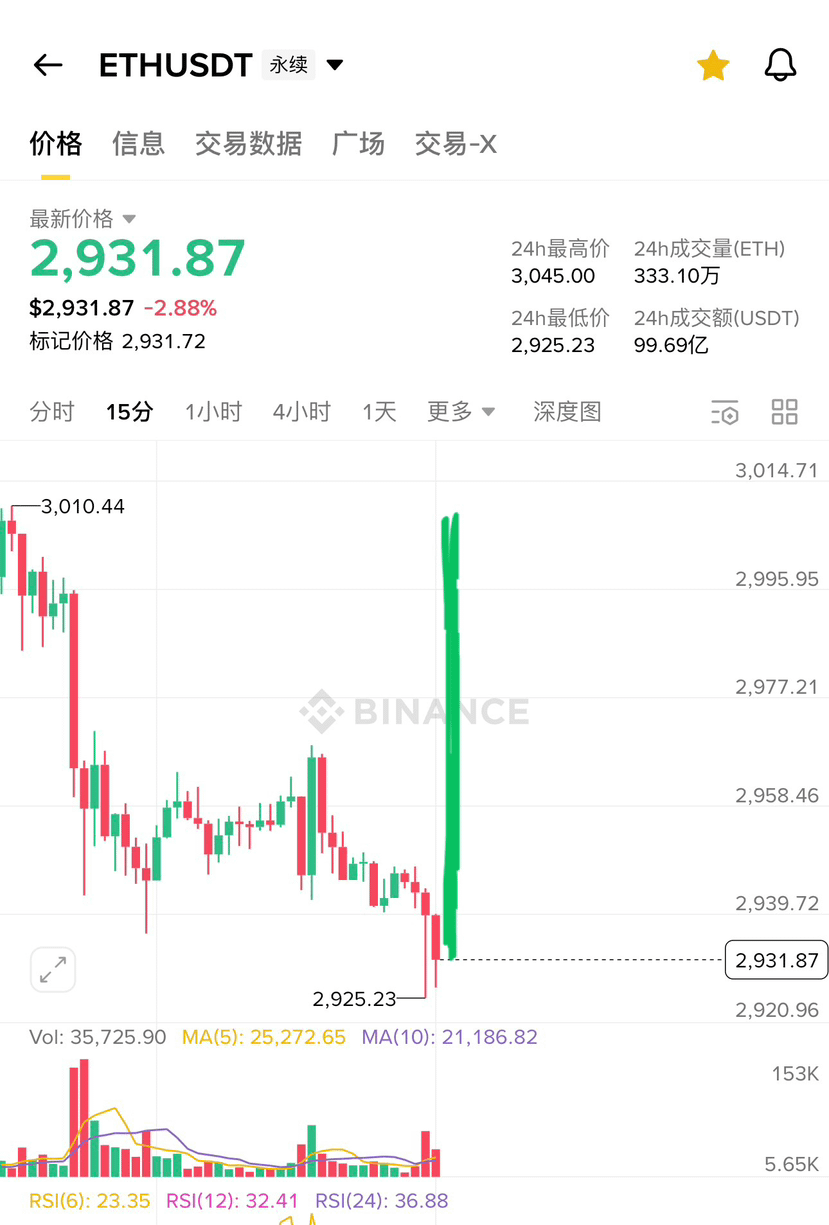
BullishHurry up and buy the dip, the market is about to rally 😱
63
·
--
Bullish
$RIVER didn't eat meat here once, exploded me 7.8 times!
$RIVER didn't eat meat here once, exploded me 7.8 times!
1
1
1.1k
·
--

Article
Trading Psychology and Discipline Execution: A Practical Manual to Overcome Human Weaknesses in Breakout MarketsWhen Bitcoin breaks the $100,000 mark, market sentiment often shifts from skepticism to frenzy. Data from January 2026 shows that when the price exceeds $96,000, retail trading frequency increases threefold, but the average return drops by 15%. Discipline execution is not an empty slogan but a practical technique to suppress emotional interference through systematic methods.
Targeted correction of cognitive biases
The most typical psychological trap in a breakout market is 'stop-loss paralysis.' After a position becomes profitable, investors tend to infinitely raise their stop-loss levels, resulting in significant profit retracement. An effective way to combat this trap is to set a 'trailing stop-loss box': reduce the position by 30% when the price retraces 5% from the highest point, and reduce another 40% when it retraces 10%, keeping a 30% position to capture greater gains. Another common bias is 'confirmation bias,' focusing only on information that supports bullish views while ignoring risk signals. The solution is to force thought through a 'reverse checklist': write down three bearish reasons before each trade and assess their likelihood.
Trading Psychology and Discipline Execution: A Practical Manual to Overcome Human Weaknesses in Breakout Markets
When Bitcoin breaks the $100,000 mark, market sentiment often shifts from skepticism to frenzy. Data from January 2026 shows that when the price exceeds $96,000, retail trading frequency increases threefold, but the average return drops by 15%. Discipline execution is not an empty slogan but a practical technique to suppress emotional interference through systematic methods.
Targeted correction of cognitive biases
The most typical psychological trap in a breakout market is 'stop-loss paralysis.' After a position becomes profitable, investors tend to infinitely raise their stop-loss levels, resulting in significant profit retracement. An effective way to combat this trap is to set a 'trailing stop-loss box': reduce the position by 30% when the price retraces 5% from the highest point, and reduce another 40% when it retraces 10%, keeping a 30% position to capture greater gains. Another common bias is 'confirmation bias,' focusing only on information that supports bullish views while ignoring risk signals. The solution is to force thought through a 'reverse checklist': write down three bearish reasons before each trade and assess their likelihood.
Targeted correction of cognitive biases
The most typical psychological trap in a breakout market is 'stop-loss paralysis.' After a position becomes profitable, investors tend to infinitely raise their stop-loss levels, resulting in significant profit retracement. An effective way to combat this trap is to set a 'trailing stop-loss box': reduce the position by 30% when the price retraces 5% from the highest point, and reduce another 40% when it retraces 10%, keeping a 30% position to capture greater gains. Another common bias is 'confirmation bias,' focusing only on information that supports bullish views while ignoring risk signals. The solution is to force thought through a 'reverse checklist': write down three bearish reasons before each trade and assess their likelihood.
217
·
--

Article
Customized combat plan based on funding scale: Different strategies from 100,000 to 10,000,000
In the situation of Bitcoin breaking out, the scale of funds determines the focus of the strategy. Data shows that accounts under 100,000 USD had an average return of 145% during the 2025 bull market, but with a drawdown of over 40%; while accounts over 1,000,000 USD had an average return of 85%, with drawdowns controlled within 15%. The core of differentiated strategies lies in liquidity management, position building rhythm, and tool selection.
100,000 level funding: trend following as the main strategy, avoiding excessive diversification
Small funds should focus on mainstream cryptocurrencies, using a '2-3-5' position allocation: 20% for Bitcoin dollar-cost averaging, 30% for Ethereum allocation, and 50% concentrated on 1-2 strong altcoins (e.g., SOL). When establishing positions, adopt a 'breakout and pullback' strategy: after the price breaks through key resistance, wait for a pullback near the breakout point to enter. For example, after Bitcoin breaks 96,000 USD, a pullback to 95,000 USD support is an ideal buying point. At the same time, strictly limit leverage to no more than 3 times, avoiding significant losses from a single mistake.
In the situation of Bitcoin breaking out, the scale of funds determines the focus of the strategy. Data shows that accounts under 100,000 USD had an average return of 145% during the 2025 bull market, but with a drawdown of over 40%; while accounts over 1,000,000 USD had an average return of 85%, with drawdowns controlled within 15%. The core of differentiated strategies lies in liquidity management, position building rhythm, and tool selection.
100,000 level funding: trend following as the main strategy, avoiding excessive diversification
Small funds should focus on mainstream cryptocurrencies, using a '2-3-5' position allocation: 20% for Bitcoin dollar-cost averaging, 30% for Ethereum allocation, and 50% concentrated on 1-2 strong altcoins (e.g., SOL). When establishing positions, adopt a 'breakout and pullback' strategy: after the price breaks through key resistance, wait for a pullback near the breakout point to enter. For example, after Bitcoin breaks 96,000 USD, a pullback to 95,000 USD support is an ideal buying point. At the same time, strictly limit leverage to no more than 3 times, avoiding significant losses from a single mistake.
Customized combat plan based on funding scale: Different strategies from 100,000 to 10,000,000
In the situation of Bitcoin breaking out, the scale of funds determines the focus of the strategy. Data shows that accounts under 100,000 USD had an average return of 145% during the 2025 bull market, but with a drawdown of over 40%; while accounts over 1,000,000 USD had an average return of 85%, with drawdowns controlled within 15%. The core of differentiated strategies lies in liquidity management, position building rhythm, and tool selection.
100,000 level funding: trend following as the main strategy, avoiding excessive diversification
Small funds should focus on mainstream cryptocurrencies, using a '2-3-5' position allocation: 20% for Bitcoin dollar-cost averaging, 30% for Ethereum allocation, and 50% concentrated on 1-2 strong altcoins (e.g., SOL). When establishing positions, adopt a 'breakout and pullback' strategy: after the price breaks through key resistance, wait for a pullback near the breakout point to enter. For example, after Bitcoin breaks 96,000 USD, a pullback to 95,000 USD support is an ideal buying point. At the same time, strictly limit leverage to no more than 3 times, avoiding significant losses from a single mistake.
328
·
--

Article
Pyramid of Risk Control: A Comprehensive Defense System from Stop Loss Strategies to Options ProtectionThe process of Bitcoin breaking through $100,000 will inevitably be accompanied by violent fluctuations. Data from January 2026 shows that within 24 hours of reaching a high of $97,777, Bitcoin experienced a maximum drawdown of 7.2%, leading to a liquidation of $136.7 million for leveraged traders. Risk control is not simply about setting stop losses, but rather building a multi-layered defense system that ranges from position management to hedging tools.
Intelligent Upgrade of Stop Loss Strategy
Traditional fixed ratio stop loss is easily breached in extreme market conditions. A more effective method is to dynamically adjust based on volatility: set the stop loss 1.5 times the ATR below the entry price, using the 20-day average true range (ATR) as a benchmark. For example, when Bitcoin's ATR is $2000, set the stop loss width at $3000 to avoid 80% of noise fluctuations. Additionally, implement a 'tiered stop loss' mechanism: reduce the position by 30% when the price falls below the 5-day moving average, and reduce by another 40% when it falls below the 20-day moving average, effectively reducing the impact of a single erroneous judgment.
Pyramid of Risk Control: A Comprehensive Defense System from Stop Loss Strategies to Options Protection
The process of Bitcoin breaking through $100,000 will inevitably be accompanied by violent fluctuations. Data from January 2026 shows that within 24 hours of reaching a high of $97,777, Bitcoin experienced a maximum drawdown of 7.2%, leading to a liquidation of $136.7 million for leveraged traders. Risk control is not simply about setting stop losses, but rather building a multi-layered defense system that ranges from position management to hedging tools.
Intelligent Upgrade of Stop Loss Strategy
Traditional fixed ratio stop loss is easily breached in extreme market conditions. A more effective method is to dynamically adjust based on volatility: set the stop loss 1.5 times the ATR below the entry price, using the 20-day average true range (ATR) as a benchmark. For example, when Bitcoin's ATR is $2000, set the stop loss width at $3000 to avoid 80% of noise fluctuations. Additionally, implement a 'tiered stop loss' mechanism: reduce the position by 30% when the price falls below the 5-day moving average, and reduce by another 40% when it falls below the 20-day moving average, effectively reducing the impact of a single erroneous judgment.
Intelligent Upgrade of Stop Loss Strategy
Traditional fixed ratio stop loss is easily breached in extreme market conditions. A more effective method is to dynamically adjust based on volatility: set the stop loss 1.5 times the ATR below the entry price, using the 20-day average true range (ATR) as a benchmark. For example, when Bitcoin's ATR is $2000, set the stop loss width at $3000 to avoid 80% of noise fluctuations. Additionally, implement a 'tiered stop loss' mechanism: reduce the position by 30% when the price falls below the 5-day moving average, and reduce by another 40% when it falls below the 20-day moving average, effectively reducing the impact of a single erroneous judgment.
373
·
--

Article
Resonance of Technical and On-Chain Signals: A Triple Verification Method to Accurately Capture Bitcoin Breakout Buy PointsIn Bitcoin breakout scenarios, relying solely on candlestick patterns often leads to false breakout traps. On January 15, 2026, when the price surged to $97,777, a classic bullish engulfing pattern appeared on the 4-hour chart, but on-chain data showed a net inflow of 120,000 BTC into exchanges, followed by a price pullback to $94,000. A truly valid buy signal must meet the triple verification of technical analysis, on-chain data, and capital flow.
Verification of the effectiveness of technical breakthroughs
A real breakthrough requires an increase in trading volume and indicator resonance. For example, when Bitcoin stabilizes at $96,000, its daily RSI breaks through the downward trend line, the MACD histogram increases for three consecutive days, and the Bollinger Bands widen by more than 30%. More importantly, the duration of the breakthrough matters: a valid breakthrough must meet the '3% amplitude + 24 hours stabilization' principle, which means the price must break through a key resistance level by more than 3% and not fall back into the original range within 24 hours. This filtering mechanism can avoid 70% of false breakout signals.
Resonance of Technical and On-Chain Signals: A Triple Verification Method to Accurately Capture Bitcoin Breakout Buy Points
In Bitcoin breakout scenarios, relying solely on candlestick patterns often leads to false breakout traps. On January 15, 2026, when the price surged to $97,777, a classic bullish engulfing pattern appeared on the 4-hour chart, but on-chain data showed a net inflow of 120,000 BTC into exchanges, followed by a price pullback to $94,000. A truly valid buy signal must meet the triple verification of technical analysis, on-chain data, and capital flow.
Verification of the effectiveness of technical breakthroughs
A real breakthrough requires an increase in trading volume and indicator resonance. For example, when Bitcoin stabilizes at $96,000, its daily RSI breaks through the downward trend line, the MACD histogram increases for three consecutive days, and the Bollinger Bands widen by more than 30%. More importantly, the duration of the breakthrough matters: a valid breakthrough must meet the '3% amplitude + 24 hours stabilization' principle, which means the price must break through a key resistance level by more than 3% and not fall back into the original range within 24 hours. This filtering mechanism can avoid 70% of false breakout signals.
Verification of the effectiveness of technical breakthroughs
A real breakthrough requires an increase in trading volume and indicator resonance. For example, when Bitcoin stabilizes at $96,000, its daily RSI breaks through the downward trend line, the MACD histogram increases for three consecutive days, and the Bollinger Bands widen by more than 30%. More importantly, the duration of the breakthrough matters: a valid breakthrough must meet the '3% amplitude + 24 hours stabilization' principle, which means the price must break through a key resistance level by more than 3% and not fall back into the original range within 24 hours. This filtering mechanism can avoid 70% of false breakout signals.
386
·
--

Article
The Art of Position Management: How to Control Risk Through Asset Allocation in Bitcoin Breakout MarketsAt the critical moment when Bitcoin approaches the $100,000 mark, scientific position management is the dividing line between professional investors and amateur players. Data from January 2026 shows that when Bitcoin broke through $96,000, the market volatility surged by 35% in a single day. However, investors using a layered position strategy controlled their maximum drawdown to within 12%, while those who went all-in faced an average drawdown of 28%. True position management is not simply about allocating funds, but achieving a dynamic balance between risk and return through systematic allocation.
Three-tier Position Structure: Defense, Guerrilla, and Nuclear
Core positions (60%) should be allocated to highly liquid assets such as Bitcoin and Ethereum. These assets have relatively controllable volatility and possess sustained momentum when breaking through key levels. For instance, after Bitcoin stabilized at $95,000, its 30-day volatility dropped from 80% to 45%, making it the stabilizer of the portfolio. Guerrilla positions (30%) are used to layout high-growth sectors, such as Solana (SOL) and BNB. These assets often demonstrate higher elasticity during the mid-bull market, but it is essential to strictly adhere to the limit of 'no single asset exceeding 10% of the total position.' Nuclear positions (10%) serve as flexible funds that can participate in short-term trading opportunities and act as a reserve for bottom fishing during sudden market crashes. This allocation method resulted in a Sharpe ratio of 2.3 during the backtest from July to September 2025, significantly higher than the 1.5 of an all-in Bitcoin strategy.
The Art of Position Management: How to Control Risk Through Asset Allocation in Bitcoin Breakout Markets
At the critical moment when Bitcoin approaches the $100,000 mark, scientific position management is the dividing line between professional investors and amateur players. Data from January 2026 shows that when Bitcoin broke through $96,000, the market volatility surged by 35% in a single day. However, investors using a layered position strategy controlled their maximum drawdown to within 12%, while those who went all-in faced an average drawdown of 28%. True position management is not simply about allocating funds, but achieving a dynamic balance between risk and return through systematic allocation.
Three-tier Position Structure: Defense, Guerrilla, and Nuclear
Core positions (60%) should be allocated to highly liquid assets such as Bitcoin and Ethereum. These assets have relatively controllable volatility and possess sustained momentum when breaking through key levels. For instance, after Bitcoin stabilized at $95,000, its 30-day volatility dropped from 80% to 45%, making it the stabilizer of the portfolio. Guerrilla positions (30%) are used to layout high-growth sectors, such as Solana (SOL) and BNB. These assets often demonstrate higher elasticity during the mid-bull market, but it is essential to strictly adhere to the limit of 'no single asset exceeding 10% of the total position.' Nuclear positions (10%) serve as flexible funds that can participate in short-term trading opportunities and act as a reserve for bottom fishing during sudden market crashes. This allocation method resulted in a Sharpe ratio of 2.3 during the backtest from July to September 2025, significantly higher than the 1.5 of an all-in Bitcoin strategy.
Three-tier Position Structure: Defense, Guerrilla, and Nuclear
Core positions (60%) should be allocated to highly liquid assets such as Bitcoin and Ethereum. These assets have relatively controllable volatility and possess sustained momentum when breaking through key levels. For instance, after Bitcoin stabilized at $95,000, its 30-day volatility dropped from 80% to 45%, making it the stabilizer of the portfolio. Guerrilla positions (30%) are used to layout high-growth sectors, such as Solana (SOL) and BNB. These assets often demonstrate higher elasticity during the mid-bull market, but it is essential to strictly adhere to the limit of 'no single asset exceeding 10% of the total position.' Nuclear positions (10%) serve as flexible funds that can participate in short-term trading opportunities and act as a reserve for bottom fishing during sudden market crashes. This allocation method resulted in a Sharpe ratio of 2.3 during the backtest from July to September 2025, significantly higher than the 1.5 of an all-in Bitcoin strategy.
211
·
--

Article
Trading Strategy Layout: How to Grasp Bitcoin Breakthrough Trends?In the face of potential breakthroughs in Bitcoin, investors need to develop a systematic trading strategy that balances trend tracking and risk management. Based on current market conditions, an effective strategy should encompass core elements such as position management, entry timing selection, and risk control.
Position management is the cornerstone of long-term survival. It is recommended to adopt a 'core + satellite' allocation: allocate 60% of funds to core assets like Bitcoin and Ethereum, 30% to potential tracks (such as SOL, BNB), and retain 10% in stablecoins as flexible funds. The position of a single cryptocurrency should not exceed 20% of total assets, and a single track should not exceed 30% to diversify risk. This allocation has shown a maximum drawdown 40% lower than a full Bitcoin position in backtesting, while returns can reach 80% of Bitcoin's.
Trading Strategy Layout: How to Grasp Bitcoin Breakthrough Trends?
In the face of potential breakthroughs in Bitcoin, investors need to develop a systematic trading strategy that balances trend tracking and risk management. Based on current market conditions, an effective strategy should encompass core elements such as position management, entry timing selection, and risk control.
Position management is the cornerstone of long-term survival. It is recommended to adopt a 'core + satellite' allocation: allocate 60% of funds to core assets like Bitcoin and Ethereum, 30% to potential tracks (such as SOL, BNB), and retain 10% in stablecoins as flexible funds. The position of a single cryptocurrency should not exceed 20% of total assets, and a single track should not exceed 30% to diversify risk. This allocation has shown a maximum drawdown 40% lower than a full Bitcoin position in backtesting, while returns can reach 80% of Bitcoin's.
Position management is the cornerstone of long-term survival. It is recommended to adopt a 'core + satellite' allocation: allocate 60% of funds to core assets like Bitcoin and Ethereum, 30% to potential tracks (such as SOL, BNB), and retain 10% in stablecoins as flexible funds. The position of a single cryptocurrency should not exceed 20% of total assets, and a single track should not exceed 30% to diversify risk. This allocation has shown a maximum drawdown 40% lower than a full Bitcoin position in backtesting, while returns can reach 80% of Bitcoin's.
157
·
--

Article
The Macro East Wind Has Arrived: How Bitcoin Benefits from Policy Shifts?The shift in macroeconomic policy is becoming a key driving force in the Bitcoin market, with effects that may go beyond short-term technical fluctuations. In early 2026, U.S. inflation data unexpectedly fell, with core CPI remaining at 2.7% and core indicators below expectations, reinforcing market expectations for a Federal Reserve rate cut. This easing of monetary policy has historically favored risk assets like Bitcoin.
Historical data provides strong references. In the six months before and after the Fed's rate cut cycle begins, Bitcoin's average increase reached 150%. More critically, the decline in real interest rates reduces the opportunity cost of holding zero-yield assets like gold and silver, while Bitcoin's 'digital gold' attribute similarly benefits. Currently, silver prices have surpassed $90 per ounce for the first time, and gold is nearing historical highs, indicating the market's demand for hedging against a loose environment and monetary instability. Bitcoin is likely to become the next destination for this type of capital.
The Macro East Wind Has Arrived: How Bitcoin Benefits from Policy Shifts?
The shift in macroeconomic policy is becoming a key driving force in the Bitcoin market, with effects that may go beyond short-term technical fluctuations. In early 2026, U.S. inflation data unexpectedly fell, with core CPI remaining at 2.7% and core indicators below expectations, reinforcing market expectations for a Federal Reserve rate cut. This easing of monetary policy has historically favored risk assets like Bitcoin.
Historical data provides strong references. In the six months before and after the Fed's rate cut cycle begins, Bitcoin's average increase reached 150%. More critically, the decline in real interest rates reduces the opportunity cost of holding zero-yield assets like gold and silver, while Bitcoin's 'digital gold' attribute similarly benefits. Currently, silver prices have surpassed $90 per ounce for the first time, and gold is nearing historical highs, indicating the market's demand for hedging against a loose environment and monetary instability. Bitcoin is likely to become the next destination for this type of capital.
Historical data provides strong references. In the six months before and after the Fed's rate cut cycle begins, Bitcoin's average increase reached 150%. More critically, the decline in real interest rates reduces the opportunity cost of holding zero-yield assets like gold and silver, while Bitcoin's 'digital gold' attribute similarly benefits. Currently, silver prices have surpassed $90 per ounce for the first time, and gold is nearing historical highs, indicating the market's demand for hedging against a loose environment and monetary instability. Bitcoin is likely to become the next destination for this type of capital.
1
30
·
--

Article
On-chain Data Decoding: Why Do Long-term Holders Refuse to Sell?On-chain data clearly shows that long-term holders (LTH) of Bitcoin are exhibiting unprecedented conviction, and their behavioral patterns provide strong support for the market. As of January 2026, the chips controlled by long-term holders account for as much as 71.2%, while exchange balances have fallen to the lowest level since 2018, only accounting for 12.7% of the circulating supply. This optimization of supply and demand structure is the strongest foundation for price increases.
The reluctance to sell among long-term holders has deep-rooted reasons. Data shows that the daily realized profits have sharply decreased from over $1 billion at the peak of the fourth quarter of 2025 to about $184 million, indicating a significant reduction in profit-taking behavior among long-term holders. More importantly, their realized profit ratio (i.e., the selling profit ratio) is only 12%, far below the over 35% at the peak of previous high cycles. This means that the majority of early investors are still in profit and do not face urgent selling pressure.
On-chain Data Decoding: Why Do Long-term Holders Refuse to Sell?
On-chain data clearly shows that long-term holders (LTH) of Bitcoin are exhibiting unprecedented conviction, and their behavioral patterns provide strong support for the market. As of January 2026, the chips controlled by long-term holders account for as much as 71.2%, while exchange balances have fallen to the lowest level since 2018, only accounting for 12.7% of the circulating supply. This optimization of supply and demand structure is the strongest foundation for price increases.
The reluctance to sell among long-term holders has deep-rooted reasons. Data shows that the daily realized profits have sharply decreased from over $1 billion at the peak of the fourth quarter of 2025 to about $184 million, indicating a significant reduction in profit-taking behavior among long-term holders. More importantly, their realized profit ratio (i.e., the selling profit ratio) is only 12%, far below the over 35% at the peak of previous high cycles. This means that the majority of early investors are still in profit and do not face urgent selling pressure.
The reluctance to sell among long-term holders has deep-rooted reasons. Data shows that the daily realized profits have sharply decreased from over $1 billion at the peak of the fourth quarter of 2025 to about $184 million, indicating a significant reduction in profit-taking behavior among long-term holders. More importantly, their realized profit ratio (i.e., the selling profit ratio) is only 12%, far below the over 35% at the peak of previous high cycles. This means that the majority of early investors are still in profit and do not face urgent selling pressure.
164
·
--

Article
Institutional Funds in the Underflow: Bitcoin May Welcome a New Wave of CapitalThe flow of institutional funds in the Bitcoin market is undergoing subtle changes. Although surface data still shows discrepancies, the deeper structure indicates that long-term capital may be quietly positioning itself. In the first week of 2026, there was a net outflow of US spot Bitcoin ETFs, but at the same time, publicly traded companies like MicroStrategy continue to accumulate Bitcoin reserves, highlighting the sustained interest of corporate treasuries. This seemingly contradictory phenomenon actually reflects the differences in strategies among various market participants: short-term funds may be fleeing due to macro uncertainties, while long-term capital views the adjustments as opportunities for allocation.
Institutional Funds in the Underflow: Bitcoin May Welcome a New Wave of Capital
The flow of institutional funds in the Bitcoin market is undergoing subtle changes. Although surface data still shows discrepancies, the deeper structure indicates that long-term capital may be quietly positioning itself. In the first week of 2026, there was a net outflow of US spot Bitcoin ETFs, but at the same time, publicly traded companies like MicroStrategy continue to accumulate Bitcoin reserves, highlighting the sustained interest of corporate treasuries. This seemingly contradictory phenomenon actually reflects the differences in strategies among various market participants: short-term funds may be fleeing due to macro uncertainties, while long-term capital views the adjustments as opportunities for allocation.
150
·
--

Article
Technical Breakthrough Imminent: Key Bitcoin Indicators Reveal Bull Market SignalsThe Bitcoin market is showing a resonance between technical and funding aspects, with several key indicators indicating that a breakthrough trend has matured. On January 14, 2026, Bitcoin saw a daily increase of over 5%, breaking through the $96,000 mark, with significantly increased trading volume, forming a classic 'volume breakout' pattern. The uniqueness of this rise lies in the fact that it occurred after a two-week high-level consolidation, during which the price fluctuated repeatedly in the range of $87,000 to $94,000, and the closing price after the breakout has stabilized above $96,000, marking the market's completion of directional choice.
From a technical indicator perspective, Bitcoin is currently trading above the 200-day moving average (red), and this moving average continues to incline upwards, forming a key long-term support. Although the price is still below the 100-day and 50-day moving averages, both are trending flat and concentrated in the $92,000 to $94,000 range, forming dynamic resistance. If the price can continue to break through this area, it will open up upward space. More notably, the Bollinger Bands' width has begun to expand after narrowing, showing a return of volatility, while the price is running close to the upper band, indicating strong bullish momentum.
Technical Breakthrough Imminent: Key Bitcoin Indicators Reveal Bull Market Signals
The Bitcoin market is showing a resonance between technical and funding aspects, with several key indicators indicating that a breakthrough trend has matured. On January 14, 2026, Bitcoin saw a daily increase of over 5%, breaking through the $96,000 mark, with significantly increased trading volume, forming a classic 'volume breakout' pattern. The uniqueness of this rise lies in the fact that it occurred after a two-week high-level consolidation, during which the price fluctuated repeatedly in the range of $87,000 to $94,000, and the closing price after the breakout has stabilized above $96,000, marking the market's completion of directional choice.
From a technical indicator perspective, Bitcoin is currently trading above the 200-day moving average (red), and this moving average continues to incline upwards, forming a key long-term support. Although the price is still below the 100-day and 50-day moving averages, both are trending flat and concentrated in the $92,000 to $94,000 range, forming dynamic resistance. If the price can continue to break through this area, it will open up upward space. More notably, the Bollinger Bands' width has begun to expand after narrowing, showing a return of volatility, while the price is running close to the upper band, indicating strong bullish momentum.
From a technical indicator perspective, Bitcoin is currently trading above the 200-day moving average (red), and this moving average continues to incline upwards, forming a key long-term support. Although the price is still below the 100-day and 50-day moving averages, both are trending flat and concentrated in the $92,000 to $94,000 range, forming dynamic resistance. If the price can continue to break through this area, it will open up upward space. More notably, the Bollinger Bands' width has begun to expand after narrowing, showing a return of volatility, while the price is running close to the upper band, indicating strong bullish momentum.
31
·
--
$RIVER
{future}(RIVERUSDT)
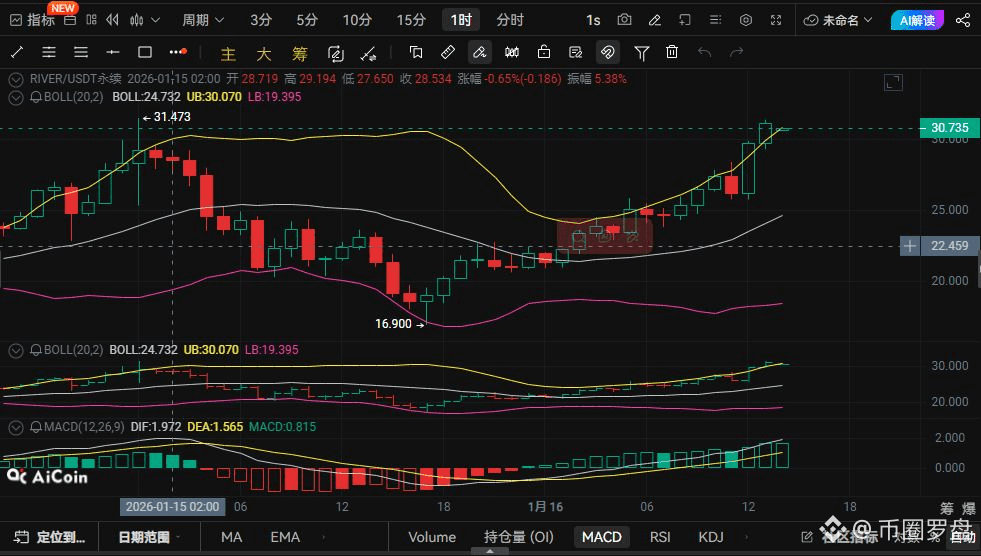
Don't blink! The 1-hour chart of RIVER has sounded the "charge call," the final wash before the main uptrend. Those who understand it should load up immediately!
Listen carefully—my view is crystal clear: RIVER is at the critical point of launching its main uptrend. Any hesitation around 28.5 is a golden window for positioning.
For holders: Hold tight! Let profits run. Set your stop-loss just below key support (e.g., below the Bollinger Band middle line at 24.7), and ignore minor fluctuations along the way.
For watchers: Aggressive traders can gradually build positions near the current price; conservative traders can wait for a significant volume surge confirming a breakout above the 30.0 psychological level before chasing in. Take small risks to capture substantial trend-driven gains.
The market always rewards those who see ahead. By the time everyone recognizes the trend, the meat is already gone. I’ve already seen a clear path for this move. If you want to keep up with the rhythm and never miss out again, follow me now. My analysis is never ambiguous, and my strategy aims for precision with every move. Every key operational signal ahead will be shared here first. Click follow—this is where our wealth journey begins!
$RIVER
Don't blink! The 1-hour chart of RIVER has sounded the "charge call," the final wash before the main uptrend. Those who understand it should load up immediately!
Listen carefully—my view is crystal clear: RIVER is at the critical point of launching its main uptrend. Any hesitation around 28.5 is a golden window for positioning.
For holders: Hold tight! Let profits run. Set your stop-loss just below key support (e.g., below the Bollinger Band middle line at 24.7), and ignore minor fluctuations along the way.
For watchers: Aggressive traders can gradually build positions near the current price; conservative traders can wait for a significant volume surge confirming a breakout above the 30.0 psychological level before chasing in. Take small risks to capture substantial trend-driven gains.
The market always rewards those who see ahead. By the time everyone recognizes the trend, the meat is already gone. I’ve already seen a clear path for this move. If you want to keep up with the rhythm and never miss out again, follow me now. My analysis is never ambiguous, and my strategy aims for precision with every move. Every key operational signal ahead will be shared here first. Click follow—this is where our wealth journey begins!
Don't blink! The 1-hour chart of RIVER has sounded the "charge call," the final wash before the main uptrend. Those who understand it should load up immediately!
Listen carefully—my view is crystal clear: RIVER is at the critical point of launching its main uptrend. Any hesitation around 28.5 is a golden window for positioning.
For holders: Hold tight! Let profits run. Set your stop-loss just below key support (e.g., below the Bollinger Band middle line at 24.7), and ignore minor fluctuations along the way.
For watchers: Aggressive traders can gradually build positions near the current price; conservative traders can wait for a significant volume surge confirming a breakout above the 30.0 psychological level before chasing in. Take small risks to capture substantial trend-driven gains.
The market always rewards those who see ahead. By the time everyone recognizes the trend, the meat is already gone. I’ve already seen a clear path for this move. If you want to keep up with the rhythm and never miss out again, follow me now. My analysis is never ambiguous, and my strategy aims for precision with every move. Every key operational signal ahead will be shared here first. Click follow—this is where our wealth journey begins!
1
436
·
--

Article
Technical Structure Integrated with On-Chain Signals: Bitcoin Investment Strategy in PracticeFor active investors, relying solely on price analysis or on-chain data is insufficient to formulate a comprehensive strategy; both must be combined to create a closed-loop system. The current Bitcoin market is at a critical juncture: price has broken through $97,000, approaching a round number threshold, on-chain accumulation continues, but rising leverage in the derivatives market may amplify short-term volatility. In this environment, a strategy framework integrating multi-dimensional signals becomes particularly important.
The trend assessment matrix serves as the foundation for decision-making. It is recommended that investors evaluate four categories of indicators on a monthly basis:
On-chain fundamentals: exchange net flow (must be negative), non-liquid supply ratio (must be >65%), long-term holder position changes (monthly change < ±1%);
Technical Structure Integrated with On-Chain Signals: Bitcoin Investment Strategy in Practice
For active investors, relying solely on price analysis or on-chain data is insufficient to formulate a comprehensive strategy; both must be combined to create a closed-loop system. The current Bitcoin market is at a critical juncture: price has broken through $97,000, approaching a round number threshold, on-chain accumulation continues, but rising leverage in the derivatives market may amplify short-term volatility. In this environment, a strategy framework integrating multi-dimensional signals becomes particularly important.
The trend assessment matrix serves as the foundation for decision-making. It is recommended that investors evaluate four categories of indicators on a monthly basis:
On-chain fundamentals: exchange net flow (must be negative), non-liquid supply ratio (must be >65%), long-term holder position changes (monthly change < ±1%);
The trend assessment matrix serves as the foundation for decision-making. It is recommended that investors evaluate four categories of indicators on a monthly basis:
On-chain fundamentals: exchange net flow (must be negative), non-liquid supply ratio (must be >65%), long-term holder position changes (monthly change < ±1%);
167
·
--

Article
Cyclical Positioning: Judging the Stage of the Bitcoin Market from On-Chain BehaviorEach market cycle has its unique on-chain behavioral characteristics, and multiple indicators in the current Bitcoin market suggest that we may be in the mid-phase of a bull market rather than its end. By analyzing the changes in holdings of long-term holders, exchange flow, the number of new addresses, and other data, a complete cyclical positioning framework can be constructed to help investors identify the current market's position in history.
The MVRV ratio provides an important reference for cyclical positioning. This indicator reflects the overall profitability of investors by comparing market capitalization with realized market capitalization (i.e., on-chain cost basis). The current Bitcoin MVRV ratio is about 2.1, which is in a neutral range, far below the cycle peak in 2017 (above 4.5) and the peak in 2021 (above 3.2), but higher than the cycle bottom (below 1.0). Historical data shows that when the MVRV breaks above 2.5 and stabilizes, it often corresponds to an acceleration phase in a bull market; whereas below 1.5, it is mostly an accumulation phase. The current level indicates that the market has exited the bottom range but has not yet entered a frenzy stage.
Cyclical Positioning: Judging the Stage of the Bitcoin Market from On-Chain Behavior
Each market cycle has its unique on-chain behavioral characteristics, and multiple indicators in the current Bitcoin market suggest that we may be in the mid-phase of a bull market rather than its end. By analyzing the changes in holdings of long-term holders, exchange flow, the number of new addresses, and other data, a complete cyclical positioning framework can be constructed to help investors identify the current market's position in history.
The MVRV ratio provides an important reference for cyclical positioning. This indicator reflects the overall profitability of investors by comparing market capitalization with realized market capitalization (i.e., on-chain cost basis). The current Bitcoin MVRV ratio is about 2.1, which is in a neutral range, far below the cycle peak in 2017 (above 4.5) and the peak in 2021 (above 3.2), but higher than the cycle bottom (below 1.0). Historical data shows that when the MVRV breaks above 2.5 and stabilizes, it often corresponds to an acceleration phase in a bull market; whereas below 1.5, it is mostly an accumulation phase. The current level indicates that the market has exited the bottom range but has not yet entered a frenzy stage.
The MVRV ratio provides an important reference for cyclical positioning. This indicator reflects the overall profitability of investors by comparing market capitalization with realized market capitalization (i.e., on-chain cost basis). The current Bitcoin MVRV ratio is about 2.1, which is in a neutral range, far below the cycle peak in 2017 (above 4.5) and the peak in 2021 (above 3.2), but higher than the cycle bottom (below 1.0). Historical data shows that when the MVRV breaks above 2.5 and stabilizes, it often corresponds to an acceleration phase in a bull market; whereas below 1.5, it is mostly an accumulation phase. The current level indicates that the market has exited the bottom range but has not yet entered a frenzy stage.
159
·
--

Article
Supply-Demand Rift: Decoding Bitcoin's Scarcity Value Through the Stock ModelThe deepest transformation in the Bitcoin market stems from its supply structure shifting from 'elastic issuance' to 'rigid scarcity'. Currently, non-liquid supply accounts for 68%, while exchange balances represent only 12.7% of circulating supply. This contradiction between shrinking supply and growing institutional demand is driving a revaluation of Bitcoin's worth. From the stock-to-flow model to on-chain cost distribution, multiple indicators show that Bitcoin's scarcity value has entered a new phase.
The paradigm shift in the Stock-to-Flow (S2F) model is key to understanding scarcity. Traditional S2F models focus solely on new supply (approximately 3.6% annually), but actual circulating supply is declining much faster than theoretical projections. According to Glassnode data, net capital inflows on-chain reached $718.7 billion over the past year, while non-liquid supply increased by 14.3 million BTC during the same period. This means new capital inflows must compete for an ever-decreasing pool of liquid coins, creating a 'capital chasing limited inventory' dynamic. This mechanism resembles the 'residual demand model' in commodity markets: when tradable inventory drops to a critical threshold, even minor changes in demand can trigger significant price volatility.
Supply-Demand Rift: Decoding Bitcoin's Scarcity Value Through the Stock Model
The deepest transformation in the Bitcoin market stems from its supply structure shifting from 'elastic issuance' to 'rigid scarcity'. Currently, non-liquid supply accounts for 68%, while exchange balances represent only 12.7% of circulating supply. This contradiction between shrinking supply and growing institutional demand is driving a revaluation of Bitcoin's worth. From the stock-to-flow model to on-chain cost distribution, multiple indicators show that Bitcoin's scarcity value has entered a new phase.
The paradigm shift in the Stock-to-Flow (S2F) model is key to understanding scarcity. Traditional S2F models focus solely on new supply (approximately 3.6% annually), but actual circulating supply is declining much faster than theoretical projections. According to Glassnode data, net capital inflows on-chain reached $718.7 billion over the past year, while non-liquid supply increased by 14.3 million BTC during the same period. This means new capital inflows must compete for an ever-decreasing pool of liquid coins, creating a 'capital chasing limited inventory' dynamic. This mechanism resembles the 'residual demand model' in commodity markets: when tradable inventory drops to a critical threshold, even minor changes in demand can trigger significant price volatility.
The paradigm shift in the Stock-to-Flow (S2F) model is key to understanding scarcity. Traditional S2F models focus solely on new supply (approximately 3.6% annually), but actual circulating supply is declining much faster than theoretical projections. According to Glassnode data, net capital inflows on-chain reached $718.7 billion over the past year, while non-liquid supply increased by 14.3 million BTC during the same period. This means new capital inflows must compete for an ever-decreasing pool of liquid coins, creating a 'capital chasing limited inventory' dynamic. This mechanism resembles the 'residual demand model' in commodity markets: when tradable inventory drops to a critical threshold, even minor changes in demand can trigger significant price volatility.
168
·
--

Article
ETF Revolution: How Traditional Capital Is Reshaping the Bitcoin Market EcosystemThe approval of spot Bitcoin ETFs is not only a financial product innovation but also a fundamental restructuring of market dynamics. As of January 2026, the assets under management of U.S. Bitcoin ETFs surpassed $150 billion, with a single-day net inflow peak reaching $1.2 billion. This capital inflow pattern has shifted Bitcoin's supply and demand logic from 'retail sentiment-driven' to 'institutional allocation-driven,' triggering profound changes in on-chain behaviors.
Exchange liquidity depletion is the most direct impact of ETFs. Coinbase experienced a net outflow of 70,000 BTC within 30 days, reducing its reserves to 928,000 BTC—the lowest level since December 2018. Meanwhile, non-liquid supply (wallet balances with almost no transaction history) reached 14.3 million BTC, accounting for 68% of Bitcoin's total supply. This supply contraction effect resembles 'inventory lock-up': as new demand continuously flows in through ETFs, the available supply of Bitcoin for sale rapidly diminishes, making price surges highly likely. For example, in September 2025, Bitcoin surged 5.7% in a single day, directly due to short-term supply-demand imbalance caused by insufficient exchange inventories.
ETF Revolution: How Traditional Capital Is Reshaping the Bitcoin Market Ecosystem
The approval of spot Bitcoin ETFs is not only a financial product innovation but also a fundamental restructuring of market dynamics. As of January 2026, the assets under management of U.S. Bitcoin ETFs surpassed $150 billion, with a single-day net inflow peak reaching $1.2 billion. This capital inflow pattern has shifted Bitcoin's supply and demand logic from 'retail sentiment-driven' to 'institutional allocation-driven,' triggering profound changes in on-chain behaviors.
Exchange liquidity depletion is the most direct impact of ETFs. Coinbase experienced a net outflow of 70,000 BTC within 30 days, reducing its reserves to 928,000 BTC—the lowest level since December 2018. Meanwhile, non-liquid supply (wallet balances with almost no transaction history) reached 14.3 million BTC, accounting for 68% of Bitcoin's total supply. This supply contraction effect resembles 'inventory lock-up': as new demand continuously flows in through ETFs, the available supply of Bitcoin for sale rapidly diminishes, making price surges highly likely. For example, in September 2025, Bitcoin surged 5.7% in a single day, directly due to short-term supply-demand imbalance caused by insufficient exchange inventories.
Exchange liquidity depletion is the most direct impact of ETFs. Coinbase experienced a net outflow of 70,000 BTC within 30 days, reducing its reserves to 928,000 BTC—the lowest level since December 2018. Meanwhile, non-liquid supply (wallet balances with almost no transaction history) reached 14.3 million BTC, accounting for 68% of Bitcoin's total supply. This supply contraction effect resembles 'inventory lock-up': as new demand continuously flows in through ETFs, the available supply of Bitcoin for sale rapidly diminishes, making price surges highly likely. For example, in September 2025, Bitcoin surged 5.7% in a single day, directly due to short-term supply-demand imbalance caused by insufficient exchange inventories.
183
·
--

Article
Silent Accumulation: On-Chain Data Reveals Hidden Signals of Bitcoin's Bull Cycle
In financial markets, genuine trend shifts often occur quietly beneath the surface of the noise. After Bitcoin recently broke through a key resistance level, the market did not experience the expected surge in selling pressure; instead, on-chain indicators showed an unusual calm. This calm reflects the ongoing accumulation by long-term holders (LTH) and institutional funds. Data shows that Bitcoin's exchange balance has dropped to its lowest level since 2018, accounting for only 12.7% of the circulating supply, while long-term holders control 71.2% of the coins. This optimized supply-demand structure lays a solid foundation for upward price movement.
In financial markets, genuine trend shifts often occur quietly beneath the surface of the noise. After Bitcoin recently broke through a key resistance level, the market did not experience the expected surge in selling pressure; instead, on-chain indicators showed an unusual calm. This calm reflects the ongoing accumulation by long-term holders (LTH) and institutional funds. Data shows that Bitcoin's exchange balance has dropped to its lowest level since 2018, accounting for only 12.7% of the circulating supply, while long-term holders control 71.2% of the coins. This optimized supply-demand structure lays a solid foundation for upward price movement.
Silent Accumulation: On-Chain Data Reveals Hidden Signals of Bitcoin's Bull Cycle
In financial markets, genuine trend shifts often occur quietly beneath the surface of the noise. After Bitcoin recently broke through a key resistance level, the market did not experience the expected surge in selling pressure; instead, on-chain indicators showed an unusual calm. This calm reflects the ongoing accumulation by long-term holders (LTH) and institutional funds. Data shows that Bitcoin's exchange balance has dropped to its lowest level since 2018, accounting for only 12.7% of the circulating supply, while long-term holders control 71.2% of the coins. This optimized supply-demand structure lays a solid foundation for upward price movement.
101
·
--

Article
Chainlink ETF Listing: How Whale Purchases and Institutional Funds Ignite the LINK Market?On December 4, 2025, Grayscale's Chainlink Spot ETF (GLNK) debuted on the NYSE, raising $41.5 million on its first day, while during the same period, a whale address purchased 4.73 million LINK (worth $68 million) within 48 hours. This double positive news drove the weekly increase of LINK's price to 8%, breaking through the key resistance level of $14.63. The uniqueness of this ETF lies in its first-time inclusion of the oracle track into the traditional financial landscape, upgrading LINK from 'infrastructure tool' to 'configurable asset,' initiating the process of value reassessment.
Mechanistic buying pressure of the ETF
GLNK adopts a physically-backed model, requiring 100% holding of the underlying LINK tokens. Based on the initial scale, the fund needs to purchase about 280,000 LINK tokens, while daily net inflows will continuously draw away liquidity from exchanges. Referring to the experience of Bitcoin ETFs, when the management scale reaches 5% of the circulating supply, price sensitivity significantly increases. Currently, the circulating supply of LINK is about 560 million tokens, and if the ETF scale reaches $1 billion (accounting for 3.2% of the circulating supply), it may trigger an imbalance between supply and demand. More critically, the ETF lowers the threshold for institutional participation—traditional funds cannot directly hold tokens due to custody and compliance restrictions, but can now allocate through stock accounts, exponentially increasing the number of potential buyers.
Chainlink ETF Listing: How Whale Purchases and Institutional Funds Ignite the LINK Market?
On December 4, 2025, Grayscale's Chainlink Spot ETF (GLNK) debuted on the NYSE, raising $41.5 million on its first day, while during the same period, a whale address purchased 4.73 million LINK (worth $68 million) within 48 hours. This double positive news drove the weekly increase of LINK's price to 8%, breaking through the key resistance level of $14.63. The uniqueness of this ETF lies in its first-time inclusion of the oracle track into the traditional financial landscape, upgrading LINK from 'infrastructure tool' to 'configurable asset,' initiating the process of value reassessment.
Mechanistic buying pressure of the ETF
GLNK adopts a physically-backed model, requiring 100% holding of the underlying LINK tokens. Based on the initial scale, the fund needs to purchase about 280,000 LINK tokens, while daily net inflows will continuously draw away liquidity from exchanges. Referring to the experience of Bitcoin ETFs, when the management scale reaches 5% of the circulating supply, price sensitivity significantly increases. Currently, the circulating supply of LINK is about 560 million tokens, and if the ETF scale reaches $1 billion (accounting for 3.2% of the circulating supply), it may trigger an imbalance between supply and demand. More critically, the ETF lowers the threshold for institutional participation—traditional funds cannot directly hold tokens due to custody and compliance restrictions, but can now allocate through stock accounts, exponentially increasing the number of potential buyers.
Mechanistic buying pressure of the ETF
GLNK adopts a physically-backed model, requiring 100% holding of the underlying LINK tokens. Based on the initial scale, the fund needs to purchase about 280,000 LINK tokens, while daily net inflows will continuously draw away liquidity from exchanges. Referring to the experience of Bitcoin ETFs, when the management scale reaches 5% of the circulating supply, price sensitivity significantly increases. Currently, the circulating supply of LINK is about 560 million tokens, and if the ETF scale reaches $1 billion (accounting for 3.2% of the circulating supply), it may trigger an imbalance between supply and demand. More critically, the ETF lowers the threshold for institutional participation—traditional funds cannot directly hold tokens due to custody and compliance restrictions, but can now allocate through stock accounts, exponentially increasing the number of potential buyers.
14
·
--

Article
Chainlink ETF Listing: How Whale Accumulation and Institutional Capital Are Driving the LINK Rally?On December 4, 2025, Grayscale's Chainlink spot ETF (GLNK) listed on the NYSE, raising $41.5 million on its first day. During the same period, major whale addresses purchased 4.73 million LINK tokens (worth $68 million) within 48 hours. This dual positive catalyst drove LINK's weekly price increase by 8%, breaking through the key resistance level of $14.63. The unique feature of this ETF is that it brings the oracle sector into the traditional financial spotlight for the first time, upgrading LINK from a 'infrastructure tool' to a 'configurable asset' and initiating a valuation re-rating process.
The structural buying pressure of the ETF
GLNK operates on a physical-backed model, requiring 100% holding of the underlying LINK tokens. Based on the first-day scale, the fund needs to purchase approximately 280,000 LINK tokens, and ongoing daily net inflows will continuously drain exchange liquidity. Drawing from Bitcoin ETF experience, price sensitivity significantly increases when the fund's management scale reaches 5% of the circulating supply. Currently, LINK's circulating supply is about 560 million tokens. If the ETF scale reaches $1 billion (representing 3.2% of the circulating supply), it could trigger supply-demand imbalance. More critically, the ETF lowers the entry barrier for institutional investors—traditional funds previously unable to directly hold tokens due to custody and compliance restrictions can now allocate through stock accounts, leading to an exponential increase in potential buyers.
Chainlink ETF Listing: How Whale Accumulation and Institutional Capital Are Driving the LINK Rally?
On December 4, 2025, Grayscale's Chainlink spot ETF (GLNK) listed on the NYSE, raising $41.5 million on its first day. During the same period, major whale addresses purchased 4.73 million LINK tokens (worth $68 million) within 48 hours. This dual positive catalyst drove LINK's weekly price increase by 8%, breaking through the key resistance level of $14.63. The unique feature of this ETF is that it brings the oracle sector into the traditional financial spotlight for the first time, upgrading LINK from a 'infrastructure tool' to a 'configurable asset' and initiating a valuation re-rating process.
The structural buying pressure of the ETF
GLNK operates on a physical-backed model, requiring 100% holding of the underlying LINK tokens. Based on the first-day scale, the fund needs to purchase approximately 280,000 LINK tokens, and ongoing daily net inflows will continuously drain exchange liquidity. Drawing from Bitcoin ETF experience, price sensitivity significantly increases when the fund's management scale reaches 5% of the circulating supply. Currently, LINK's circulating supply is about 560 million tokens. If the ETF scale reaches $1 billion (representing 3.2% of the circulating supply), it could trigger supply-demand imbalance. More critically, the ETF lowers the entry barrier for institutional investors—traditional funds previously unable to directly hold tokens due to custody and compliance restrictions can now allocate through stock accounts, leading to an exponential increase in potential buyers.
The structural buying pressure of the ETF
GLNK operates on a physical-backed model, requiring 100% holding of the underlying LINK tokens. Based on the first-day scale, the fund needs to purchase approximately 280,000 LINK tokens, and ongoing daily net inflows will continuously drain exchange liquidity. Drawing from Bitcoin ETF experience, price sensitivity significantly increases when the fund's management scale reaches 5% of the circulating supply. Currently, LINK's circulating supply is about 560 million tokens. If the ETF scale reaches $1 billion (representing 3.2% of the circulating supply), it could trigger supply-demand imbalance. More critically, the ETF lowers the entry barrier for institutional investors—traditional funds previously unable to directly hold tokens due to custody and compliance restrictions can now allocate through stock accounts, leading to an exponential increase in potential buyers.
448
Log in to explore more content
Join global crypto users on Binance Square
⚡️ Get latest and useful information about crypto.
💬 Trusted by the world’s largest crypto exchange.
👍 Discover real insights from verified creators.
Email / Phone number
Trending Topics
ChinaMayLetAlibabaByteDanceBuyNvidiaChips
419 views
53 Discussing
#ChinaMayLetAlibabaByteDanceBuyNvidiaChips
Discussion
Reports say China may allow companies including Alibaba and ByteDance to purchase Nvidia’s newly released RTX PRO 5500 chips. China’s Ministry of Industry and Information Technology reportedly asked companies about planned quantities and intended uses, although the report has not been independently verified.
This is notable because:
For Nvidia: Approval could create additional China sales and maintain Nvidia’s presence in the Chinese AI ecosystem.
For Alibaba & ByteDance: More Nvidia computing capacity could support AI model development and inference amid strong demand for computing power.
For China’s chip strategy: The RTX PRO 5500 is not Nvidia’s top data-center AI accelerator, while Chinese firms are also developing domestic alternatives such as Alibaba’s own AI chips.
For markets: Confirmation of meaningful purchases could affect sentiment around Nvidia and the broader semiconductor sector, but the scale and timing of any approvals remain uncertain.
The key point is that this is a reported potential approval, not a confirmed purchase agreement. Reuters said it could not independently verify the report.
PALASH5
·0 Likes
·324 views
USChinaRelease$30BTariffCutProductLists
5 views
3 Discussing
SKoreaFSCConsidersVirtualAssetMarketMaker
1,515 views
85 Discussing