
Arthur Mint
3.7k Posts

Arthur Mint
 Square Verified+
Report
Block User
Arthur is here. Crypto Expert. Web3 Builder. Verified KOL on Binance Square. Let's keep growing together: X - @ArthurMint_
71 Following
42.4K+ Followers
13.8K+ Liked
Posts
All
Quotes
PINNED
·
--
Bullish
🎁🎁 Community today sending you big surprise gift. So hurry up claim it thanks.
🎁🎁 Community today sending you big surprise gift. So hurry up claim it thanks.

207
2
10
585
·
--
Claim 🎁
Claim 🎁

520龙行天下
·
--
BTC briefly broke above $82,000, and the market generally rebounded. The SEC approved a five-year exemption for tokenized stocks; the RWA narrative is heating up, with AVAX and NEAR leading the gains. Hong Kong has implemented its first compliant stablecoin issuance/redemption tokenized fund case. A rotation into altcoins begins to emerge, and regulatory moves and institutional participation are the focus.

32


·
--
Bullish
BITCOIN BREAKS THROUGH A WALL OF SHORT LIQUIDATIONS
Bitcoin has accelerated through a major concentration of short positions clustered around $82K–$86K, turning months of accumulated shorts into potential buying fuel.
The key signal is that the rejection from this zone remained shallow, showing that sellers failed to push price away decisively.
As these short positions come under pressure, traders may be forced to buy back $BTC to close their positions, adding further demand and strengthening the rally.
This dynamic could also support broader crypto sentiment if momentum continues. However, liquidations can move quickly, and a reversal remains possible.
Are trapped shorts becoming Bitcoin’s next source of momentum?
BITCOIN BREAKS THROUGH A WALL OF SHORT LIQUIDATIONS
Bitcoin has accelerated through a major concentration of short positions clustered around $82K–$86K, turning months of accumulated shorts into potential buying fuel.
The key signal is that the rejection from this zone remained shallow, showing that sellers failed to push price away decisively.
As these short positions come under pressure, traders may be forced to buy back $BTC to close their positions, adding further demand and strengthening the rally.
This dynamic could also support broader crypto sentiment if momentum continues. However, liquidations can move quickly, and a reversal remains possible.
Are trapped shorts becoming Bitcoin’s next source of momentum?
Bitcoin has accelerated through a major concentration of short positions clustered around $82K–$86K, turning months of accumulated shorts into potential buying fuel.
The key signal is that the rejection from this zone remained shallow, showing that sellers failed to push price away decisively.
As these short positions come under pressure, traders may be forced to buy back $BTC to close their positions, adding further demand and strengthening the rally.
This dynamic could also support broader crypto sentiment if momentum continues. However, liquidations can move quickly, and a reversal remains possible.
Are trapped shorts becoming Bitcoin’s next source of momentum?

86
·
--
Bullish
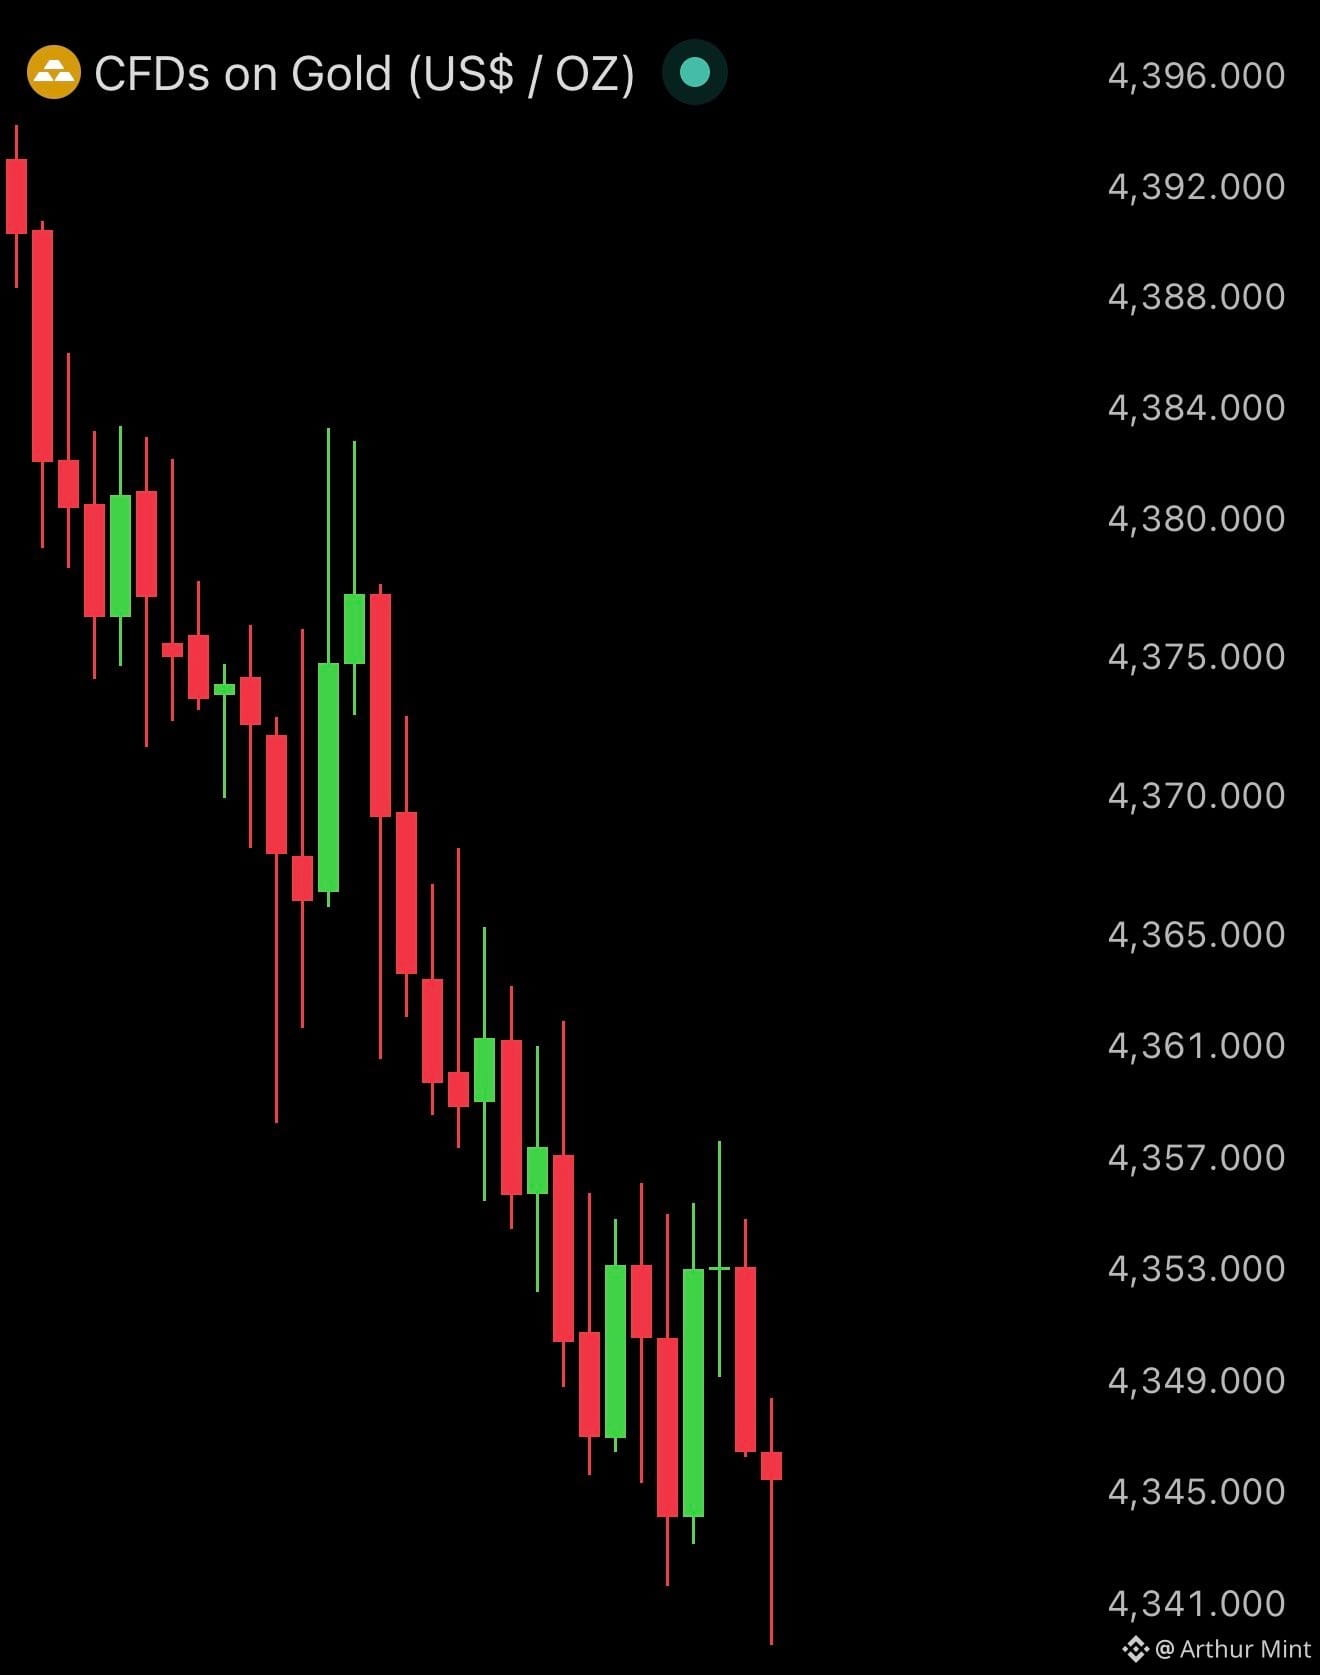
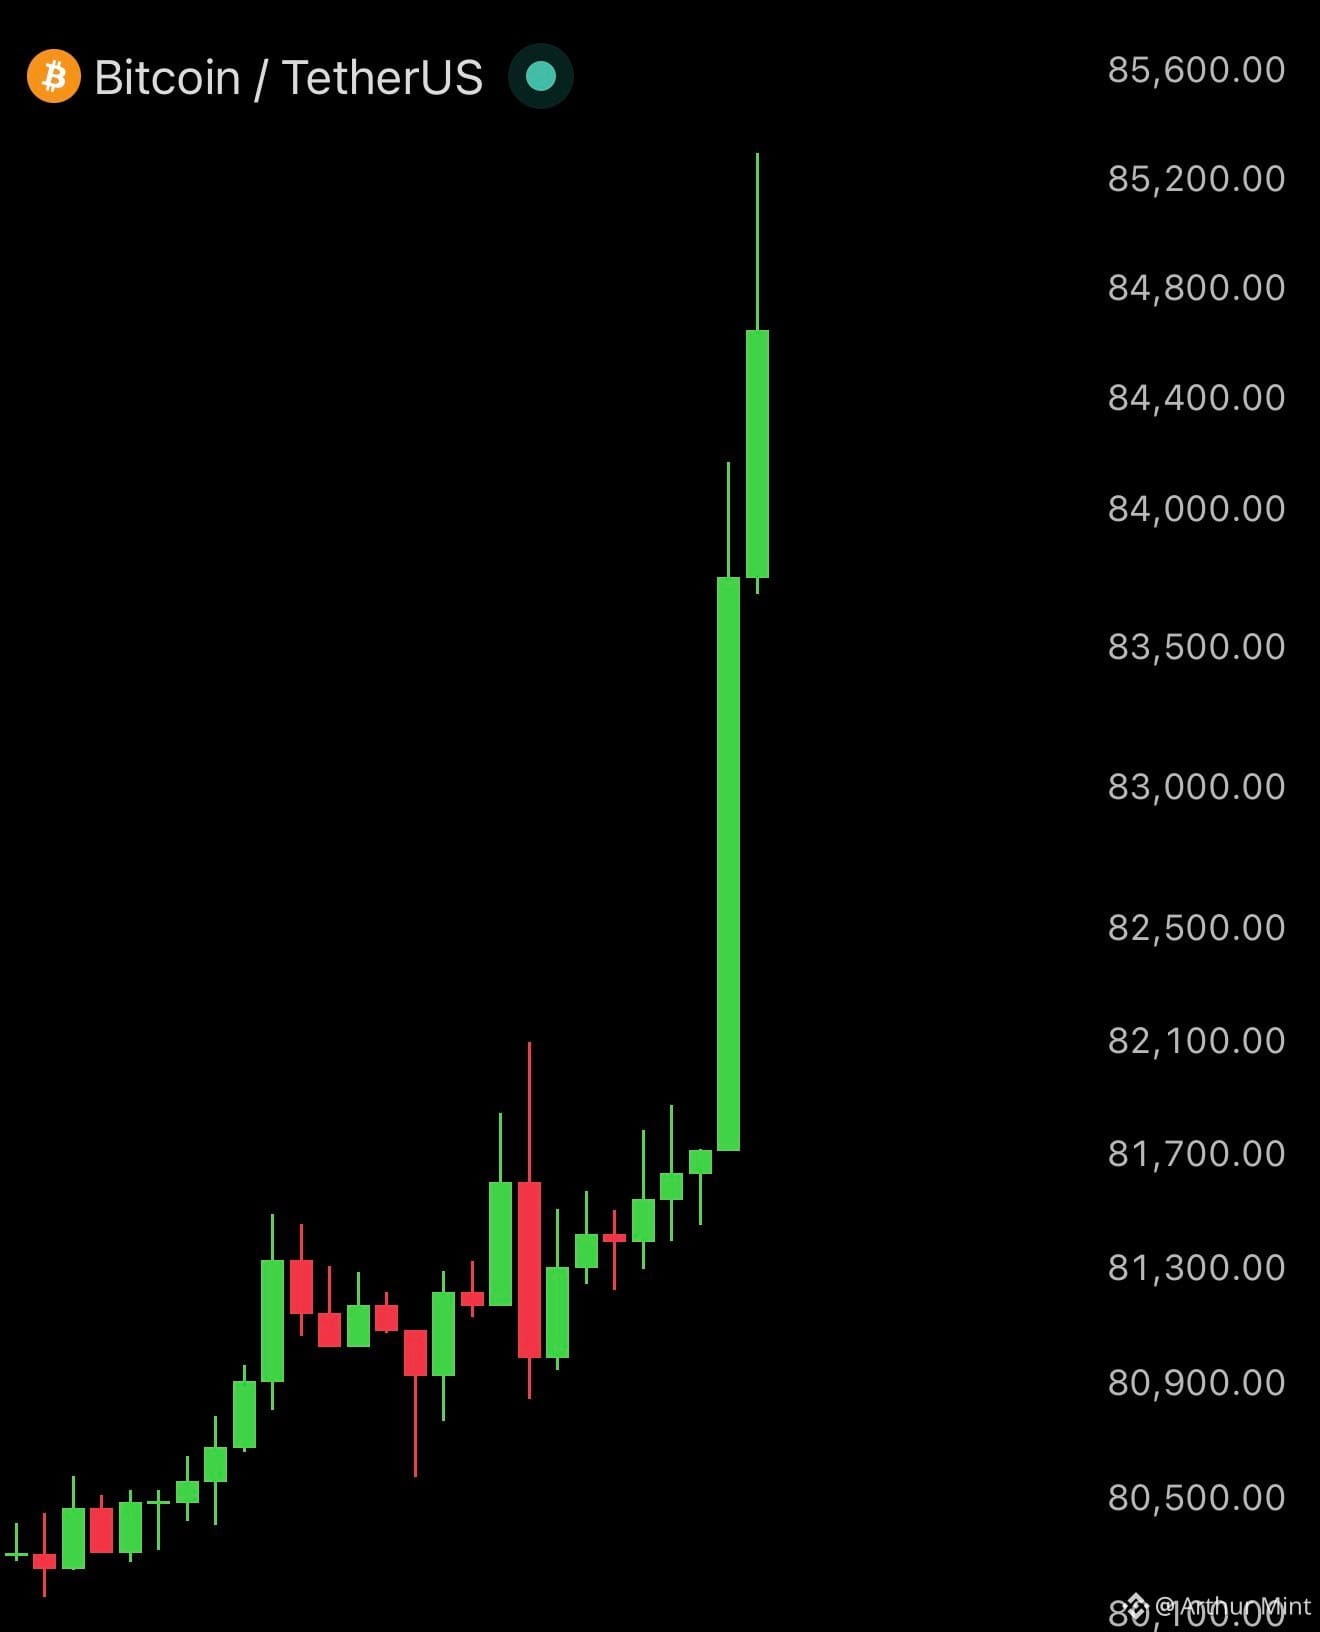
Markets are sending a sharp signal: Gold is sliding while Bitcoin is climbing.
The split is hard to ignore, putting crypto and the traditional safe-haven trade in opposite directions.
Now the big question is whether this divergence lasts.
Markets are sending a sharp signal: Gold is sliding while Bitcoin is climbing.
The split is hard to ignore, putting crypto and the traditional safe-haven trade in opposite directions.
Now the big question is whether this divergence lasts.
The split is hard to ignore, putting crypto and the traditional safe-haven trade in opposite directions.
Now the big question is whether this divergence lasts.
362
·
--
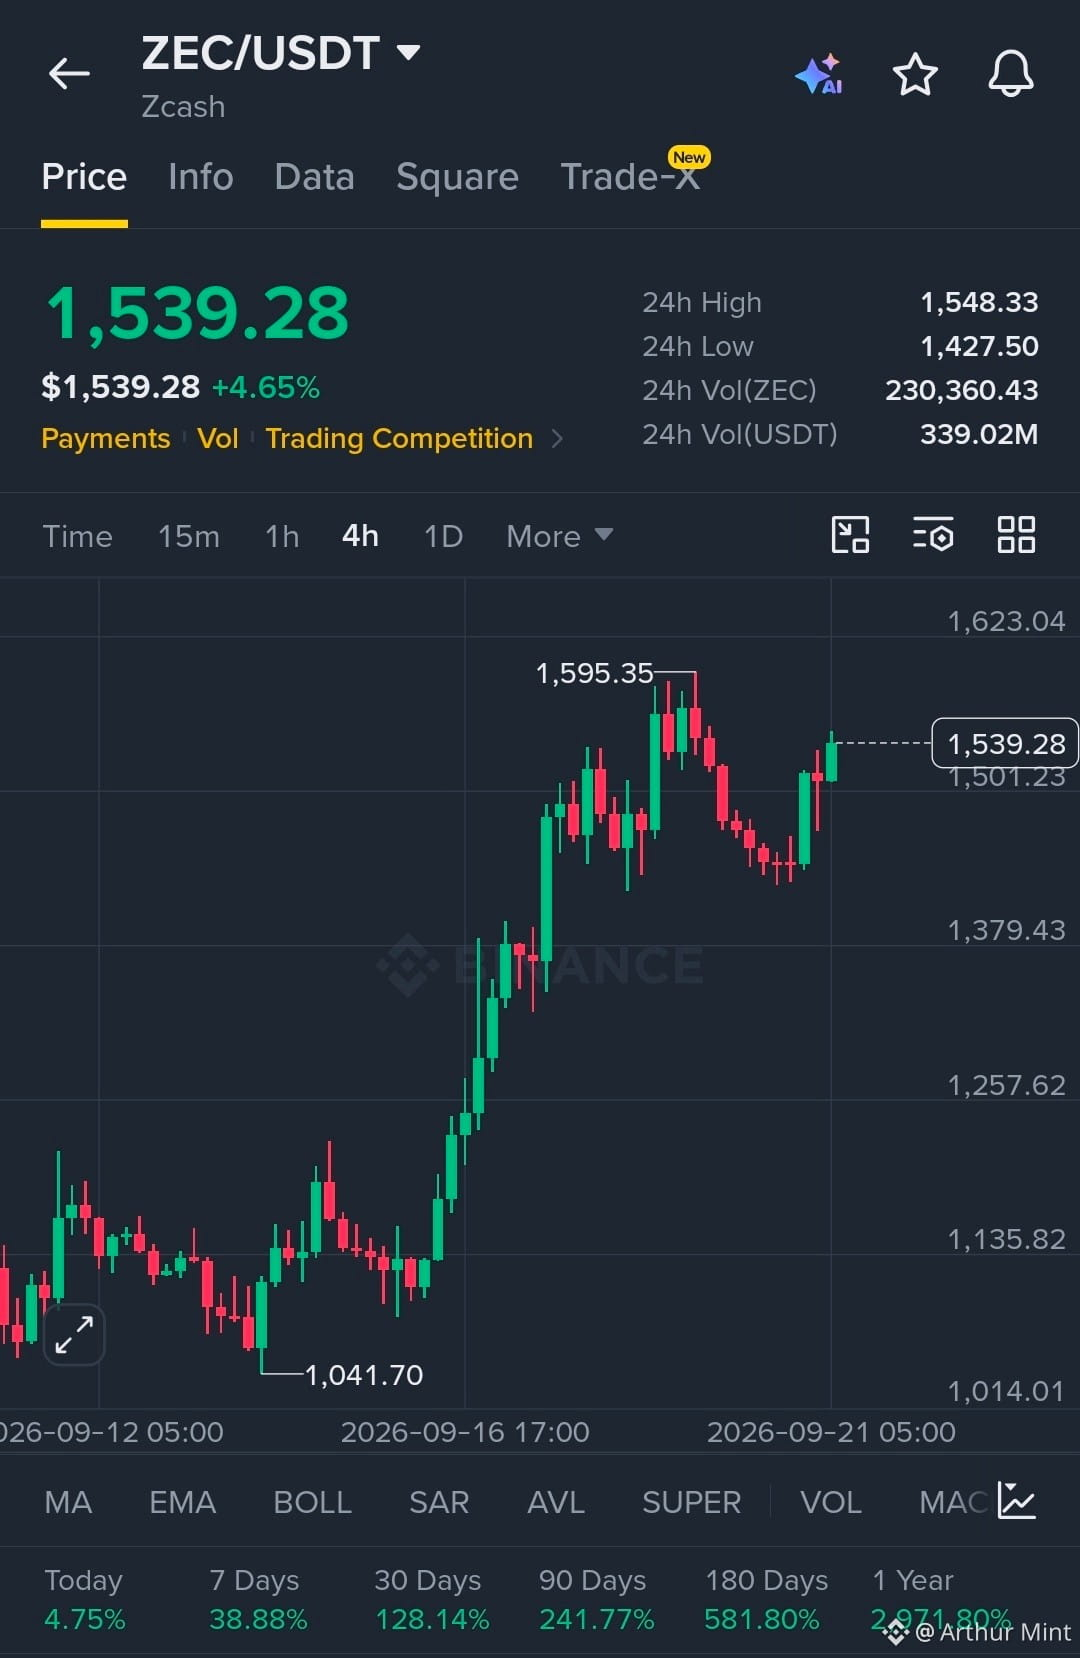
$ZEC is showing strong momentum with buyers firmly in control.
Structure remains bullish with price holding above the breakout zone.
EP
1,510 - 1,540
TP
TP1 1,595
TP2 1,650
TP3 1,720
SL
1,460
Liquidity is building above the 1,595 high, while price continues to hold the 1,501 support area. A clean reaction from this zone keeps the bullish continuation structure intact, with 1,595 as the first liquidity target.
Let’s go $ZEC
$ZEC is showing strong momentum with buyers firmly in control.
Structure remains bullish with price holding above the breakout zone.
EP
1,510 - 1,540
TP
TP1 1,595
TP2 1,650
TP3 1,720
SL
1,460
Liquidity is building above the 1,595 high, while price continues to hold the 1,501 support area. A clean reaction from this zone keeps the bullish continuation structure intact, with 1,595 as the first liquidity target.
Let’s go $ZEC
Structure remains bullish with price holding above the breakout zone.
EP
1,510 - 1,540
TP
TP1 1,595
TP2 1,650
TP3 1,720
SL
1,460
Liquidity is building above the 1,595 high, while price continues to hold the 1,501 support area. A clean reaction from this zone keeps the bullish continuation structure intact, with 1,595 as the first liquidity target.
Let’s go $ZEC
353
·
--
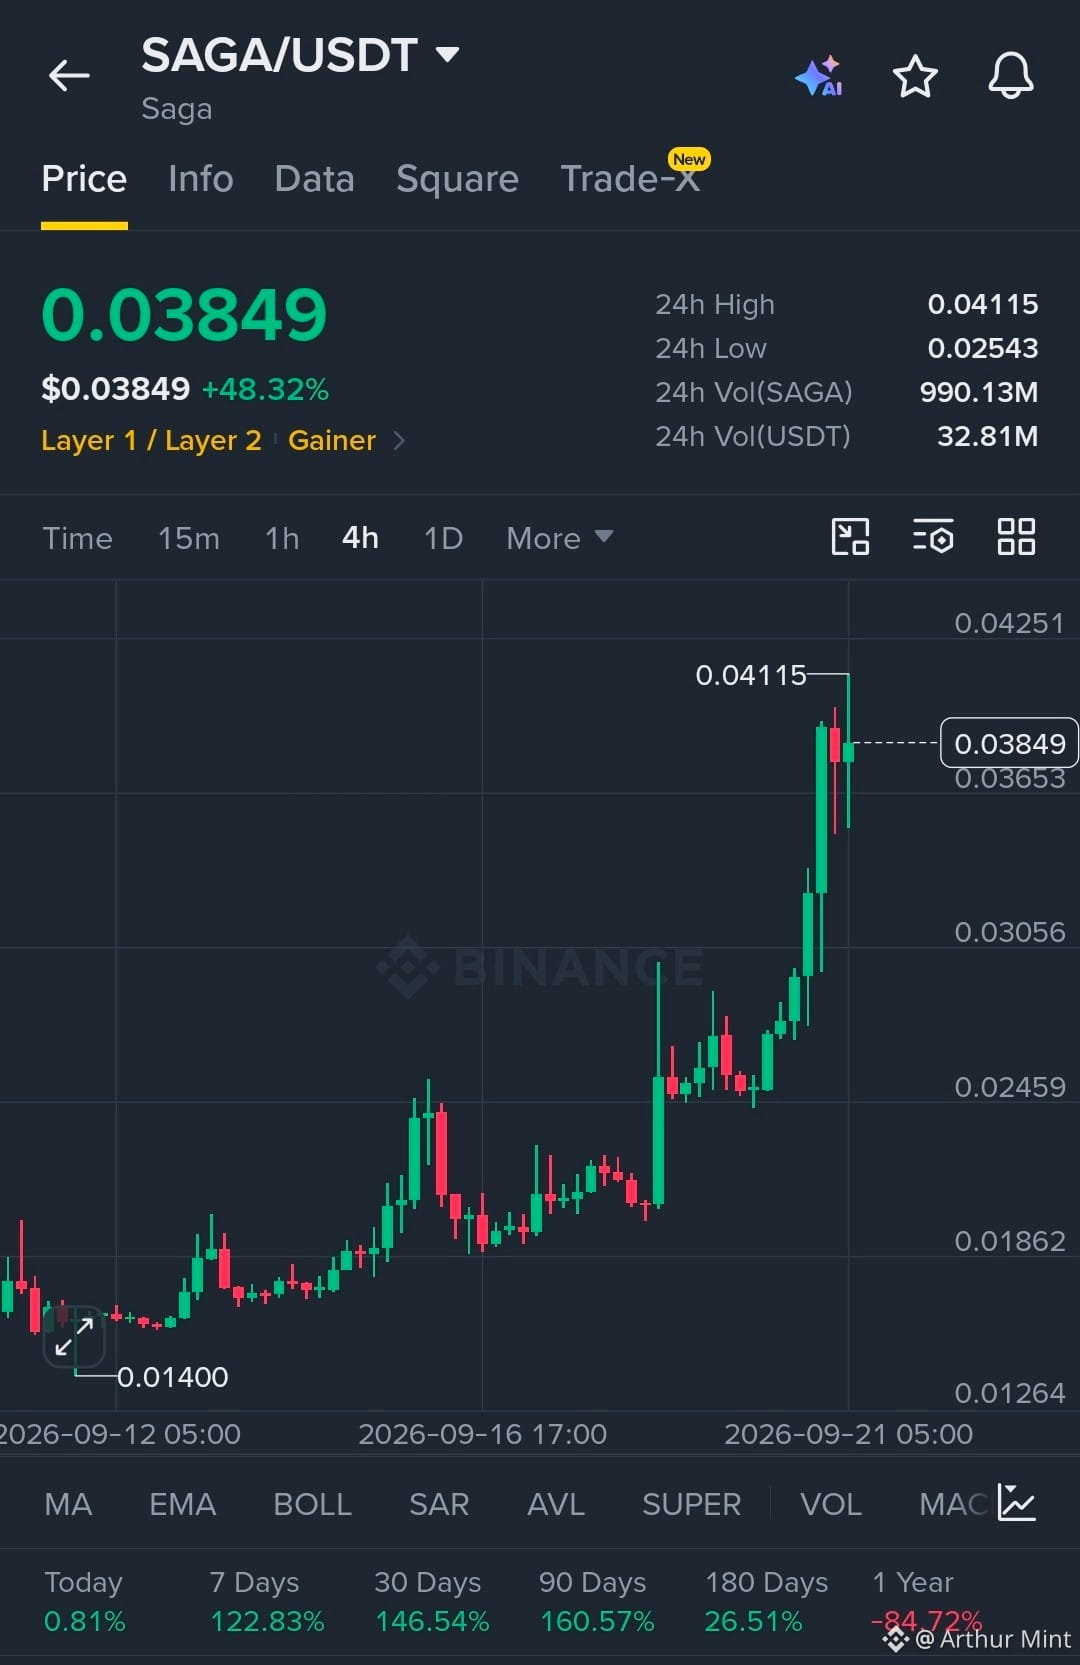
$SAGA is showing strong momentum with buyers firmly in control.
Structure remains bullish with price holding above the breakout zone.
EP
0.0370 - 0.0385
TP
TP1 0.0425
TP2 0.0460
TP3 0.0500
SL
0.0345
Liquidity has been swept above the previous high, while price continues to hold the breakout structure. A clean reaction around the 0.0370 area keeps the bullish continuation setup intact, with 0.0425 as the first liquidity target.
Let’s go $SAGA
$SAGA is showing strong momentum with buyers firmly in control.
Structure remains bullish with price holding above the breakout zone.
EP
0.0370 - 0.0385
TP
TP1 0.0425
TP2 0.0460
TP3 0.0500
SL
0.0345
Liquidity has been swept above the previous high, while price continues to hold the breakout structure. A clean reaction around the 0.0370 area keeps the bullish continuation setup intact, with 0.0425 as the first liquidity target.
Let’s go $SAGA
Structure remains bullish with price holding above the breakout zone.
EP
0.0370 - 0.0385
TP
TP1 0.0425
TP2 0.0460
TP3 0.0500
SL
0.0345
Liquidity has been swept above the previous high, while price continues to hold the breakout structure. A clean reaction around the 0.0370 area keeps the bullish continuation setup intact, with 0.0425 as the first liquidity target.
Let’s go $SAGA
261
·
--
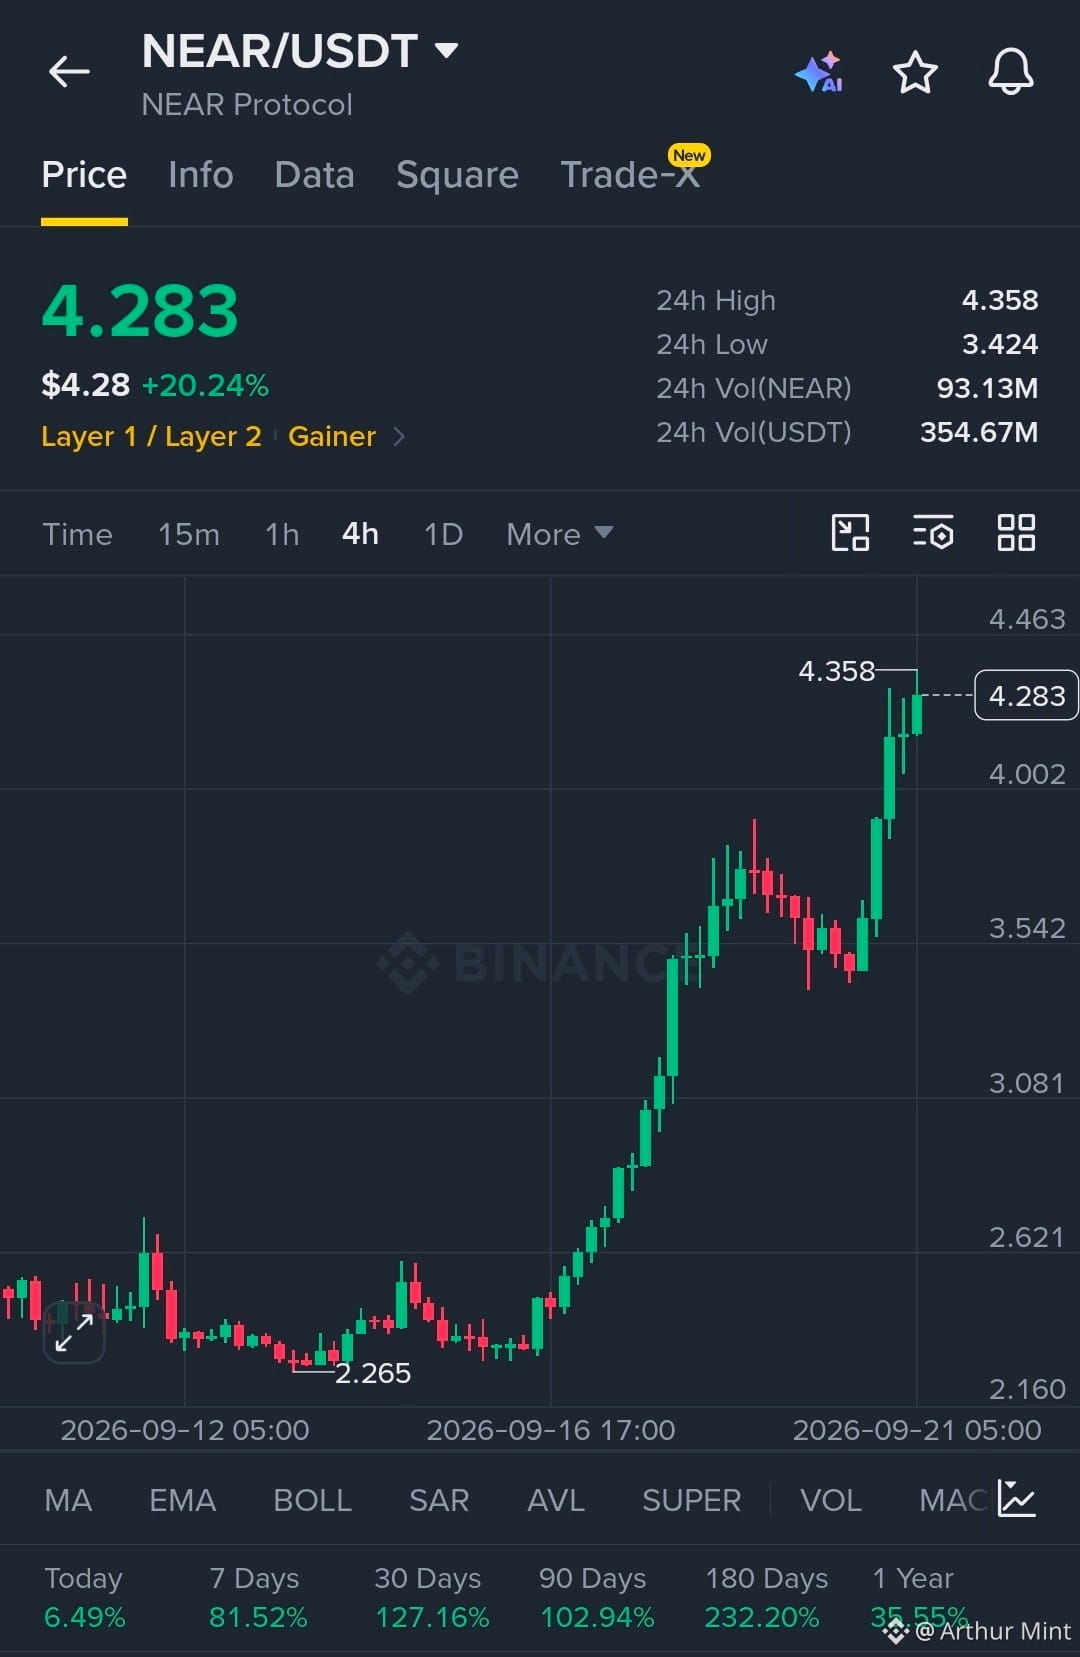
$NEAR is showing strong momentum with buyers firmly in control.
Structure remains bullish with price holding above the breakout zone.
EP
4.20 - 4.28
TP
TP1 4.45
TP2 4.65
TP3 4.90
SL
3.98
Liquidity has been swept above the previous highs, while price continues to hold the breakout structure. A clean reaction around the 4.20 area keeps the bullish continuation setup intact, with 4.45 as the first liquidity target.
Let’s go $NEAR
$NEAR is showing strong momentum with buyers firmly in control.
Structure remains bullish with price holding above the breakout zone.
EP
4.20 - 4.28
TP
TP1 4.45
TP2 4.65
TP3 4.90
SL
3.98
Liquidity has been swept above the previous highs, while price continues to hold the breakout structure. A clean reaction around the 4.20 area keeps the bullish continuation setup intact, with 4.45 as the first liquidity target.
Let’s go $NEAR
Structure remains bullish with price holding above the breakout zone.
EP
4.20 - 4.28
TP
TP1 4.45
TP2 4.65
TP3 4.90
SL
3.98
Liquidity has been swept above the previous highs, while price continues to hold the breakout structure. A clean reaction around the 4.20 area keeps the bullish continuation setup intact, with 4.45 as the first liquidity target.
Let’s go $NEAR
336
·
--
Bullish
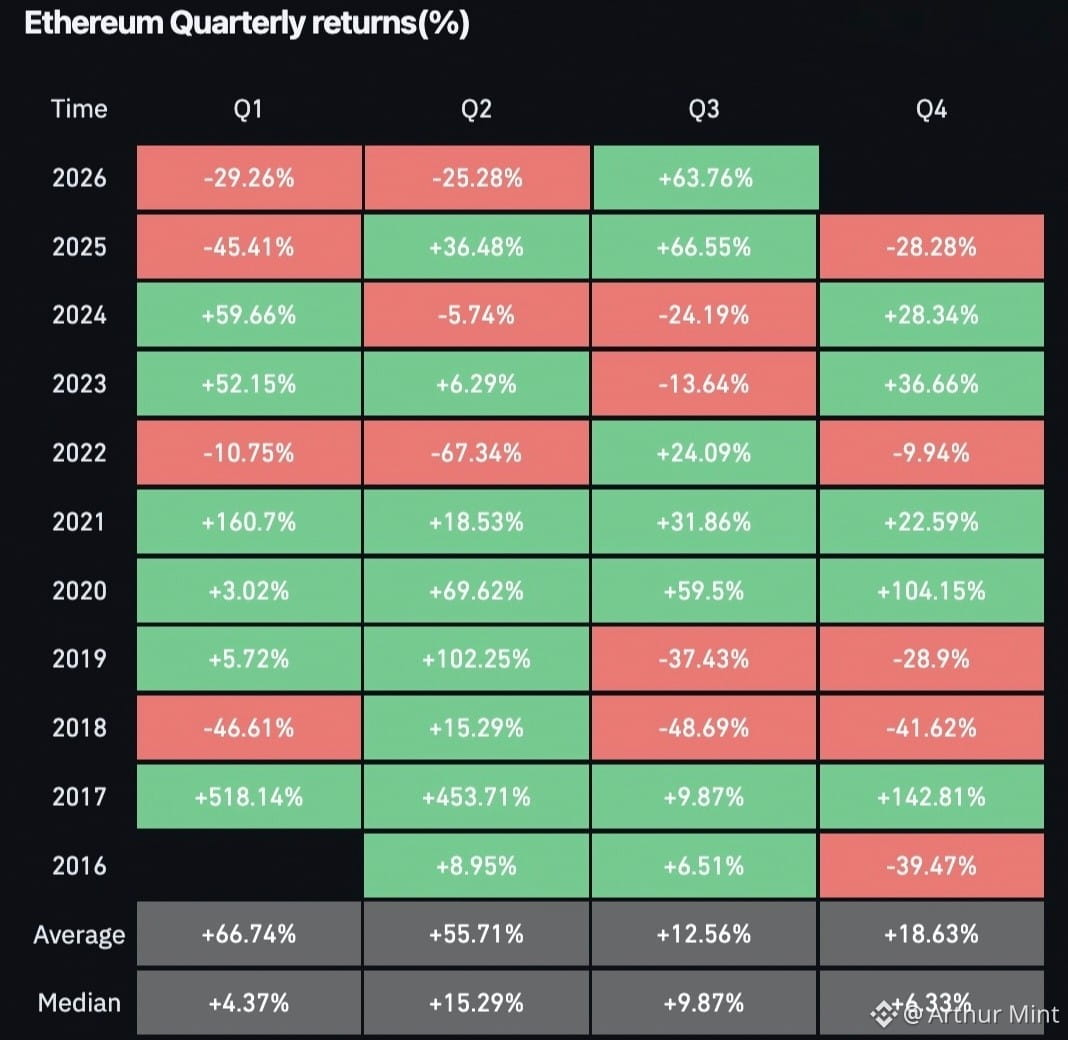
ETH JUST POSTED ITS 2ND-STRONGEST Q3 EVER — AND THE MOMENTUM IS HARD TO IGNORE
Ethereum is currently showing a +63.76% return for Q3 2026, putting this quarter in second place among the Q3 performances shown, just behind Q3 2025 at +66.55%.
That is a significant shift in momentum. After Q1 and Q2 declines of -29.26% and -25.28%, $ETH has delivered a powerful rebound, showing how quickly market sentiment can change within a few months.
For Bitcoin and the wider crypto market, this kind of strength in ETH suggests that upside momentum is still capable of returning aggressively after periods of weakness. It also puts renewed focus on whether that momentum can carry into the next quarter.
But there is one important caution: strong Q3 performance does not guarantee a strong Q4. In 2025, ETH gained 66.55% in Q3, only to fall 28.28% in Q4.
The momentum is impressive — but can Ethereum turn this Q3 strength into another breakout quarter?
ETH JUST POSTED ITS 2ND-STRONGEST Q3 EVER — AND THE MOMENTUM IS HARD TO IGNORE
Ethereum is currently showing a +63.76% return for Q3 2026, putting this quarter in second place among the Q3 performances shown, just behind Q3 2025 at +66.55%.
That is a significant shift in momentum. After Q1 and Q2 declines of -29.26% and -25.28%, $ETH has delivered a powerful rebound, showing how quickly market sentiment can change within a few months.
For Bitcoin and the wider crypto market, this kind of strength in ETH suggests that upside momentum is still capable of returning aggressively after periods of weakness. It also puts renewed focus on whether that momentum can carry into the next quarter.
But there is one important caution: strong Q3 performance does not guarantee a strong Q4. In 2025, ETH gained 66.55% in Q3, only to fall 28.28% in Q4.
The momentum is impressive — but can Ethereum turn this Q3 strength into another breakout quarter?
Ethereum is currently showing a +63.76% return for Q3 2026, putting this quarter in second place among the Q3 performances shown, just behind Q3 2025 at +66.55%.
That is a significant shift in momentum. After Q1 and Q2 declines of -29.26% and -25.28%, $ETH has delivered a powerful rebound, showing how quickly market sentiment can change within a few months.
For Bitcoin and the wider crypto market, this kind of strength in ETH suggests that upside momentum is still capable of returning aggressively after periods of weakness. It also puts renewed focus on whether that momentum can carry into the next quarter.
But there is one important caution: strong Q3 performance does not guarantee a strong Q4. In 2025, ETH gained 66.55% in Q3, only to fall 28.28% in Q4.
The momentum is impressive — but can Ethereum turn this Q3 strength into another breakout quarter?
1
357
·
--
Bullish
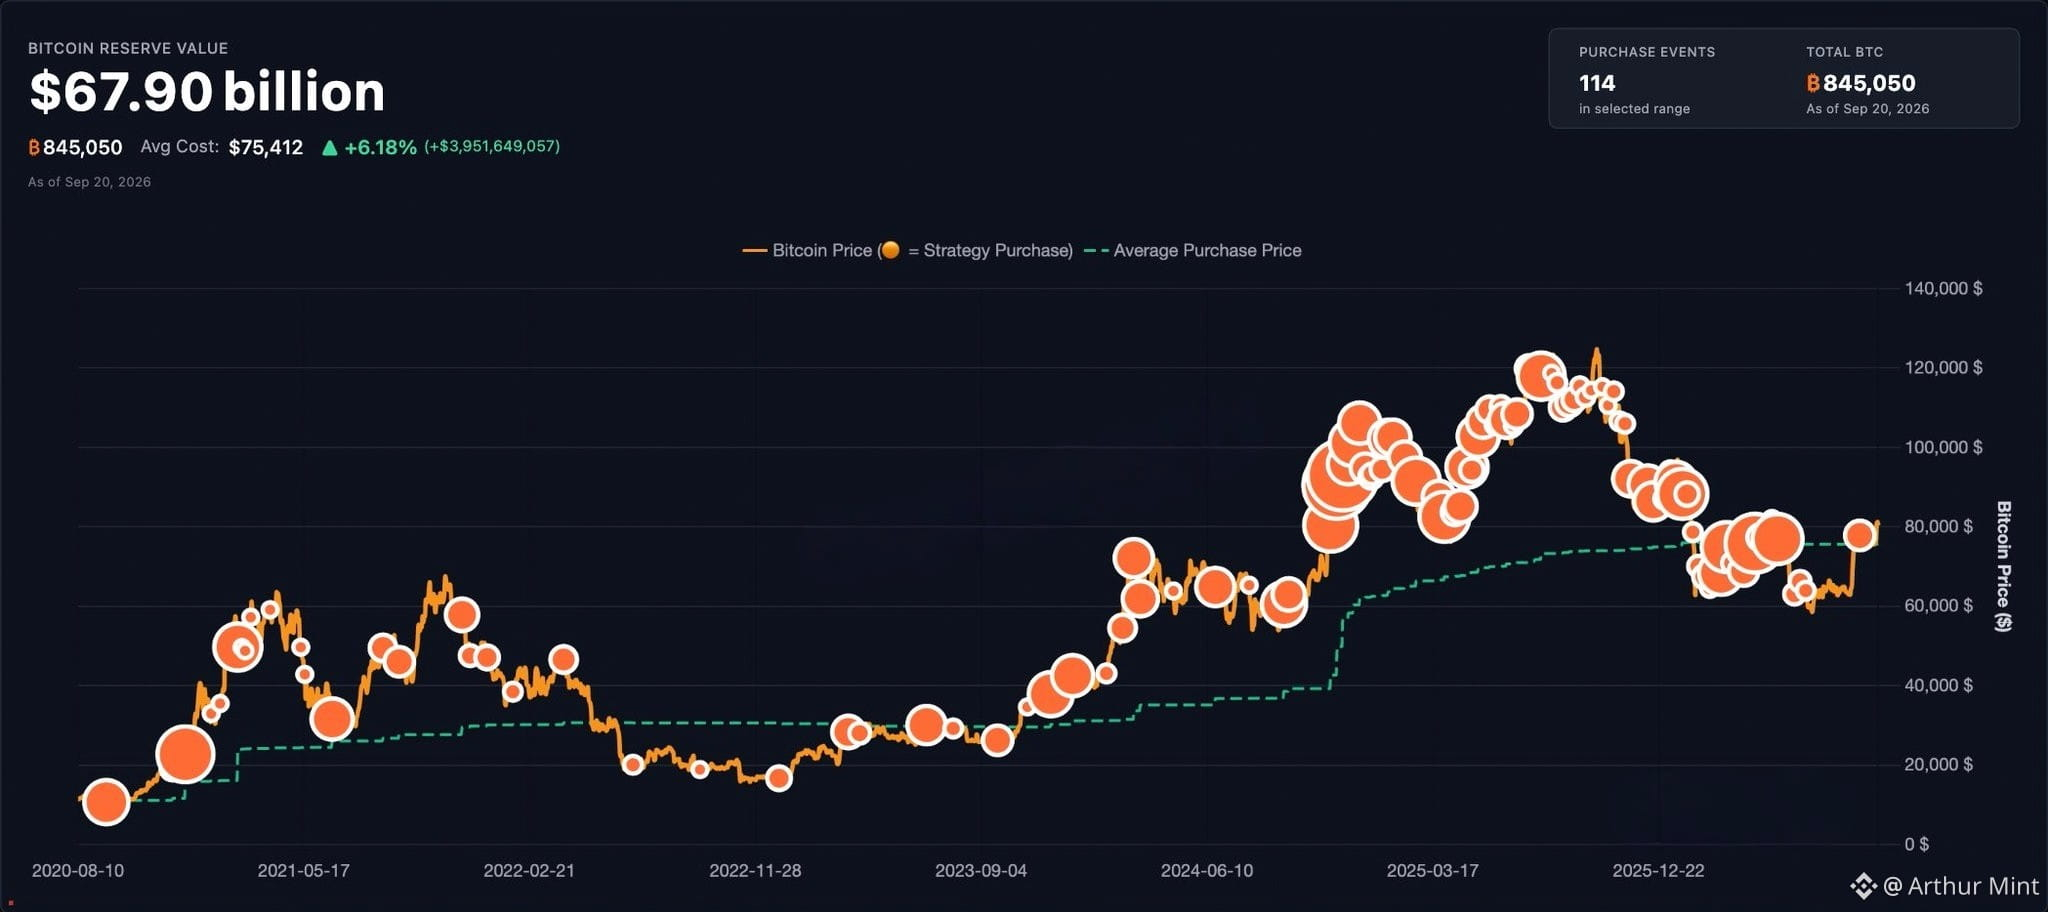
BITCOIN’S ACCUMULATION SIGNAL REMAINS STRONG
Bitcoin’s reserve value stands at $67.90B, with 845,050 BTC across 114 purchases.
The $75,412 average cost and +6.18% gain highlight sustained accumulation, while recent price movement keeps momentum alive—though volatility could still trigger sharp pullbacks. Bulls watching?
BITCOIN’S ACCUMULATION SIGNAL REMAINS STRONG
Bitcoin’s reserve value stands at $67.90B, with 845,050 BTC across 114 purchases.
The $75,412 average cost and +6.18% gain highlight sustained accumulation, while recent price movement keeps momentum alive—though volatility could still trigger sharp pullbacks. Bulls watching?
Bitcoin’s reserve value stands at $67.90B, with 845,050 BTC across 114 purchases.
The $75,412 average cost and +6.18% gain highlight sustained accumulation, while recent price movement keeps momentum alive—though volatility could still trigger sharp pullbacks. Bulls watching?
1
145
·
--
Bullish
Bitcoin at $150,000. Ethereum at $10,000.
The major crypto price targets are being projected for the 2027–2029 period, putting the next few years firmly in focus for traders and investors.
Why it matters: these targets point to expectations of significant upside for both of the market’s biggest assets.
Market takeaway: 2027–2029 could become a defining window for Bitcoin and Ethereum price expectations.
Bitcoin at $150,000. Ethereum at $10,000.
The major crypto price targets are being projected for the 2027–2029 period, putting the next few years firmly in focus for traders and investors.
Why it matters: these targets point to expectations of significant upside for both of the market’s biggest assets.
Market takeaway: 2027–2029 could become a defining window for Bitcoin and Ethereum price expectations.
The major crypto price targets are being projected for the 2027–2029 period, putting the next few years firmly in focus for traders and investors.
Why it matters: these targets point to expectations of significant upside for both of the market’s biggest assets.
Market takeaway: 2027–2029 could become a defining window for Bitcoin and Ethereum price expectations.
1
564
·
--
Bullish
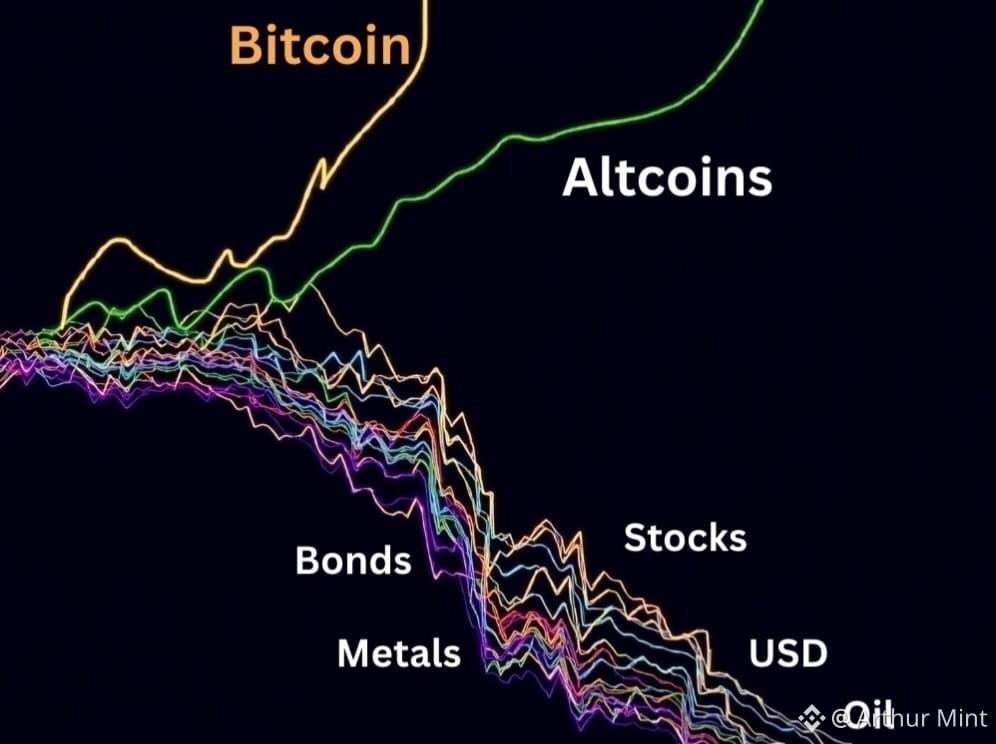
CAPITAL ROTATION COULD BE POINTING TOWARD CRYPTO
The chart highlights a striking rotation: Bitcoin rises sharply while stocks, bonds, metals, USD and oil trend lower.
Altcoins also begin strengthening, suggesting crypto is attracting capital as traditional assets weaken.
For Bitcoin, that matters because sustained relative strength can reinforce broader crypto momentum and potentially support another leg higher across the market.
Still, rotations can reverse quickly, so momentum alone is no guarantee.
Could this be the rotation crypto has been waiting for?
CAPITAL ROTATION COULD BE POINTING TOWARD CRYPTO
The chart highlights a striking rotation: Bitcoin rises sharply while stocks, bonds, metals, USD and oil trend lower.
Altcoins also begin strengthening, suggesting crypto is attracting capital as traditional assets weaken.
For Bitcoin, that matters because sustained relative strength can reinforce broader crypto momentum and potentially support another leg higher across the market.
Still, rotations can reverse quickly, so momentum alone is no guarantee.
Could this be the rotation crypto has been waiting for?
The chart highlights a striking rotation: Bitcoin rises sharply while stocks, bonds, metals, USD and oil trend lower.
Altcoins also begin strengthening, suggesting crypto is attracting capital as traditional assets weaken.
For Bitcoin, that matters because sustained relative strength can reinforce broader crypto momentum and potentially support another leg higher across the market.
Still, rotations can reverse quickly, so momentum alone is no guarantee.
Could this be the rotation crypto has been waiting for?
2
253
·
--
Bullish
BITCOIN IS CHALLENGING ITS MOST NOTORIOUS MONTHLY PATTERN
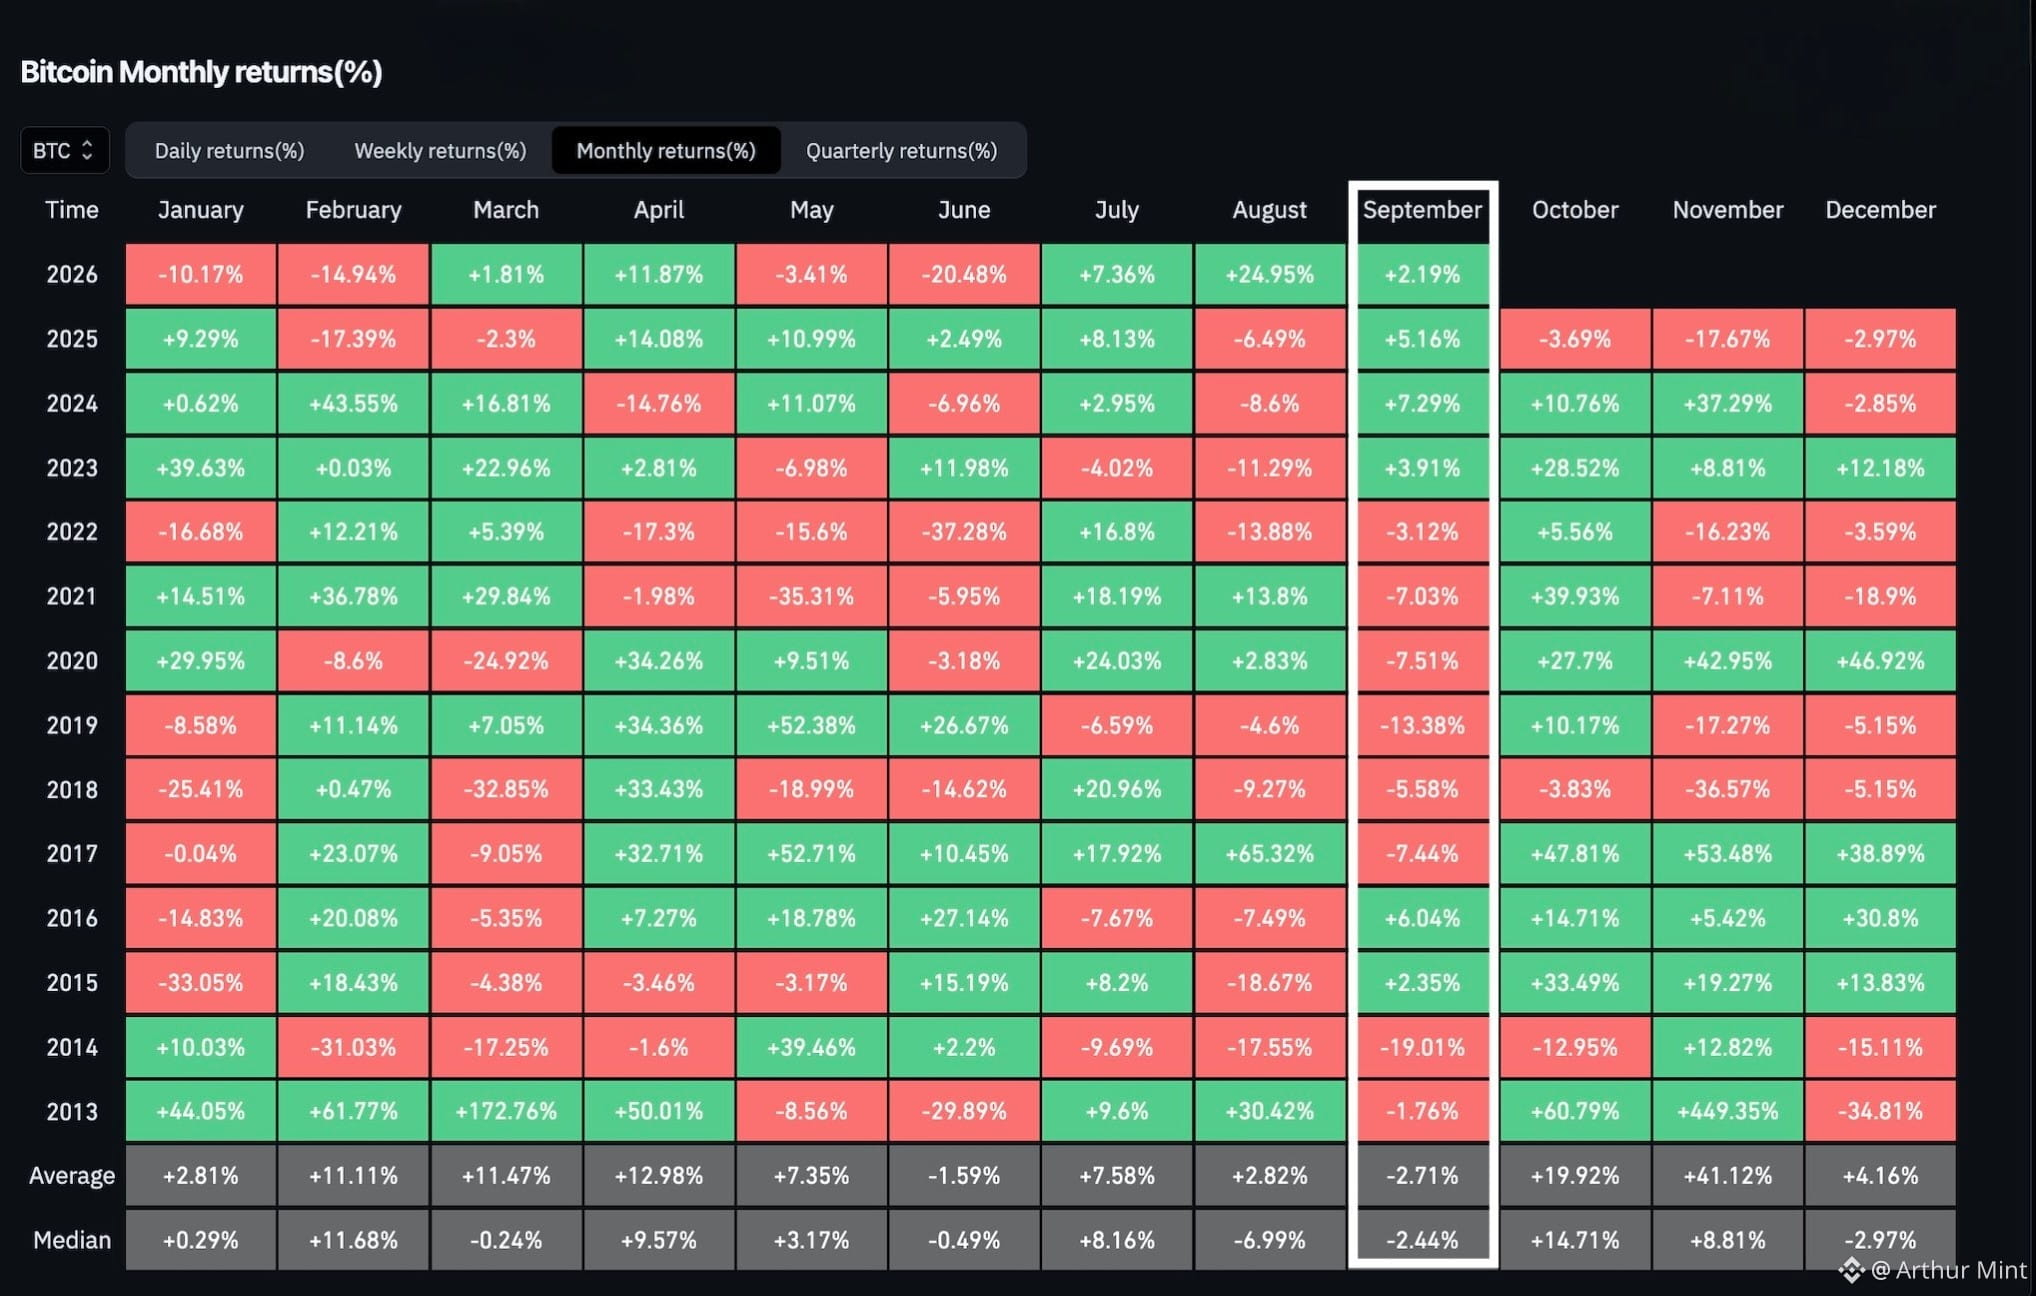
September has historically been one of Bitcoin’s weakest months, with the chart showing a negative average and median performance for the month. Yet this September is currently in positive territory, breaking from the usual seasonal pressure.
More importantly, $BTC has a chance to record three consecutive green monthly performances during a bear market — something that has never happened before, according to the historical pattern highlighted here.
July and August were already positive, while September remains green as the month approaches its close. That puts Bitcoin just days away from a potentially notable historical milestone.
For the broader crypto market, such a move could signal that Bitcoin’s recent strength is pushing beyond the weakness normally associated with this period and challenging expectations around bearish market behavior.
Still, September has not officially closed yet, and historical patterns do not guarantee what comes next.
Will Bitcoin finally rewrite the bear-market playbook?
BITCOIN IS CHALLENGING ITS MOST NOTORIOUS MONTHLY PATTERN
September has historically been one of Bitcoin’s weakest months, with the chart showing a negative average and median performance for the month. Yet this September is currently in positive territory, breaking from the usual seasonal pressure.
More importantly, $BTC has a chance to record three consecutive green monthly performances during a bear market — something that has never happened before, according to the historical pattern highlighted here.
July and August were already positive, while September remains green as the month approaches its close. That puts Bitcoin just days away from a potentially notable historical milestone.
For the broader crypto market, such a move could signal that Bitcoin’s recent strength is pushing beyond the weakness normally associated with this period and challenging expectations around bearish market behavior.
Still, September has not officially closed yet, and historical patterns do not guarantee what comes next.
Will Bitcoin finally rewrite the bear-market playbook?
September has historically been one of Bitcoin’s weakest months, with the chart showing a negative average and median performance for the month. Yet this September is currently in positive territory, breaking from the usual seasonal pressure.
More importantly, $BTC has a chance to record three consecutive green monthly performances during a bear market — something that has never happened before, according to the historical pattern highlighted here.
July and August were already positive, while September remains green as the month approaches its close. That puts Bitcoin just days away from a potentially notable historical milestone.
For the broader crypto market, such a move could signal that Bitcoin’s recent strength is pushing beyond the weakness normally associated with this period and challenging expectations around bearish market behavior.
Still, September has not officially closed yet, and historical patterns do not guarantee what comes next.
Will Bitcoin finally rewrite the bear-market playbook?
1
186
·
--
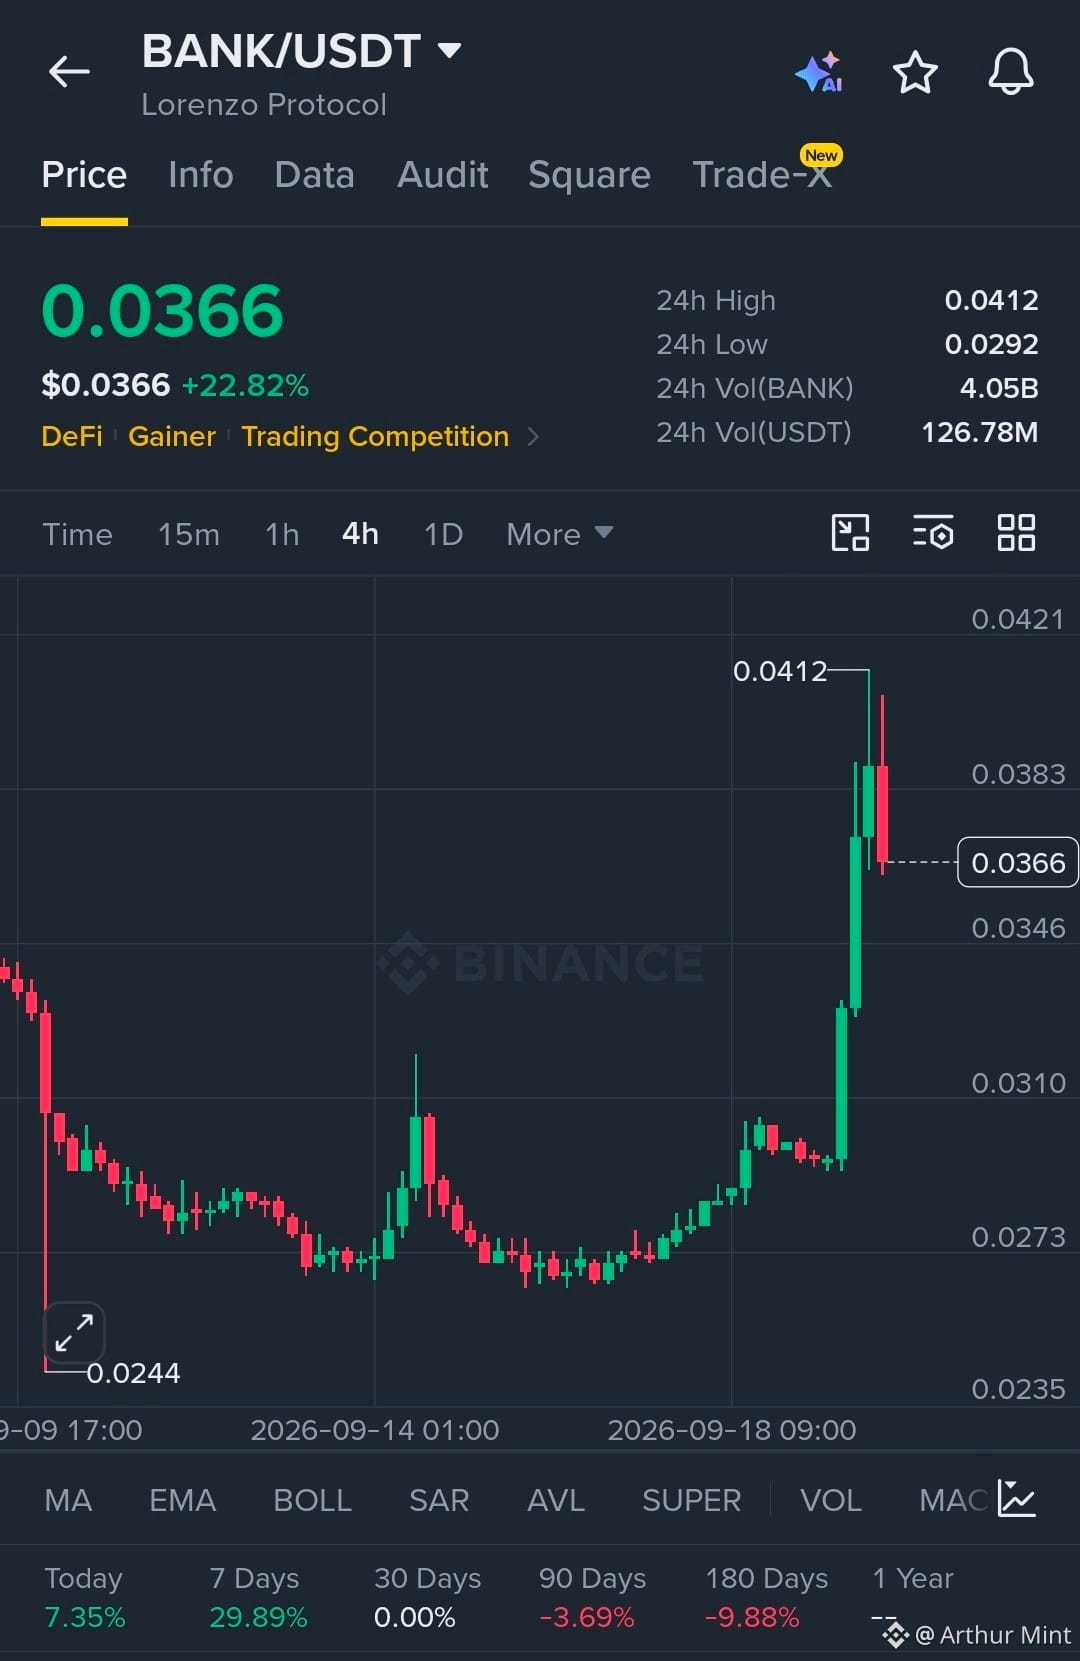
$BANK is showing strong momentum with aggressive upside expansion.
Buyers are in control as structure continues to print higher highs and higher lows.
EP
0.0355–0.0368
TP
TP1 0.0383
TP2 0.0412
TP3 0.0421
SL
0.0340
Liquidity above 0.0383 remains the key reaction zone, while holding 0.0340 keeps the bullish structure intact. A clean break above 0.0412 could open the next liquidity pocket toward 0.0421.
Let’s go $BANK
$BANK is showing strong momentum with aggressive upside expansion.
Buyers are in control as structure continues to print higher highs and higher lows.
EP
0.0355–0.0368
TP
TP1 0.0383
TP2 0.0412
TP3 0.0421
SL
0.0340
Liquidity above 0.0383 remains the key reaction zone, while holding 0.0340 keeps the bullish structure intact. A clean break above 0.0412 could open the next liquidity pocket toward 0.0421.
Let’s go $BANK
Buyers are in control as structure continues to print higher highs and higher lows.
EP
0.0355–0.0368
TP
TP1 0.0383
TP2 0.0412
TP3 0.0421
SL
0.0340
Liquidity above 0.0383 remains the key reaction zone, while holding 0.0340 keeps the bullish structure intact. A clean break above 0.0412 could open the next liquidity pocket toward 0.0421.
Let’s go $BANK
2
427
·
--
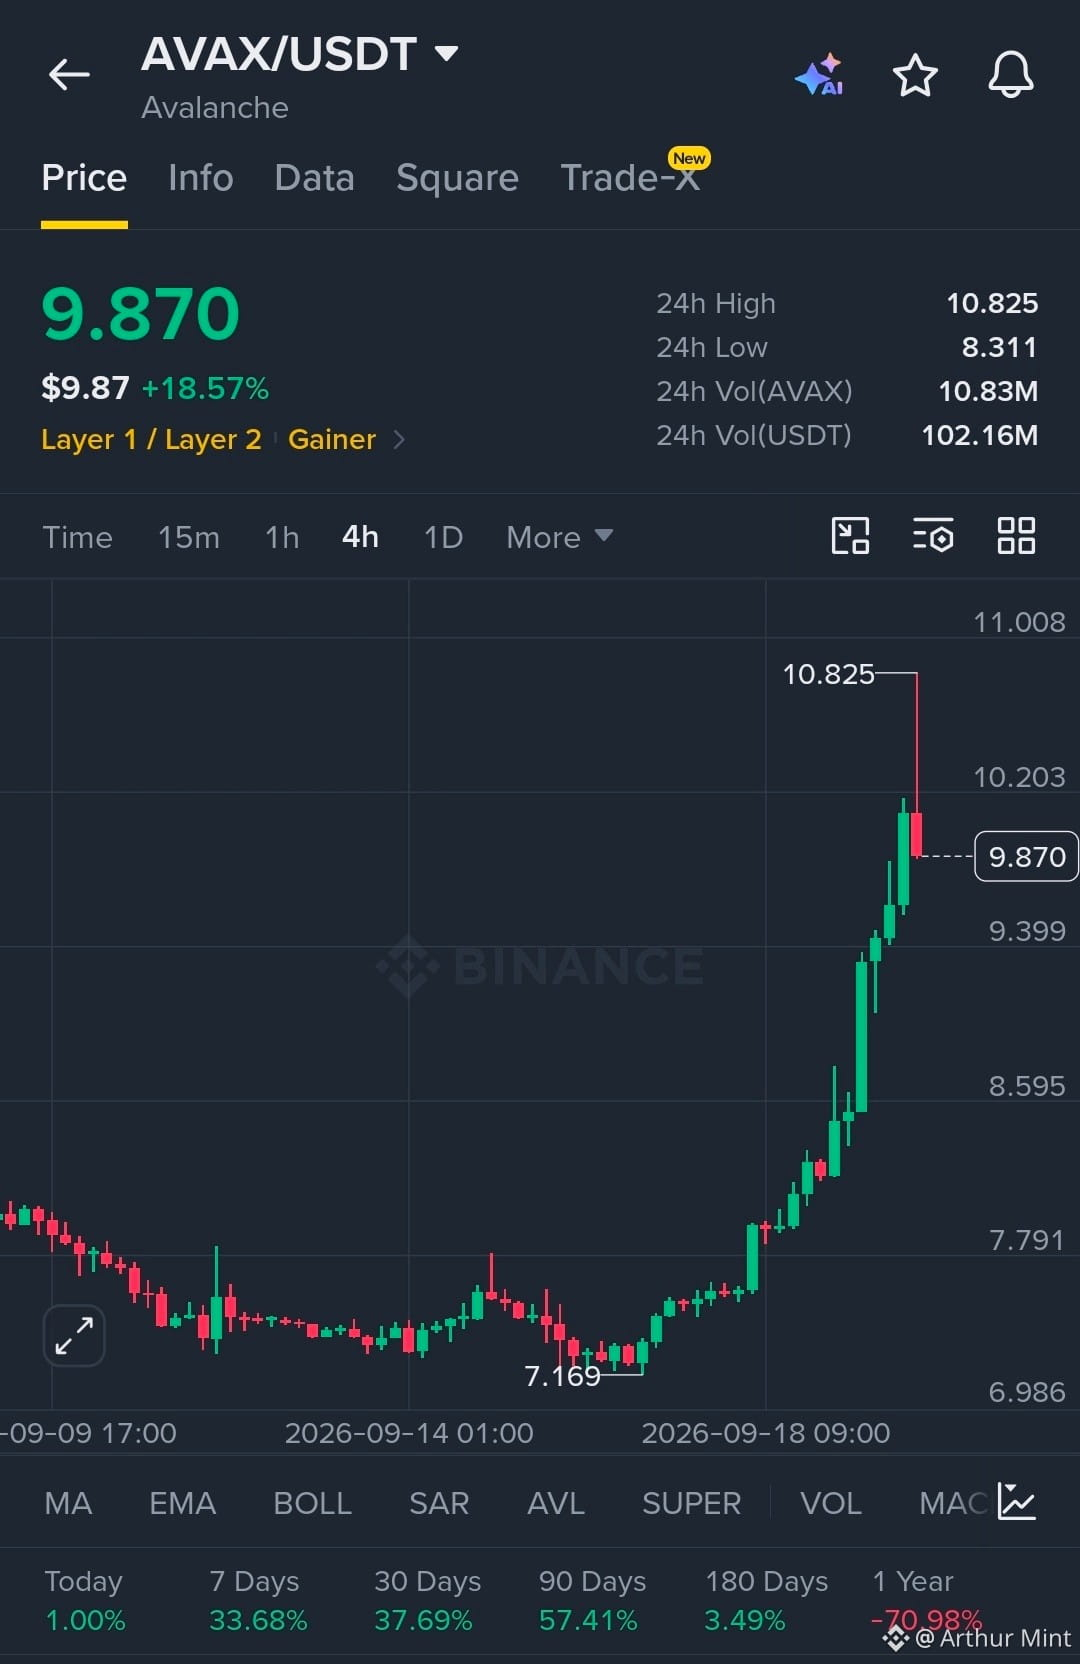
$AVAX is showing strong momentum with aggressive upside expansion.
Buyers are in control as structure continues to print higher highs and higher lows.
EP
9.70–9.90
TP
TP1 10.20
TP2 10.80
TP3 11.00
SL
9.35
Liquidity above 10.20 remains the key reaction zone, while holding 9.35 keeps the bullish structure intact. A clean break above 10.80 could open the next liquidity pocket toward 11.00.
Let’s go $AVAX
$AVAX is showing strong momentum with aggressive upside expansion.
Buyers are in control as structure continues to print higher highs and higher lows.
EP
9.70–9.90
TP
TP1 10.20
TP2 10.80
TP3 11.00
SL
9.35
Liquidity above 10.20 remains the key reaction zone, while holding 9.35 keeps the bullish structure intact. A clean break above 10.80 could open the next liquidity pocket toward 11.00.
Let’s go $AVAX
Buyers are in control as structure continues to print higher highs and higher lows.
EP
9.70–9.90
TP
TP1 10.20
TP2 10.80
TP3 11.00
SL
9.35
Liquidity above 10.20 remains the key reaction zone, while holding 9.35 keeps the bullish structure intact. A clean break above 10.80 could open the next liquidity pocket toward 11.00.
Let’s go $AVAX
1
468
·
--
Bullish
Bitcoin jumped $18,000 in just one week — from $63,000 to $81,000.
That move came right in the middle of a bear market, showing how sharply Bitcoin can accelerate even when broader conditions remain weak.
Why it matters: A single week erased a massive price gap, highlighting the scale of Bitcoin’s upside moves.
Market takeaway: Bear markets can still produce explosive rallies — and bull markets could amplify that volatility.
Bitcoin jumped $18,000 in just one week — from $63,000 to $81,000.
That move came right in the middle of a bear market, showing how sharply Bitcoin can accelerate even when broader conditions remain weak.
Why it matters: A single week erased a massive price gap, highlighting the scale of Bitcoin’s upside moves.
Market takeaway: Bear markets can still produce explosive rallies — and bull markets could amplify that volatility.
That move came right in the middle of a bear market, showing how sharply Bitcoin can accelerate even when broader conditions remain weak.
Why it matters: A single week erased a massive price gap, highlighting the scale of Bitcoin’s upside moves.
Market takeaway: Bear markets can still produce explosive rallies — and bull markets could amplify that volatility.
2
230
·
--
Bullish
BITCOIN’S PROFITABILITY SIGNAL IS BACK ABOVE BREAK-EVEN
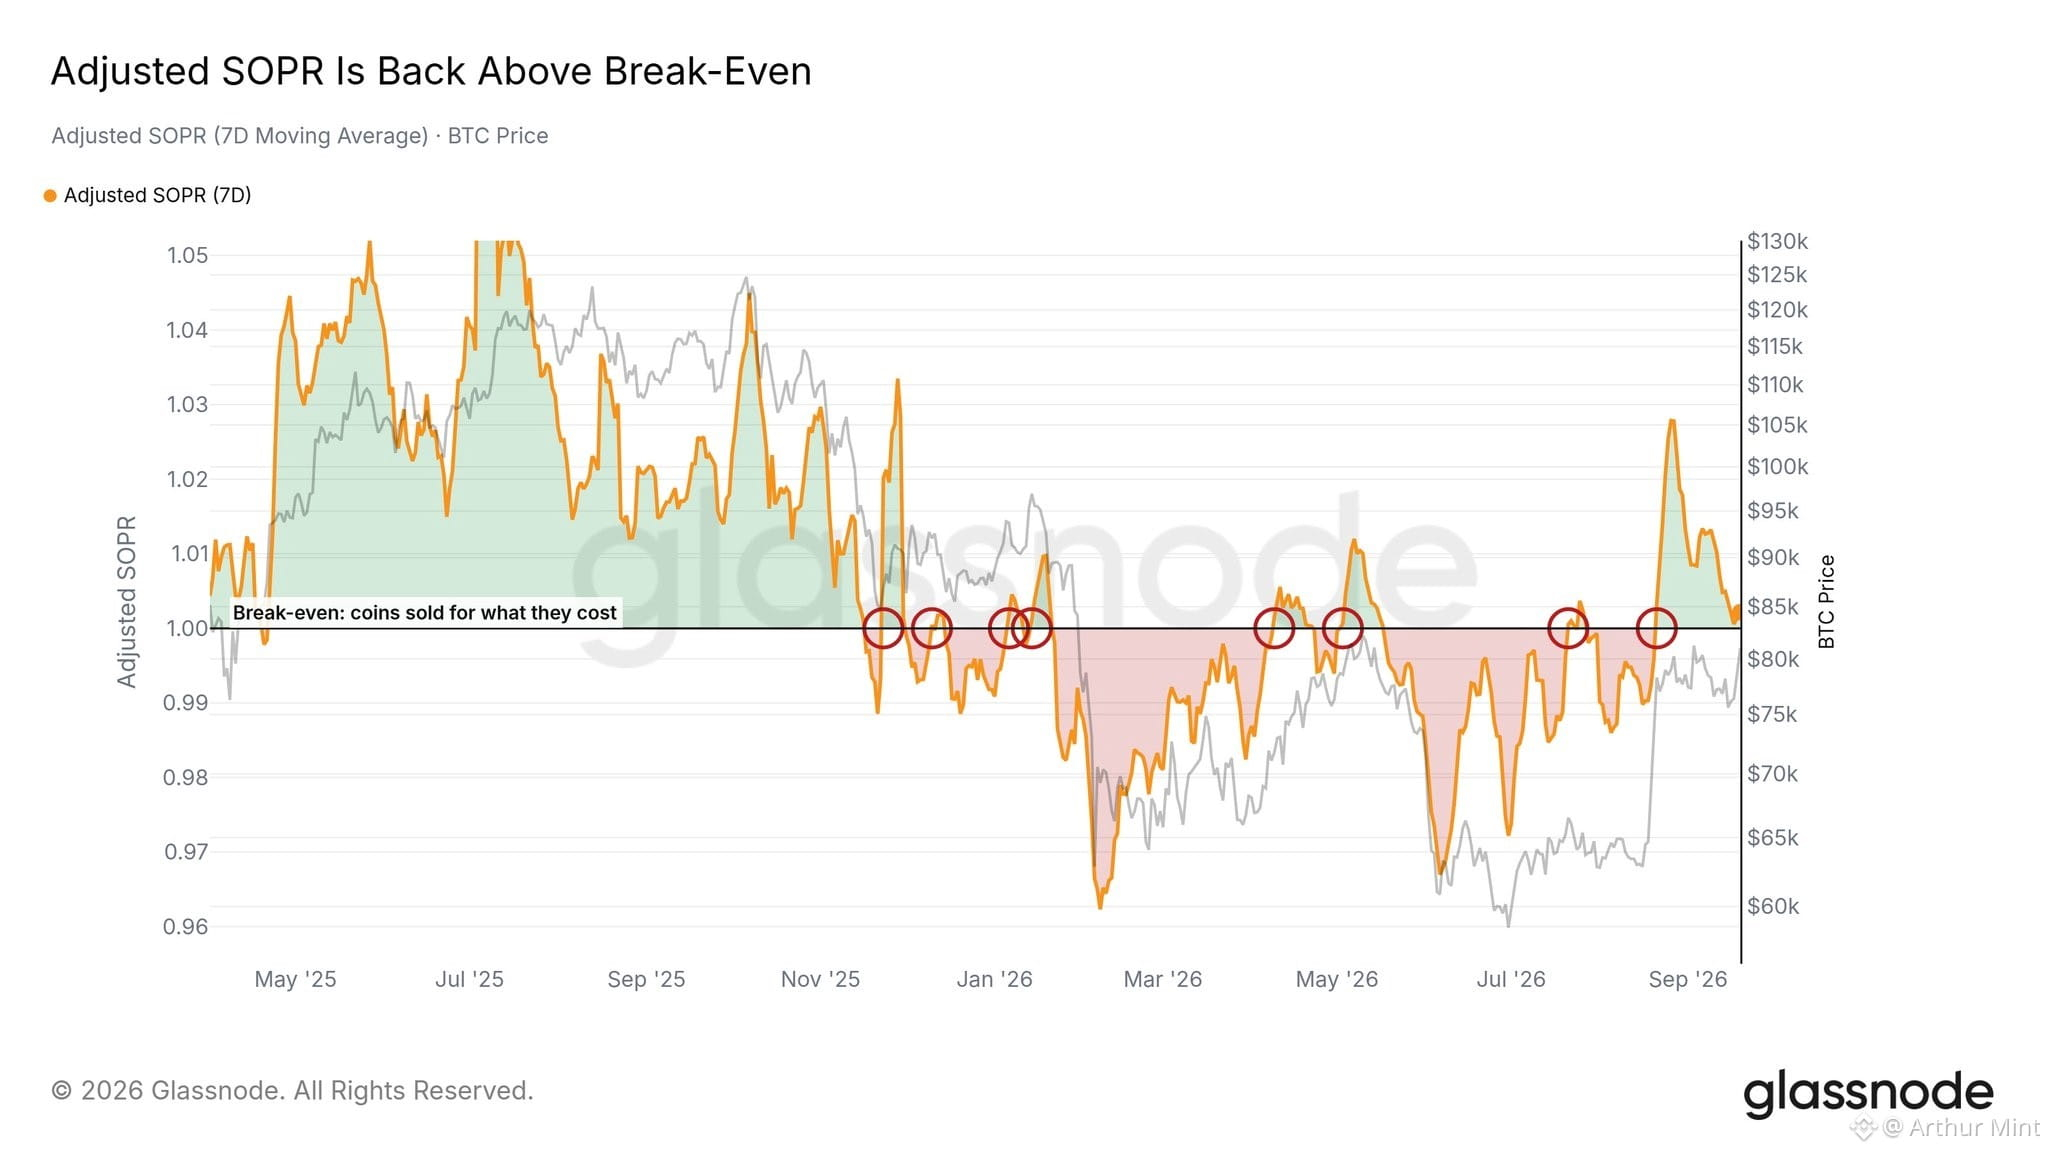
Bitcoin’s latest on-chain setup is showing renewed strength. The chart indicates that entity-adjusted SOPR has moved back above 1, suggesting coins are being spent at a profit rather than immediately triggering broad selling pressure.
This level matters because sustained SOPR above 1 has historically been associated with a bull-market environment. The current move therefore points to demand holding up well enough for profitable spending without an immediate rollover.
The chart also highlights several previous moves around the break-even line, showing how important the 1.0 level has become. Staying above it would keep the constructive signal intact and support the broader bullish narrative.
The next key test is simple: can SOPR remain above 1? A continued hold could reinforce confidence in current demand, while a drop back below 1 would suggest that this strength is starting to fade.
Still, SOPR is not a guarantee of future price action. Market conditions can change quickly, so the signal should be monitored alongside the broader trend.
$BTC is back on the profit side of the line — can the bulls keep it there?
BITCOIN’S PROFITABILITY SIGNAL IS BACK ABOVE BREAK-EVEN
Bitcoin’s latest on-chain setup is showing renewed strength. The chart indicates that entity-adjusted SOPR has moved back above 1, suggesting coins are being spent at a profit rather than immediately triggering broad selling pressure.
This level matters because sustained SOPR above 1 has historically been associated with a bull-market environment. The current move therefore points to demand holding up well enough for profitable spending without an immediate rollover.
The chart also highlights several previous moves around the break-even line, showing how important the 1.0 level has become. Staying above it would keep the constructive signal intact and support the broader bullish narrative.
The next key test is simple: can SOPR remain above 1? A continued hold could reinforce confidence in current demand, while a drop back below 1 would suggest that this strength is starting to fade.
Still, SOPR is not a guarantee of future price action. Market conditions can change quickly, so the signal should be monitored alongside the broader trend.
$BTC is back on the profit side of the line — can the bulls keep it there?
Bitcoin’s latest on-chain setup is showing renewed strength. The chart indicates that entity-adjusted SOPR has moved back above 1, suggesting coins are being spent at a profit rather than immediately triggering broad selling pressure.
This level matters because sustained SOPR above 1 has historically been associated with a bull-market environment. The current move therefore points to demand holding up well enough for profitable spending without an immediate rollover.
The chart also highlights several previous moves around the break-even line, showing how important the 1.0 level has become. Staying above it would keep the constructive signal intact and support the broader bullish narrative.
The next key test is simple: can SOPR remain above 1? A continued hold could reinforce confidence in current demand, while a drop back below 1 would suggest that this strength is starting to fade.
Still, SOPR is not a guarantee of future price action. Market conditions can change quickly, so the signal should be monitored alongside the broader trend.
$BTC is back on the profit side of the line — can the bulls keep it there?
3
199
·
--
Bullish
Bitcoin fell to $75K, then snapped back $6,000 to $81K in one of crypto’s wildest weeks.
The CLARITY Act failed despite support from President Trump, the Treasury, and agencies. The Fed also raised rates for the first time in 3 years, sending bears and shorts into high gear.
Then the narrative reversed: the Strategic Bitcoin Reserve bill advanced, the crypto tax bill passed, the SEC moved toward crypto rules and approved onchain stock trading, while the CFTC sent crypto market rules to the White House for review.
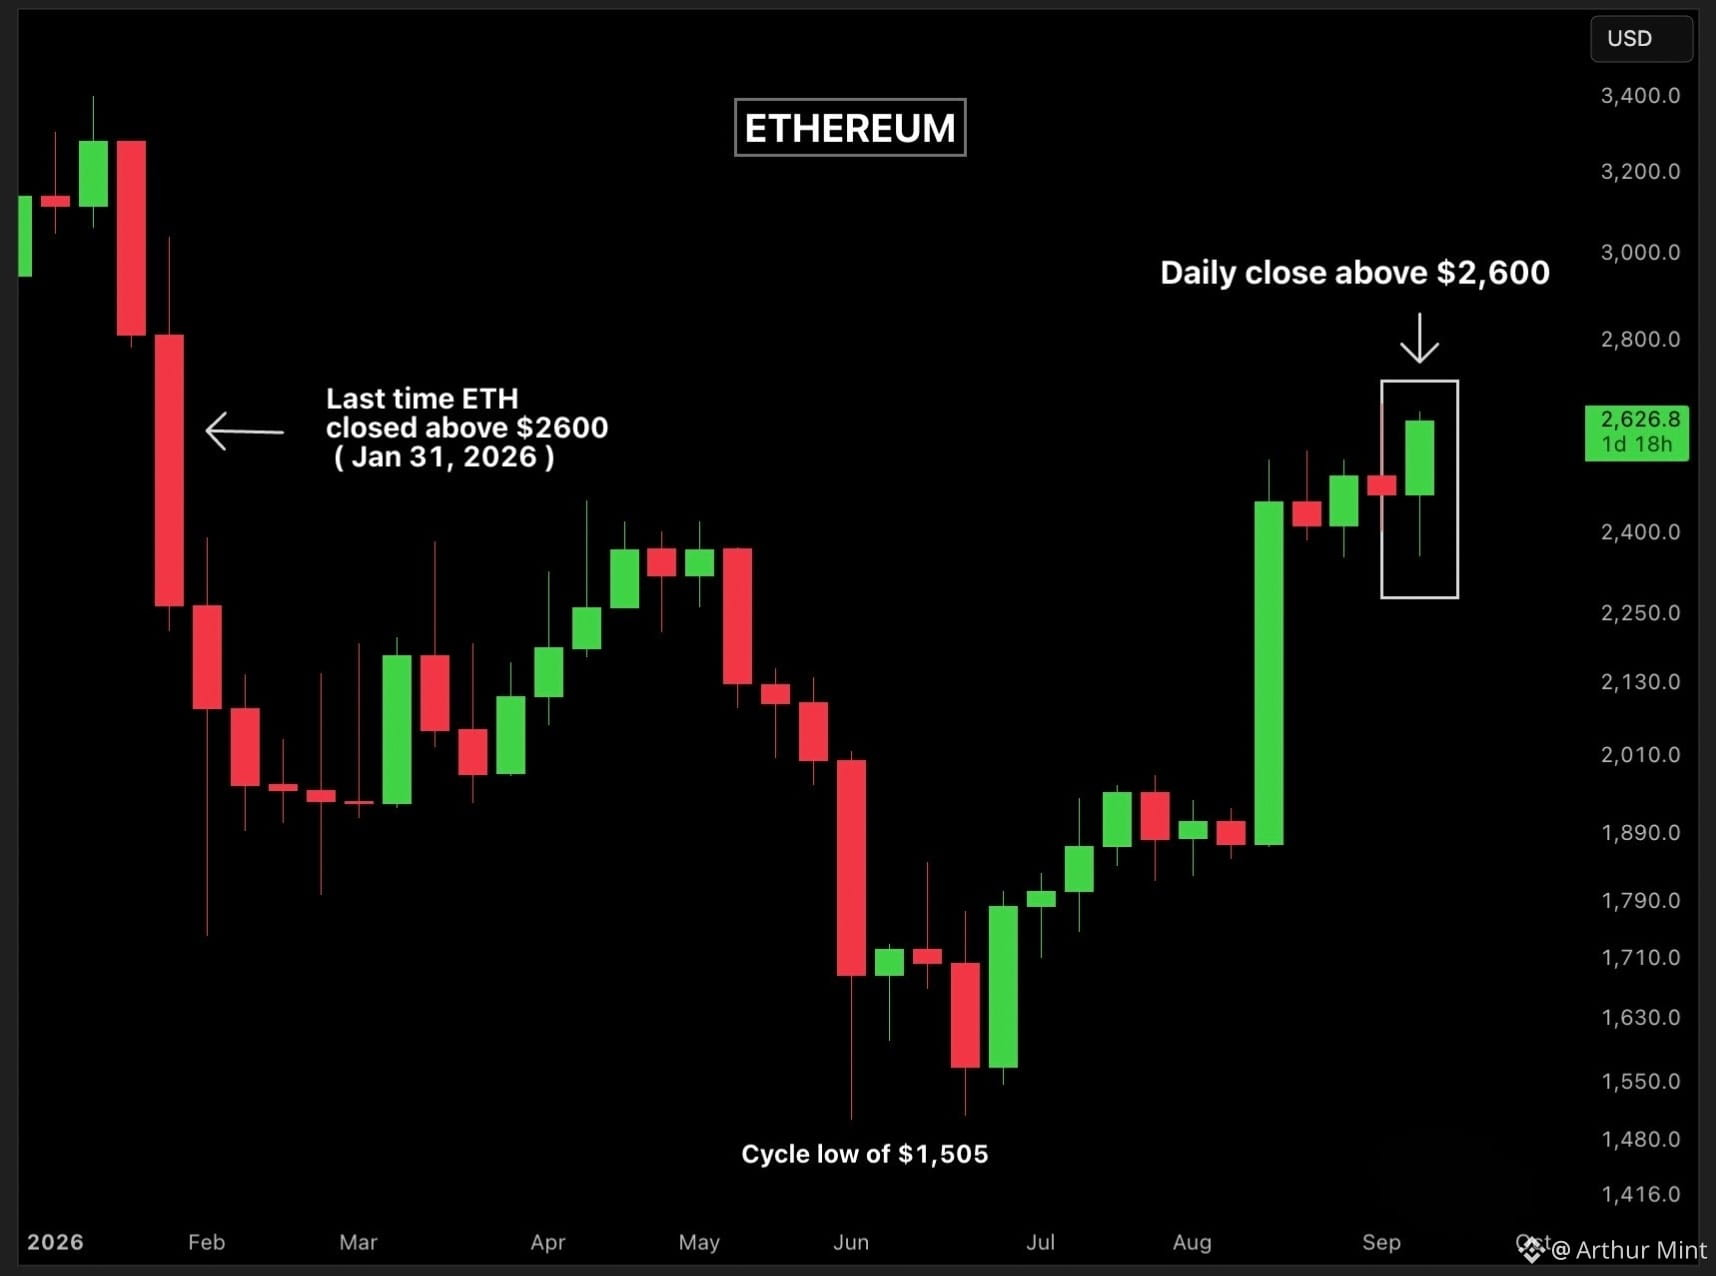
Why it matters: major policy FUD hit hard, yet Bitcoin reclaimed the MA50, ETH closed above $2,600, and altcoins reached an 8-month market-cap high.
Crypto absorbed the shock—and kept moving higher.
Bitcoin fell to $75K, then snapped back $6,000 to $81K in one of crypto’s wildest weeks.
The CLARITY Act failed despite support from President Trump, the Treasury, and agencies. The Fed also raised rates for the first time in 3 years, sending bears and shorts into high gear.
Then the narrative reversed: the Strategic Bitcoin Reserve bill advanced, the crypto tax bill passed, the SEC moved toward crypto rules and approved onchain stock trading, while the CFTC sent crypto market rules to the White House for review.
Why it matters: major policy FUD hit hard, yet Bitcoin reclaimed the MA50, ETH closed above $2,600, and altcoins reached an 8-month market-cap high.
Crypto absorbed the shock—and kept moving higher.
The CLARITY Act failed despite support from President Trump, the Treasury, and agencies. The Fed also raised rates for the first time in 3 years, sending bears and shorts into high gear.
Then the narrative reversed: the Strategic Bitcoin Reserve bill advanced, the crypto tax bill passed, the SEC moved toward crypto rules and approved onchain stock trading, while the CFTC sent crypto market rules to the White House for review.
Why it matters: major policy FUD hit hard, yet Bitcoin reclaimed the MA50, ETH closed above $2,600, and altcoins reached an 8-month market-cap high.
Crypto absorbed the shock—and kept moving higher.
3
325
·
--
Bullish
$ETH just scored its first daily close above $2,600 in 8 months.
The move marks a notable break above a level ETH had failed to close above during that entire period.
Why it matters: reclaiming $2,600 after such a long stretch can strengthen the bullish narrative around ETH and keep altcoins firmly in focus.
Market takeaway: ETH is breaking higher — and altcoins are now back in the spotlight.
$ETH just scored its first daily close above $2,600 in 8 months.
The move marks a notable break above a level ETH had failed to close above during that entire period.
Why it matters: reclaiming $2,600 after such a long stretch can strengthen the bullish narrative around ETH and keep altcoins firmly in focus.
Market takeaway: ETH is breaking higher — and altcoins are now back in the spotlight.
The move marks a notable break above a level ETH had failed to close above during that entire period.
Why it matters: reclaiming $2,600 after such a long stretch can strengthen the bullish narrative around ETH and keep altcoins firmly in focus.
Market takeaway: ETH is breaking higher — and altcoins are now back in the spotlight.
3
490
·
--
Bullish
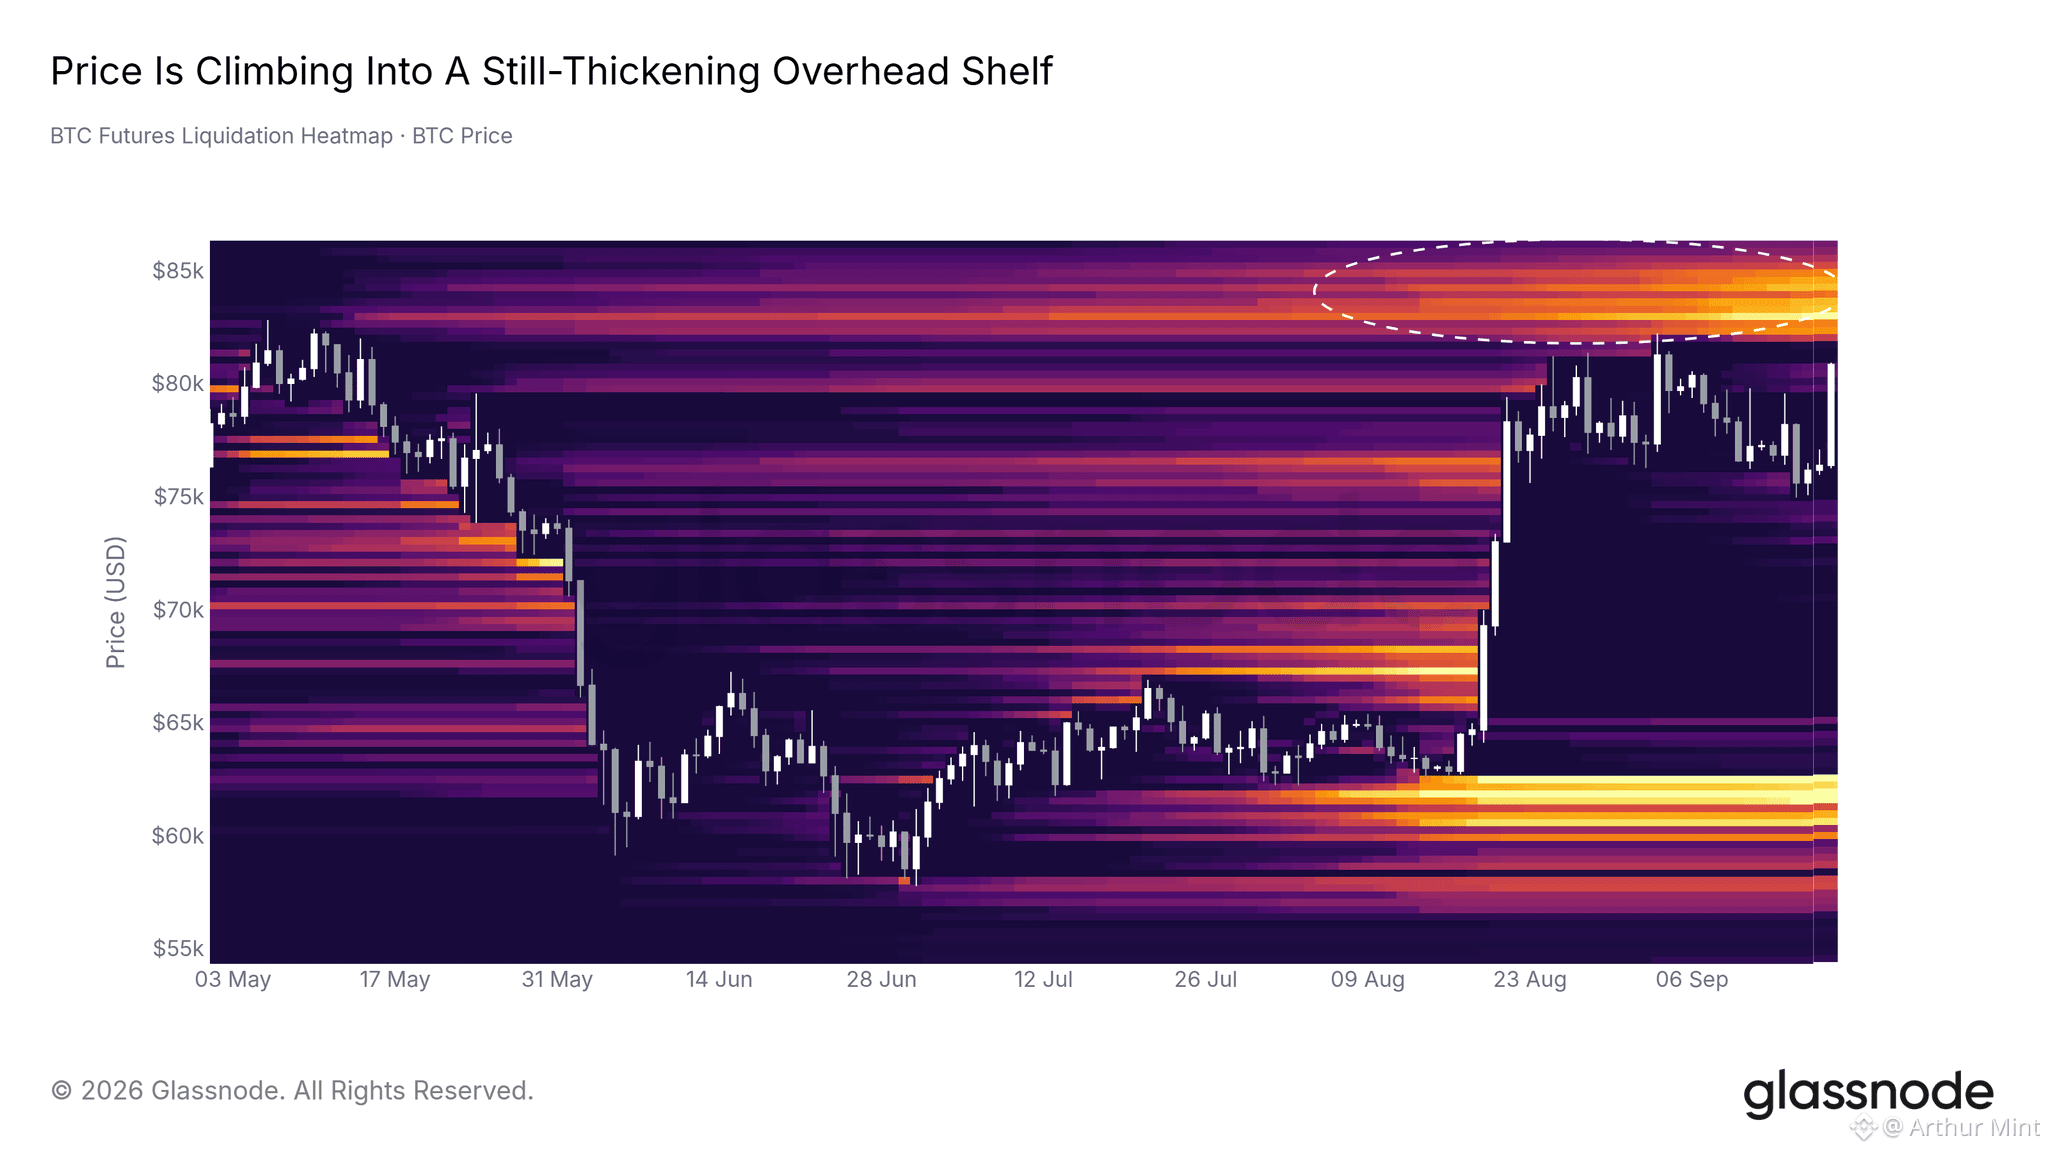
BITCOIN IS MOVING TOWARD A THICK LIQUIDATION ZONE
Bitcoin is pushing higher toward a dense liquidation shelf concentrated around $83K–$86K, creating an important area for the next move.
This zone reflects a buildup of short positions that has developed over several weeks. If $BTC reaches this region, those positions could face increasing pressure as price moves upward.
That matters because forced short covering can accelerate momentum. Once shorts begin closing, Bitcoin could move rapidly through the liquidity cluster, potentially adding further strength to the broader crypto market.
The current structure therefore keeps attention firmly on the $83K–$86K area. A sustained move into this zone could become a meaningful test of market momentum and positioning.
Still, liquidation-driven moves are not guaranteed. Price can react unpredictably around heavily positioned areas, so traders should remain cautious rather than assume a straight upside move.
BTC is climbing into the pressure zone—will short sellers fuel the next leg higher?
BITCOIN IS MOVING TOWARD A THICK LIQUIDATION ZONE
Bitcoin is pushing higher toward a dense liquidation shelf concentrated around $83K–$86K, creating an important area for the next move.
This zone reflects a buildup of short positions that has developed over several weeks. If $BTC reaches this region, those positions could face increasing pressure as price moves upward.
That matters because forced short covering can accelerate momentum. Once shorts begin closing, Bitcoin could move rapidly through the liquidity cluster, potentially adding further strength to the broader crypto market.
The current structure therefore keeps attention firmly on the $83K–$86K area. A sustained move into this zone could become a meaningful test of market momentum and positioning.
Still, liquidation-driven moves are not guaranteed. Price can react unpredictably around heavily positioned areas, so traders should remain cautious rather than assume a straight upside move.
BTC is climbing into the pressure zone—will short sellers fuel the next leg higher?
Bitcoin is pushing higher toward a dense liquidation shelf concentrated around $83K–$86K, creating an important area for the next move.
This zone reflects a buildup of short positions that has developed over several weeks. If $BTC reaches this region, those positions could face increasing pressure as price moves upward.
That matters because forced short covering can accelerate momentum. Once shorts begin closing, Bitcoin could move rapidly through the liquidity cluster, potentially adding further strength to the broader crypto market.
The current structure therefore keeps attention firmly on the $83K–$86K area. A sustained move into this zone could become a meaningful test of market momentum and positioning.
Still, liquidation-driven moves are not guaranteed. Price can react unpredictably around heavily positioned areas, so traders should remain cautious rather than assume a straight upside move.
BTC is climbing into the pressure zone—will short sellers fuel the next leg higher?
3
531
Log in to explore more content
Join global crypto users on Binance Square
⚡️ Get latest and useful information about crypto.
💬 Trusted by the world’s largest crypto exchange.
👍 Discover real insights from verified creators.
Email / Phone number
Trending Topics
BitcoinHits$85K
2,145 views
108 Discussing
Roughly $5B in visible $BTC short liquidations stacked between $83K–$85K. In an uptrend, that's fuel.
When shorts liquidate, they're forced to market-buy. That buying pressure drives price higher, triggering the next layer of liquidations above — a cascade of demand feeding itself.
We saw this exact dynamic on the run from $67K to $80K. The setup looks identical now. Expect the next leg to follow the same playbook: liquidation-driven momentum, systematic buying pressure, and continuation until the fuel runs out.
This is how bull markets accelerate. The chart is setting up clean, and the mechanics are in place. Watch for the break above $83K — that's where the cascade starts.
QuantFreedom
·4 Likes
·2.6k views
ECBStartsBlockchainEuroSettlement
2,927 views
261 Discussing
SouthAfricaProposesCryptoExchangeControls
13,167 views
463 Discussing