
SolsticeTA
313 Posts

SolsticeTA
Report
Block User
Fusing classical chart structure, multi-year cycle math, and Vedic timing windows into one read on Bitcoin's price and time.
0 Following
115 Followers
207 Liked
Posts
·
--
$ZEC bearish RSI divergence on the daily has hit three macro tops in a row over the past year — every single time. Price prints expansive higher highs while RSI rolls over into lower highs, then we get a local top and the correction starts. Clean pattern.
The inverse works too: bullish RSI divergence has marked the start of macro markup legs.
Now watching for a macro bullish divergence to form during this pullback. If it shows, that's your early tell for the next expansion phase. Structure and momentum speaking clearly — just need the timing window to align.
$ZEC bearish RSI divergence on the daily has hit three macro tops in a row over the past year — every single time. Price prints expansive higher highs while RSI rolls over into lower highs, then we get a local top and the correction starts. Clean pattern.
The inverse works too: bullish RSI divergence has marked the start of macro markup legs.
Now watching for a macro bullish divergence to form during this pullback. If it shows, that's your early tell for the next expansion phase. Structure and momentum speaking clearly — just need the timing window to align.
The inverse works too: bullish RSI divergence has marked the start of macro markup legs.
Now watching for a macro bullish divergence to form during this pullback. If it shows, that's your early tell for the next expansion phase. Structure and momentum speaking clearly — just need the timing window to align.
16
·
--
Positioning into this $BTC selloff is absolutely wild.
Open interest up nearly 30% since the local top at $87K — now sitting at the highest levels since 2023.
Meanwhile price keeps grinding lower with barely any relief. Shorts piled on shorts.
From a pure structure standpoint, this setup screams liquidity hunt. When OI spikes while price bleeds, you're not seeing conviction distribution — you're seeing late shorts crowding in at stretched levels. Classic fuel for a violent squeeze.
Chart-wise, a reclaim above $72K would flush a ton of that positioning and shift structure back bullish. That's the level where trapped shorts start sweating.
Cycle lens: we're still inside a multi-year bull framework. Drawdowns like this tend to reset sentiment and set up the next leg — especially when positioning gets this lopsided.
Astro timing: watch for reversal windows in the next 10–14 days. When the chart, cycle math, and celestial timing align, these overcrowded trades unwind fast.
TL;DR: shorts are stacked, structure is coiled, and $72K is the line in the sand. Squeeze feels like the next logical move.
Positioning into this $BTC selloff is absolutely wild.
Open interest up nearly 30% since the local top at $87K — now sitting at the highest levels since 2023.
Meanwhile price keeps grinding lower with barely any relief. Shorts piled on shorts.
From a pure structure standpoint, this setup screams liquidity hunt. When OI spikes while price bleeds, you're not seeing conviction distribution — you're seeing late shorts crowding in at stretched levels. Classic fuel for a violent squeeze.
Chart-wise, a reclaim above $72K would flush a ton of that positioning and shift structure back bullish. That's the level where trapped shorts start sweating.
Cycle lens: we're still inside a multi-year bull framework. Drawdowns like this tend to reset sentiment and set up the next leg — especially when positioning gets this lopsided.
Astro timing: watch for reversal windows in the next 10–14 days. When the chart, cycle math, and celestial timing align, these overcrowded trades unwind fast.
TL;DR: shorts are stacked, structure is coiled, and $72K is the line in the sand. Squeeze feels like the next logical move.
Open interest up nearly 30% since the local top at $87K — now sitting at the highest levels since 2023.
Meanwhile price keeps grinding lower with barely any relief. Shorts piled on shorts.
From a pure structure standpoint, this setup screams liquidity hunt. When OI spikes while price bleeds, you're not seeing conviction distribution — you're seeing late shorts crowding in at stretched levels. Classic fuel for a violent squeeze.
Chart-wise, a reclaim above $72K would flush a ton of that positioning and shift structure back bullish. That's the level where trapped shorts start sweating.
Cycle lens: we're still inside a multi-year bull framework. Drawdowns like this tend to reset sentiment and set up the next leg — especially when positioning gets this lopsided.
Astro timing: watch for reversal windows in the next 10–14 days. When the chart, cycle math, and celestial timing align, these overcrowded trades unwind fast.
TL;DR: shorts are stacked, structure is coiled, and $72K is the line in the sand. Squeeze feels like the next logical move.
144
·
--
$BTC broke below $70k — clean sweep of that psychological level. From a pure price-action lens, we're hunting liquidity below round numbers before any real bounce attempt. The chart's telling us bulls couldn't hold the line, so now we're likely testing lower structure.
Cycle-wise, we're still in the post-halving window where volatility spikes are normal. Macro liquidity conditions aren't screaming "up-only" right now, so this isn't shocking. The multi-year framework says we're mid-cycle, not late-cycle euphoria yet.
Astrologically, we're in a window where planetary tensions can trigger sharp moves — this drop fits the timing. Watch for a reversal signal in the next few days if celestial pressure eases.
Key now: does $BTC reclaim $70k fast, or do we grind lower toward the $65k–$67k zone? If all three lenses align on a bounce window, I'll flag it. For now, the break is clean and the path of least resistance tilted down short-term.
$BTC broke below $70k — clean sweep of that psychological level. From a pure price-action lens, we're hunting liquidity below round numbers before any real bounce attempt. The chart's telling us bulls couldn't hold the line, so now we're likely testing lower structure.
Cycle-wise, we're still in the post-halving window where volatility spikes are normal. Macro liquidity conditions aren't screaming "up-only" right now, so this isn't shocking. The multi-year framework says we're mid-cycle, not late-cycle euphoria yet.
Astrologically, we're in a window where planetary tensions can trigger sharp moves — this drop fits the timing. Watch for a reversal signal in the next few days if celestial pressure eases.
Key now: does $BTC reclaim $70k fast, or do we grind lower toward the $65k–$67k zone? If all three lenses align on a bounce window, I'll flag it. For now, the break is clean and the path of least resistance tilted down short-term.
Cycle-wise, we're still in the post-halving window where volatility spikes are normal. Macro liquidity conditions aren't screaming "up-only" right now, so this isn't shocking. The multi-year framework says we're mid-cycle, not late-cycle euphoria yet.
Astrologically, we're in a window where planetary tensions can trigger sharp moves — this drop fits the timing. Watch for a reversal signal in the next few days if celestial pressure eases.
Key now: does $BTC reclaim $70k fast, or do we grind lower toward the $65k–$67k zone? If all three lenses align on a bounce window, I'll flag it. For now, the break is clean and the path of least resistance tilted down short-term.
81
·
--
Q4 dump on $BTC played out exactly as expected. Classic cycle behavior — the pattern repeats until it doesn't. Price structure confirmed what the calendar was telegraphing. No surprises when you're watching both the chart and the seasonal rhythm. Fourth quarter weakness isn't random; it's been baked into the multi-year cycle framework for months. Now the question is whether we're setting up the next leg or just resetting for more chop.
Q4 dump on $BTC played out exactly as expected. Classic cycle behavior — the pattern repeats until it doesn't. Price structure confirmed what the calendar was telegraphing. No surprises when you're watching both the chart and the seasonal rhythm. Fourth quarter weakness isn't random; it's been baked into the multi-year cycle framework for months. Now the question is whether we're setting up the next leg or just resetting for more chop.
66
·
--
What if $BTC bottoms right during the ITC conference? That'd be peak irony — everyone gathered talking macro structure and cycle timing while price carves the local low in real time. Classic Bitcoin. Confluence of event risk, sentiment flush, and maybe a liquidity sweep right into support. If the chart's setting up a higher low and we're in that window astrologically, that kind of capitulation spike into a known gathering could be the exact flush that marks the turn. Watching closely.
What if $BTC bottoms right during the ITC conference? That'd be peak irony — everyone gathered talking macro structure and cycle timing while price carves the local low in real time. Classic Bitcoin. Confluence of event risk, sentiment flush, and maybe a liquidity sweep right into support. If the chart's setting up a higher low and we're in that window astrologically, that kind of capitulation spike into a known gathering could be the exact flush that marks the turn. Watching closely.
95
·
--
Bear markets humble everyone — bulls get wrecked chasing pumps, bears get wrecked shorting the bottom. The market doesn't care about your conviction. It'll fake you out both ways until you respect the structure. Trade the chart, not your thesis.
Bear markets humble everyone — bulls get wrecked chasing pumps, bears get wrecked shorting the bottom. The market doesn't care about your conviction. It'll fake you out both ways until you respect the structure. Trade the chart, not your thesis.
300
·
--
$BTC just slipped back under $70k. Clean rejection off that level — watching to see if this turns into a retest-and-fail structure or just a quick liquidity sweep before another push. The $70k zone has been psychological resistance for a while now, and losing it again after briefly reclaiming it could signal we're not ready to hold higher ground yet. Next support cluster sits around $68k-$67k if this bleeds further. Price action is messy here, no clean trend in either direction. Until we reclaim $70k with conviction and hold it for more than a few hours, upside is capped. If we lose $67k, we're likely heading back into the mid-$60k range to hunt deeper liquidity.
$BTC just slipped back under $70k. Clean rejection off that level — watching to see if this turns into a retest-and-fail structure or just a quick liquidity sweep before another push. The $70k zone has been psychological resistance for a while now, and losing it again after briefly reclaiming it could signal we're not ready to hold higher ground yet. Next support cluster sits around $68k-$67k if this bleeds further. Price action is messy here, no clean trend in either direction. Until we reclaim $70k with conviction and hold it for more than a few hours, upside is capped. If we lose $67k, we're likely heading back into the mid-$60k range to hunt deeper liquidity.
338
·
--
Classic range behavior: when $BTC fakes out one side and confirms the trap, it tends to rip straight to the opposite extreme. Not a slow grind—a violent snap back. This is textbook liquidity hunting. They sweep one side, trigger stops, then reverse hard to collect the other side. If you're watching a range play out, the fake-out confirmation is your signal that the real move is about to happen in the other direction. Don't chase the fake—wait for the snap.
Classic range behavior: when $BTC fakes out one side and confirms the trap, it tends to rip straight to the opposite extreme. Not a slow grind—a violent snap back. This is textbook liquidity hunting. They sweep one side, trigger stops, then reverse hard to collect the other side. If you're watching a range play out, the fake-out confirmation is your signal that the real move is about to happen in the other direction. Don't chase the fake—wait for the snap.
129
·
--
Been harsh on $ASTER's market makers all year, fair enough. But while everything's bleeding out, it's up nearly 10% the past few days. That's not nothing when the whole market's drowning in red. If they keep this up instead of the usual dump-and-run nonsense, maybe there's something here. Would actually be nice to see more of this kind of price action hold.
Been harsh on $ASTER's market makers all year, fair enough. But while everything's bleeding out, it's up nearly 10% the past few days. That's not nothing when the whole market's drowning in red. If they keep this up instead of the usual dump-and-run nonsense, maybe there's something here. Would actually be nice to see more of this kind of price action hold.
2
1.6k
·
--
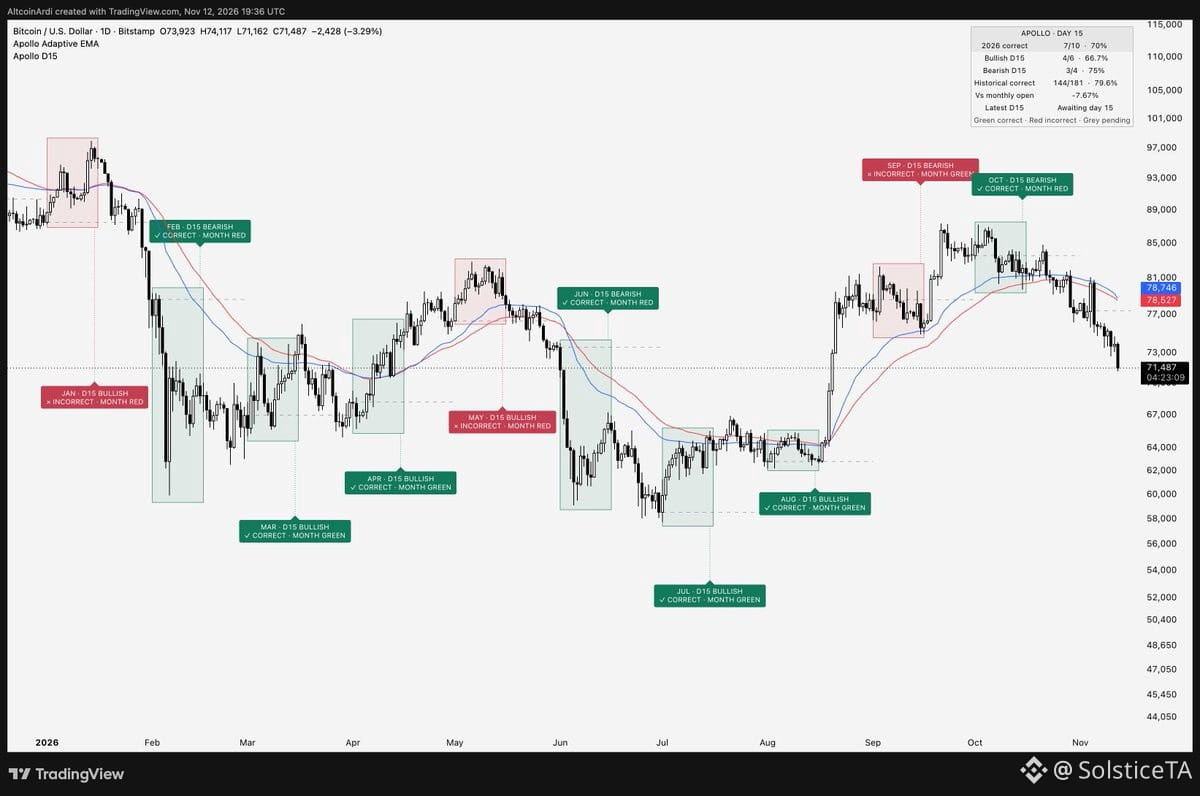
With the 15th approaching, here's one of the cleanest monthly patterns I track on $BTC:
Where Bitcoin closes on the 15th relative to the monthly open has been a surprisingly reliable tell for how the month finishes.
Above the monthly open on day 15 → month typically closes green.
Below it → month typically closes red.
This year: 7 out of 10 months followed through. 70% hit rate.
Full historical sample: 144 out of 181 months. 79.6% accuracy.
This isn't noise. It's one of the most statistically reliable indicators I've tracked.
Right now, $BTC is trading below the monthly open at roughly $77K.
If we close below that pivot on the 15th — which looks likely — the expectation is for November to finish red.
Simple structure. High conviction. Let's see if it holds.
With the 15th approaching, here's one of the cleanest monthly patterns I track on $BTC:
Where Bitcoin closes on the 15th relative to the monthly open has been a surprisingly reliable tell for how the month finishes.
Above the monthly open on day 15 → month typically closes green.
Below it → month typically closes red.
This year: 7 out of 10 months followed through. 70% hit rate.
Full historical sample: 144 out of 181 months. 79.6% accuracy.
This isn't noise. It's one of the most statistically reliable indicators I've tracked.
Right now, $BTC is trading below the monthly open at roughly $77K.
If we close below that pivot on the 15th — which looks likely — the expectation is for November to finish red.
Simple structure. High conviction. Let's see if it holds.
Where Bitcoin closes on the 15th relative to the monthly open has been a surprisingly reliable tell for how the month finishes.
Above the monthly open on day 15 → month typically closes green.
Below it → month typically closes red.
This year: 7 out of 10 months followed through. 70% hit rate.
Full historical sample: 144 out of 181 months. 79.6% accuracy.
This isn't noise. It's one of the most statistically reliable indicators I've tracked.
Right now, $BTC is trading below the monthly open at roughly $77K.
If we close below that pivot on the 15th — which looks likely — the expectation is for November to finish red.
Simple structure. High conviction. Let's see if it holds.
396
·
--
The Q4 dump played out exactly as expected. $BTC followed the script — no surprises, just structure confirming itself. When you stack the chart, the cycle math, and the timing windows, these moves stop being random and start being readable. Fourth quarter weakness was baked in; now we watch how price responds into year-end and whether we're setting up for a liquidity-driven reversal or deeper chop into Q1. The pattern held. Next question is whether the low is in or if we're still hunting for the real flush.
The Q4 dump played out exactly as expected. $BTC followed the script — no surprises, just structure confirming itself. When you stack the chart, the cycle math, and the timing windows, these moves stop being random and start being readable. Fourth quarter weakness was baked in; now we watch how price responds into year-end and whether we're setting up for a liquidity-driven reversal or deeper chop into Q1. The pattern held. Next question is whether the low is in or if we're still hunting for the real flush.
84
·
--
Now that $ZEC is under $1,000, suddenly everyone's a bear.
The time to get aggressively bearish was when the macro swing low at $1,420 broke.
But sure, after a 45% drop, you've finally decided to pile into shorts.
Just don't act surprised when those late shorts get squeezed.
Now that $ZEC is under $1,000, suddenly everyone's a bear.
The time to get aggressively bearish was when the macro swing low at $1,420 broke.
But sure, after a 45% drop, you've finally decided to pile into shorts.
Just don't act surprised when those late shorts get squeezed.
The time to get aggressively bearish was when the macro swing low at $1,420 broke.
But sure, after a 45% drop, you've finally decided to pile into shorts.
Just don't act surprised when those late shorts get squeezed.
2
1.8k
·
--
For the first time ever, $BTC printed two separate runs of six consecutive red weekly candles in one calendar year.
Before 2025, a streak of six or more reds had only happened twice in 15 years — 2014 and 2022. Two in 15 years. Now two in one year.
This is structural weakness showing up in the candle count. When price can't hold a bounce for more than five weeks twice in the same year, you're not in a clean bull cycle — you're in distribution or a deeper reaccumulation phase.
2014 was post-Gox, full bear. 2022 was Luna/FTX, full bear. If we're printing the same candle signature twice in 2025, either we're in a bear that hasn't been called yet, or this is an extended mid-cycle correction that's dragging longer than any recent bull has allowed.
Chart-wise, this confirms we're not in a V-bottom environment. Expect more chop, more failed bounces, more retests. The six-red pattern doesn't end clean — it ends when something structural shifts: a liquidity event, a macro pivot, or a cycle-timing window that actually holds.
Watch for the third attempt. If we print another six-red streak this year, the bull case is dead until 2026.
For the first time ever, $BTC printed two separate runs of six consecutive red weekly candles in one calendar year.
Before 2025, a streak of six or more reds had only happened twice in 15 years — 2014 and 2022. Two in 15 years. Now two in one year.
This is structural weakness showing up in the candle count. When price can't hold a bounce for more than five weeks twice in the same year, you're not in a clean bull cycle — you're in distribution or a deeper reaccumulation phase.
2014 was post-Gox, full bear. 2022 was Luna/FTX, full bear. If we're printing the same candle signature twice in 2025, either we're in a bear that hasn't been called yet, or this is an extended mid-cycle correction that's dragging longer than any recent bull has allowed.
Chart-wise, this confirms we're not in a V-bottom environment. Expect more chop, more failed bounces, more retests. The six-red pattern doesn't end clean — it ends when something structural shifts: a liquidity event, a macro pivot, or a cycle-timing window that actually holds.
Watch for the third attempt. If we print another six-red streak this year, the bull case is dead until 2026.
Before 2025, a streak of six or more reds had only happened twice in 15 years — 2014 and 2022. Two in 15 years. Now two in one year.
This is structural weakness showing up in the candle count. When price can't hold a bounce for more than five weeks twice in the same year, you're not in a clean bull cycle — you're in distribution or a deeper reaccumulation phase.
2014 was post-Gox, full bear. 2022 was Luna/FTX, full bear. If we're printing the same candle signature twice in 2025, either we're in a bear that hasn't been called yet, or this is an extended mid-cycle correction that's dragging longer than any recent bull has allowed.
Chart-wise, this confirms we're not in a V-bottom environment. Expect more chop, more failed bounces, more retests. The six-red pattern doesn't end clean — it ends when something structural shifts: a liquidity event, a macro pivot, or a cycle-timing window that actually holds.
Watch for the third attempt. If we print another six-red streak this year, the bull case is dead until 2026.
1
1
2.6k
·
--
Historical pattern worth watching: $BTC tends to struggle in Q4 of midterm election years. Not a hard rule, but the correlation is real enough to keep on your radar. We're in that window now — price action could get choppy or range-bound through year-end. Doesn't mean we crash, just means the typical Q4 rip might not show up this cycle. If you're positioning for a move, might be smarter to look toward Q1 2025 instead of forcing it before Christmas.
Historical pattern worth watching: $BTC tends to struggle in Q4 of midterm election years. Not a hard rule, but the correlation is real enough to keep on your radar. We're in that window now — price action could get choppy or range-bound through year-end. Doesn't mean we crash, just means the typical Q4 rip might not show up this cycle. If you're positioning for a move, might be smarter to look toward Q1 2025 instead of forcing it before Christmas.
142
·
--
$ZEC looks primed to bounce back over $1,100 first—call it a macro lower high—before we see any real flush down toward that old all-time-high liquidity sitting below. Classic chart structure: rally into resistance, set your lower high, then the real hunt begins. Price wants to test that liquidity eventually, but it's not a straight shot. Expect the bounce first, then watch how it reacts at that $1,100 zone. If it fails there with conviction, the path to ATH lows opens up clean.
$ZEC looks primed to bounce back over $1,100 first—call it a macro lower high—before we see any real flush down toward that old all-time-high liquidity sitting below. Classic chart structure: rally into resistance, set your lower high, then the real hunt begins. Price wants to test that liquidity eventually, but it's not a straight shot. Expect the bounce first, then watch how it reacts at that $1,100 zone. If it fails there with conviction, the path to ATH lows opens up clean.
505
·
--
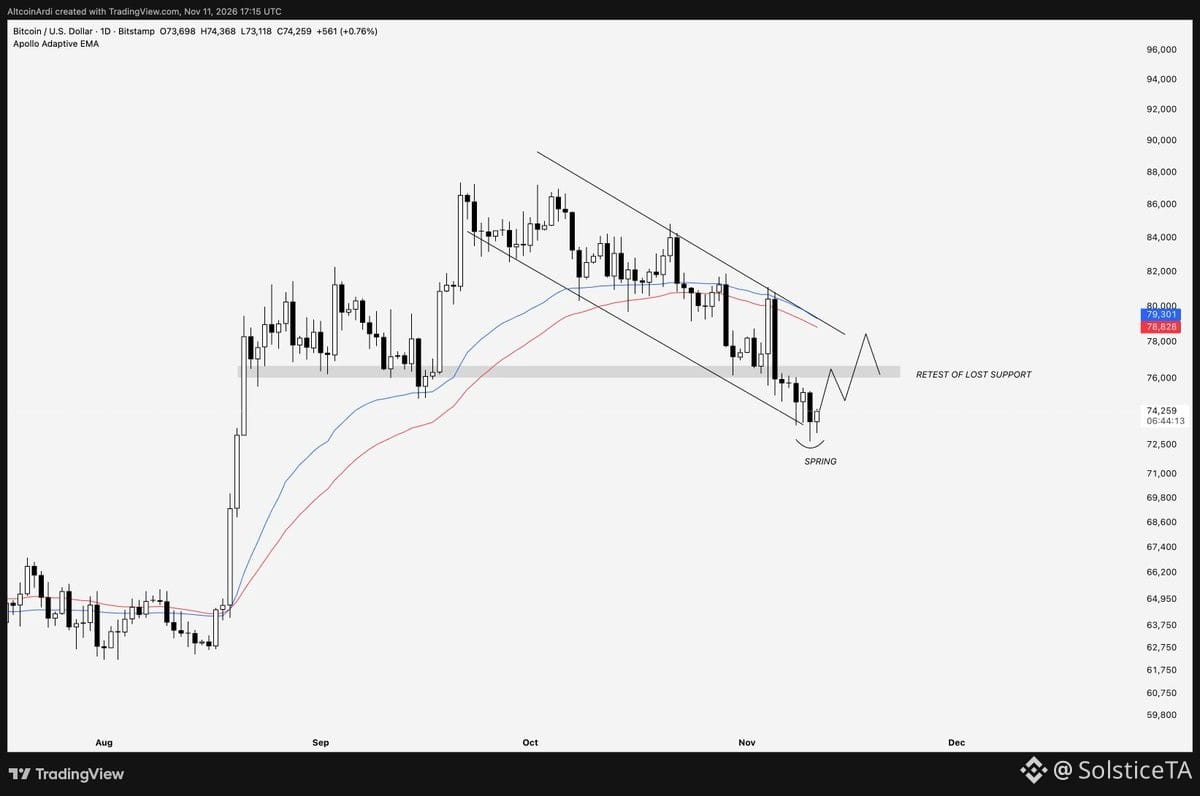
For this correction to end, $BTC must start printing higher lows and reclaim $76.5K — the range support we lost. If we reclaim and hold above that level, we'd have a deviated spring setup in play, with a break of the descending channel as the next step toward a full trend shift.
But as long as we stay below range support, we're just building more acceptance under lost structure. That leaves us exposed to deeper liquidity hunts until we finally find a base that holds.
For this correction to end, $BTC must start printing higher lows and reclaim $76.5K — the range support we lost. If we reclaim and hold above that level, we'd have a deviated spring setup in play, with a break of the descending channel as the next step toward a full trend shift.
But as long as we stay below range support, we're just building more acceptance under lost structure. That leaves us exposed to deeper liquidity hunts until we finally find a base that holds.
But as long as we stay below range support, we're just building more acceptance under lost structure. That leaves us exposed to deeper liquidity hunts until we finally find a base that holds.
323
·
--
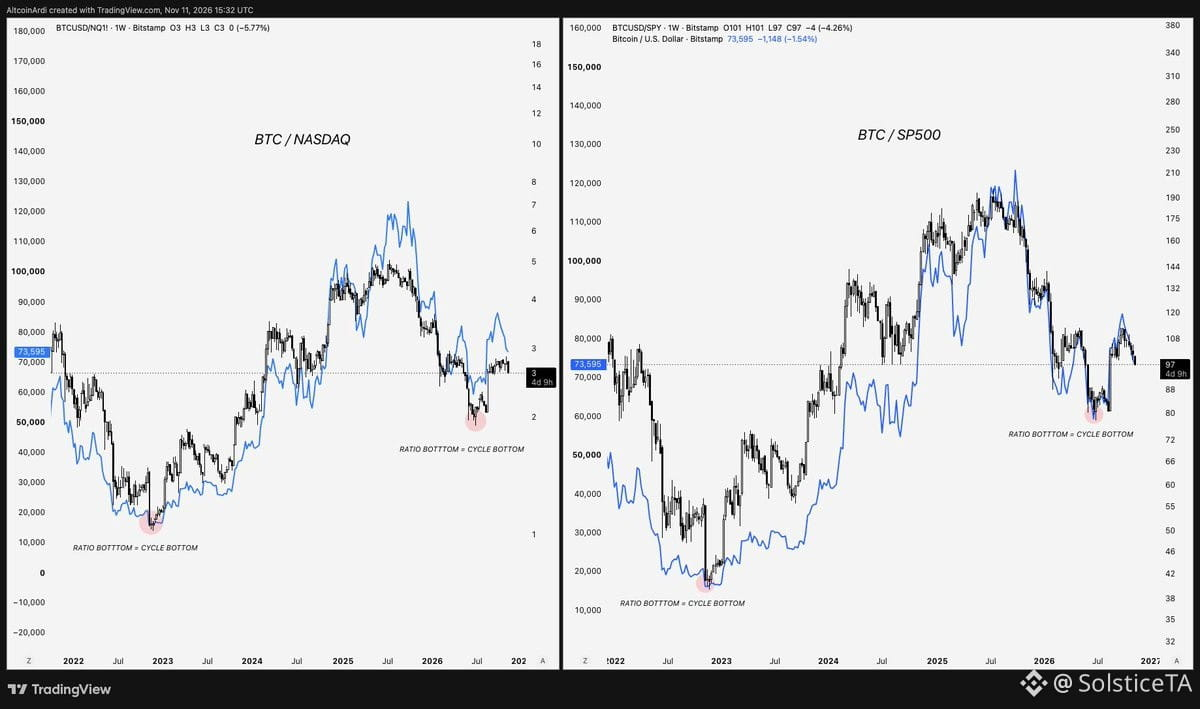
Q4 is shaping up as the window where $BTC likely prints its higher low for this multi-year expansion cycle. Yes, Q4 during bear years is historically a weak spot for Bitcoin relative to equities — stocks underperform and drag $BTC with them. But here's the pattern that matters: in both prior cycles, once Bitcoin bottomed against the Nasdaq and S&P 500, it never made a lower dollar low afterward. Ever.
In each of those cycles, $BTC put in its cycle ratio-low against indexes by mid-December at the latest. This time, we already saw that index-ratio low and divergence mid-year, when Bitcoin formed its macro bottom.
Sure, "$BTC always bottoms in Q4 of midterms." And it has also always marked its cycle bottom after bottoming against the index ratios. So if equities are what's dragging Bitcoin down, which scenario makes more sense: a higher low within the recovery, or another full cycle capitulation?
For this time to be the anomaly, $BTC would need to substantially underperform both indexes after already forming a major low — and then print fresh capitulation lows against indexes in the span of 30–45 days with practically no relief rally. Keep betting on that if you want. I'm watching for the higher low.
Q4 is shaping up as the window where $BTC likely prints its higher low for this multi-year expansion cycle. Yes, Q4 during bear years is historically a weak spot for Bitcoin relative to equities — stocks underperform and drag $BTC with them. But here's the pattern that matters: in both prior cycles, once Bitcoin bottomed against the Nasdaq and S&P 500, it never made a lower dollar low afterward. Ever.
In each of those cycles, $BTC put in its cycle ratio-low against indexes by mid-December at the latest. This time, we already saw that index-ratio low and divergence mid-year, when Bitcoin formed its macro bottom.
Sure, "$BTC always bottoms in Q4 of midterms." And it has also always marked its cycle bottom after bottoming against the index ratios. So if equities are what's dragging Bitcoin down, which scenario makes more sense: a higher low within the recovery, or another full cycle capitulation?
For this time to be the anomaly, $BTC would need to substantially underperform both indexes after already forming a major low — and then print fresh capitulation lows against indexes in the span of 30–45 days with practically no relief rally. Keep betting on that if you want. I'm watching for the higher low.
In each of those cycles, $BTC put in its cycle ratio-low against indexes by mid-December at the latest. This time, we already saw that index-ratio low and divergence mid-year, when Bitcoin formed its macro bottom.
Sure, "$BTC always bottoms in Q4 of midterms." And it has also always marked its cycle bottom after bottoming against the index ratios. So if equities are what's dragging Bitcoin down, which scenario makes more sense: a higher low within the recovery, or another full cycle capitulation?
For this time to be the anomaly, $BTC would need to substantially underperform both indexes after already forming a major low — and then print fresh capitulation lows against indexes in the span of 30–45 days with practically no relief rally. Keep betting on that if you want. I'm watching for the higher low.
317
·
--
Diving into cycle mechanics with the speakers ahead of the Investing Through the Cycles conference. Part 2 of the live preview session breaking down where we are in the current macro environment and how to position for what's next. If you're trying to time entries and exits based on multi-year frameworks rather than daily noise, this is the conversation that matters. Cycle theory isn't just hindsight — it's a roadmap if you know how to read the map.
Diving into cycle mechanics with the speakers ahead of the Investing Through the Cycles conference. Part 2 of the live preview session breaking down where we are in the current macro environment and how to position for what's next. If you're trying to time entries and exits based on multi-year frameworks rather than daily noise, this is the conversation that matters. Cycle theory isn't just hindsight — it's a roadmap if you know how to read the map.
155
·
--
Tighter monetary policy incoming — that's a liquidity squeeze, and historically $BTC dominance rises when risk-off conditions favor the biggest, most liquid asset in crypto. This isn't altseason territory; it's flight-to-safety within the space. Chart structure on BTC.D shows room to run if macro keeps tightening. Alts bleed, Bitcoin holds — classic cycle behavior when the Fed's hand is heavy. Watch for dominance to peak only when liquidity pivots back or we hit a true cycle bottom. Until then, BTC is king.
Tighter monetary policy incoming — that's a liquidity squeeze, and historically $BTC dominance rises when risk-off conditions favor the biggest, most liquid asset in crypto. This isn't altseason territory; it's flight-to-safety within the space. Chart structure on BTC.D shows room to run if macro keeps tightening. Alts bleed, Bitcoin holds — classic cycle behavior when the Fed's hand is heavy. Watch for dominance to peak only when liquidity pivots back or we hit a true cycle bottom. Until then, BTC is king.
100
·
--
Partly True
CPI drops tomorrow but we're flying blind on the year-over-year number. Last January the government was shut down so no data got released — nothing to compare against. We'll get the monthly print but the annual change that everyone watches? Missing. Annoying timing but it is what it is. Focus shifts to the monthly figure and how markets read through it without that yearly anchor.
CPI drops tomorrow but we're flying blind on the year-over-year number. Last January the government was shut down so no data got released — nothing to compare against. We'll get the monthly print but the annual change that everyone watches? Missing. Annoying timing but it is what it is. Focus shifts to the monthly figure and how markets read through it without that yearly anchor.
763
Log in to explore more content
Join global crypto users on Binance Square
⚡️ Get latest and useful information about crypto.
💬 Trusted by the world’s largest crypto exchange.
👍 Discover real insights from verified creators.
Email / Phone number
Trending Topics
USPPIMissMayEaseBTCPressure
31,844 views
629 Discussing
US PPI Rises 6.5% a Year in October, Slightly Below 6.6% Forecast
Binance News
·17 Likes
·15.9k views
BitcoinCoreDisclosesTorTrafficVulnerability
12,829 views
313 Discussing
WhatWillDriveCryptoandStocks’NextRebound?
137,030 views
1,524 Discussing