
SoiArian2
75 Posts

SoiArian2
Open Trade
Frequent Trader
2.8 Years
0 Following
236 Followers
233 Liked
Posts
Portfolio
All
Quotes
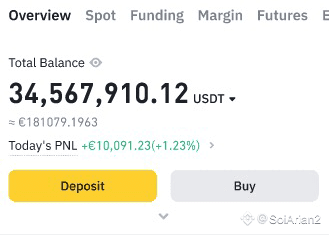
I don't know what to do, I've lost everything, money that took me years to save, now I don't even know how to get through the next month, I'm completely destroyed, any advice? I feel like I really don't want to live anymore.
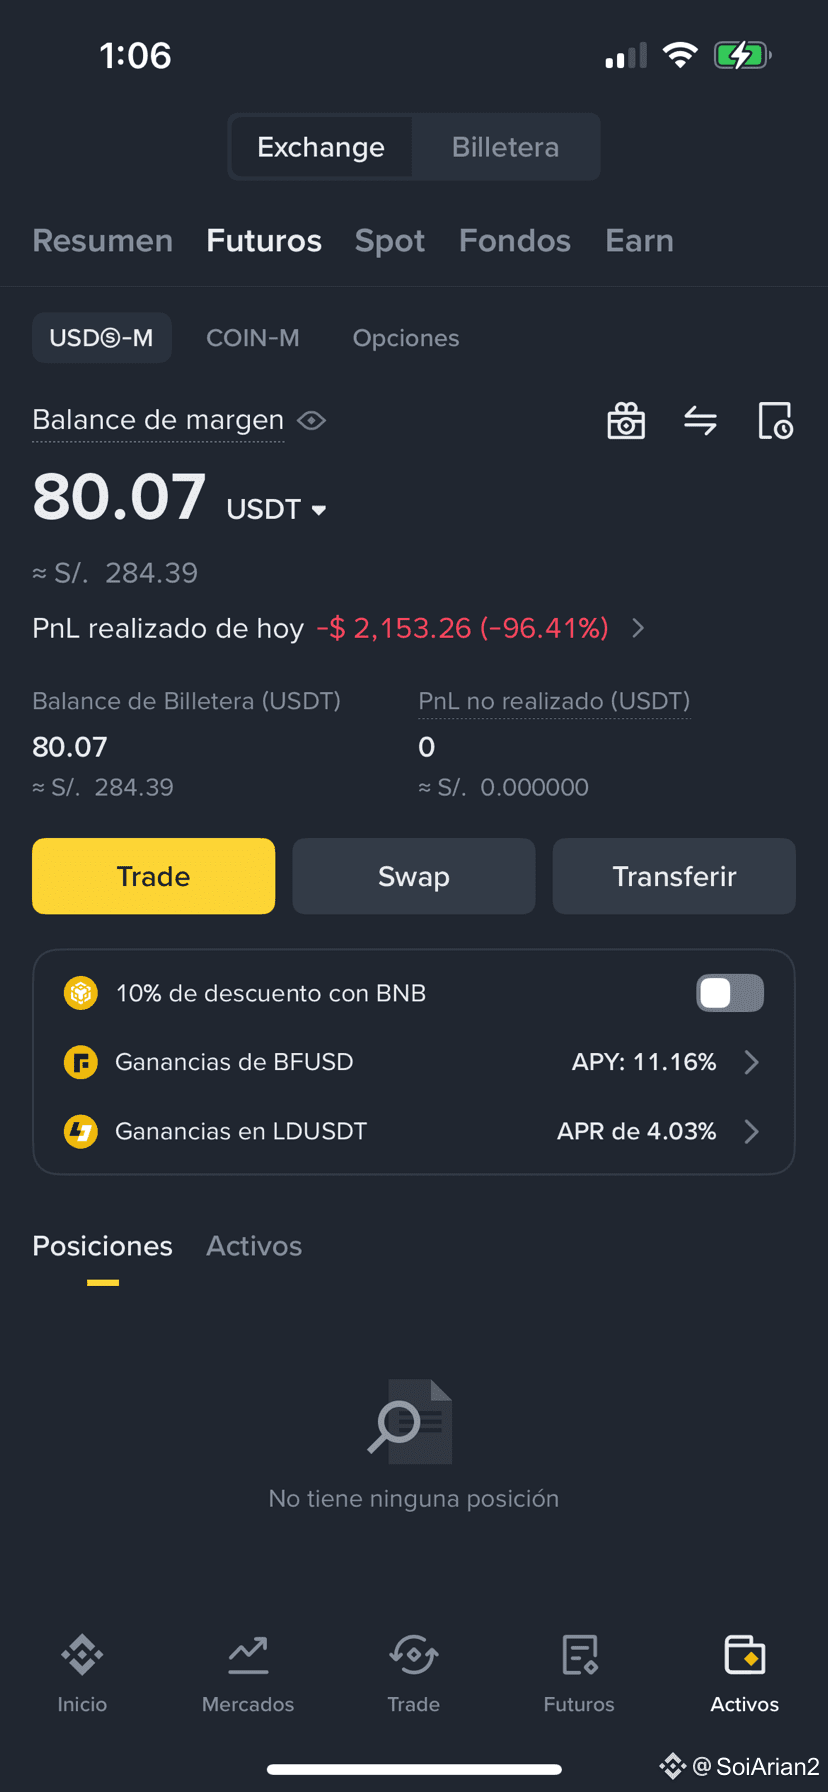
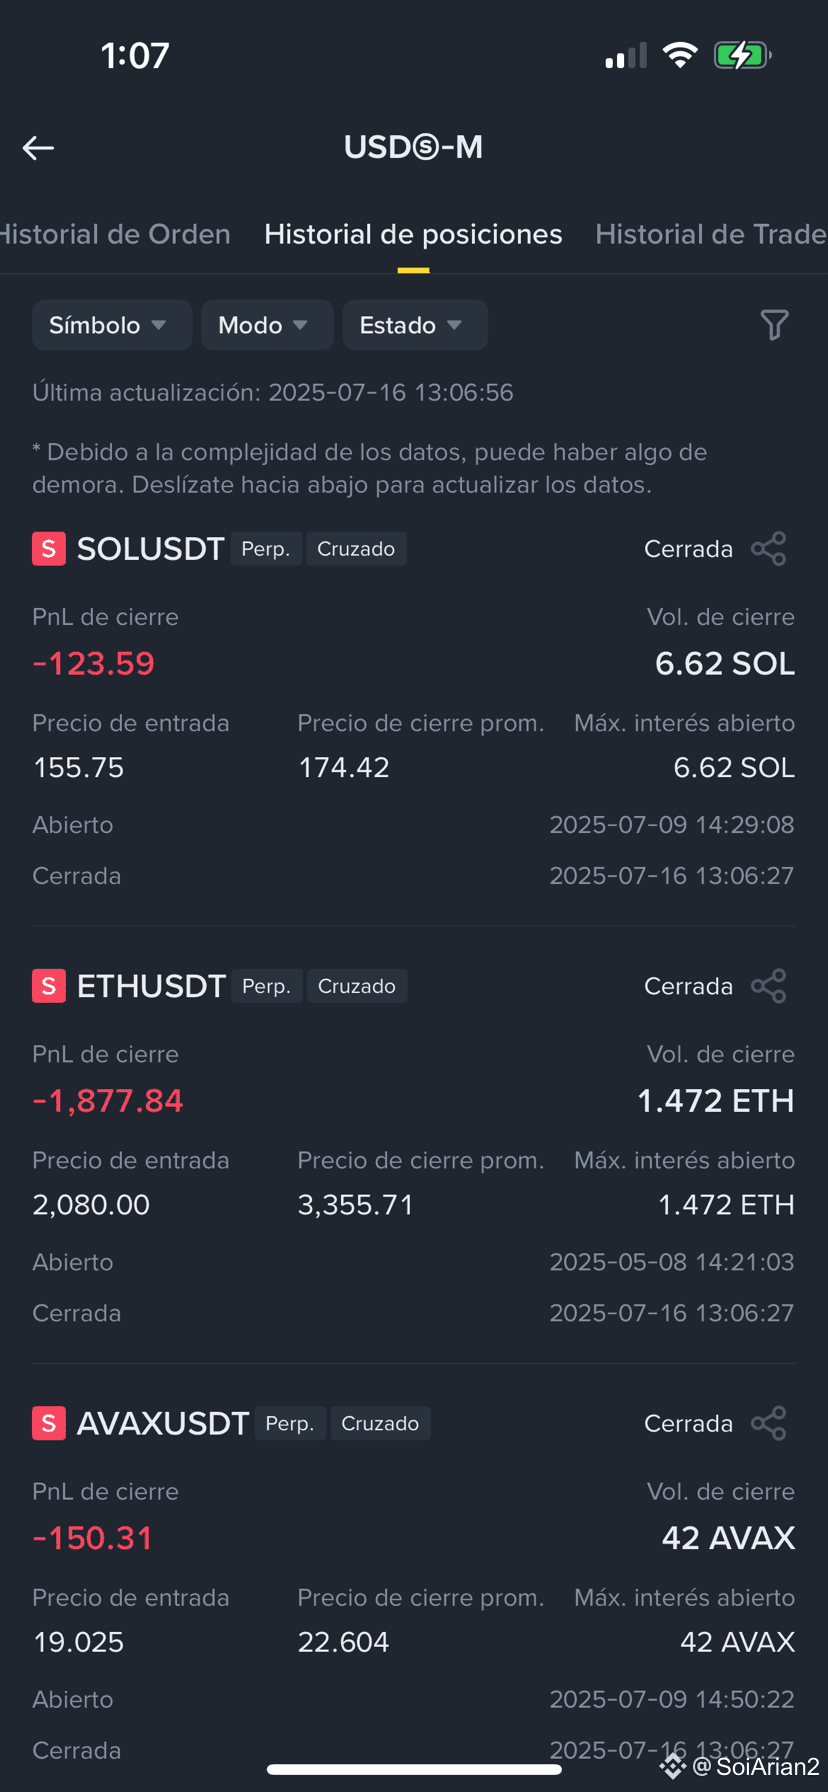
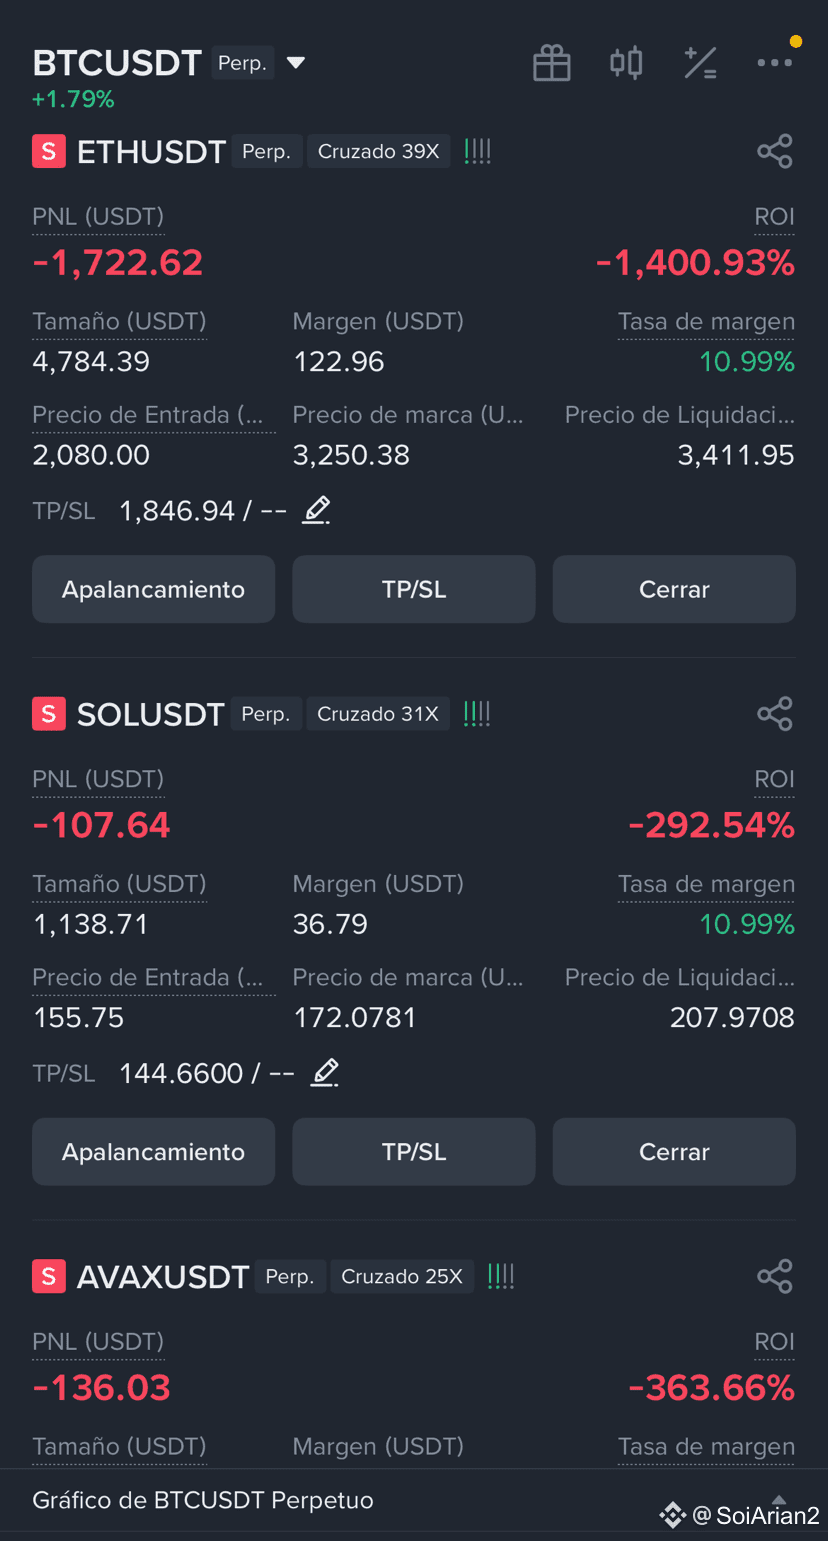
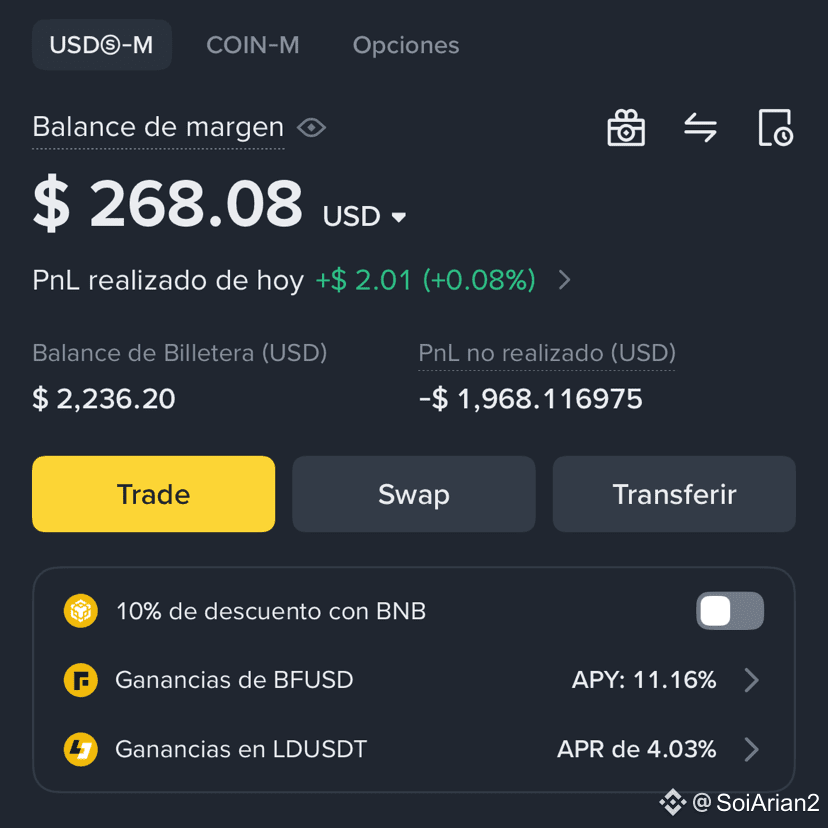
I don't know what to do😭, please recommend what to do. I can't lose the money😭, if someone wants to talk to me privately, you can message me on my IG arian_arn11 Good luck to all of you and be very careful!
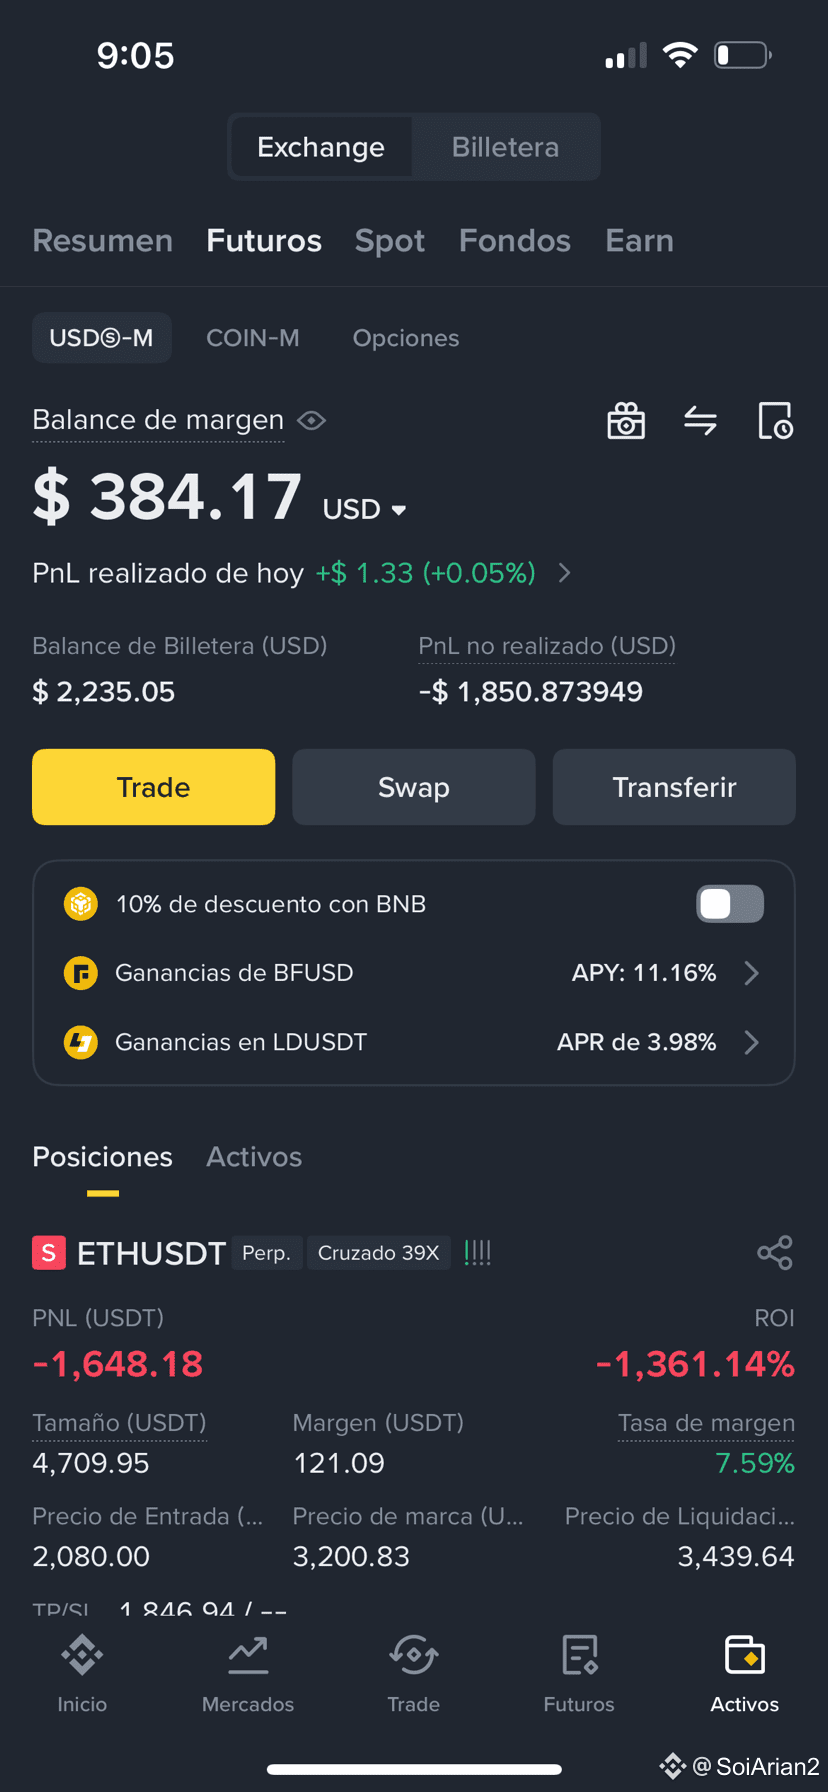
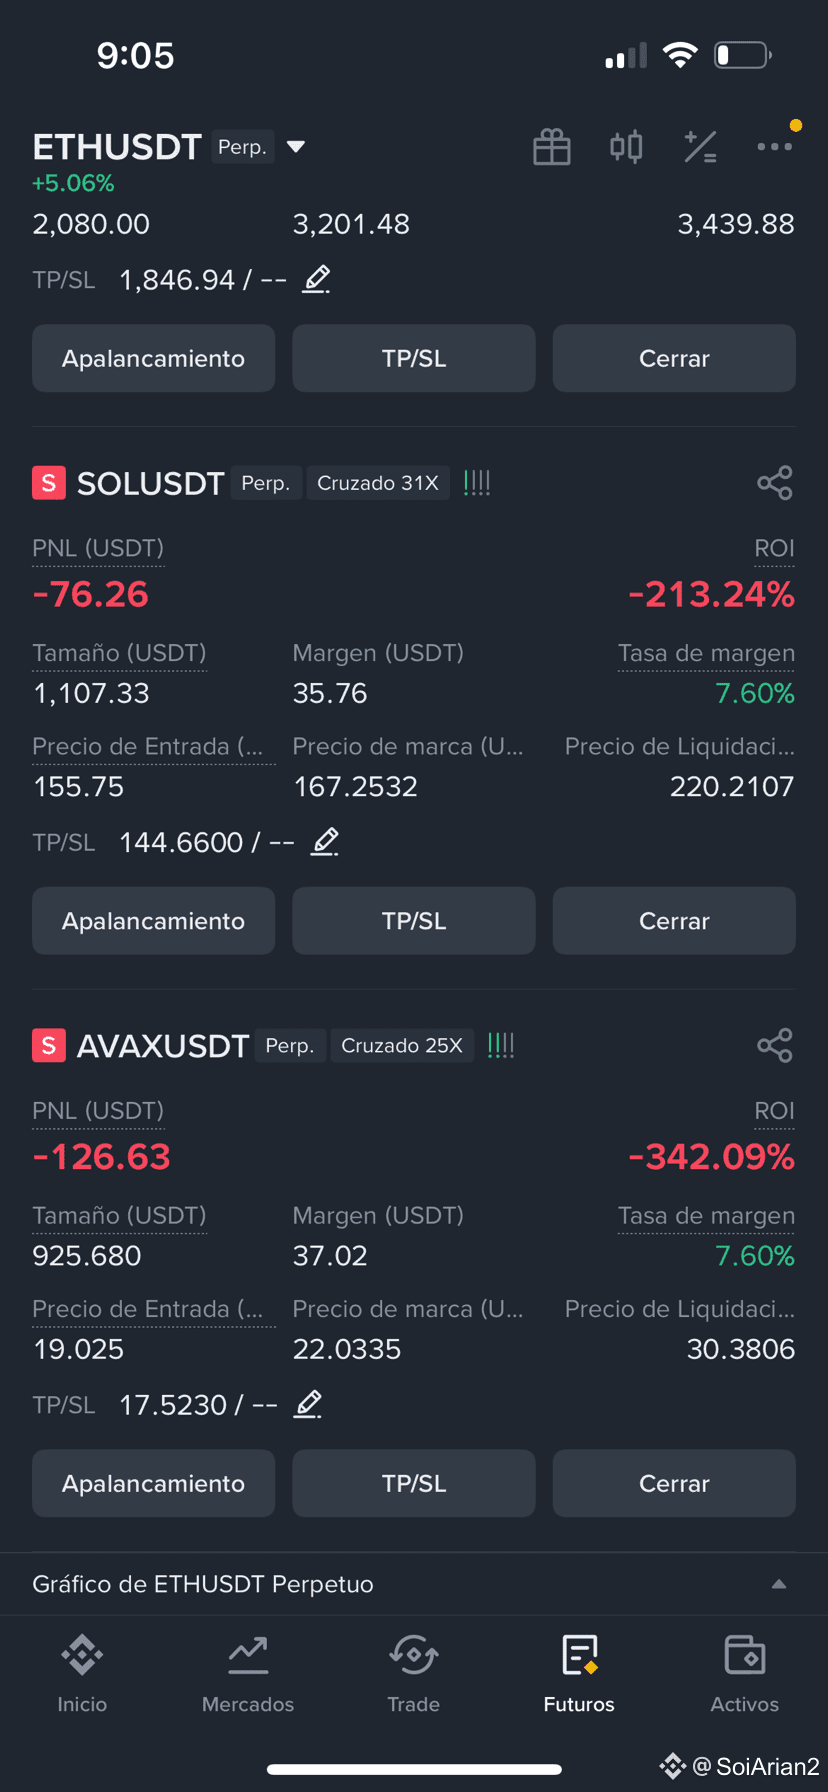
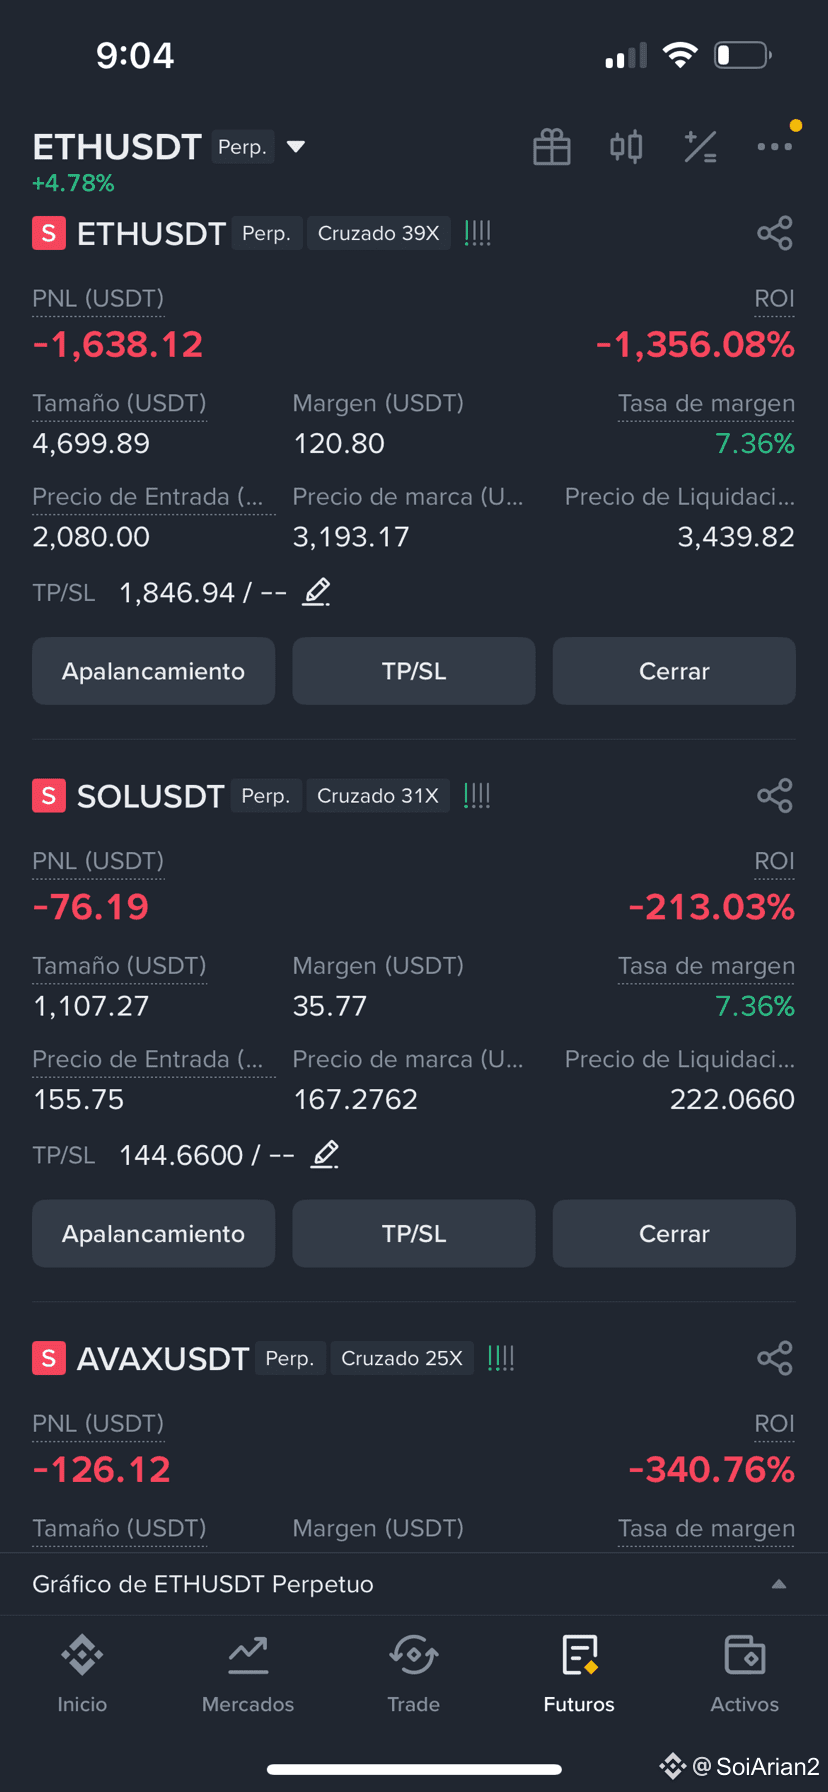
God bless you brother, many will say things but don't pay attention to them because they don't even have that money, it's easy to talk as a spectator, I wish you the best and I assure you that everything will get better

Hedayat_Afghan2
·
--
Bye Binance 😭😭😭
I lll hate you forever 😭
I lll hate you forever 😭
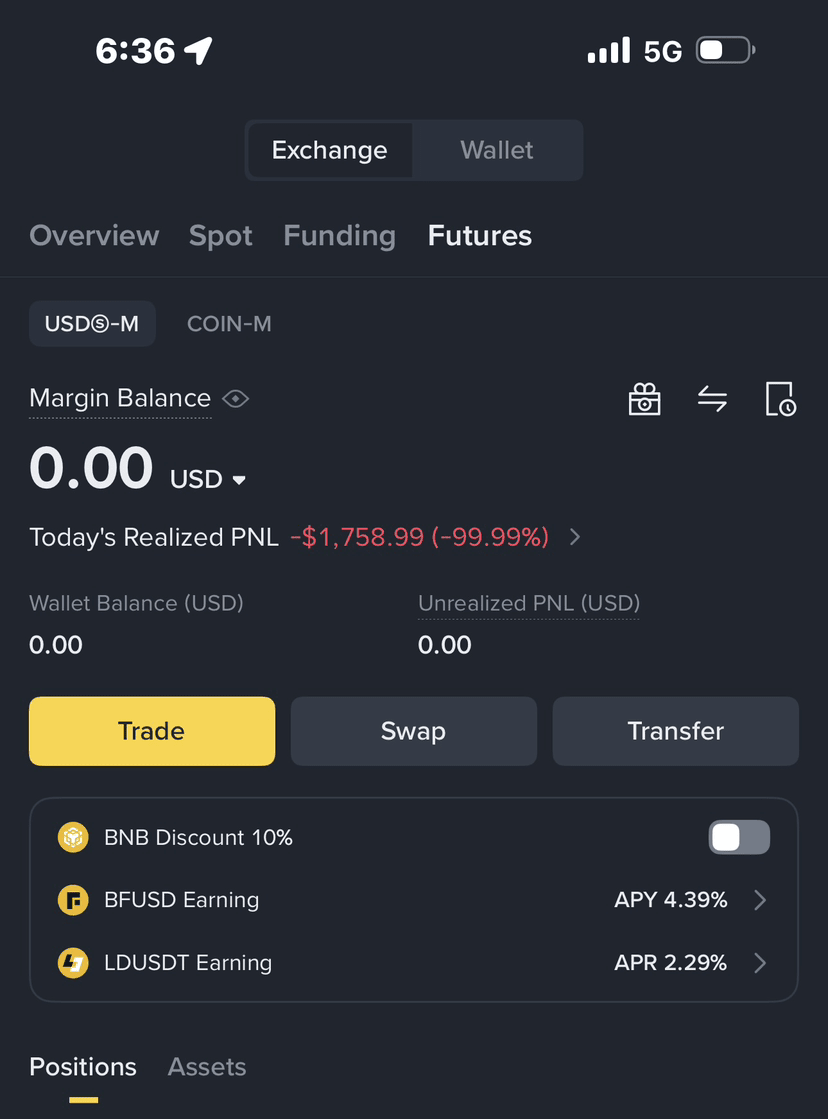
Be very careful, I was also like this and overnight I lost everything. I wish you the best and God bless you, always with an investment plan! Good luck!

rabie khawli
·
--
if you need help tell me

Set your stop loss at the entry price and wait until 2700, good luck and God bless you!
Quoted content has been removed
Put stop loss at entry price in case your position reverses

ZaLeXR
·
--
BullishGood morning/afternoon Team, We closed the trade on $XRP with some small profits and opened a new trade on $SOL , We believe in the BULL run, share your thoughts in the comments and I appreciate all your input!! 🤎
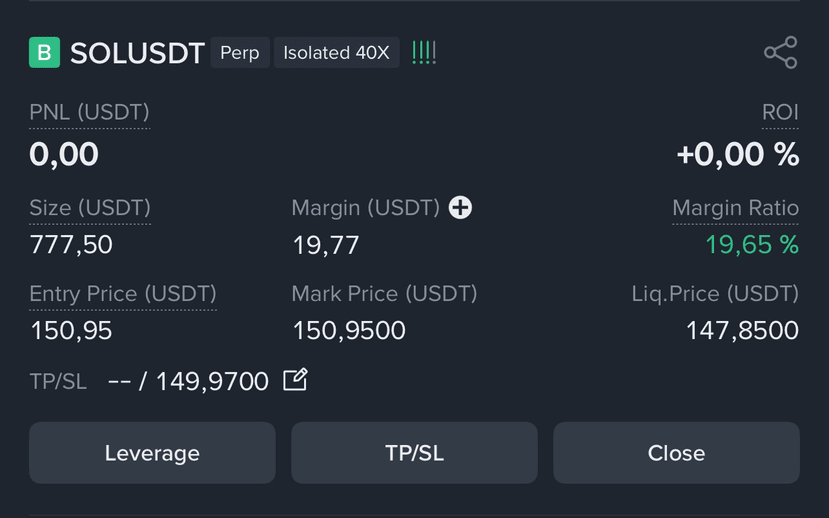
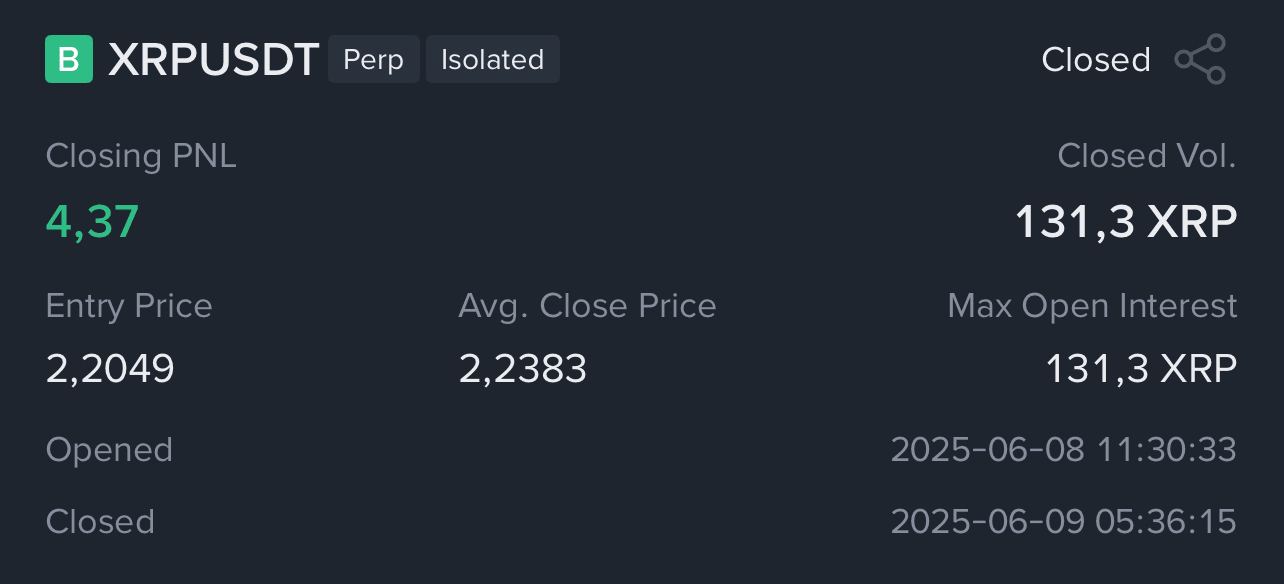
Set stop loss at entry price

Trading kitty
·
--
Bearishhold or close?? any suggestions🤔
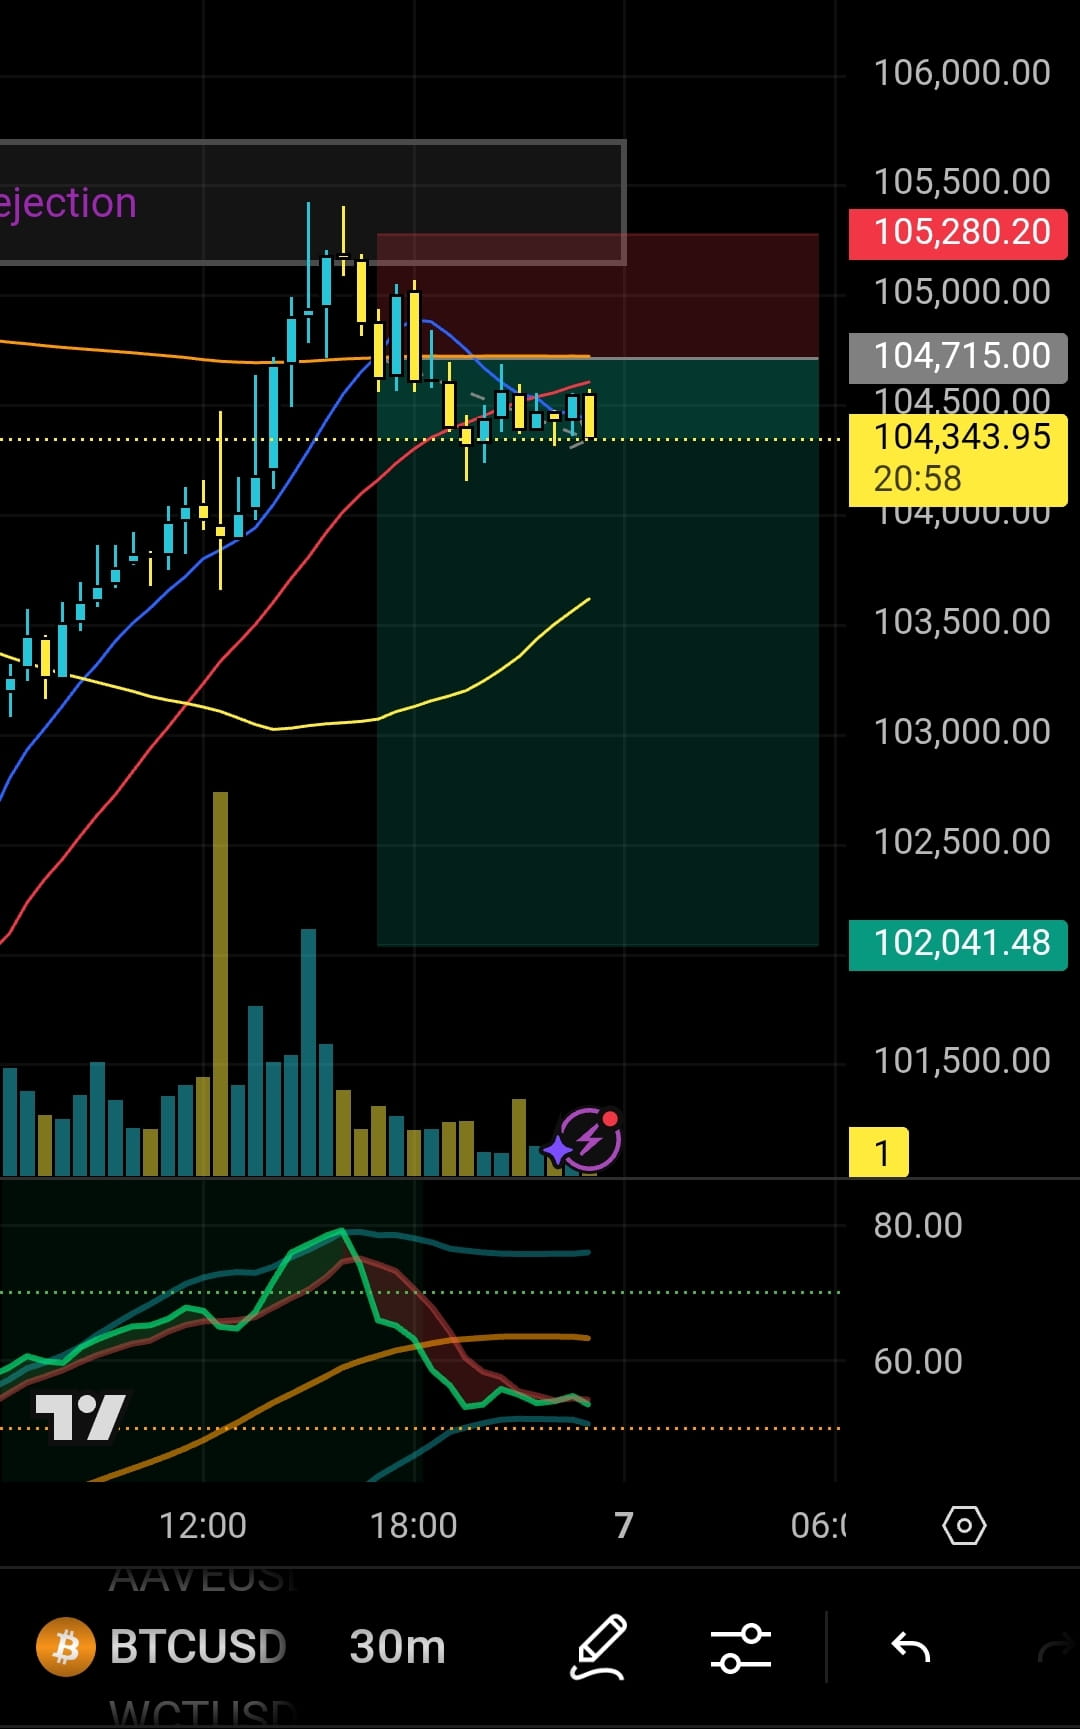
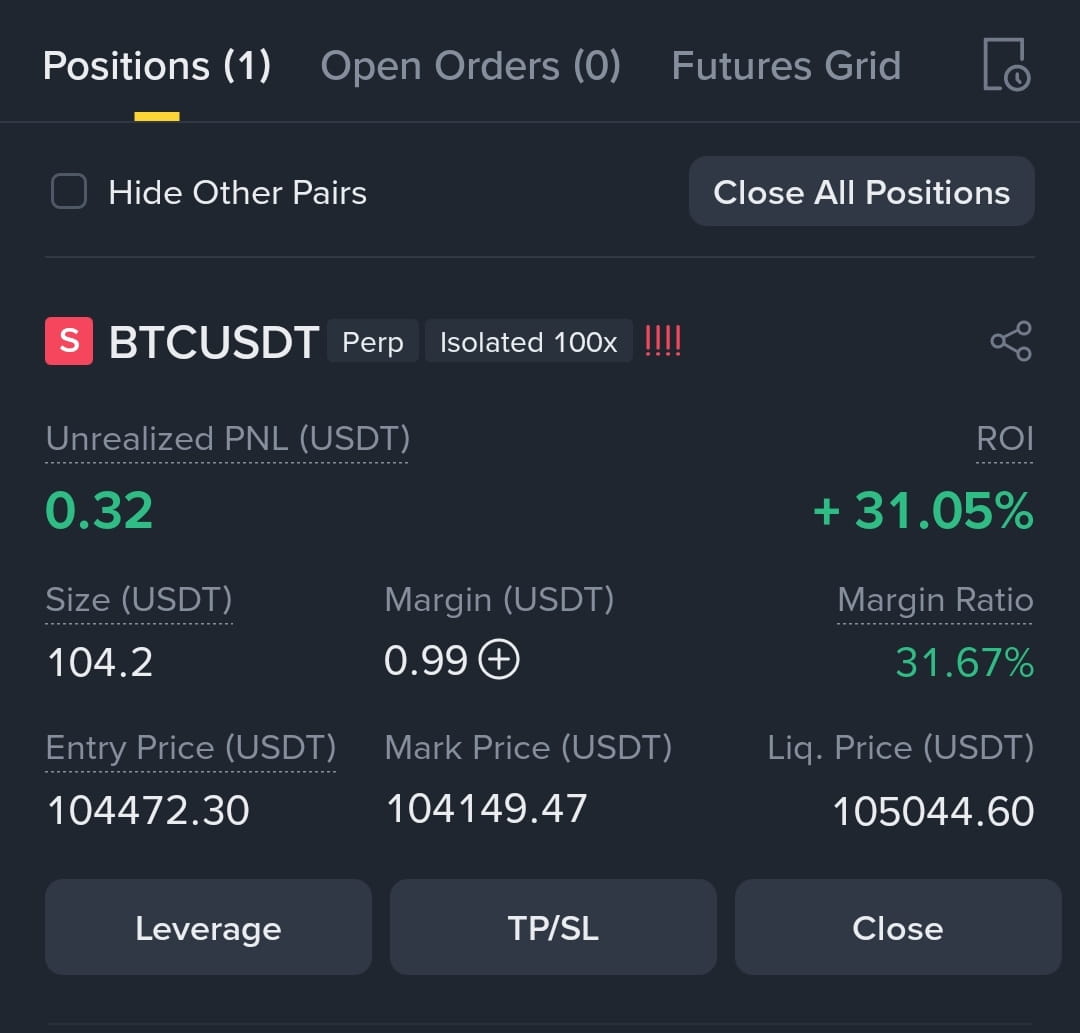
The photos are not yours lol, it's the same month lmao
Quoted content has been removed
Can you do it?
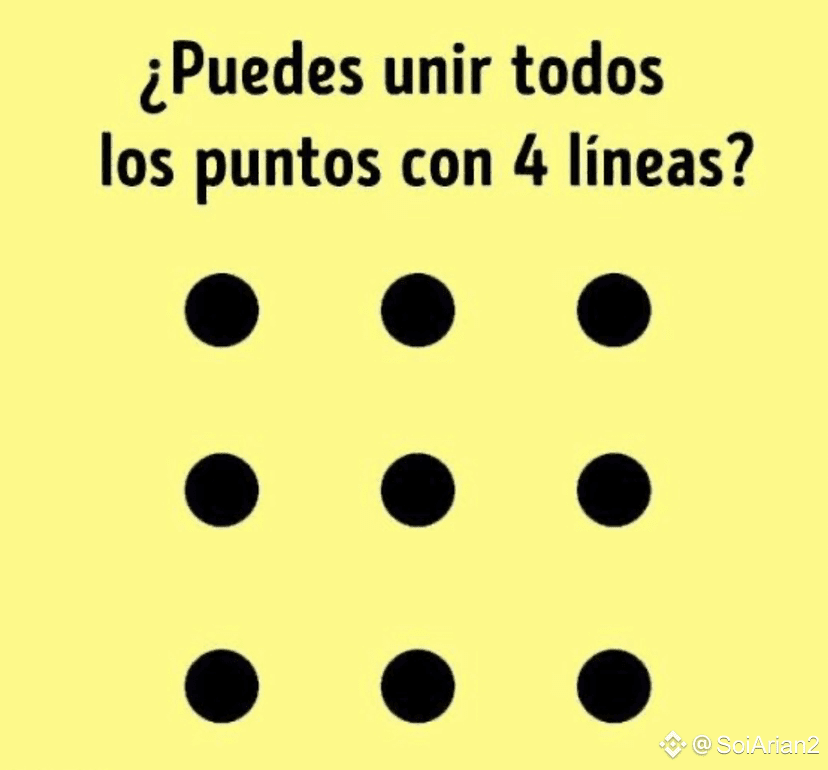
No

Joeuu
·
--
IS this analysis real???
---
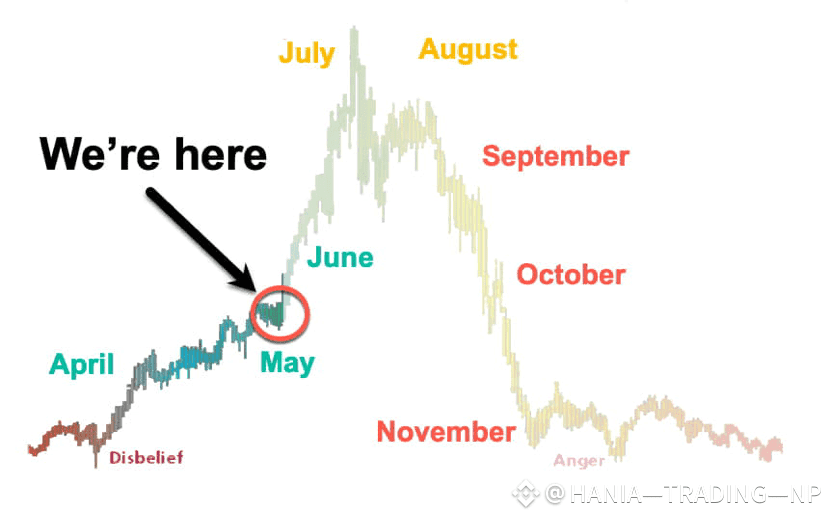
🧠 Are We at the Start of a Bull Run – or Just Another Market Trap?
A popular chart is once again making the rounds on social media, claiming that we're currently in the "Hope" phase of a classic market cycle, with a strong bullish breakout just around the corner. This chart, which labels each month from "Disbelief" to "Anger", aims to represent investor psychology throughout a typical market cycle.
But how real is this analysis?
📊 The Origin of the Chart
This chart is not new. In fact, it dates back to around 2017, during one of the most memorable crypto bull runs. It’s a modified version of the famous “Wall Street Cheat Sheet,” which maps out emotional stages of market participants like optimism, euphoria, denial, and panic.
It’s often recycled during uncertain or volatile market periods, usually as a way to frame hope or justify certain trading biases.
🧠 Why It Still Matters
Even though the chart is old, it reflects an important truth: markets are driven by human emotions, and patterns often repeat—not in exact form, but in behavior. Traders who understand these emotional phases may better control their reactions and make more rational decisions.
📅 What About 2025?
Right now, the crypto market is at a crossroads. While some indicators are showing strength, others warn of macroeconomic pressures and market overextensions.
Using this chart as a tool to reflect on sentiment is valid—but using it as a prediction tool is risky. It’s essential to combine psychological insights with real-time data, technical analysis, and macro understanding.
✅ Key Takeaways:
This chart is from 2017 and does not reflect current market data.
It is still useful to understand the emotional patterns behind price movements.
Don’t base trading decisions solely on sentiment memes—use them as a supplement, not a strategy.
---
🧠 Are We at the Start of a Bull Run – or Just Another Market Trap?
A popular chart is once again making the rounds on social media, claiming that we're currently in the "Hope" phase of a classic market cycle, with a strong bullish breakout just around the corner. This chart, which labels each month from "Disbelief" to "Anger", aims to represent investor psychology throughout a typical market cycle.
But how real is this analysis?
📊 The Origin of the Chart
This chart is not new. In fact, it dates back to around 2017, during one of the most memorable crypto bull runs. It’s a modified version of the famous “Wall Street Cheat Sheet,” which maps out emotional stages of market participants like optimism, euphoria, denial, and panic.
It’s often recycled during uncertain or volatile market periods, usually as a way to frame hope or justify certain trading biases.
🧠 Why It Still Matters
Even though the chart is old, it reflects an important truth: markets are driven by human emotions, and patterns often repeat—not in exact form, but in behavior. Traders who understand these emotional phases may better control their reactions and make more rational decisions.
📅 What About 2025?
Right now, the crypto market is at a crossroads. While some indicators are showing strength, others warn of macroeconomic pressures and market overextensions.
Using this chart as a tool to reflect on sentiment is valid—but using it as a prediction tool is risky. It’s essential to combine psychological insights with real-time data, technical analysis, and macro understanding.
✅ Key Takeaways:
This chart is from 2017 and does not reflect current market data.
It is still useful to understand the emotional patterns behind price movements.
Don’t base trading decisions solely on sentiment memes—use them as a supplement, not a strategy.
Please let me know when you open an operation, so I can do the opposite❤️

Ornill Sofnill
·
--
Bearishif i open the long position binence like he opened the long so down the market and liqded her..😭😭😭
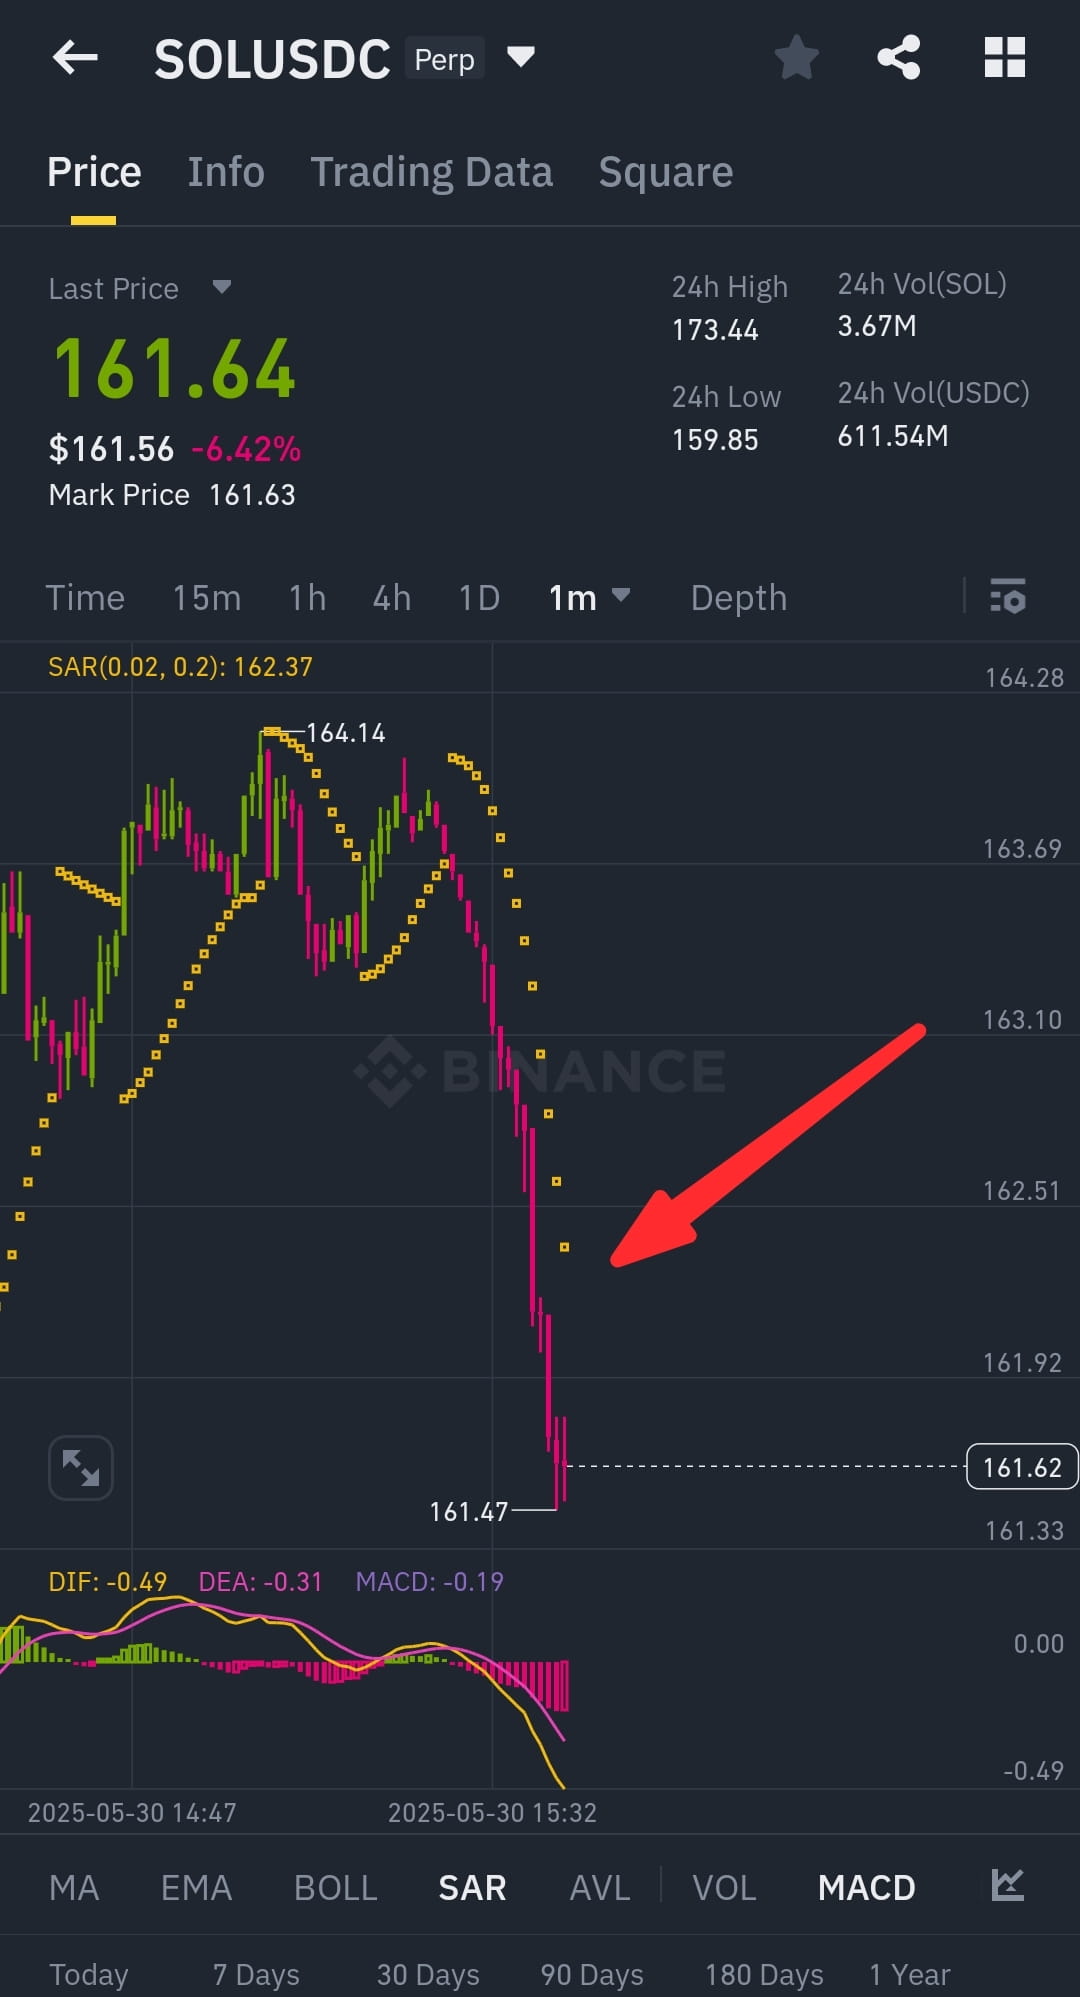
Close all operations and take 2 days off, you will still be in profit, if you maintain it, you are taking a lot of risks

sLy2611
·
--
BullishBleeding, but I will survive, ready to deploy more capital. Only $SUI trade still in green, the other 3 is in red
#MyTradeJournal
#MyTradeJournal
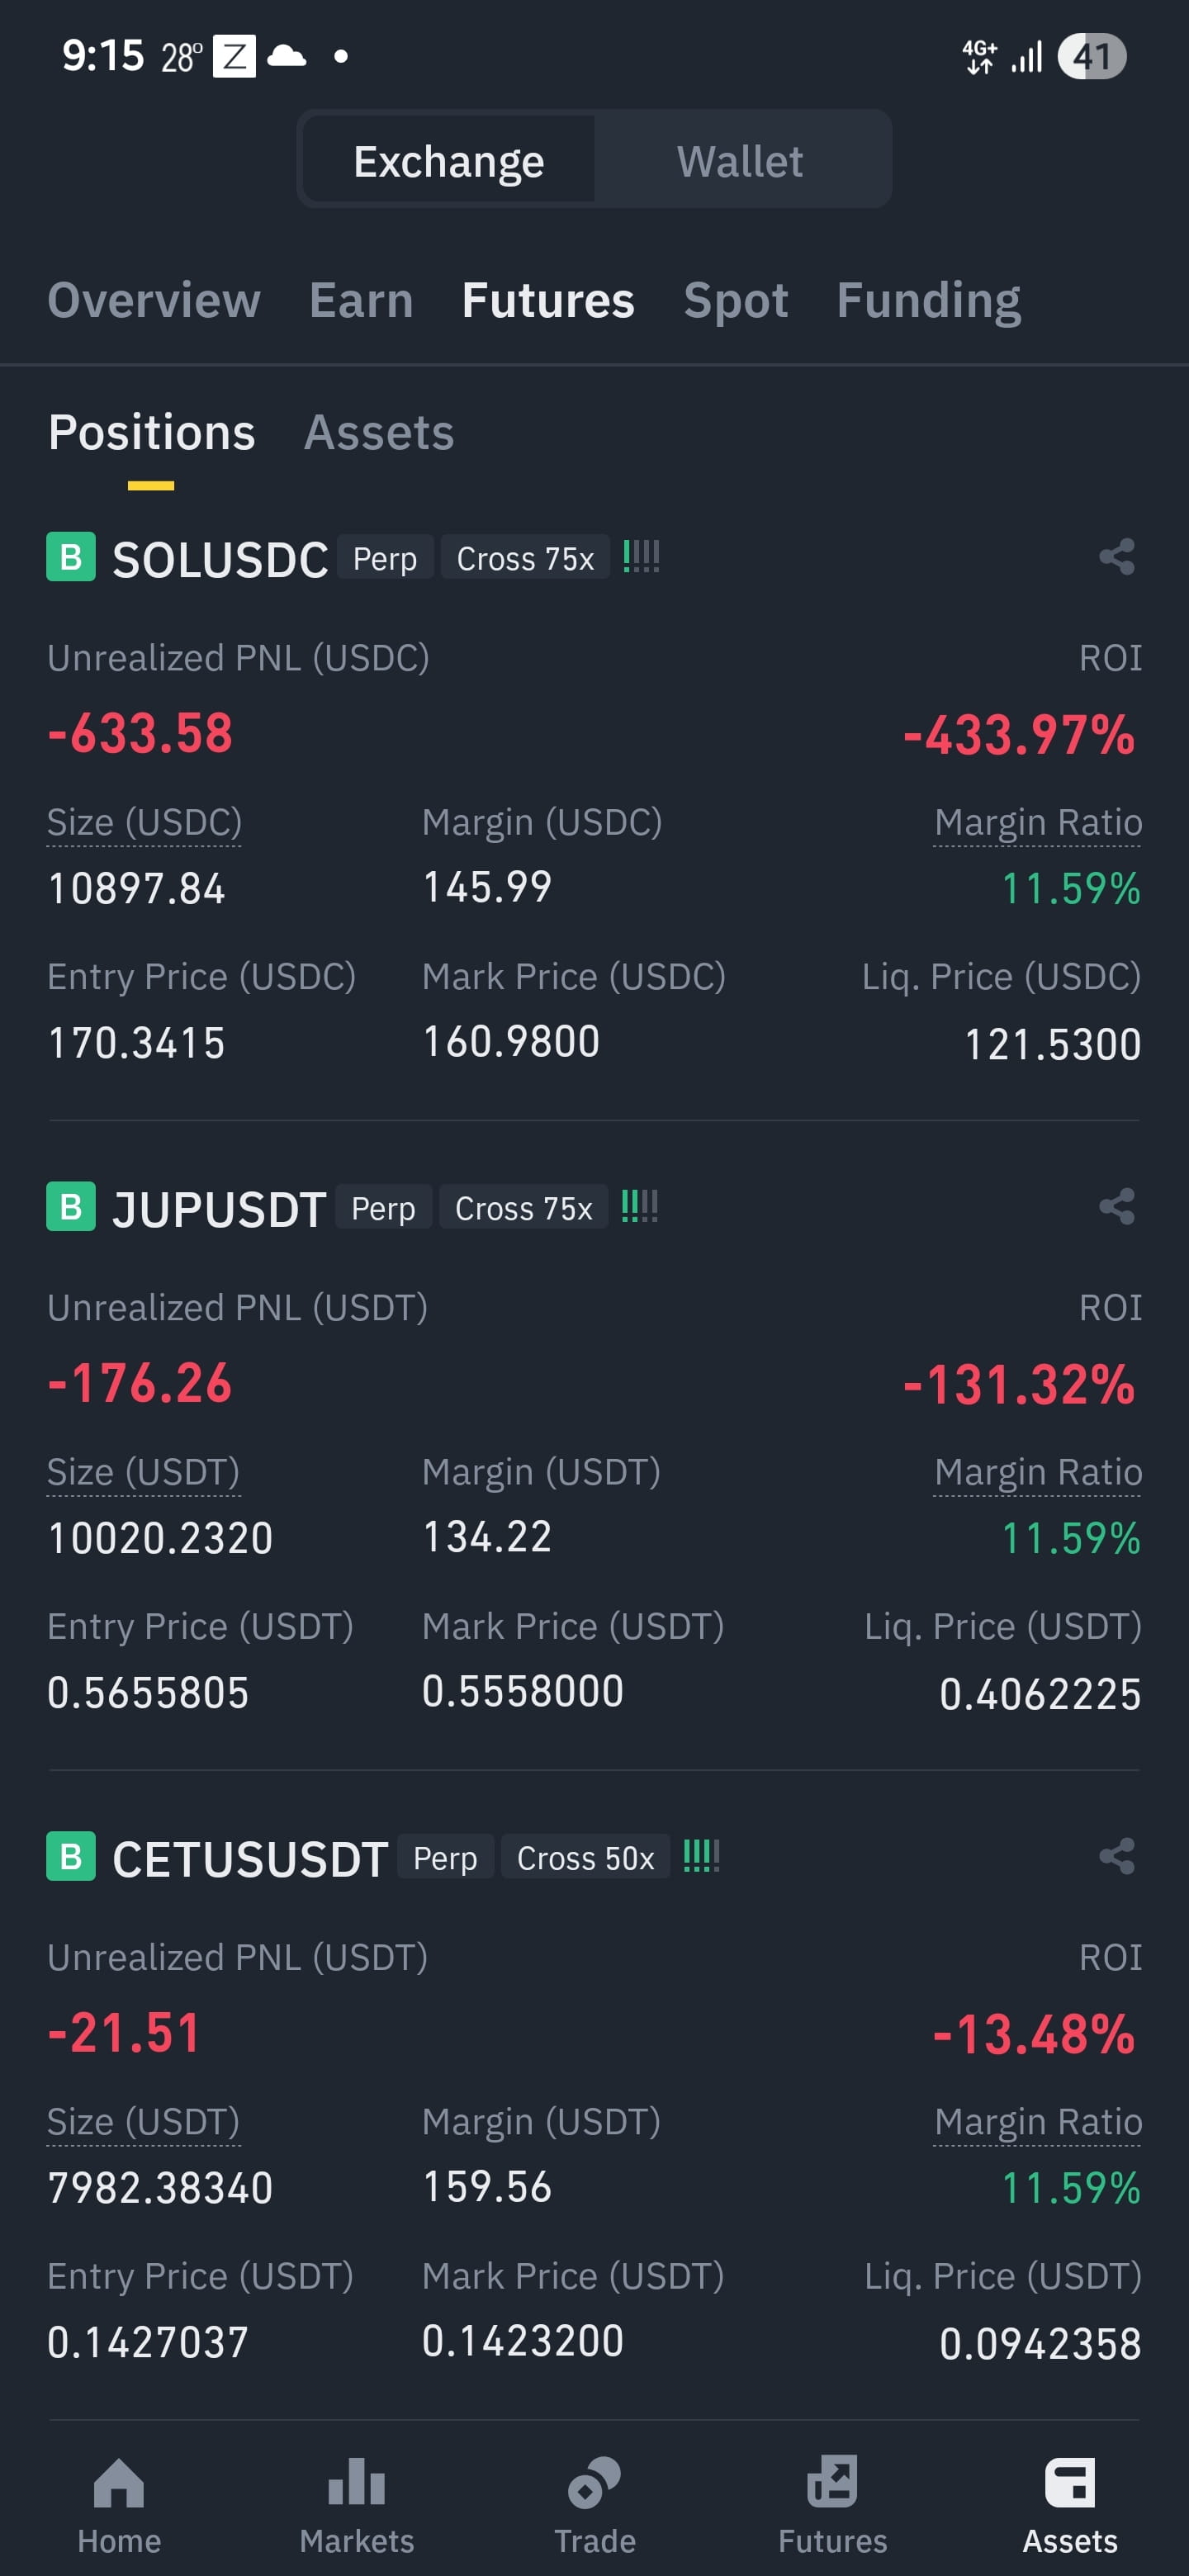
Hold on, your liquidation price is impossible to reach for now, you will be in profit in a maximum of 2 days.

Mimiija
·
--
HOLD .!?
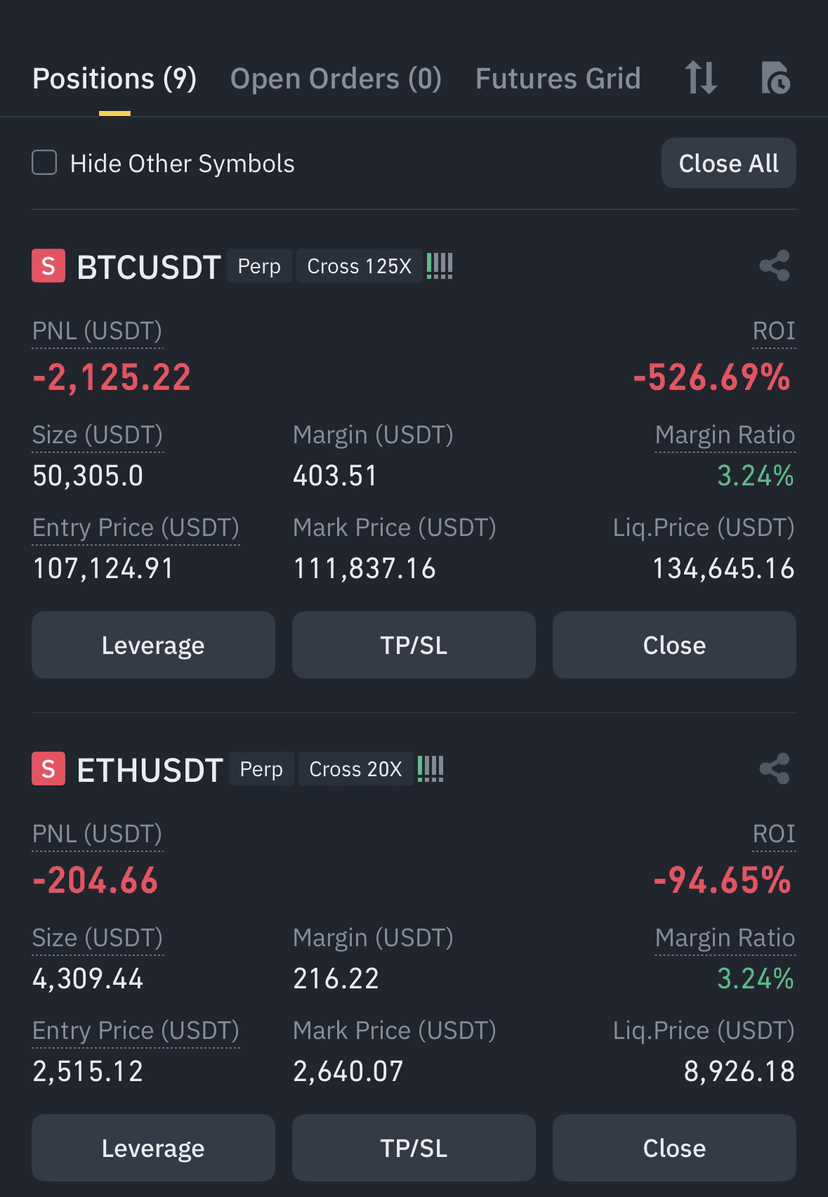
Maintain, BTC is not going to reach your liquidation price, it's impossible for now

Small intratrader
·
--
Hold or close 💀💀??
$BTC
$BTC
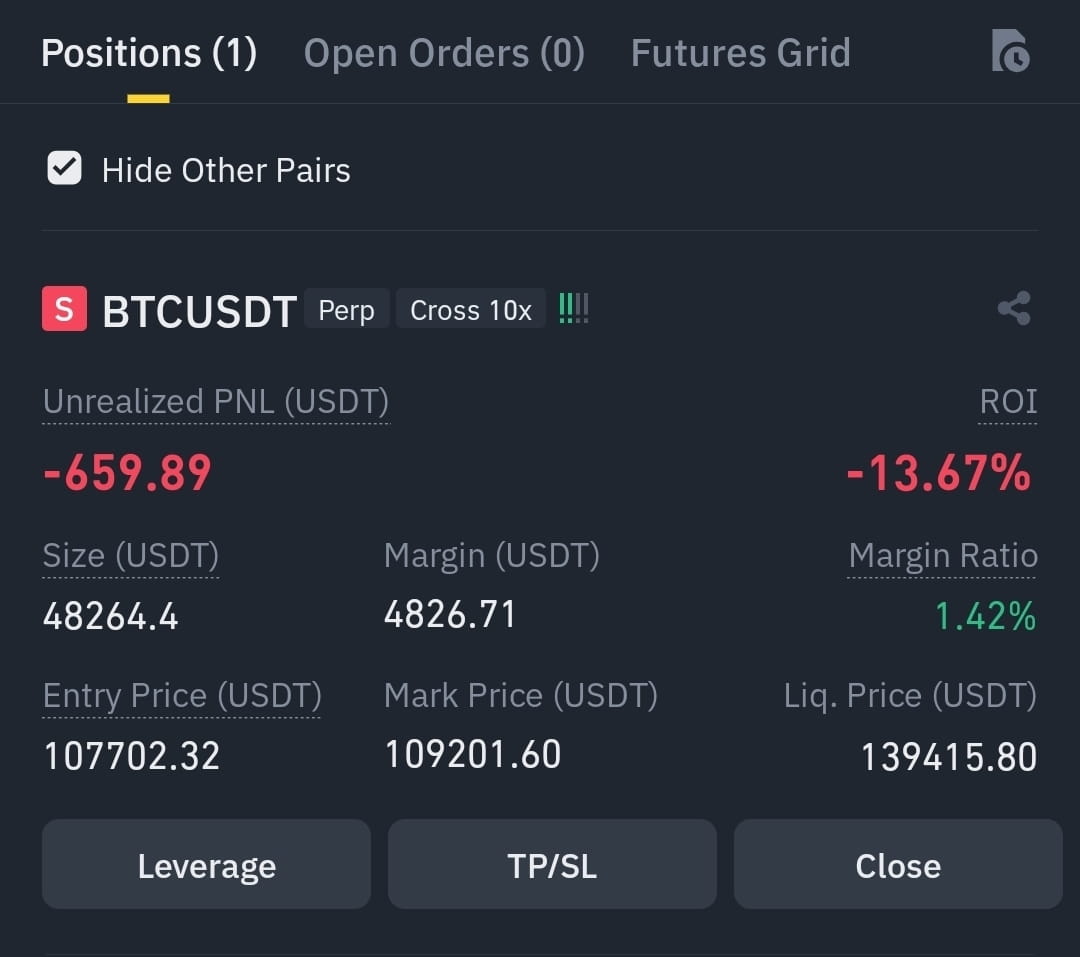
Put stop loss at 104k and hold it

Signal Forgee
·
--
please help, close or waitt? i am new😓😓😓😓
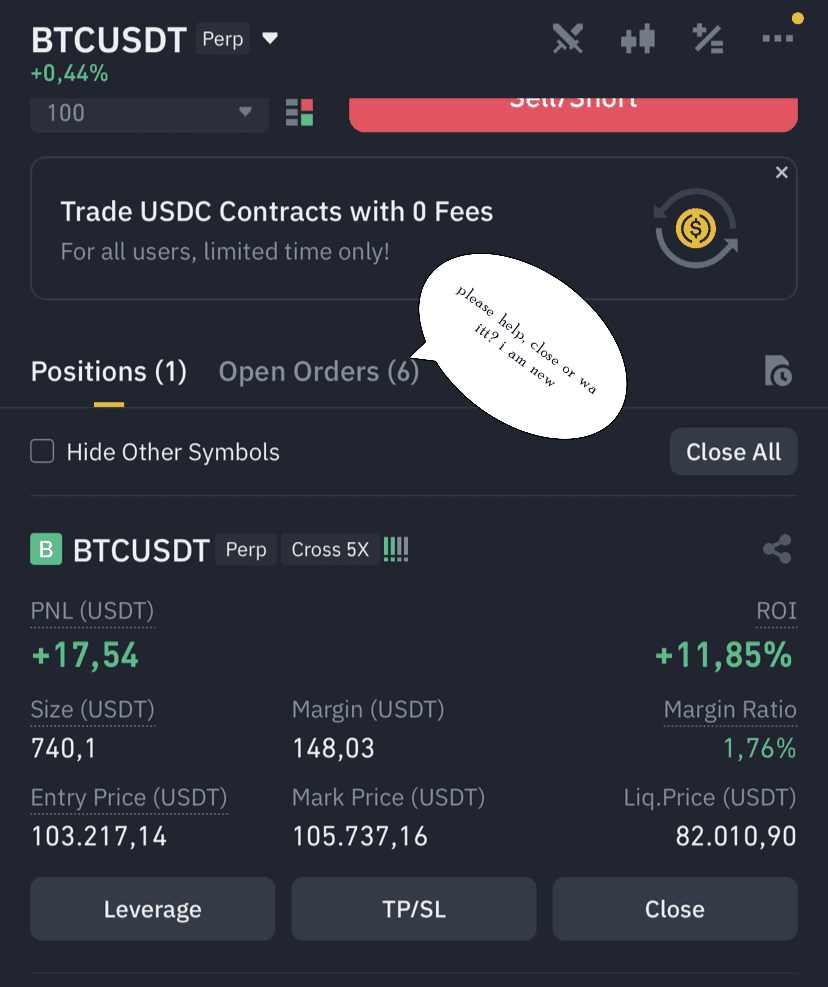
I am very sorry for your loss, brother. But believe me, you will recover from this. If you did it once, you will do it again. God bless you, brother.
Quoted content has been removed
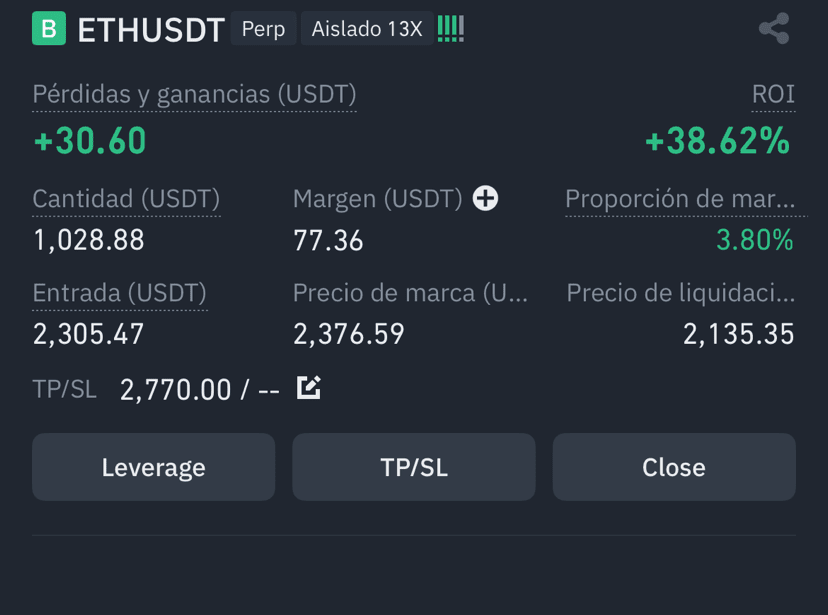
Put the stop loss at break even and if you want, wait until 2500

OceanVip
·
--
Good day, is it better to close or wait a little longer?
#ETH
#bitcoin
#ETH
#bitcoin
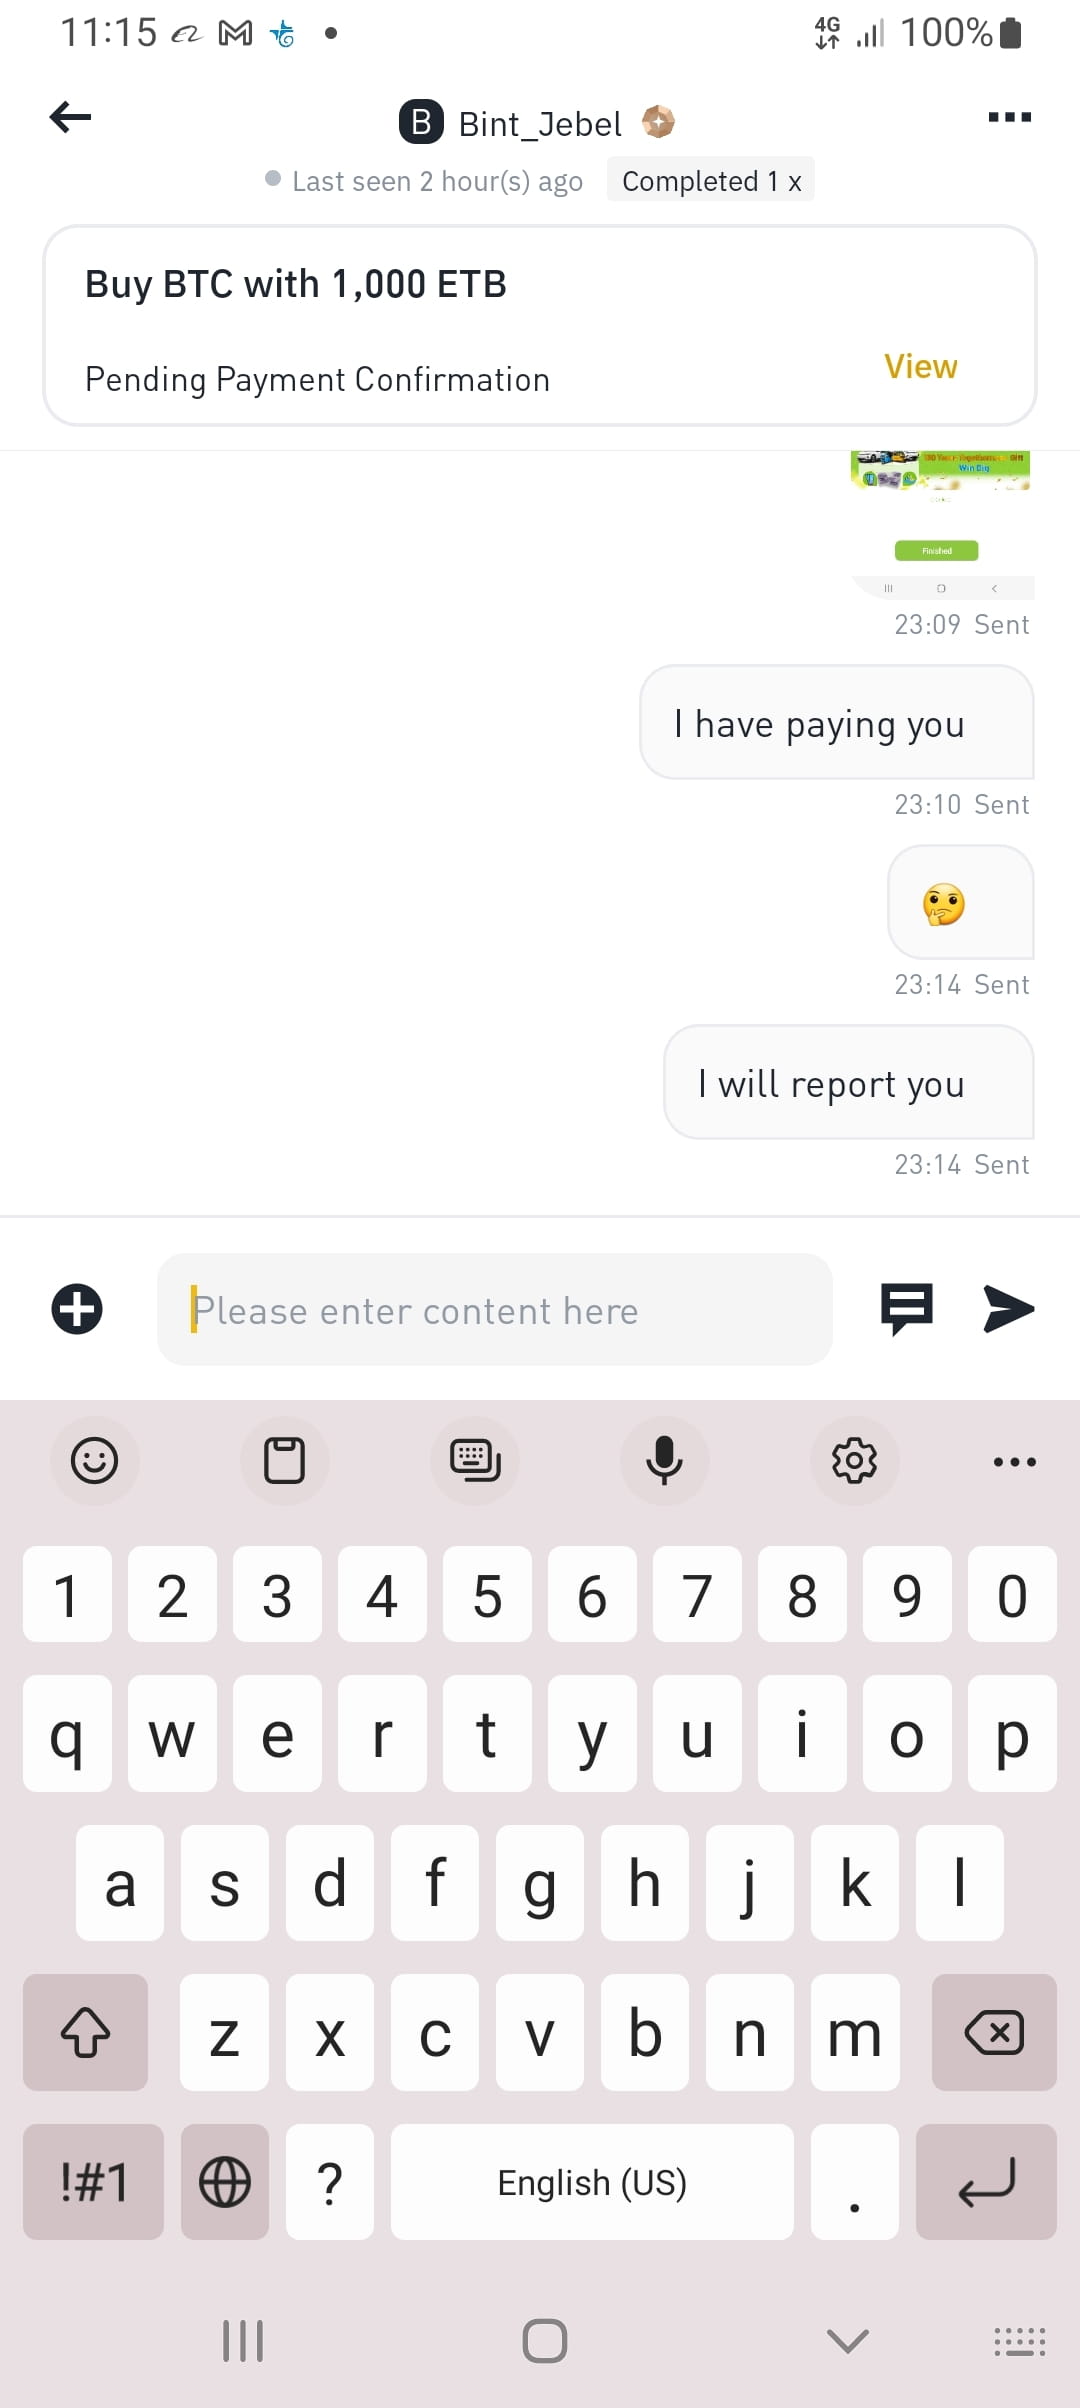
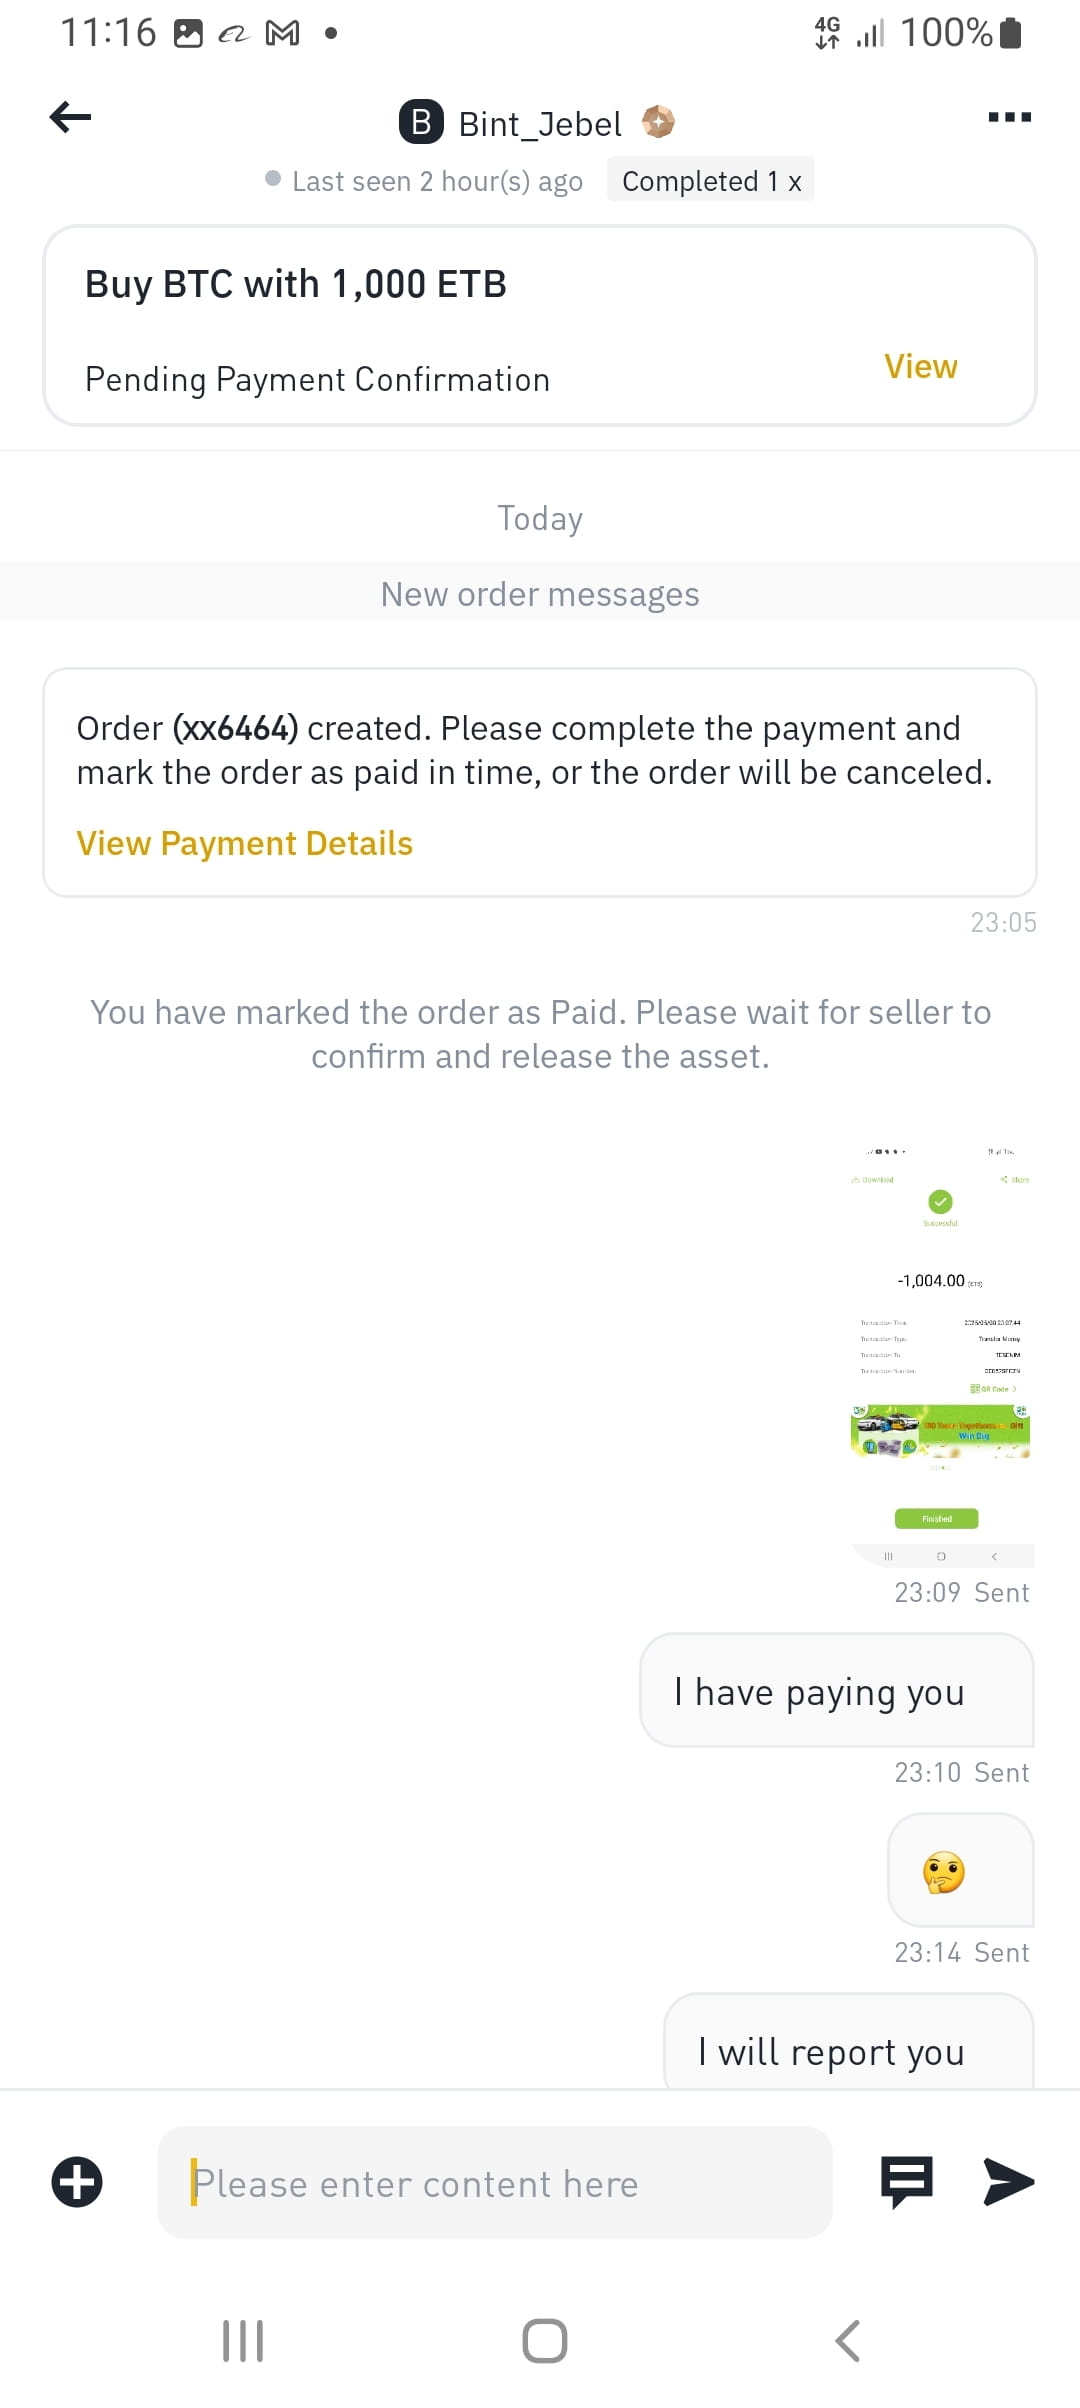
Be patient, if they don't pay you, the USDT will be released automatically after 1 hour.

pixul37
·
--
how can we believe the binance seller 🤔😡 so no trade or buy anything
Log in to explore more content