

Ahmed-Fdul
1.2k Posts
Ahmed-Fdul
Report
Block User
اوعى تحكم على المظهر حياتنا تختلف حسب زواية نظرك مغامرين انتحاريين حنا بنحقق أرباح باي طريقة باي شكل هل ده حقيقي ولا مجرد شكل 🇸🇩
Open Trade
High-Frequency Trader
2 Years
19 Following
978 Followers
1.0K+ Liked
Posts
Portfolio
All
Quotes
Videos
PINNED

·
--
$BTC has more than $80,000,000 in bids between $78,000 and $79,000.
Yesterday, bids were filled around $80K, leading to a short-term bounce.
But now, Bitcoin is falling again because spot buyers aren't stepping in, which means another drop could happen
{spot}(BTCUSDT)
$BTC has more than $80,000,000 in bids between $78,000 and $79,000.
Yesterday, bids were filled around $80K, leading to a short-term bounce.
But now, Bitcoin is falling again because spot buyers aren't stepping in, which means another drop could happen
Yesterday, bids were filled around $80K, leading to a short-term bounce.
But now, Bitcoin is falling again because spot buyers aren't stepping in, which means another drop could happen
183
·
--
#بد_تعافي_السوق_تدريجيا and the return of liquidity: an increase in trading volume and the entry of institutional investors and long-term funds starting tomorrow, God willing
#توكل_على_الله and I’ll buy the pricey one $BTC
{spot}(BTCUSDT)
$ETH
{spot}(ETHUSDT)
$XRP
{spot}(XRPUSDT)
#بد_تعافي_السوق_تدريجيا and the return of liquidity: an increase in trading volume and the entry of institutional investors and long-term funds starting tomorrow, God willing
#توكل_على_الله and I’ll buy the pricey one $BTC
$ETH
$XRP
#توكل_على_الله and I’ll buy the pricey one $BTC
$ETH
$XRP
171
·
--
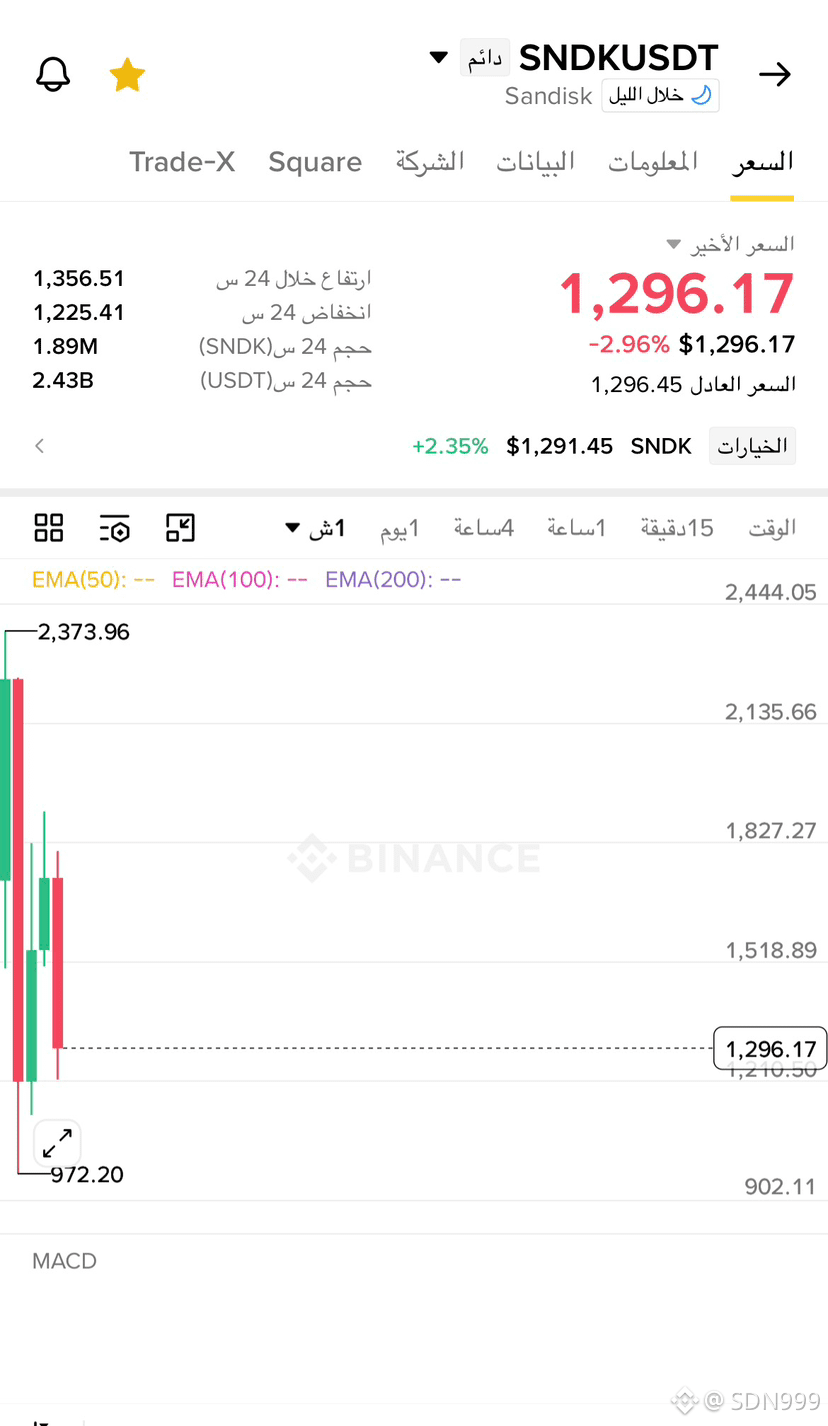
$SNDK is poised to crash to $30
{future}(SNDKUSDT)
A crash to $30 is inevitable. Remember my words, even if it takes a year.
$SNDK is poised to crash to $30
A crash to $30 is inevitable. Remember my words, even if it takes a year.
A crash to $30 is inevitable. Remember my words, even if it takes a year.
1
157
·
--
Bullish
$MASK
If America strikes Iran and the Guard carries out its threat, the Iranian Revolutionary Guard threatens to target internet cables beneath the Strait of Hormuz.
{future}(MASKUSDT)
Forecasts reach $100,000
$MASK
If America strikes Iran and the Guard carries out its threat, the Iranian Revolutionary Guard threatens to target internet cables beneath the Strait of Hormuz.
Forecasts reach $100,000
If America strikes Iran and the Guard carries out its threat, the Iranian Revolutionary Guard threatens to target internet cables beneath the Strait of Hormuz.
Forecasts reach $100,000
285
·
--
P is steady today, but the 30-day story isn’t.
$XRP
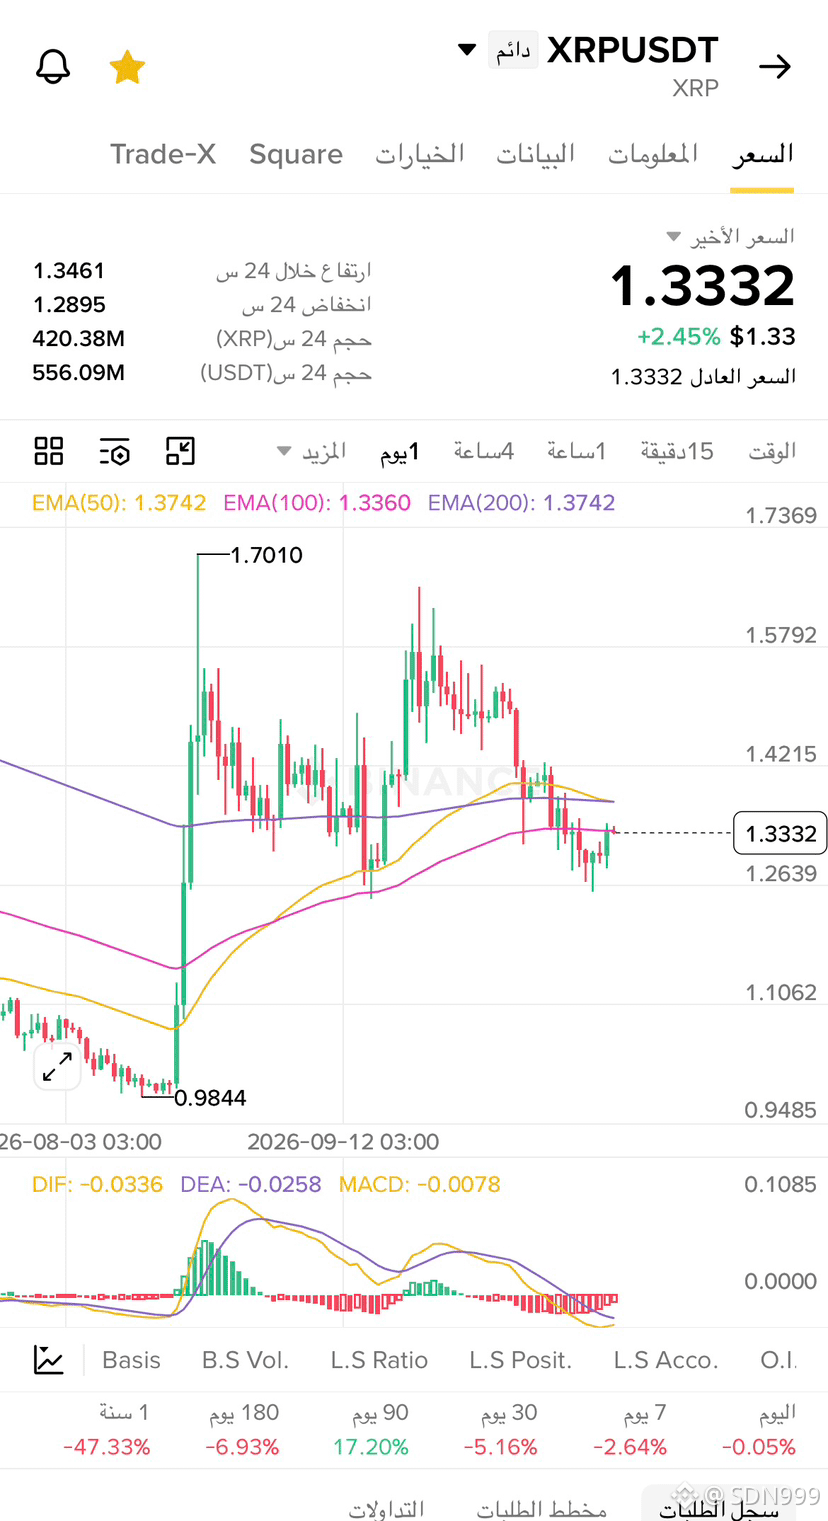
Price is at 1.3353, down 0.02%. The daily chart shows a peak at 1.6583, followed by a steady decline. Today’s range was between 1.2902 and 1.3464. 24-hour trading volume is 15.46M XRP.
The 30-day reading is -13.07%. The 90-day figure still shows +20.53%. The 180-day figure is -6.84%. The 7-day figure is just +0.27%.
My read: stability after a sharp move isn’t confirmation. It’s a lull.
Does a +0.27% reading over 7 days mean stability, or just a pause?
#XRP
{spot}(XRPUSDT)
P is steady today, but the 30-day story isn’t.
$XRP
Price is at 1.3353, down 0.02%. The daily chart shows a peak at 1.6583, followed by a steady decline. Today’s range was between 1.2902 and 1.3464. 24-hour trading volume is 15.46M XRP.
The 30-day reading is -13.07%. The 90-day figure still shows +20.53%. The 180-day figure is -6.84%. The 7-day figure is just +0.27%.
My read: stability after a sharp move isn’t confirmation. It’s a lull.
Does a +0.27% reading over 7 days mean stability, or just a pause?
#XRP
182
·
--
Bearish
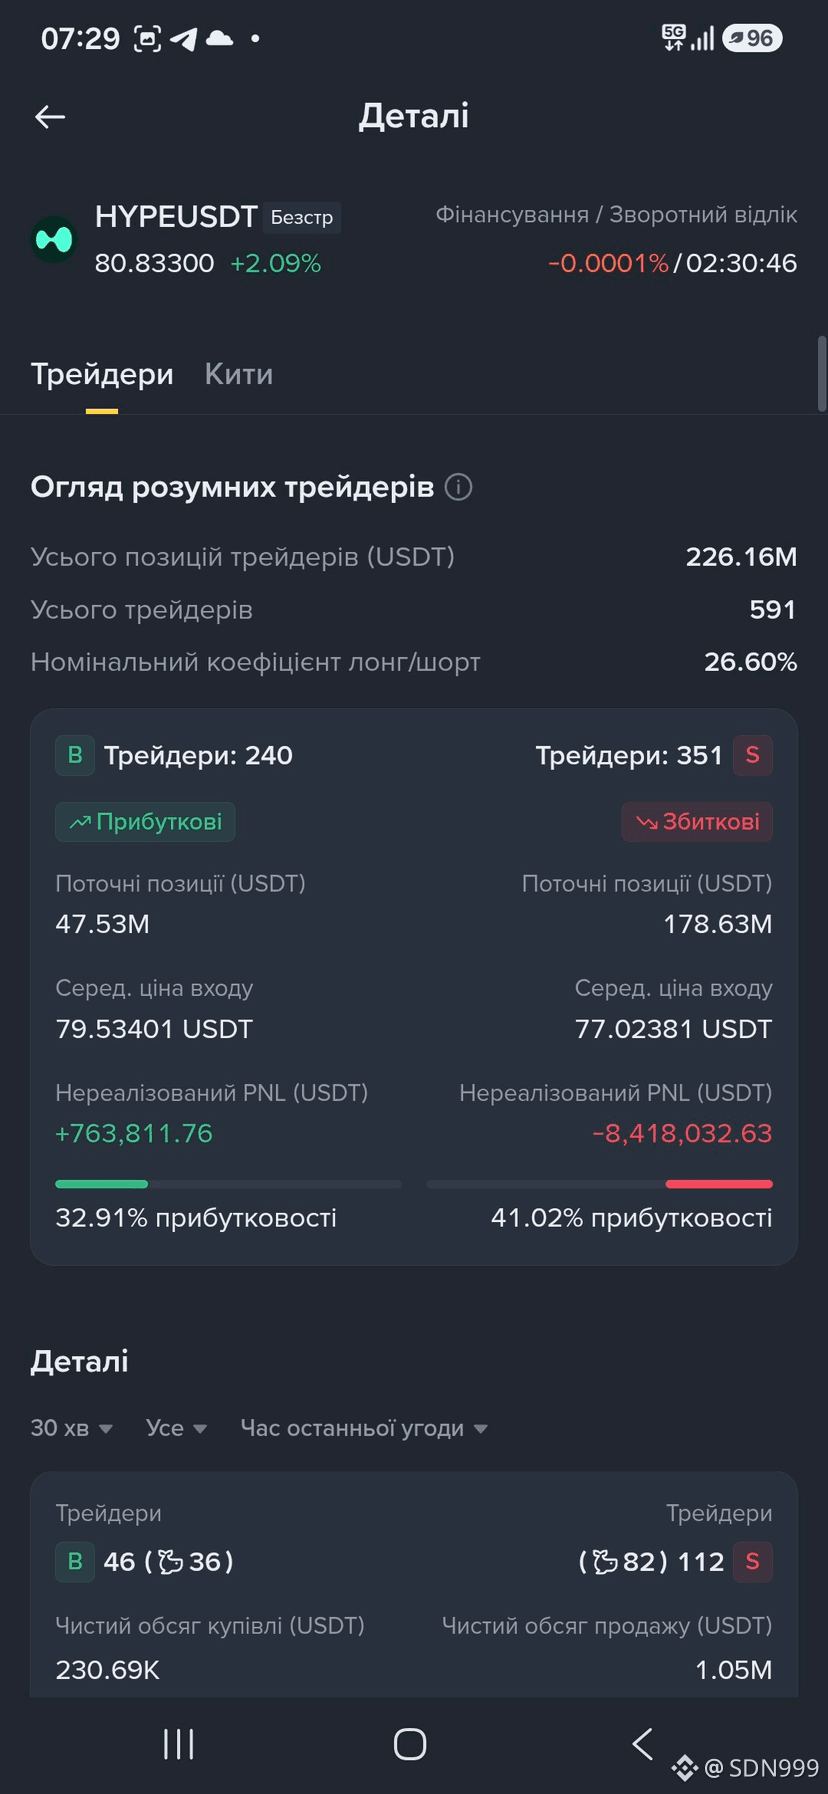
$HYPE vs. L: Short sellers under pressure, but who has the edge?
Both assets are rising despite heavy short positioning. However, their underlying market dynamics differ.
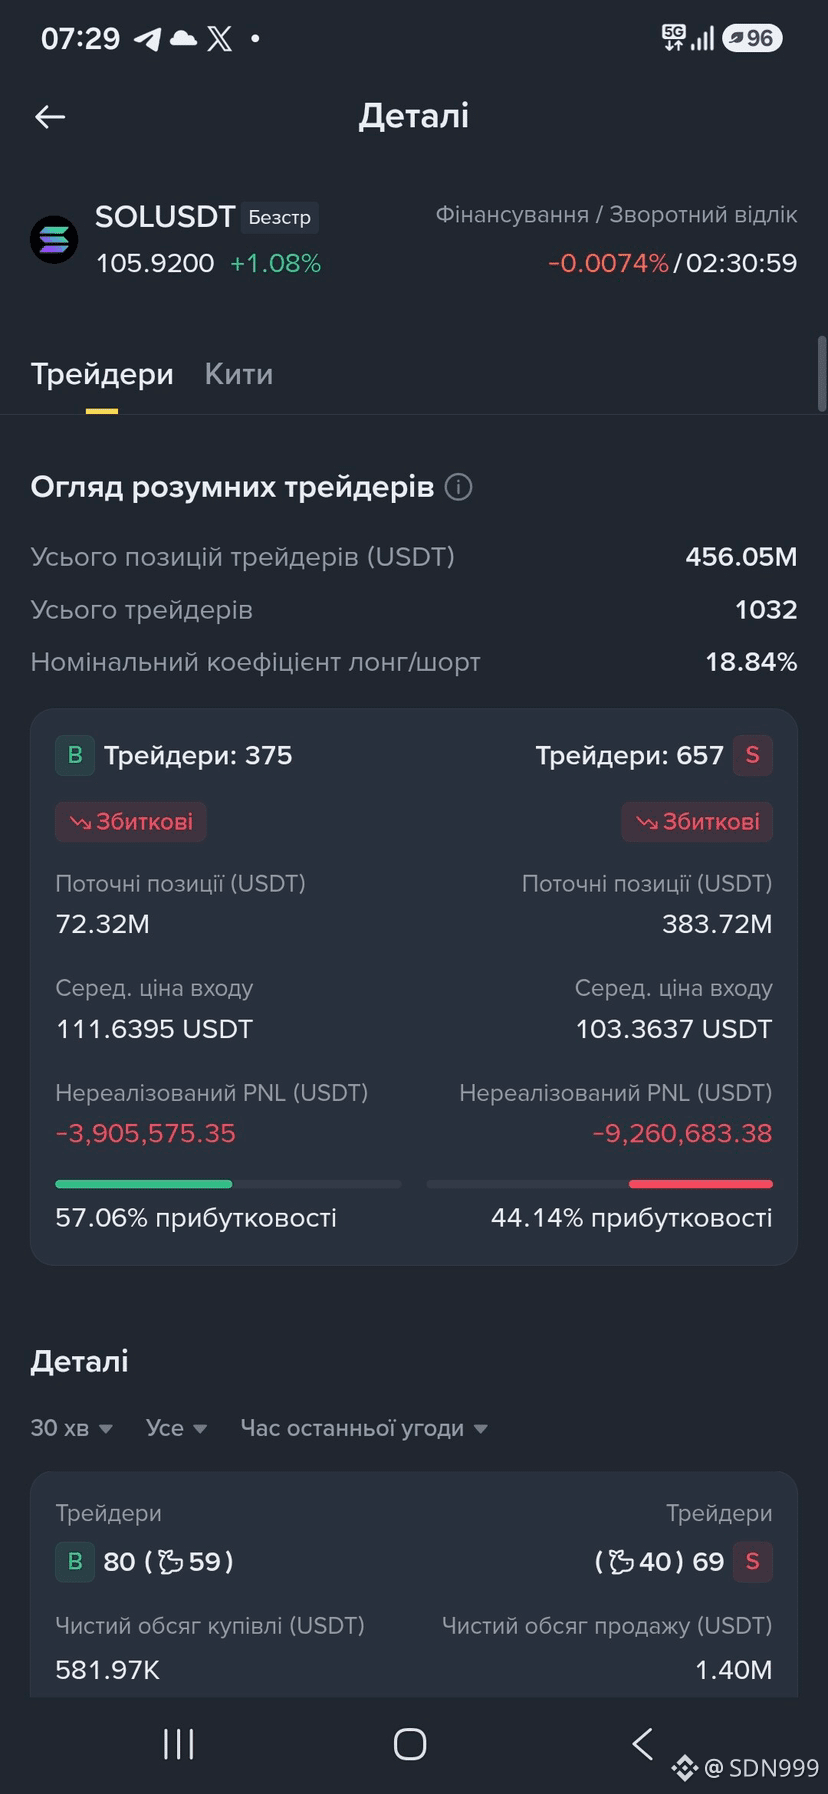
$HYPE shows a stronger bullish structure. Long positions are profitable, while short positions are facing significant unrealized losses. Nevertheless, recent selling pressure suggests the rally is meeting resistance.
$SOL presents a more complicated picture. Both sides are experiencing losses, and recent selling significantly outweighs buying.
{spot}(SOLUSDT)
{spot}(HYPEUSDT)
$HYPE vs. L: Short sellers under pressure, but who has the edge?
Both assets are rising despite heavy short positioning. However, their underlying market dynamics differ.
$HYPE shows a stronger bullish structure. Long positions are profitable, while short positions are facing significant unrealized losses. Nevertheless, recent selling pressure suggests the rally is meeting resistance.
$SOL presents a more complicated picture. Both sides are experiencing losses, and recent selling significantly outweighs buying.
142
·
--
Tomorrow, around 9% will be unlocked.
If there are no surprises, selling pressure will emerge at 0.03020.
My personal view: it will fall below 0.028.
If there is heavy selling and it drops below 0.025, it may continue falling below 0.02.
My personal view is for reference only. Cryptocurrency trading carries risks, and investing requires caution.$AKE
{future}(AKEUSDT)
Tomorrow, around 9% will be unlocked.
If there are no surprises, selling pressure will emerge at 0.03020.
My personal view: it will fall below 0.028.
If there is heavy selling and it drops below 0.025, it may continue falling below 0.02.
My personal view is for reference only. Cryptocurrency trading carries risks, and investing requires caution.$AKE
143
·
--
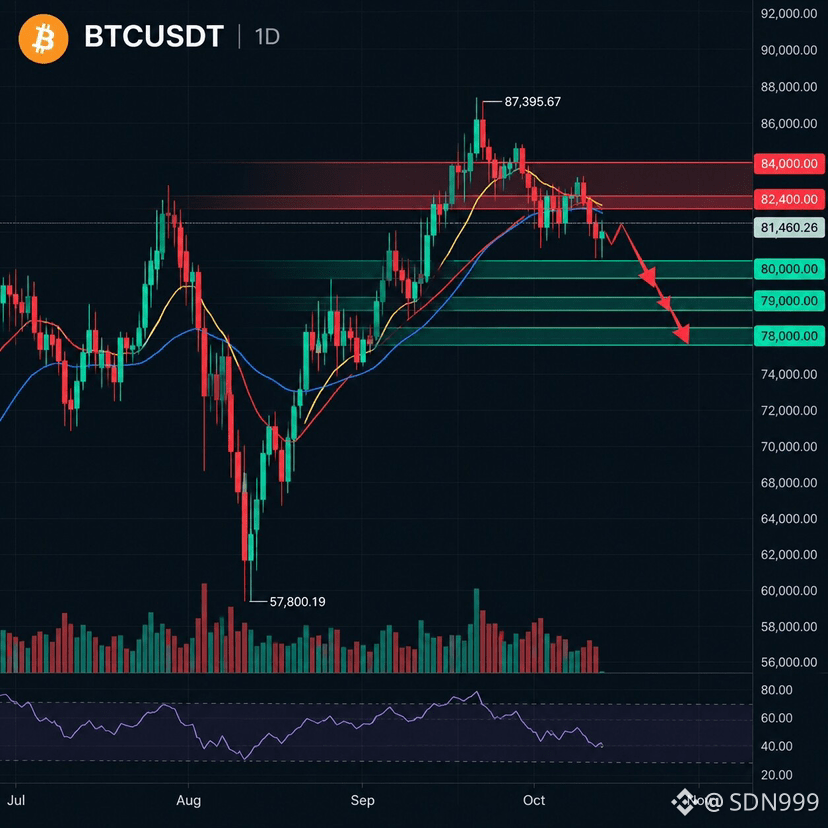
$BTC Short setup
Current price: ~$81,460
🔴 Direction: Short (bearish bias)
📍 Entry: $81,150–$81,200 after breakdown confirmation
🎯 Target 1: $80,000 🎯 Target 2: $79,000 🎯 Target 3: $78,000
🛑 Stop loss: $82,500
📊 Analysis: BTC is trading below EMA(7) and EMA(25), indicating short-term bearish pressure. A confirmed break below $81,200 could open the way to lower support levels.
✅ Beginner tip: Wait for the breakdown to be confirmed and for a failed retest before entering. If BTC reclaims $82,400,
{spot}(BTCUSDT)
$BTC Short setup
Current price: ~$81,460
🔴 Direction: Short (bearish bias)
📍 Entry: $81,150–$81,200 after breakdown confirmation
🎯 Target 1: $80,000 🎯 Target 2: $79,000 🎯 Target 3: $78,000
🛑 Stop loss: $82,500
📊 Analysis: BTC is trading below EMA(7) and EMA(25), indicating short-term bearish pressure. A confirmed break below $81,200 could open the way to lower support levels.
✅ Beginner tip: Wait for the breakdown to be confirmed and for a failed retest before entering. If BTC reclaims $82,400,
184
·
--
Oil returned to near $110.70 amid concerns about Middle East supplies; the US easing some restrictions on Russian energy did not calm the market. High oil prices, inflation, and interest-rate pressure continue to weigh on risk assets.
Outflows from spot ETFs last week: about $228 million, $ETH about $320 million, and SOL about $26 million. Selling slowed, but institutions have not returned.
Key levels: BTC $80,000, ETH $2,400, SOL $100. Without a breakout in volume, don't assume a reversal. $ETH $ZEC $BTC
{spot}(ETHUSDT)
{spot}(BTCUSDT)
Oil returned to near $110.70 amid concerns about Middle East supplies; the US easing some restrictions on Russian energy did not calm the market. High oil prices, inflation, and interest-rate pressure continue to weigh on risk assets.
Outflows from spot ETFs last week: about $228 million, $ETH about $320 million, and SOL about $26 million. Selling slowed, but institutions have not returned.
Key levels: BTC $80,000, ETH $2,400, SOL $100. Without a breakout in volume, don't assume a reversal. $ETH $ZEC $BTC
Outflows from spot ETFs last week: about $228 million, $ETH about $320 million, and SOL about $26 million. Selling slowed, but institutions have not returned.
Key levels: BTC $80,000, ETH $2,400, SOL $100. Without a breakout in volume, don't assume a reversal. $ETH $ZEC $BTC
120
·
--
Bearish
(3) End-of-run coins with potential to recover to under (1) dollar by the end of this year. Not financial advice.
#تذكر_كلامي
$VVV
{future}(VVVUSDT)
$HYPE
{spot}(HYPEUSDT)
$DASH
{spot}(DASHUSDT)
(3) End-of-run coins with potential to recover to under (1) dollar by the end of this year. Not financial advice.
#تذكر_كلامي
$VVV
$HYPE
$DASH
#تذكر_كلامي
$VVV
$HYPE
$DASH
72
·
--
BTC’s move from around $80,000 to briefly $83,000, then back near $82,000, looks hesitant amid renewed ETF redemptions. An additional net outflow of $139 million on October 19 matters because the price recovery has yet to attract sustained institutional demand. The rebound could continue without it, but the case for resilience remains unproven.
But … the question is,,,,, is the $100,000 hype around Bitcoin overshadowing the resilience of real digital assets? At SpaceWay, we focus on staying strong through market shifts and blockchain evolution. Join us on this journey! 🚀$BTC
{spot}(BTCUSDT)
BTC’s move from around $80,000 to briefly $83,000, then back near $82,000, looks hesitant amid renewed ETF redemptions. An additional net outflow of $139 million on October 19 matters because the price recovery has yet to attract sustained institutional demand. The rebound could continue without it, but the case for resilience remains unproven.
But … the question is,,,,, is the $100,000 hype around Bitcoin overshadowing the resilience of real digital assets? At SpaceWay, we focus on staying strong through market shifts and blockchain evolution. Join us on this journey! 🚀$BTC
But … the question is,,,,, is the $100,000 hype around Bitcoin overshadowing the resilience of real digital assets? At SpaceWay, we focus on staying strong through market shifts and blockchain evolution. Join us on this journey! 🚀$BTC

107

·
--
•A financial earthquake is shaking Japanese markets
Imagine, everyone: around $150 billion has been wiped off the value of Japanese stocks, with the Nikkei down more than 2% in morning trading.
The reason: a wave of heavy selling in U.S. tech stocks and rising oil prices, adding further pressure on markets.
The bigger question is: will the contagion spread to other global markets? 😳
34
·
--
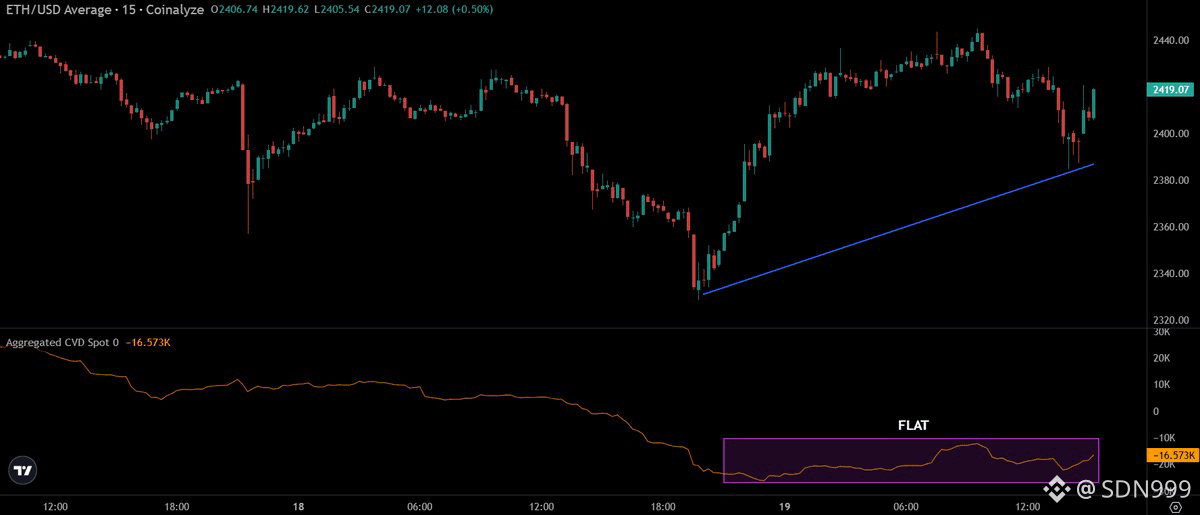
Immediate demand for $ETH remains weak.
Any price increase is mostly due to short covering.
It seems large buyers are waiting for a dip around $2,200–$2,250 to accumulate Ethereum
{spot}(ETHUSDT)
Immediate demand for $ETH remains weak.
Any price increase is mostly due to short covering.
It seems large buyers are waiting for a dip around $2,200–$2,250 to accumulate Ethereum
Any price increase is mostly due to short covering.
It seems large buyers are waiting for a dip around $2,200–$2,250 to accumulate Ethereum
31
Log in to explore more content
Join global crypto users on Binance Square
⚡️ Get latest and useful information about crypto.
💬 Trusted by the world’s largest crypto exchange.
👍 Discover real insights from verified creators.
Email / Phone number