
RobiMaulana
212 Posts

RobiMaulana
2 Following
1.5K+ Followers
446 Liked
Posts
All
Quotes
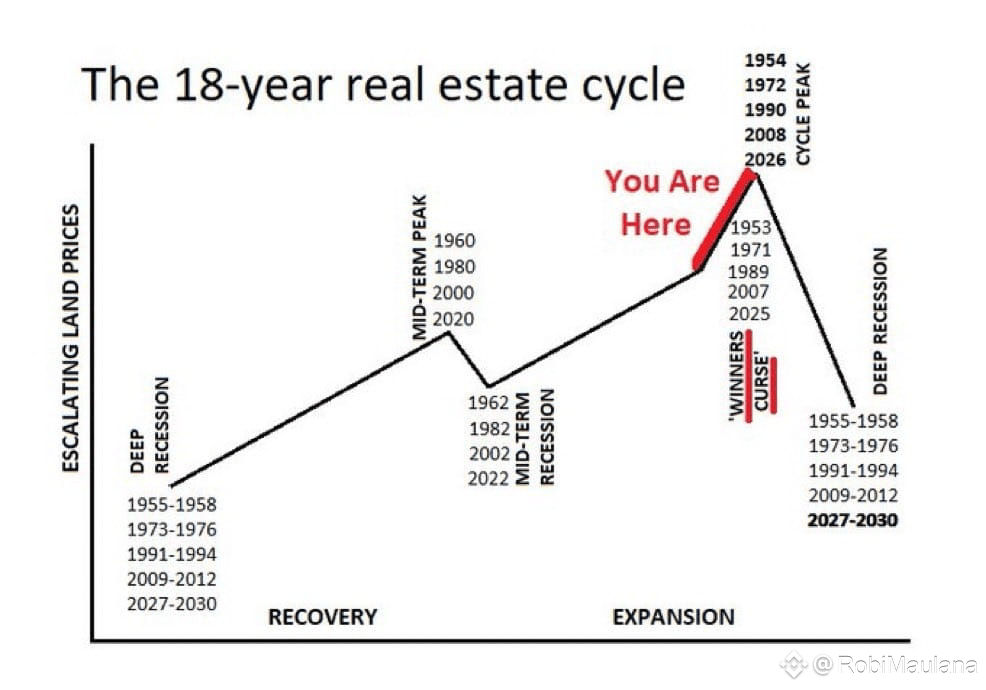
18-year real estate cycle says 2026=CYCLE PEAK 🚨
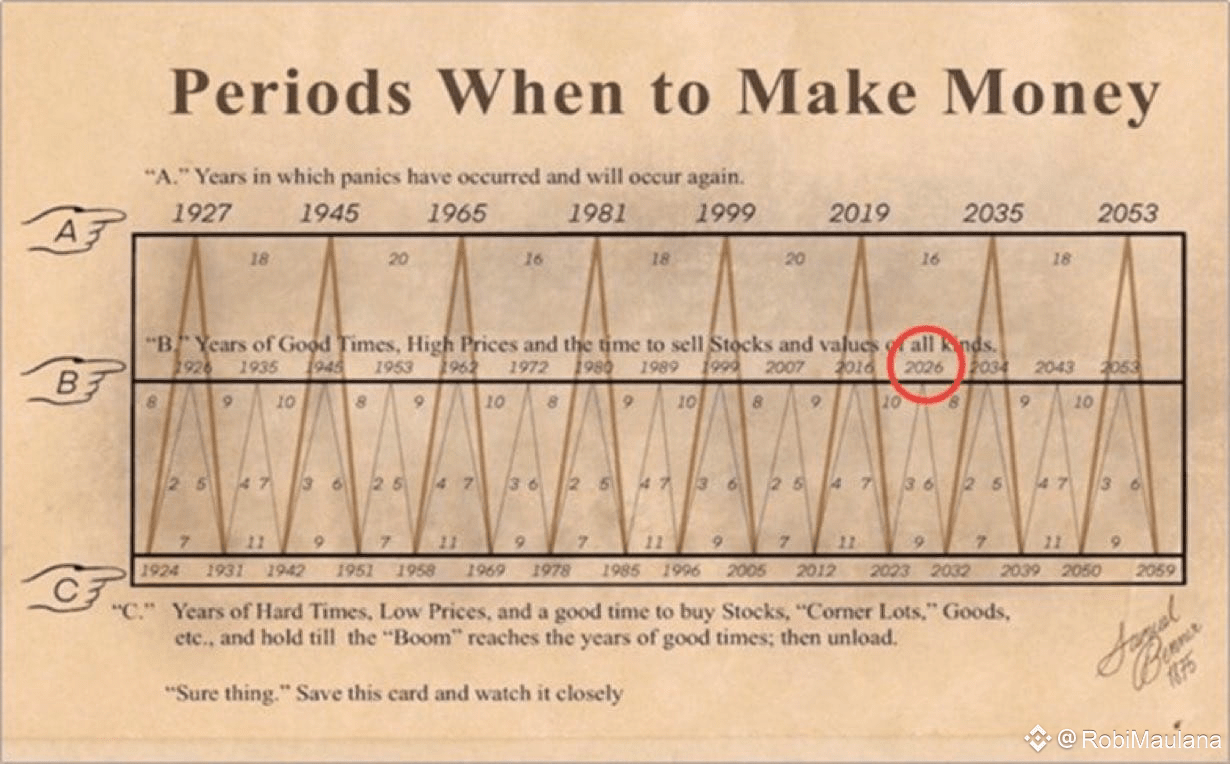
200 year old farmer chart says 2026=CYCLE PEAK 🚨
$BTC
200 year old farmer chart says 2026=CYCLE PEAK 🚨
$BTC
No rate cuts → DUMP
Rate cuts → DUMP
Tariffs increased → DUMP
Tariff decreased → still DUMP
Good news → DUMP
No news → DUMP
Bad news → super DUMP
$BTC
Rate cuts → DUMP
Tariffs increased → DUMP
Tariff decreased → still DUMP
Good news → DUMP
No news → DUMP
Bad news → super DUMP
$BTC

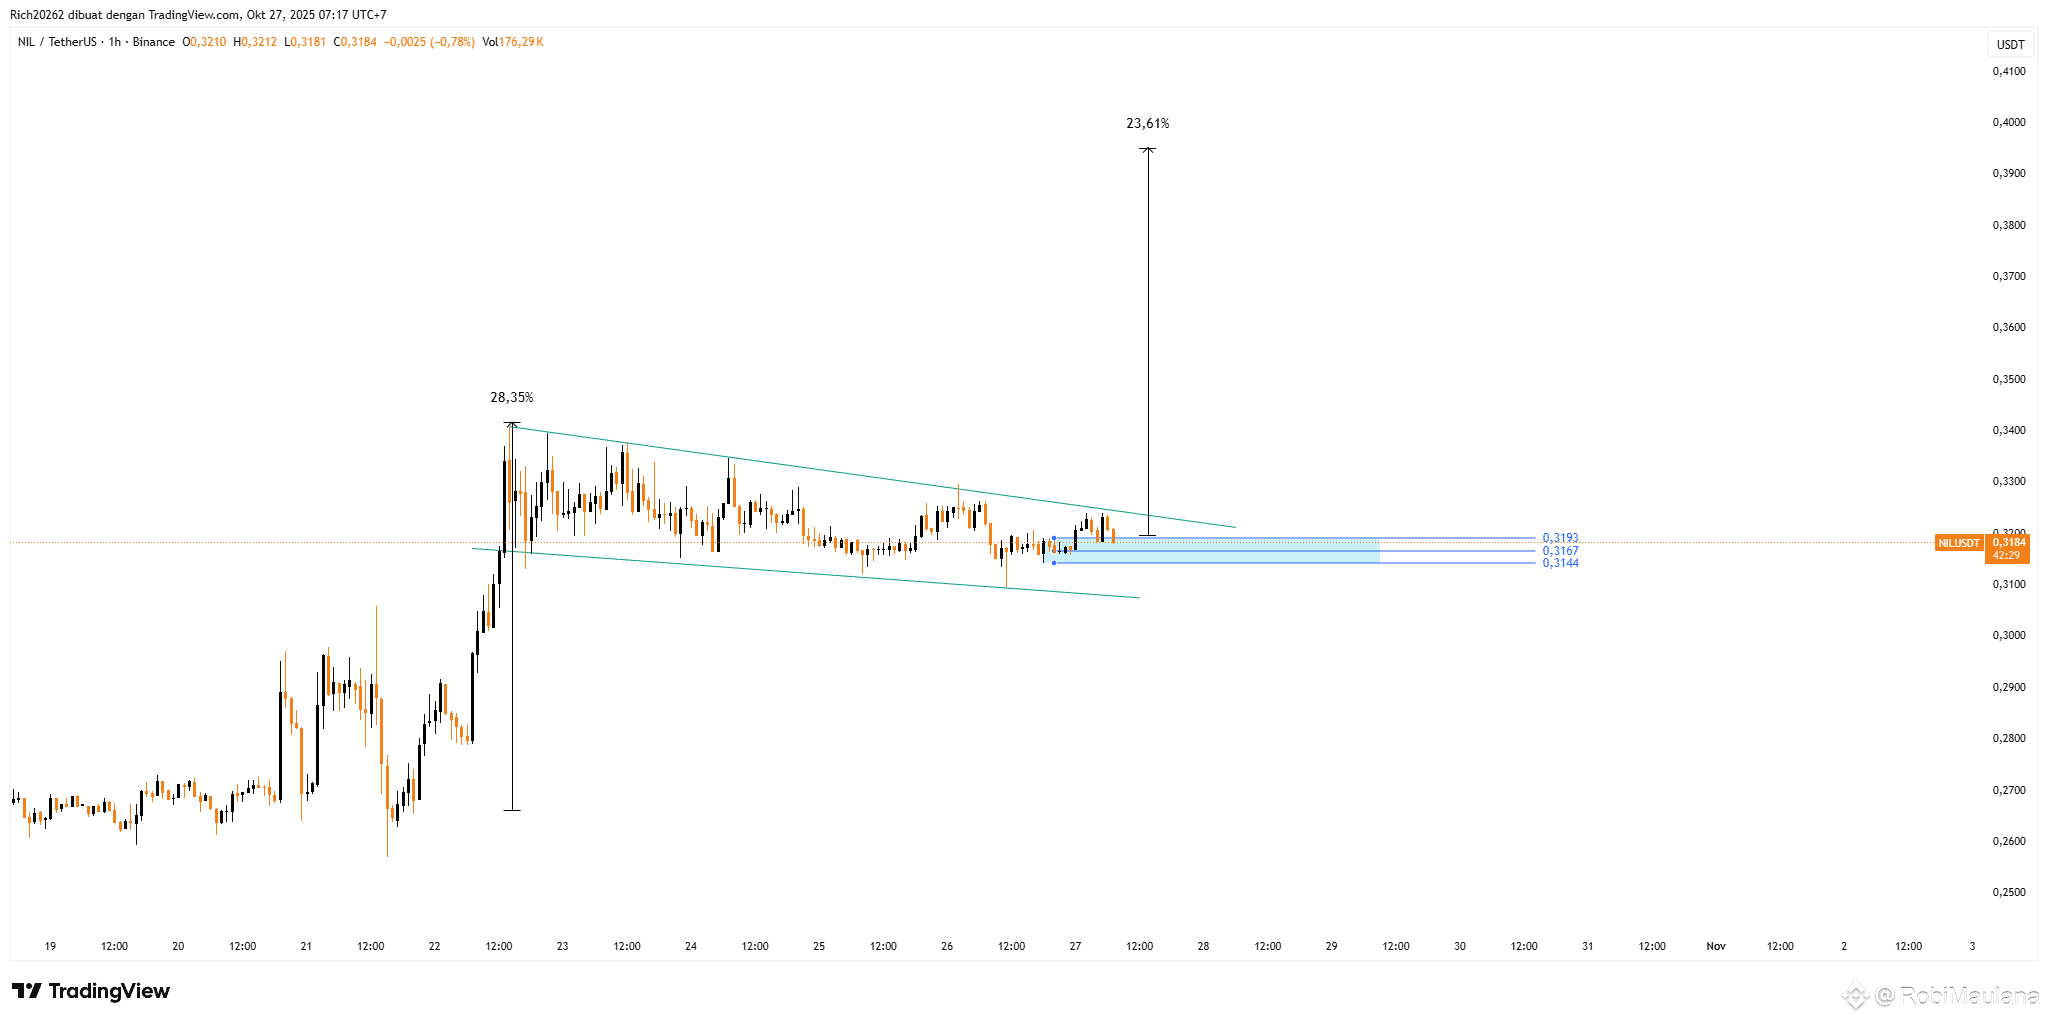
$NIL
It's time for us to accumulate in this area, because there is a bullish pattern which is Bullish Flag
It's time for us to accumulate in this area, because there is a bullish pattern which is Bullish Flag
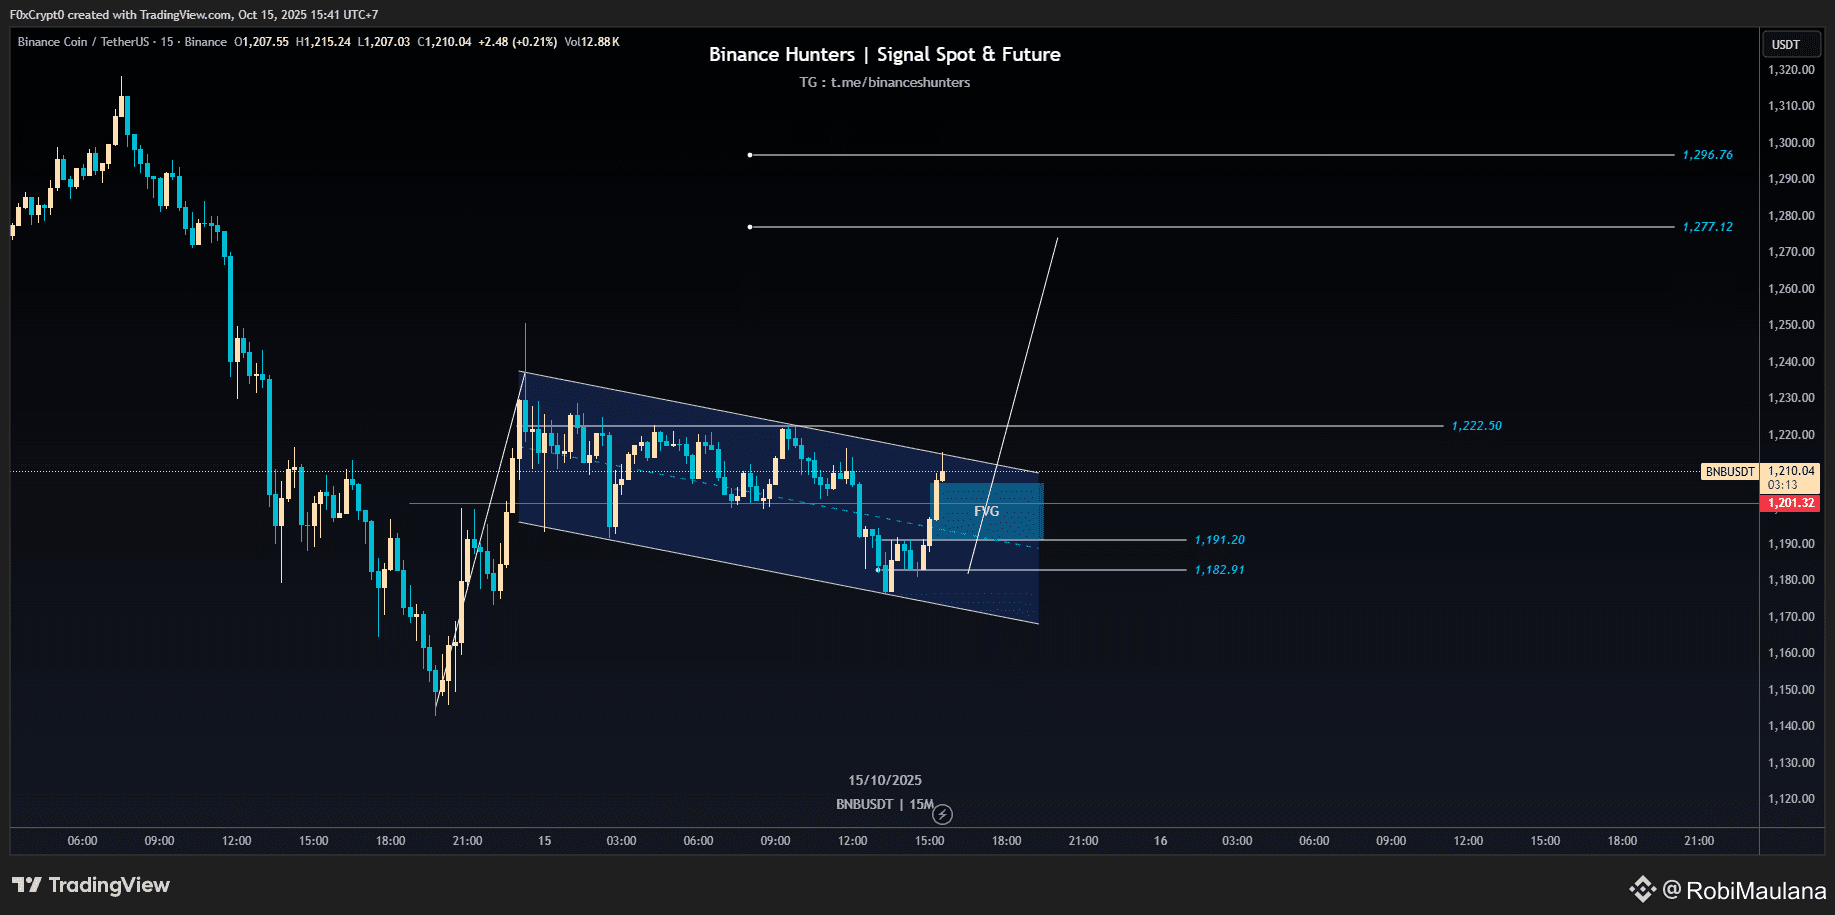
$BNB There is a Falling Wedge pattern which indicates bullish with a target of 1277 - 1296. For the entry area, you can take it at FVG.
The Fed may soon pause balance sheet reduction — a move to keep liquidity flowing in overnight markets, signaling a softer stance on tightening.

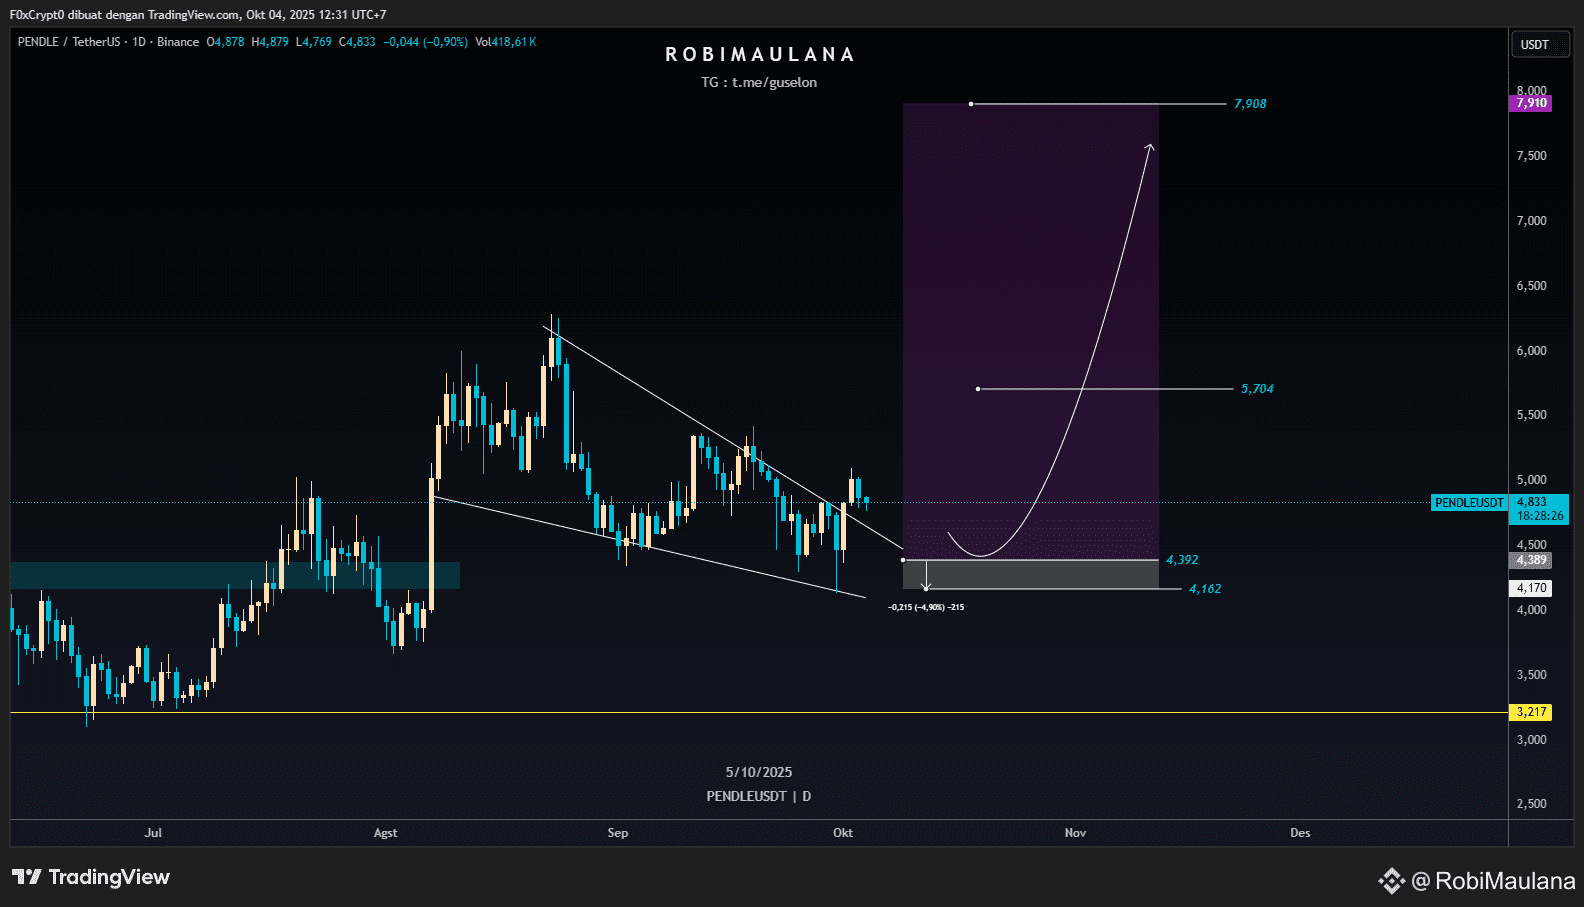
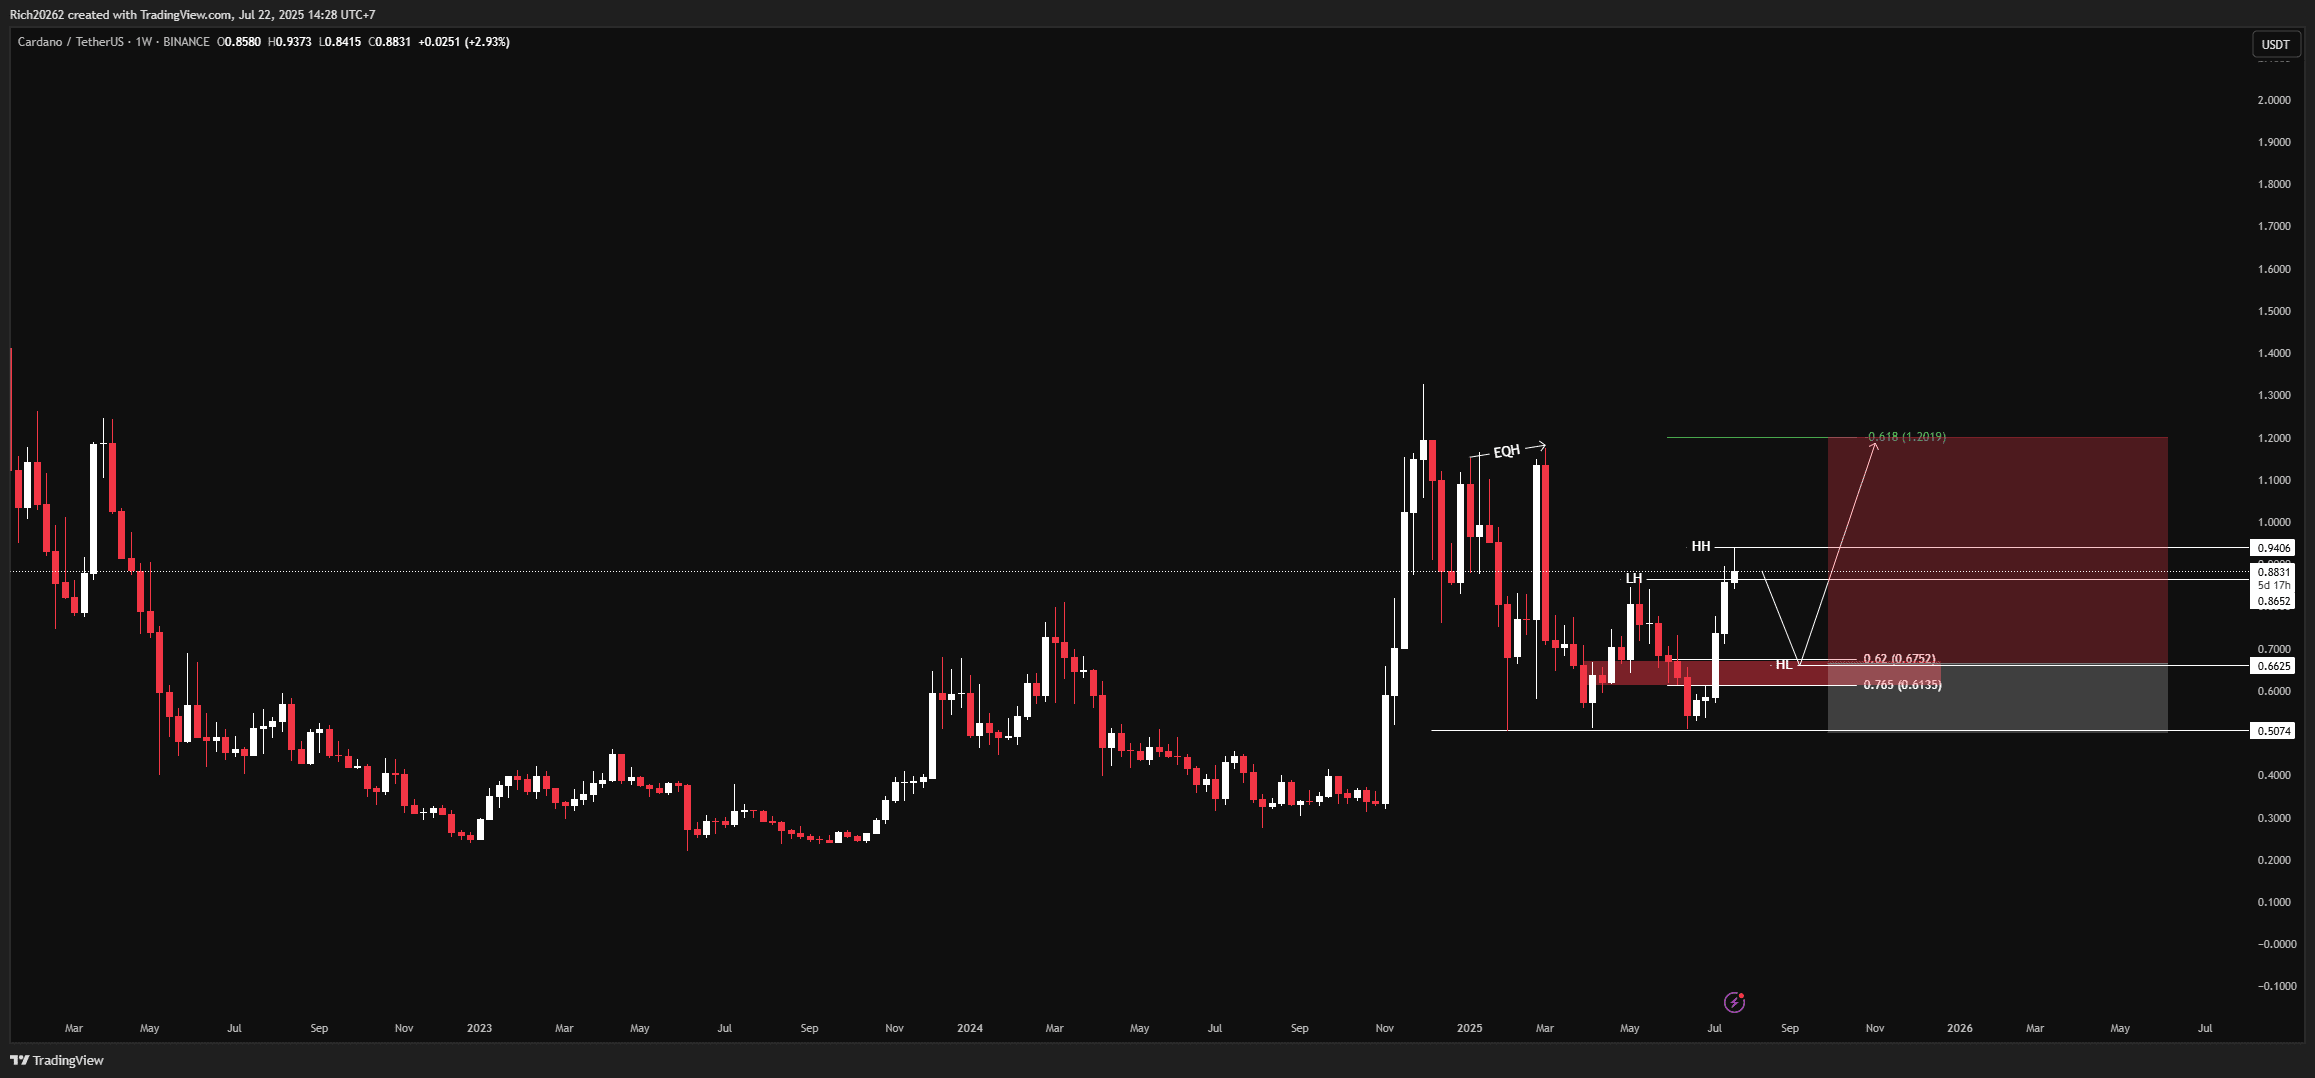
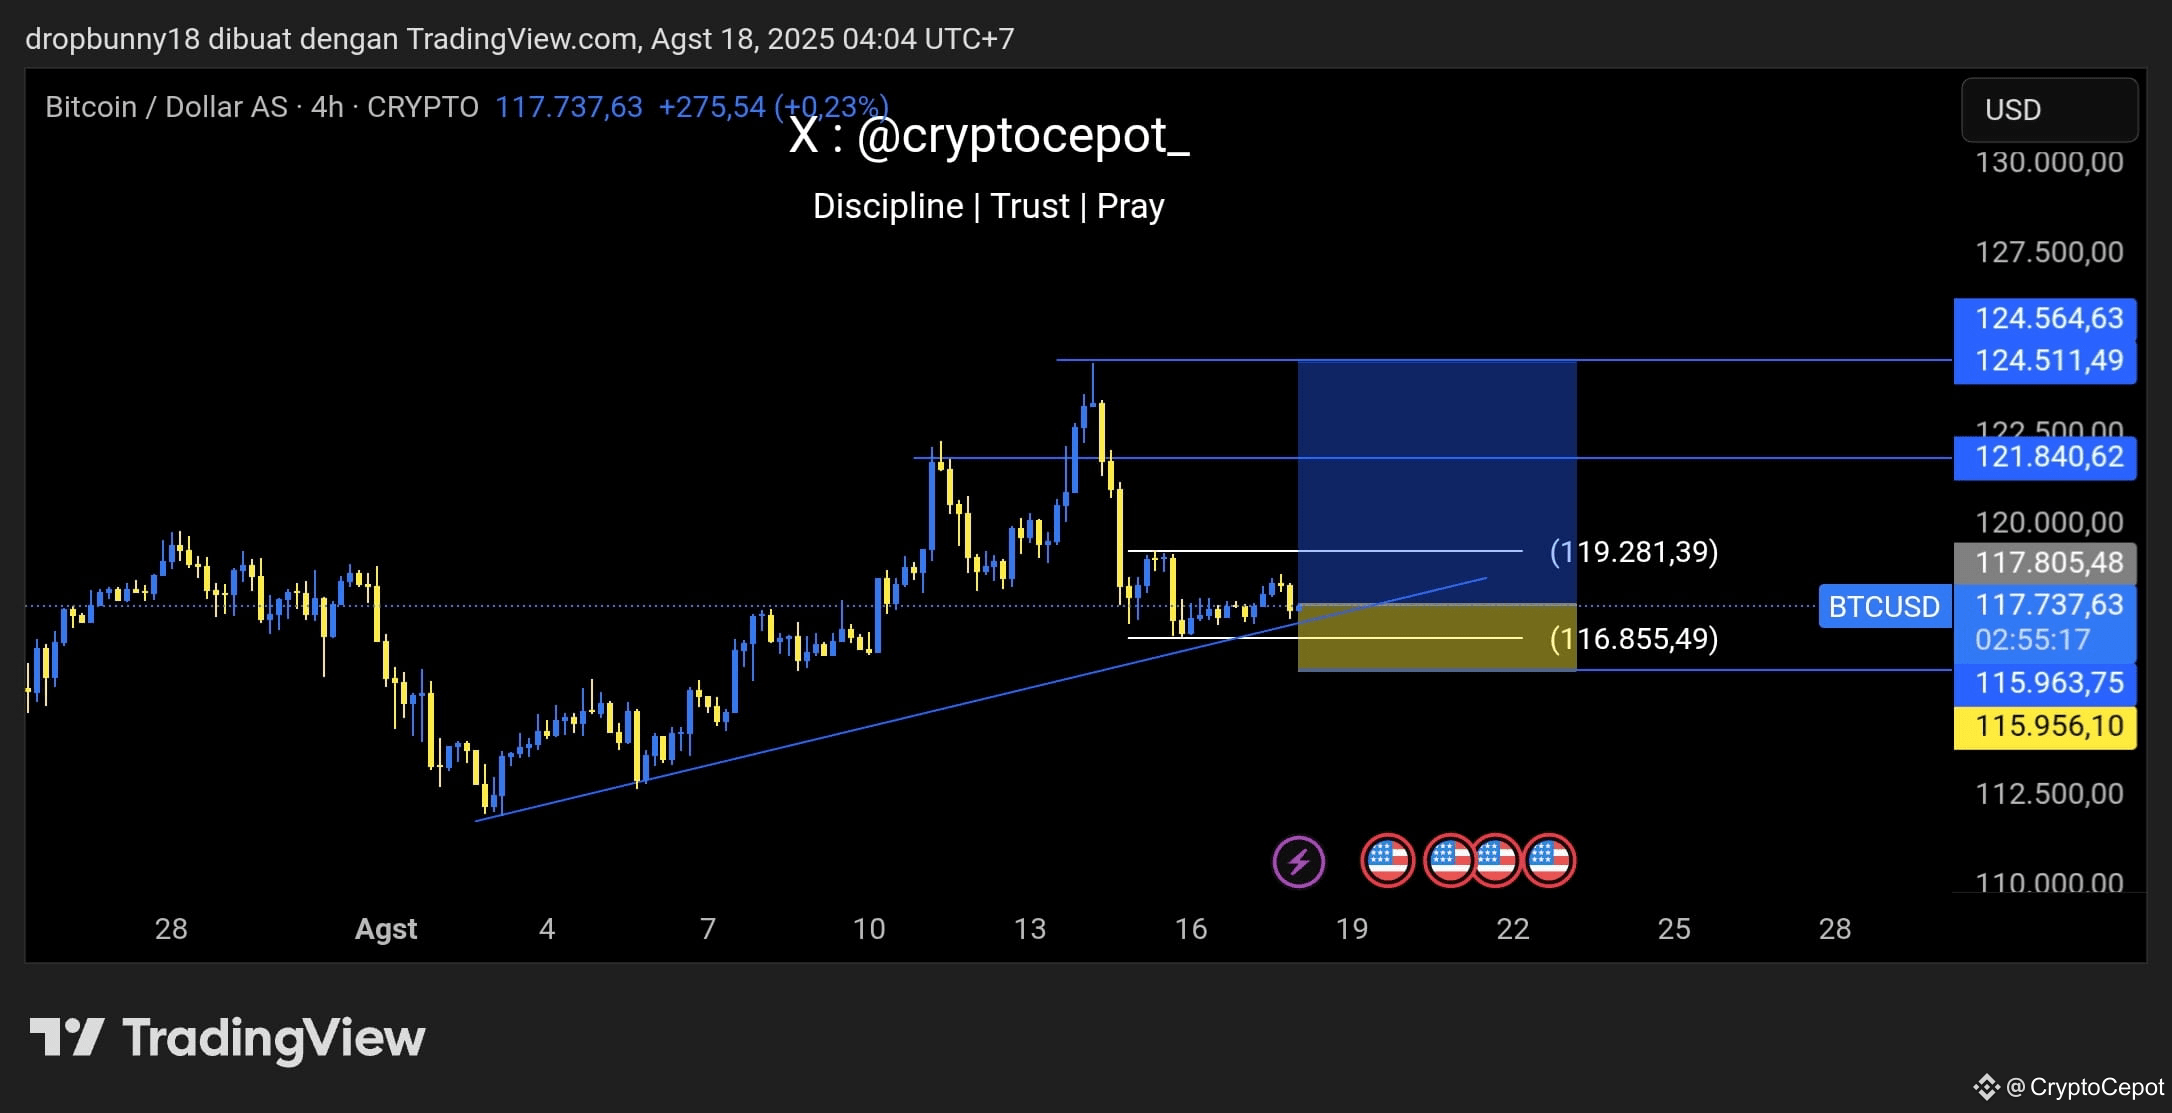
$BTC Long of the up trendline with SL at 115.956. The price is currently ranging in the area of its Up Trendline.
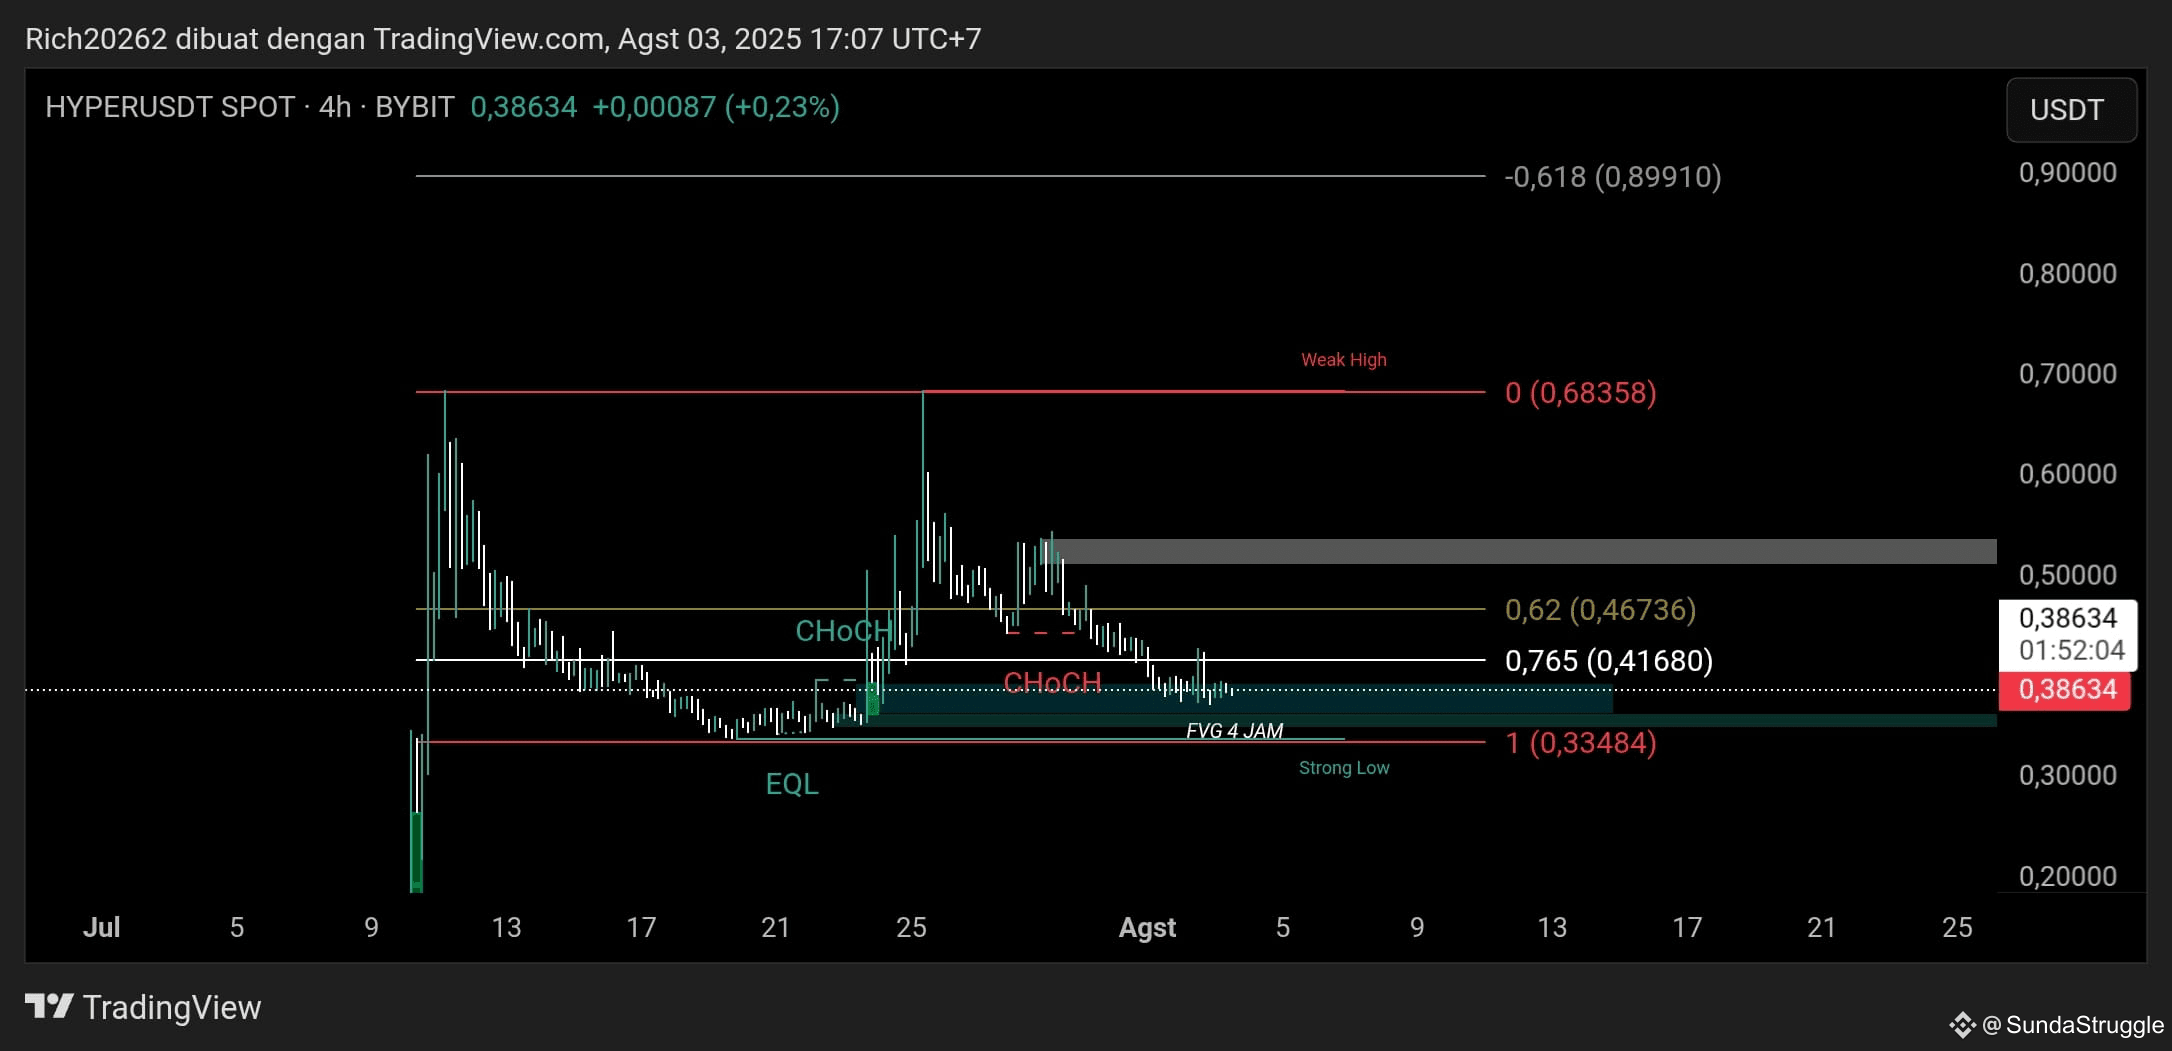
$HYPER is quite interesting, currently located near its demand zone as well as its Fair Value Gap. If this results in a Rally Base Rally, $HYPER has the chance to reach 0.9
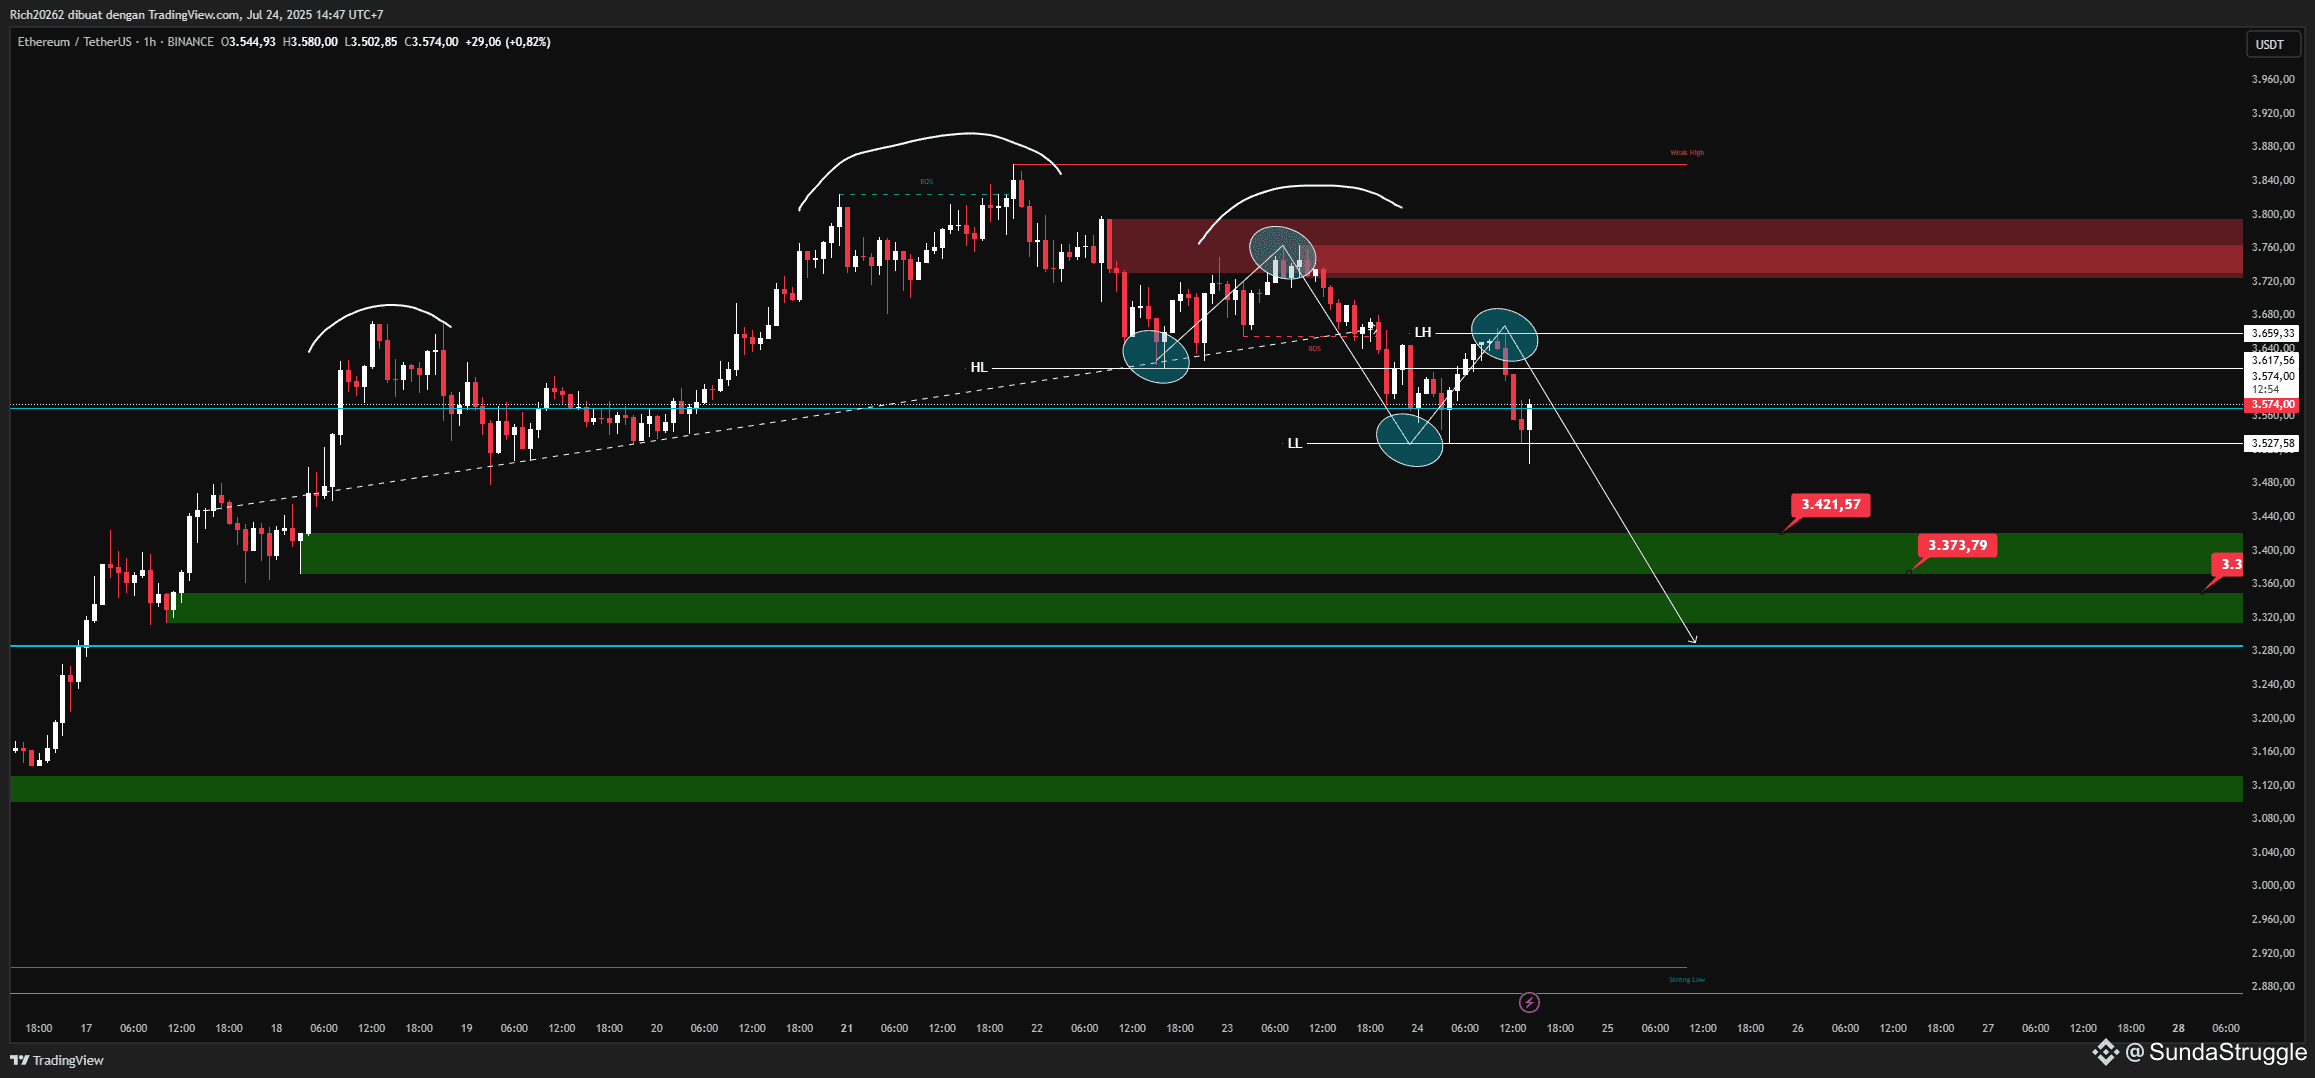
$ETH Demand Zone that can be monitored to start buying can be at that price because it just broke its HnS pattern and is retesting the potential to continue its decline
Coinbase Ventures's predictions for the future of Crypto x AI
*Coinbase Ventures's predict a future where AI agents will have their own crypto wallets to autonomously transact, access decentralized compute and data resources, or leverage stablecoins and/or their own token economy to pay humans and other agents to complete tasks necessary for their overall objective function. However, they do not believe crypto / blockchain technology is required to advance capabilities or solve emerging challenges in every layer of the AI tech stack.
*Crypto x AI stack can be segmented into the following layers:
(1) Compute: networks focused on supplying latent GPU compute resources to AI developers
(2) Data: networks that enable decentralized access, orchestration, and verifiability of the AI data pipeline
(3) Middleware: networks/platforms that enable the development, deployment, hosting, and orchestration of AI models / agents
(4) Applications: user-facing products (B2B or B2C) that leverage onchain AI mechanisms
*Coinbase Ventures's predict a future where AI agents will have their own crypto wallets to autonomously transact, access decentralized compute and data resources, or leverage stablecoins and/or their own token economy to pay humans and other agents to complete tasks necessary for their overall objective function. However, they do not believe crypto / blockchain technology is required to advance capabilities or solve emerging challenges in every layer of the AI tech stack.
*Crypto x AI stack can be segmented into the following layers:
(1) Compute: networks focused on supplying latent GPU compute resources to AI developers
(2) Data: networks that enable decentralized access, orchestration, and verifiability of the AI data pipeline
(3) Middleware: networks/platforms that enable the development, deployment, hosting, and orchestration of AI models / agents
(4) Applications: user-facing products (B2B or B2C) that leverage onchain AI mechanisms

$BTC Clossing Daily with Hanging Man Candle There is still potential for DUMP again if it does not break through to the price of 70k and is stuck at 68.6k

🚨 Crypto Alert! 🚨
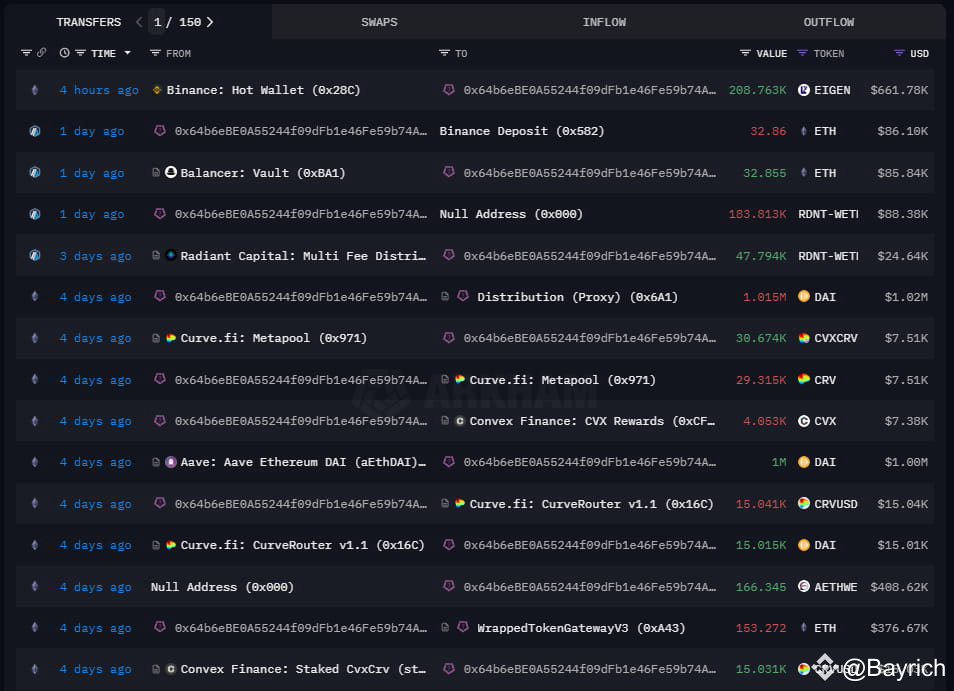
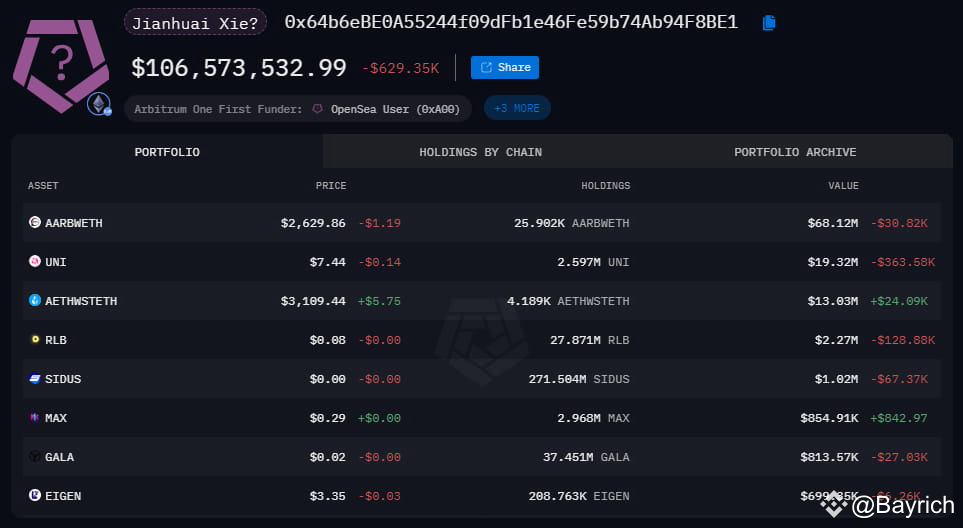
Just 4 hours ago, a crypto whale with the address 0x64b withdrew 209k $EIGEN (approximately $662k) from #Binance! 🐳💰
With a total portfolio valued at $106 million, they are also one of the largest $ETH suppliers on #AAVE. 🔥Want to know more about their activity? Check out their address here: https://platform.arkhamintelligence.com/explorer/address/0x64b6eBE0A55244f09dFb1e46Fe59b74Ab94F8BE1Is this a sign of big movements in the market? Let's discuss! 💬👇 #CryptoNews #TipsTradingFutures
Just 4 hours ago, a crypto whale with the address 0x64b withdrew 209k $EIGEN (approximately $662k) from #Binance! 🐳💰
With a total portfolio valued at $106 million, they are also one of the largest $ETH suppliers on #AAVE. 🔥Want to know more about their activity? Check out their address here: https://platform.arkhamintelligence.com/explorer/address/0x64b6eBE0A55244f09dFb1e46Fe59b74Ab94F8BE1Is this a sign of big movements in the market? Let's discuss! 💬👇 #CryptoNews #TipsTradingFutures
$BTC
Monthly ChartLine version It looks like it has broken the Falling Wedge pattern and has reached the Fibo Retracement area, just look for confirmation in the Low Time Frame if there is a rejection, there will likely be a correction first. If measuring from the depth of the Falling Wedge pattern $BTC Max target area is at a price of 74.6k New Higher High from the chart line version
Monthly ChartLine version It looks like it has broken the Falling Wedge pattern and has reached the Fibo Retracement area, just look for confirmation in the Low Time Frame if there is a rejection, there will likely be a correction first. If measuring from the depth of the Falling Wedge pattern $BTC Max target area is at a price of 74.6k New Higher High from the chart line version

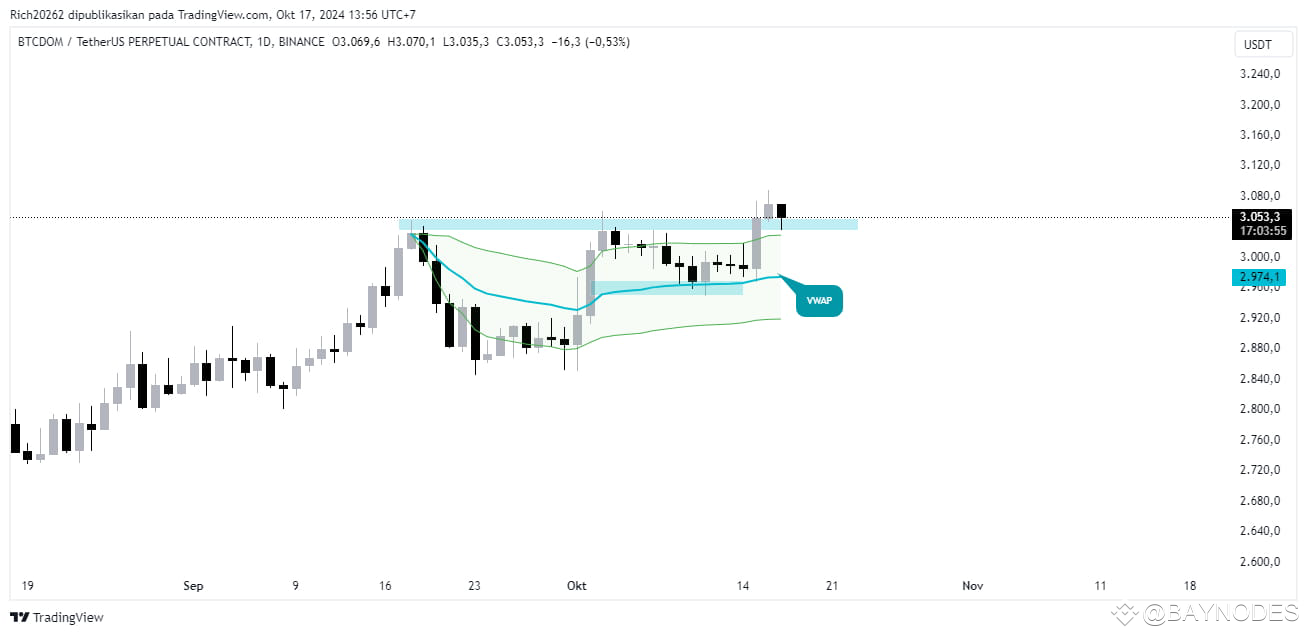
Alt season kapan bang jika BTCDOM dalam keadaan strong bullish 😅$BTC
#RekomendasiTop5MemeCoin #TipsTradingFutures #CryptoExplorerFiesta
#RekomendasiTop5MemeCoin #TipsTradingFutures #CryptoExplorerFiesta
$BTC Weekly has made a Higher High (HH), where there is a confirmation of Change of Character. Usually, this indicates a change in trend and will likely look for a Higher Low point. For Higher Low, the range is between 37,554 - 27,741.

$WIF is showing an Inverse Cup and Handle pattern and has retested. To remain bullish, $WIF needs to reclaim the $2 level. However, if the price manages to break through $1.1, $WIF is likely to move towards the $0.44 level.
#marketdownturn #TipsTradingFutures #Binance #BTC
#marketdownturn #TipsTradingFutures #Binance #BTC

🚀 $BTC MAYBE THIS IS AGAIN IN THE WYCKOFF REACCUMULATION PHASE 👀
In cryptocurrency market analysis, price movement patterns often follow certain phases which can help traders and investors to understand ongoing trends. One popular theory is the Wyckoff Theory, which divides price movements into several phases, including the reaccumulation phase.
What is Wyckoff Reaccumulation Phase?
The Wyckoff Reaccumulation Phase occurs after the distribution phase, where prices decline or consolidate after reaching a peak. In this phase, the market begins to reassemble the asset after a price drop, in the hope that the price will rise again. This is the time when smart money (big investors) starts to re-enter the market, creating balanced supply and demand.
Why $BTC Might Be In This Phase?
1. Price Consolidation: $BTC shows a consolidation pattern at a certain price level, which could indicate that the market is looking for a balance point before continuing the uptrend.
2. Trading Volume: Increasing trading volume when the price is moving sideways may indicate that there is accumulation by large investors, who believe that the price will rise in the near future.
3. Technical Indicators: Several technical indicators, such as the Moving Average and RSI, show bullish signals that support the possibility that Bitcoin is preparing to break out from this reaccumulation phase.
What is next?
If this analysis is correct, we may see significant price movement to the upside in the near future. However, it is important to always conduct additional research and analysis before making an investment decision.
In cryptocurrency market analysis, price movement patterns often follow certain phases which can help traders and investors to understand ongoing trends. One popular theory is the Wyckoff Theory, which divides price movements into several phases, including the reaccumulation phase.
What is Wyckoff Reaccumulation Phase?
The Wyckoff Reaccumulation Phase occurs after the distribution phase, where prices decline or consolidate after reaching a peak. In this phase, the market begins to reassemble the asset after a price drop, in the hope that the price will rise again. This is the time when smart money (big investors) starts to re-enter the market, creating balanced supply and demand.
Why $BTC Might Be In This Phase?
1. Price Consolidation: $BTC shows a consolidation pattern at a certain price level, which could indicate that the market is looking for a balance point before continuing the uptrend.
2. Trading Volume: Increasing trading volume when the price is moving sideways may indicate that there is accumulation by large investors, who believe that the price will rise in the near future.
3. Technical Indicators: Several technical indicators, such as the Moving Average and RSI, show bullish signals that support the possibility that Bitcoin is preparing to break out from this reaccumulation phase.
What is next?
If this analysis is correct, we may see significant price movement to the upside in the near future. However, it is important to always conduct additional research and analysis before making an investment decision.


Log in to explore more content