
启示录
743 Posts

启示录
Report
Block User
汇聚顶级资源,洞悉市场脉络,追踪国际行情,分享投资秘籍,财富从启示录开始。
Open Trade
High-Frequency Trader
5.3 Years
57 Following
425 Followers
774 Liked
Posts
Portfolio
All
Quotes
Videos
·
--
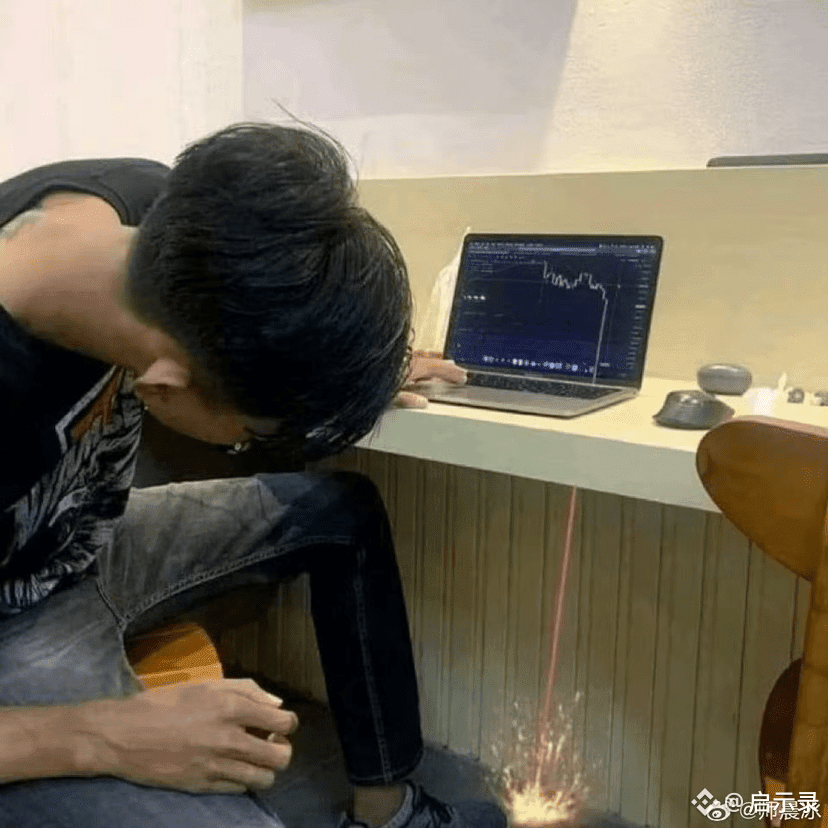
BTC and Nasdaq 100I've been rethinking the relationship between BTC and the Nasdaq 100 lately.
Not too long ago, I used to think it was pretty straightforward:
Buying BTC is basically betting on: currency overproduction, inflation, and cash becoming less valuable by the day.
Investing in the Nasdaq 100 is like buying into: human technological advancement, productivity growth, and the top tech companies continuously creating value.
But then I realized that the long-term rise of these two assets might be rooted in a deeper common cause:
the ongoing expansion of M2.
In other words, the total nominal money supply in society keeps growing.
Sovereign nations are printing money like there's no tomorrow, and the credit system keeps expanding, flooding the market with cash. The question is, where's all this new money gonna flow?
BTC and Nasdaq 100
I've been rethinking the relationship between BTC and the Nasdaq 100 lately.
Not too long ago, I used to think it was pretty straightforward:
Buying BTC is basically betting on: currency overproduction, inflation, and cash becoming less valuable by the day.
Investing in the Nasdaq 100 is like buying into: human technological advancement, productivity growth, and the top tech companies continuously creating value.
But then I realized that the long-term rise of these two assets might be rooted in a deeper common cause:
the ongoing expansion of M2.
In other words, the total nominal money supply in society keeps growing.
Sovereign nations are printing money like there's no tomorrow, and the credit system keeps expanding, flooding the market with cash. The question is, where's all this new money gonna flow?
Not too long ago, I used to think it was pretty straightforward:
Buying BTC is basically betting on: currency overproduction, inflation, and cash becoming less valuable by the day.
Investing in the Nasdaq 100 is like buying into: human technological advancement, productivity growth, and the top tech companies continuously creating value.
But then I realized that the long-term rise of these two assets might be rooted in a deeper common cause:
the ongoing expansion of M2.
In other words, the total nominal money supply in society keeps growing.
Sovereign nations are printing money like there's no tomorrow, and the credit system keeps expanding, flooding the market with cash. The question is, where's all this new money gonna flow?
345
·
--
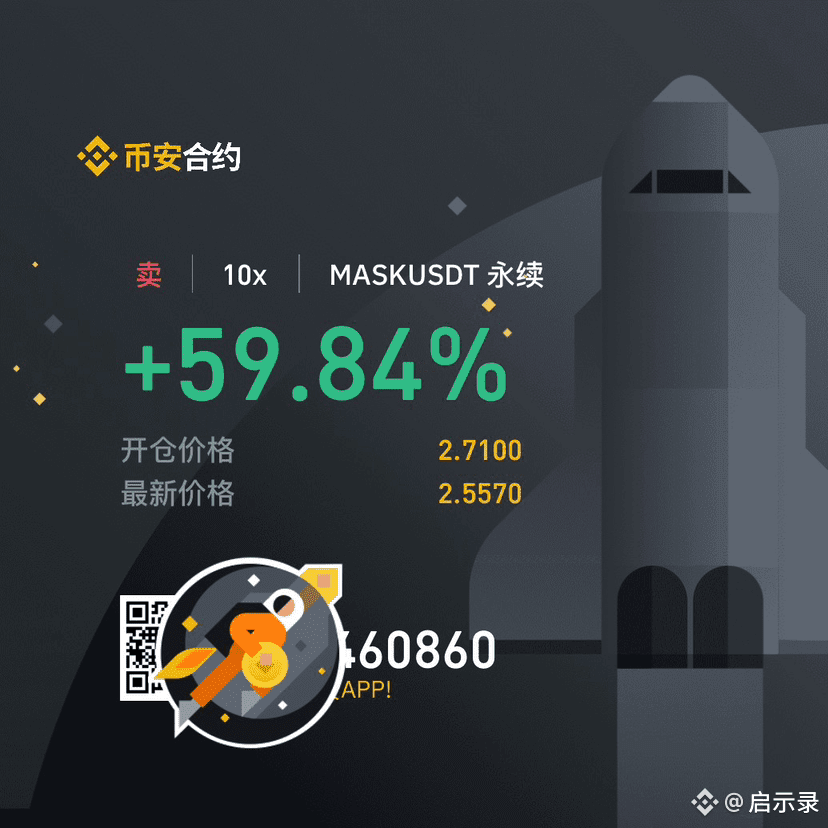
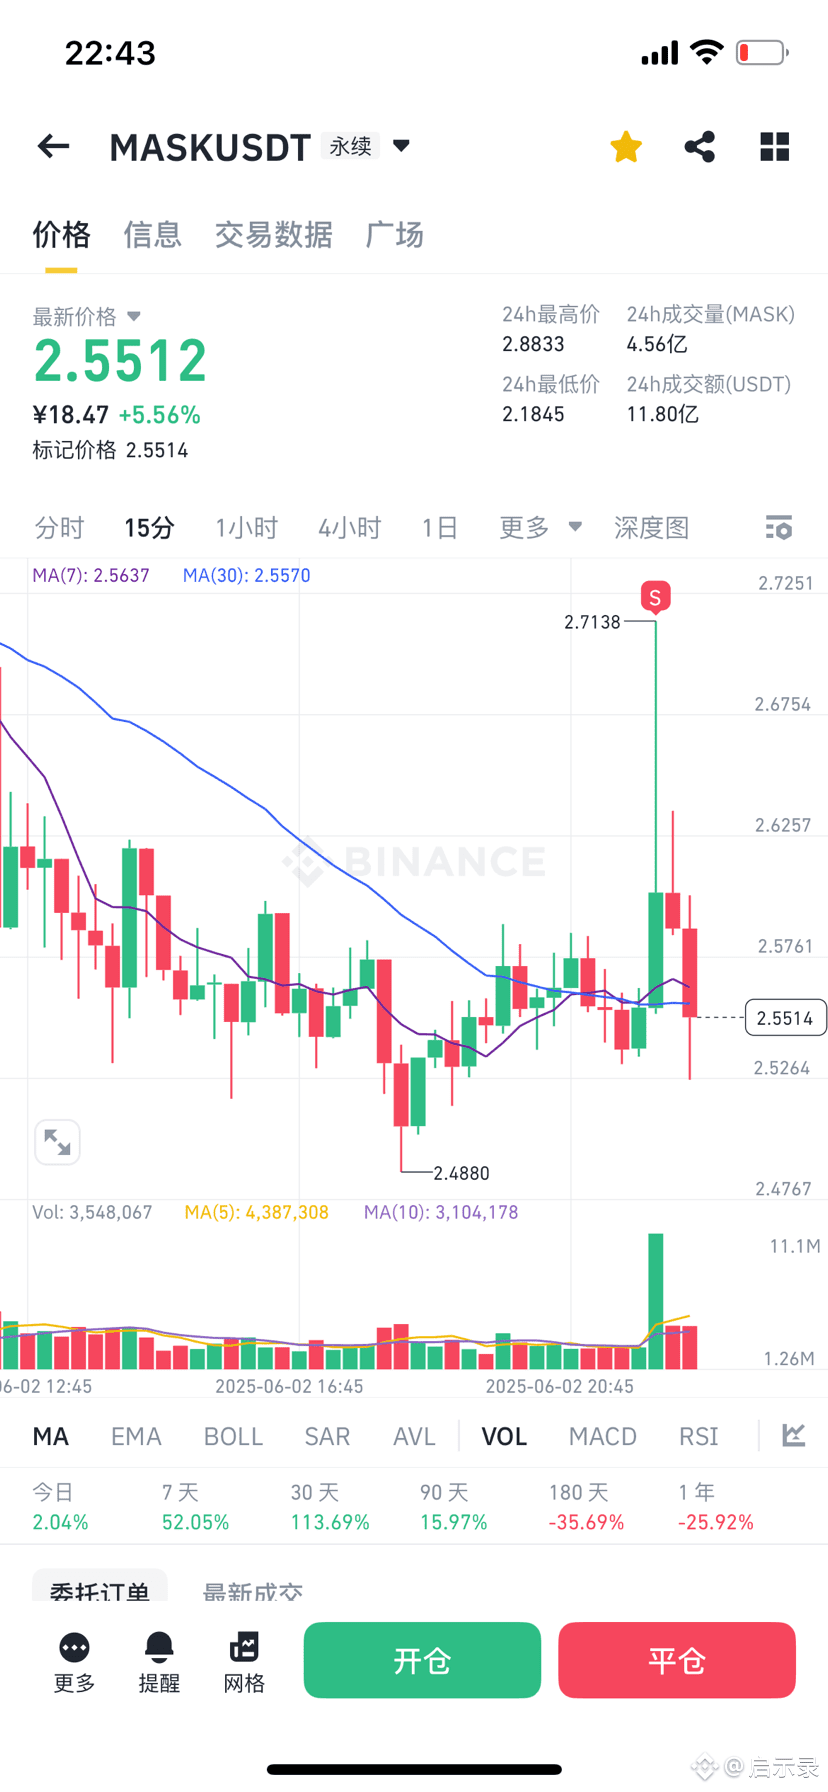
I don't know how many brothers received this rehashed news, sorry for the last-minute notice 😂!
I don't know how many brothers received this rehashed news, sorry for the last-minute notice 😂!
2.2k
·
--
🔥🔥Why are altcoins so weak in this market?🔥🔥
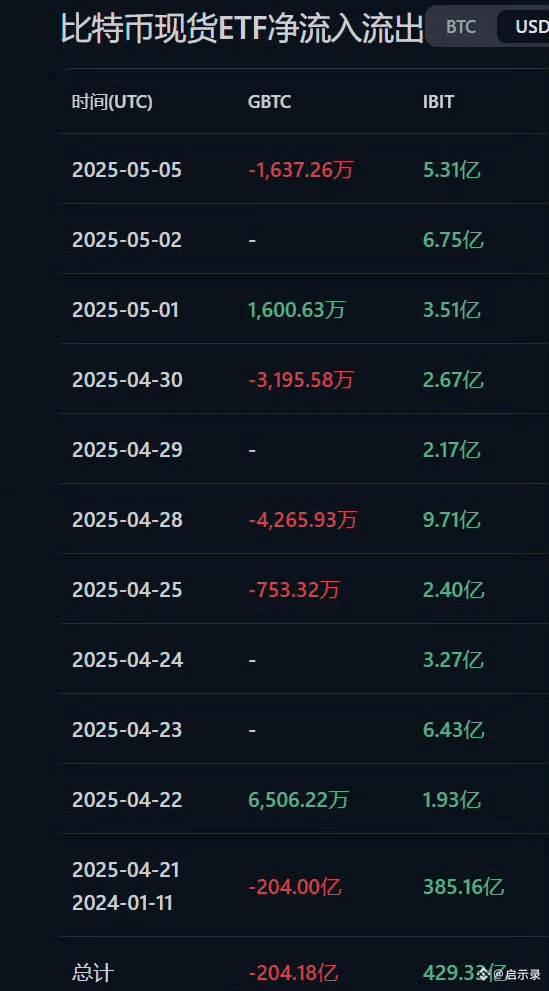
BlackRock is crazily outputting, the reserves on exchanges are continuously decreasing, all flowing into Nasdaq, so exchanges can no longer trigger a full altcoin season through BTC exchange rate after a pump in Bitcoin like before.
🔥🔥Why are altcoins so weak in this market?🔥🔥
BlackRock is crazily outputting, the reserves on exchanges are continuously decreasing, all flowing into Nasdaq, so exchanges can no longer trigger a full altcoin season through BTC exchange rate after a pump in Bitcoin like before.
BlackRock is crazily outputting, the reserves on exchanges are continuously decreasing, all flowing into Nasdaq, so exchanges can no longer trigger a full altcoin season through BTC exchange rate after a pump in Bitcoin like before.
1.6k
·
--
$SUI 3.5 and 3.8 can respectively build positions and then short again
$SUI 3.5 and 3.8 can respectively build positions and then short again
1
326
·
--
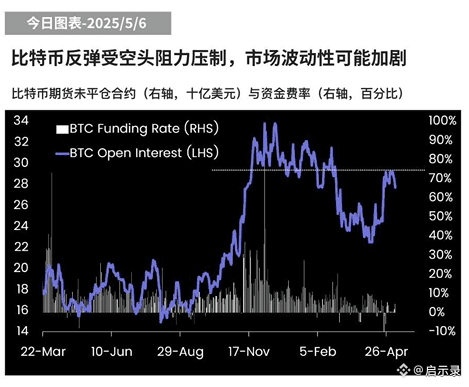
The price of Bitcoin has accumulated an increase of nearly 25%, with the size of open contracts rising from 22 billion dollars to 29 billion dollars, but the funding rate remains close to zero. This reflects that, despite the price increase, some futures traders still choose to establish short positions rather than chase the rise.
This rare market structure may indicate that the market is about to experience greater volatility: if the price continues to rise, shorts may be forced to close their positions, accelerating the upward trend; if the price corrects, it may reinforce the current short position layout. Regardless of how the trend evolves, the current market structure points to an intensification of future volatility.
The price of Bitcoin has accumulated an increase of nearly 25%, with the size of open contracts rising from 22 billion dollars to 29 billion dollars, but the funding rate remains close to zero. This reflects that, despite the price increase, some futures traders still choose to establish short positions rather than chase the rise.
This rare market structure may indicate that the market is about to experience greater volatility: if the price continues to rise, shorts may be forced to close their positions, accelerating the upward trend; if the price corrects, it may reinforce the current short position layout. Regardless of how the trend evolves, the current market structure points to an intensification of future volatility.
This rare market structure may indicate that the market is about to experience greater volatility: if the price continues to rise, shorts may be forced to close their positions, accelerating the upward trend; if the price corrects, it may reinforce the current short position layout. Regardless of how the trend evolves, the current market structure points to an intensification of future volatility.
198
·
--
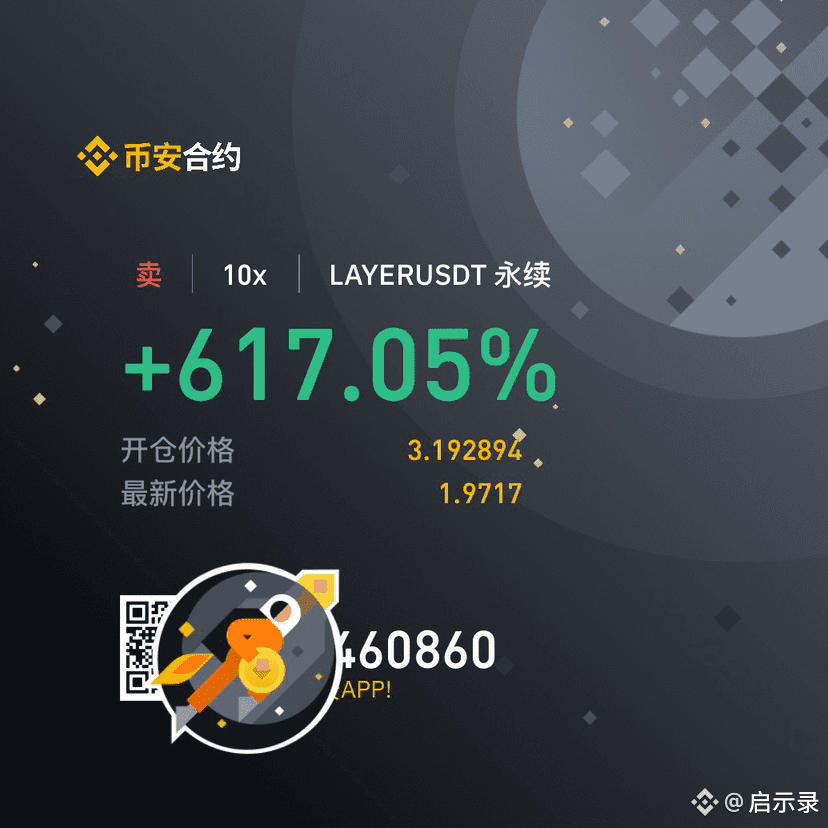
Attention everyone, the second winning point has been reached, please get off the vehicle.
Attention everyone, the second winning point has been reached, please get off the vehicle.
373
·
--
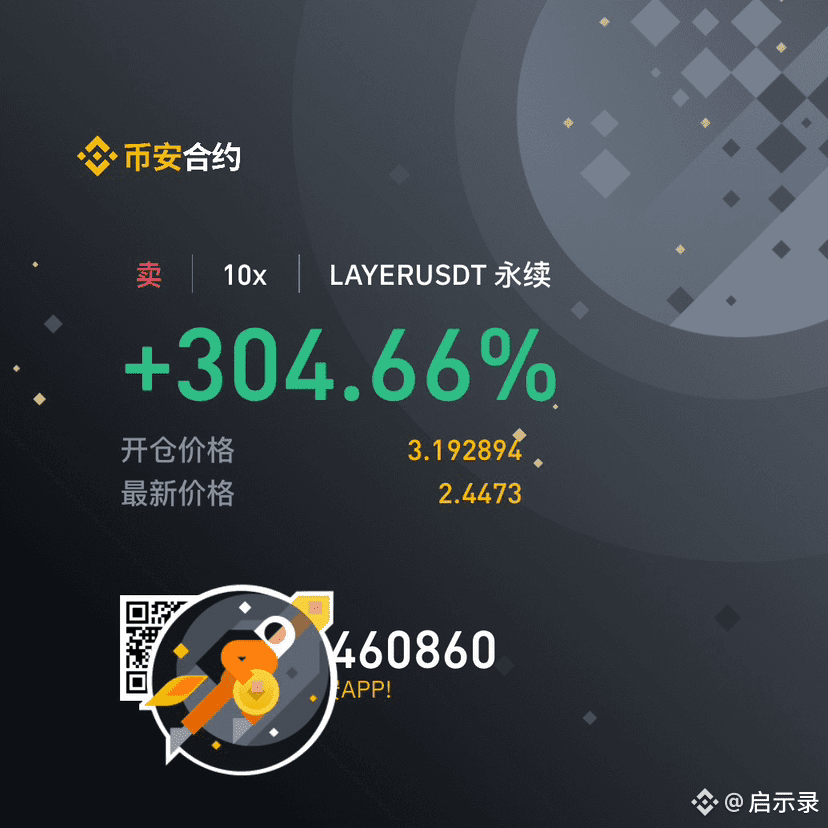
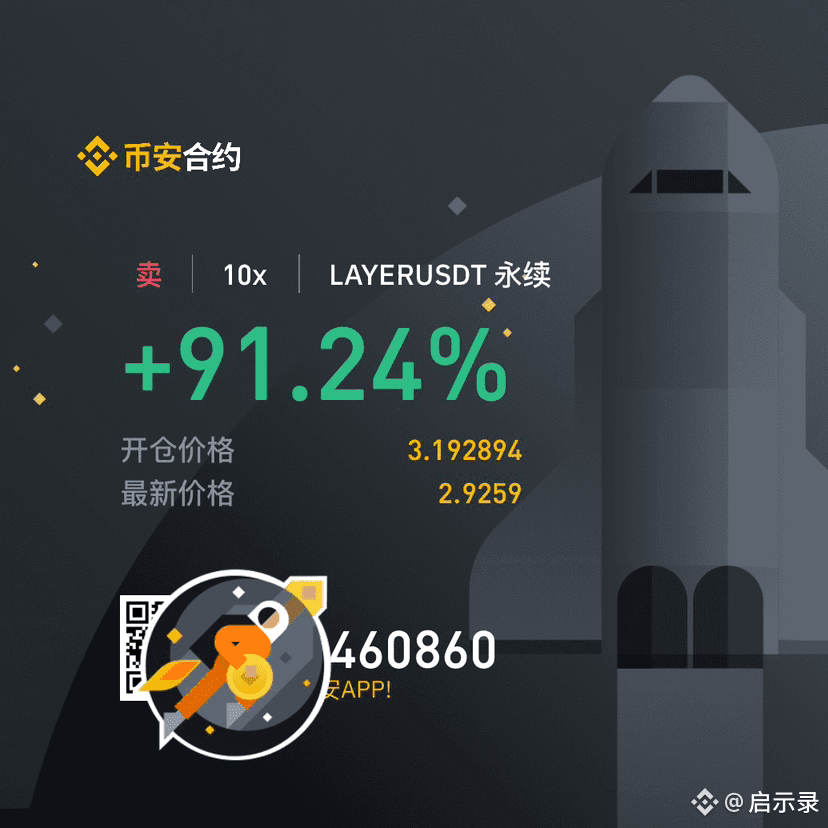
The first take profit point has been reached. Everyone can close 50% of their position or close at break-even and leave the profits to run for a while longer!
The first take profit point has been reached. Everyone can close 50% of their position or close at break-even and leave the profits to run for a while longer!
313
·
--
Brothers who have already boarded can continue to hold their positions!
Brothers who have already boarded can continue to hold their positions!
5
2
2
25.8k
·
--
I don't expect a third term, but if you insist on me being crowned, there's nothing I can do. You have really put me in a tough spot 😂
I don't expect a third term, but if you insist on me being crowned, there's nothing I can do. You have really put me in a tough spot 😂


7
3
6
33.6k

·
--
If Bitcoin ( $BTC ) is to break through $100,000 again, it still needs to clear a considerable amount of supply pressure. Cost basis distribution data shows a particularly dense cluster at around $97,000, where investors hold about 392,000 bitcoins. Some investors may sell at breakeven, making this area a key resistance level.
If Bitcoin ( $BTC ) is to break through $100,000 again, it still needs to clear a considerable amount of supply pressure. Cost basis distribution data shows a particularly dense cluster at around $97,000, where investors hold about 392,000 bitcoins. Some investors may sell at breakeven, making this area a key resistance level.
1.4k
·
--
1
658
·
--
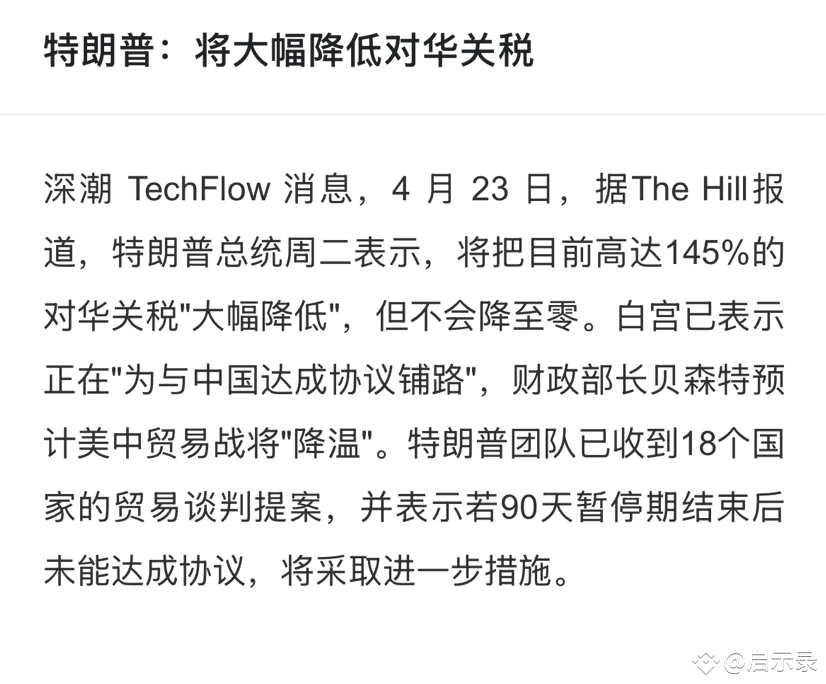
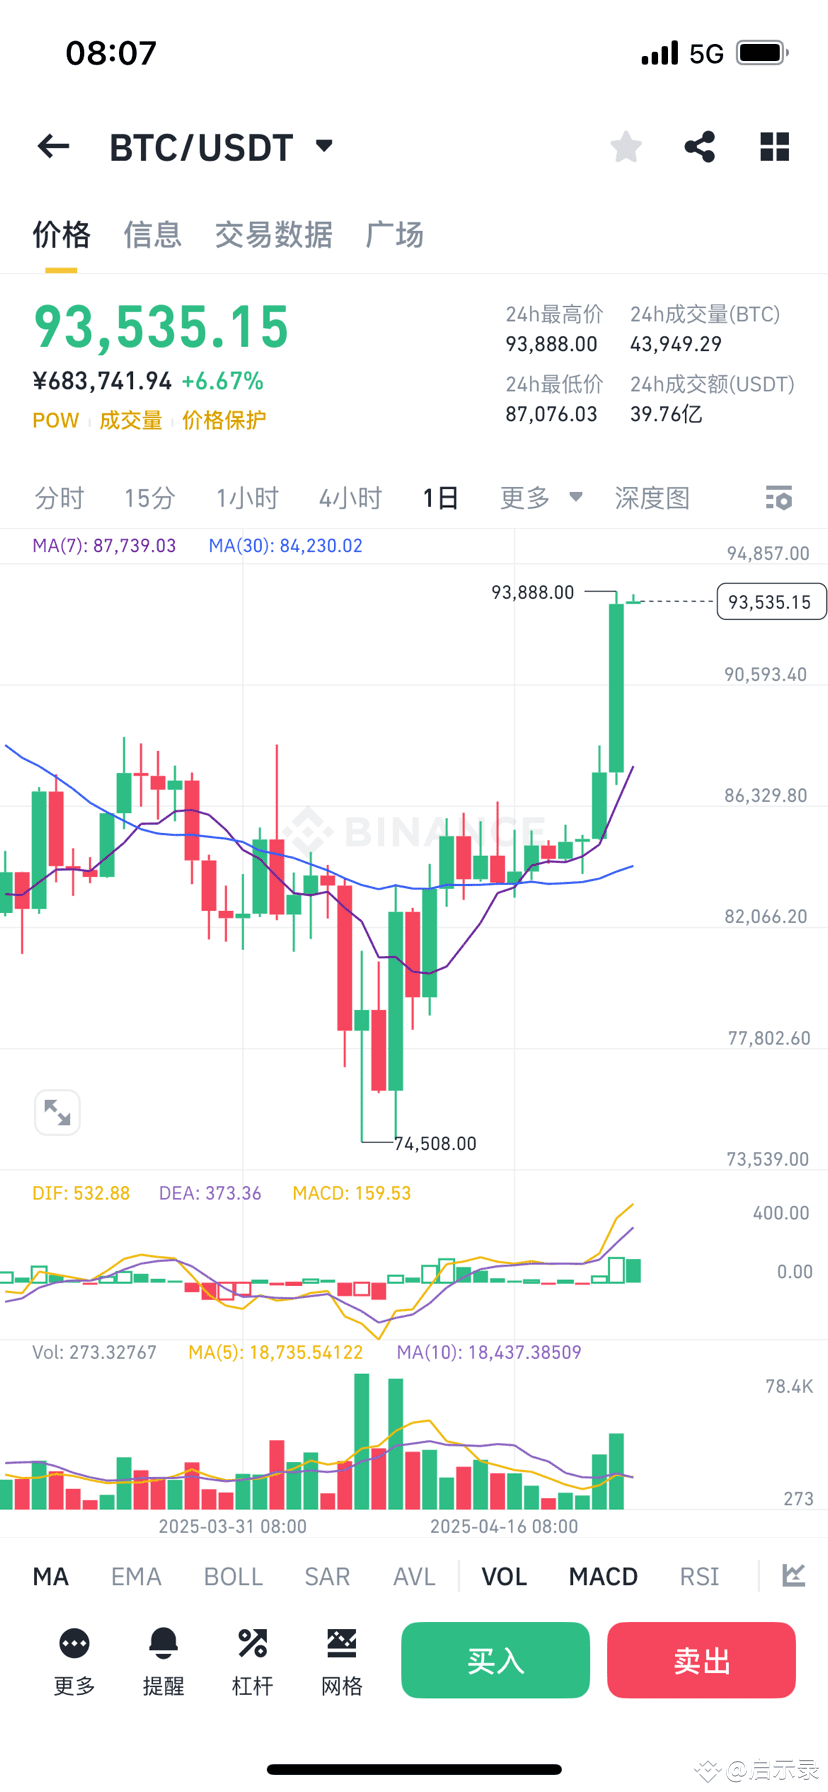
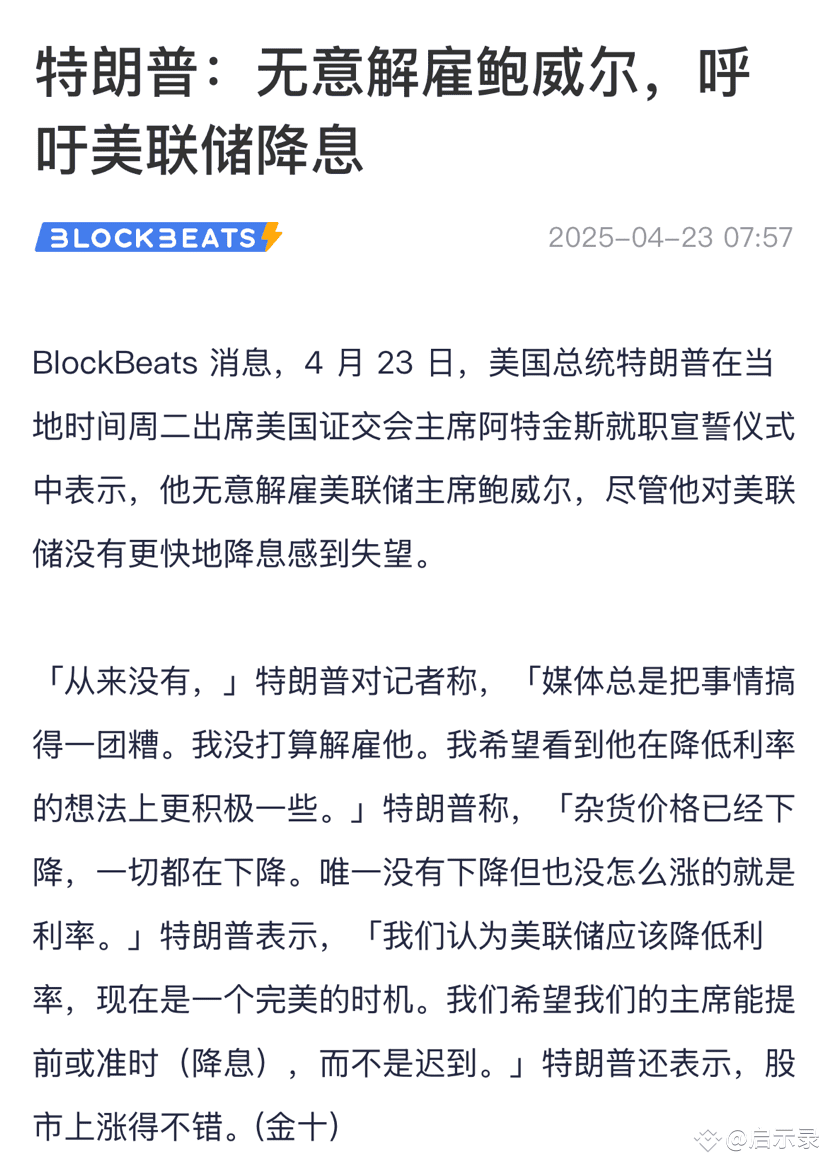
Last night's wave of good news. Chuanzi can't hold on anymore!
Last night's wave of good news. Chuanzi can't hold on anymore!
1
556
·
--
Dong Ge is going to start trading cryptocurrencies in addition to delivering food 😂
Dong Ge is going to start trading cryptocurrencies in addition to delivering food 😂

26
12
31
128.5k
·
--
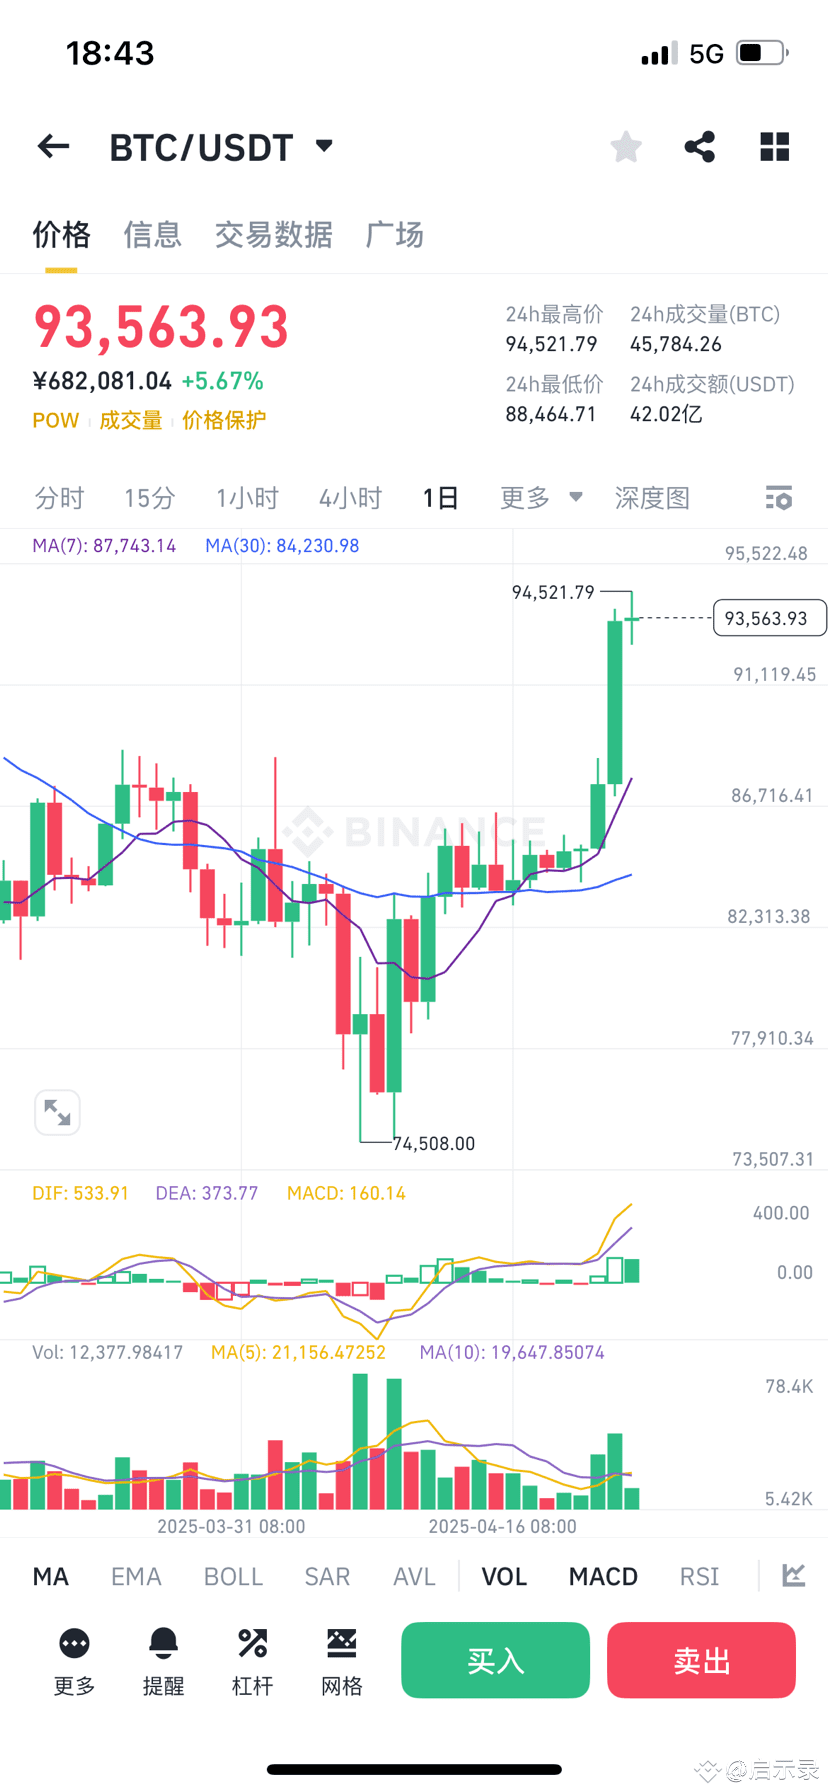
Bitcoin's recent range oscillation turned bullish on Monday morning, with the focus shifting to the $90,000-$92,000 range, which was previously a strong support area.
Bitcoin broke through $87,000 today, decisively escaping the consolidation between $83,000-$86,000 over the past week. Bulls have shown renewed willingness to lead price movements, indicating that the recovery from the April 7 low of below $75,000 has restarted. This also means that prices may continue to rise to the $90,000-$92,000 range, which served as bottom support from last December to early February, preventing prices from falling. This support area was ultimately broken at the end of February, triggering a rapid decline below $75,000.
Previously, the bearish trend line from the historical high on the daily chart has been broken and rendered ineffective. BTC also broke above the price high of the 30-day Exponential Moving Average (EMA), indicating a shift in momentum to bullish. Therefore, the focus is on the $90,000-$92,000 range, which was the support area earlier this year.
Investors watching moving averages should note that the 200-day Simple Moving Average (SMA) is currently at $88,245. If the price falls back to $85,000 before the end of the day (UTC time), the bullish outlook will face a risk of failure.
Bitcoin's recent range oscillation turned bullish on Monday morning, with the focus shifting to the $90,000-$92,000 range, which was previously a strong support area.
Bitcoin broke through $87,000 today, decisively escaping the consolidation between $83,000-$86,000 over the past week. Bulls have shown renewed willingness to lead price movements, indicating that the recovery from the April 7 low of below $75,000 has restarted. This also means that prices may continue to rise to the $90,000-$92,000 range, which served as bottom support from last December to early February, preventing prices from falling. This support area was ultimately broken at the end of February, triggering a rapid decline below $75,000.
Previously, the bearish trend line from the historical high on the daily chart has been broken and rendered ineffective. BTC also broke above the price high of the 30-day Exponential Moving Average (EMA), indicating a shift in momentum to bullish. Therefore, the focus is on the $90,000-$92,000 range, which was the support area earlier this year.
Investors watching moving averages should note that the 200-day Simple Moving Average (SMA) is currently at $88,245. If the price falls back to $85,000 before the end of the day (UTC time), the bullish outlook will face a risk of failure.
Bitcoin broke through $87,000 today, decisively escaping the consolidation between $83,000-$86,000 over the past week. Bulls have shown renewed willingness to lead price movements, indicating that the recovery from the April 7 low of below $75,000 has restarted. This also means that prices may continue to rise to the $90,000-$92,000 range, which served as bottom support from last December to early February, preventing prices from falling. This support area was ultimately broken at the end of February, triggering a rapid decline below $75,000.
Previously, the bearish trend line from the historical high on the daily chart has been broken and rendered ineffective. BTC also broke above the price high of the 30-day Exponential Moving Average (EMA), indicating a shift in momentum to bullish. Therefore, the focus is on the $90,000-$92,000 range, which was the support area earlier this year.
Investors watching moving averages should note that the 200-day Simple Moving Average (SMA) is currently at $88,245. If the price falls back to $85,000 before the end of the day (UTC time), the bullish outlook will face a risk of failure.
1
258
·
--
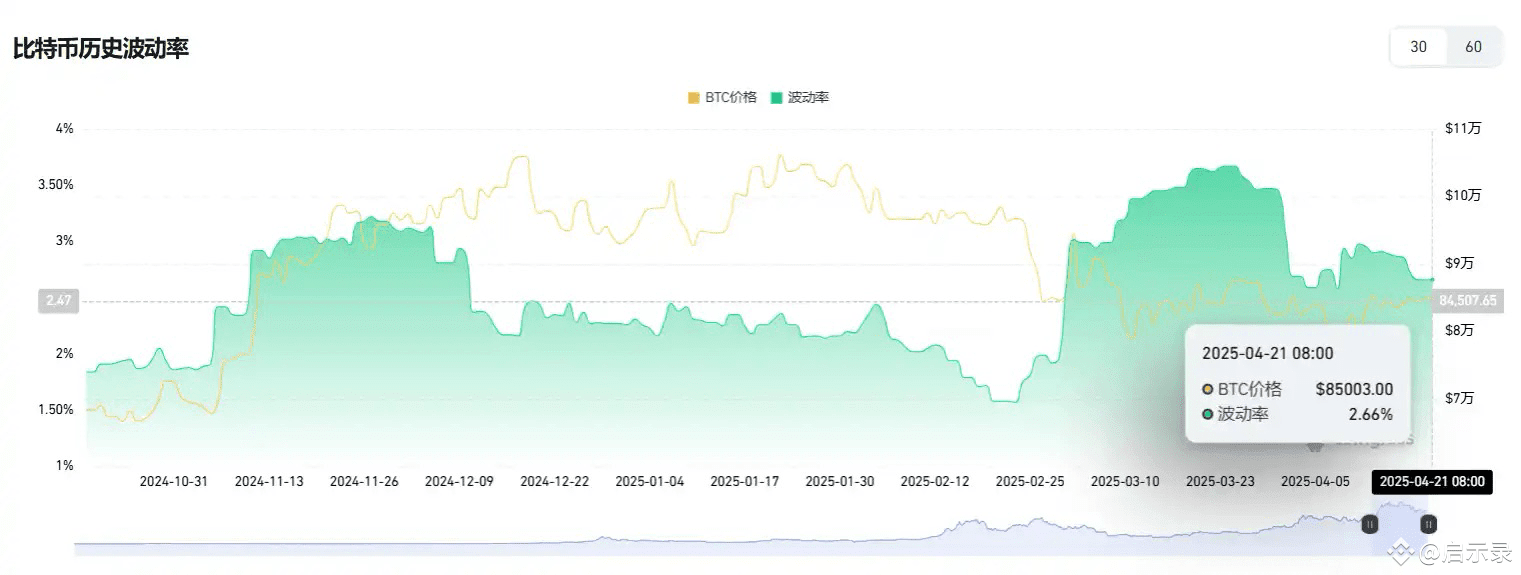
According to Coinglass data, Bitcoin volatility has dropped to 2.66%, after declining for eight consecutive days.
High Bitcoin volatility is usually associated with speculative trading and retail FOMO sentiment. When volatility decreases, it may indicate a reduction in short-term speculators, leading the market into a consolidation phase or a 'cooling period'. Additionally, Bitcoin price fluctuations are often linked to macroeconomic events, such as inflation expectations, interest rate changes, or geopolitical risks. When these external factors stabilize, Bitcoin's volatility may also decrease.
According to Coinglass data, Bitcoin volatility has dropped to 2.66%, after declining for eight consecutive days.
High Bitcoin volatility is usually associated with speculative trading and retail FOMO sentiment. When volatility decreases, it may indicate a reduction in short-term speculators, leading the market into a consolidation phase or a 'cooling period'. Additionally, Bitcoin price fluctuations are often linked to macroeconomic events, such as inflation expectations, interest rate changes, or geopolitical risks. When these external factors stabilize, Bitcoin's volatility may also decrease.
High Bitcoin volatility is usually associated with speculative trading and retail FOMO sentiment. When volatility decreases, it may indicate a reduction in short-term speculators, leading the market into a consolidation phase or a 'cooling period'. Additionally, Bitcoin price fluctuations are often linked to macroeconomic events, such as inflation expectations, interest rate changes, or geopolitical risks. When these external factors stabilize, Bitcoin's volatility may also decrease.
181
·
--
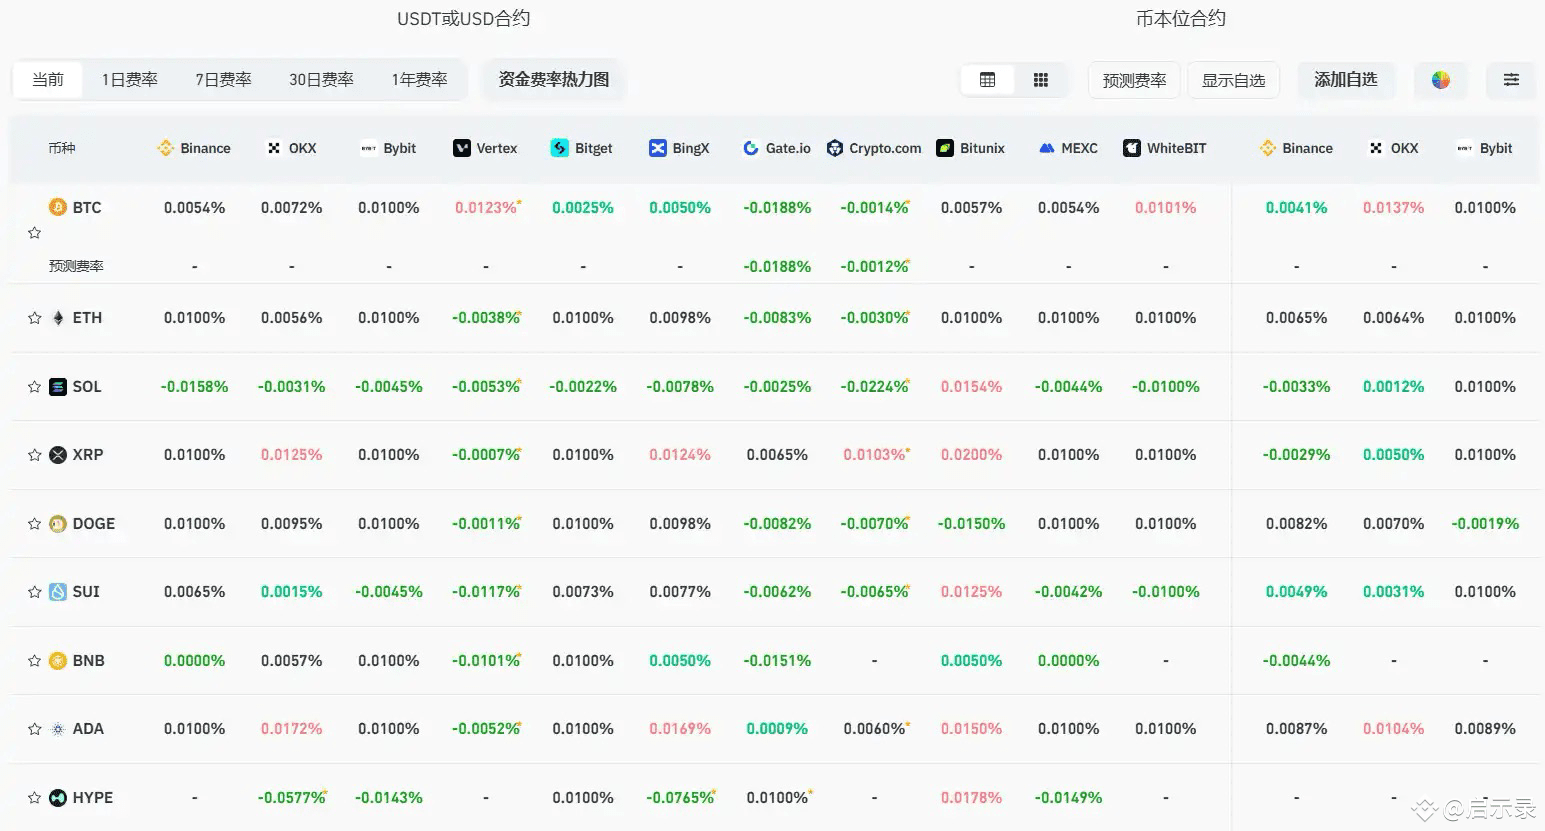
Current mainstream CEX and DEX funding rates are warming up, and the market is returning to rationality. The specific funding rates for mainstream cryptocurrencies are shown in the attached image.
Funding rates are the rates set by cryptocurrency trading platforms to maintain the balance between contract prices and the prices of underlying assets, usually applicable to perpetual contracts. It is a mechanism for capital exchange between long and short traders, and trading platforms do not charge this fee; instead, it is used to adjust the cost or return of the contracts held by traders to keep the contract prices close to the prices of the underlying assets.
When the funding rate is 0.01%, it represents the benchmark rate. When the funding rate is greater than 0.01%, it indicates a generally bullish market. When the funding rate is less than 0.005%, it indicates a generally bearish market.
Current mainstream CEX and DEX funding rates are warming up, and the market is returning to rationality. The specific funding rates for mainstream cryptocurrencies are shown in the attached image.
Funding rates are the rates set by cryptocurrency trading platforms to maintain the balance between contract prices and the prices of underlying assets, usually applicable to perpetual contracts. It is a mechanism for capital exchange between long and short traders, and trading platforms do not charge this fee; instead, it is used to adjust the cost or return of the contracts held by traders to keep the contract prices close to the prices of the underlying assets.
When the funding rate is 0.01%, it represents the benchmark rate. When the funding rate is greater than 0.01%, it indicates a generally bullish market. When the funding rate is less than 0.005%, it indicates a generally bearish market.
Funding rates are the rates set by cryptocurrency trading platforms to maintain the balance between contract prices and the prices of underlying assets, usually applicable to perpetual contracts. It is a mechanism for capital exchange between long and short traders, and trading platforms do not charge this fee; instead, it is used to adjust the cost or return of the contracts held by traders to keep the contract prices close to the prices of the underlying assets.
When the funding rate is 0.01%, it represents the benchmark rate. When the funding rate is greater than 0.01%, it indicates a generally bullish market. When the funding rate is less than 0.005%, it indicates a generally bearish market.
534
·
--
Trump plots to remove Old Bao, if successful, it will be a financial earthquake.
Trump plots to remove Old Bao, if successful, it will be a financial earthquake.

4
2
4
24.8k
Log in to explore more content
Join global crypto users on Binance Square
⚡️ Get latest and useful information about crypto.
💬 Trusted by the world’s largest crypto exchange.
👍 Discover real insights from verified creators.
Email / Phone number
Trending Topics
BitcoinReboundsTo$79K
18,860 views
158 Discussing
🚨 $BTC is pushing higher.
Bitcoin is trading around $78,804, up roughly 1.9%, after reclaiming the $78K area. The next level to watch is the intraday high near $78,905.
A clean break above that level could open the way toward $79K–$80K. If BTC gets rejected, support sits around $78,300, then $77,975.
Bulls have momentum, but BTC needs to hold above $78K.
#Bitcoin #BTC #CryptoTrading #CryptoMarket #CryptoAnalysis
PulseON
·17 Likes
·16.6k views
BitcoinSpotETFsNetInflow$160M
0 views
18 Discussing
SouthKoreaCryptoTaxDelayPetitionTops50000
6,240 views
181 Discussing